July 24, 2012
Oyster Dissection
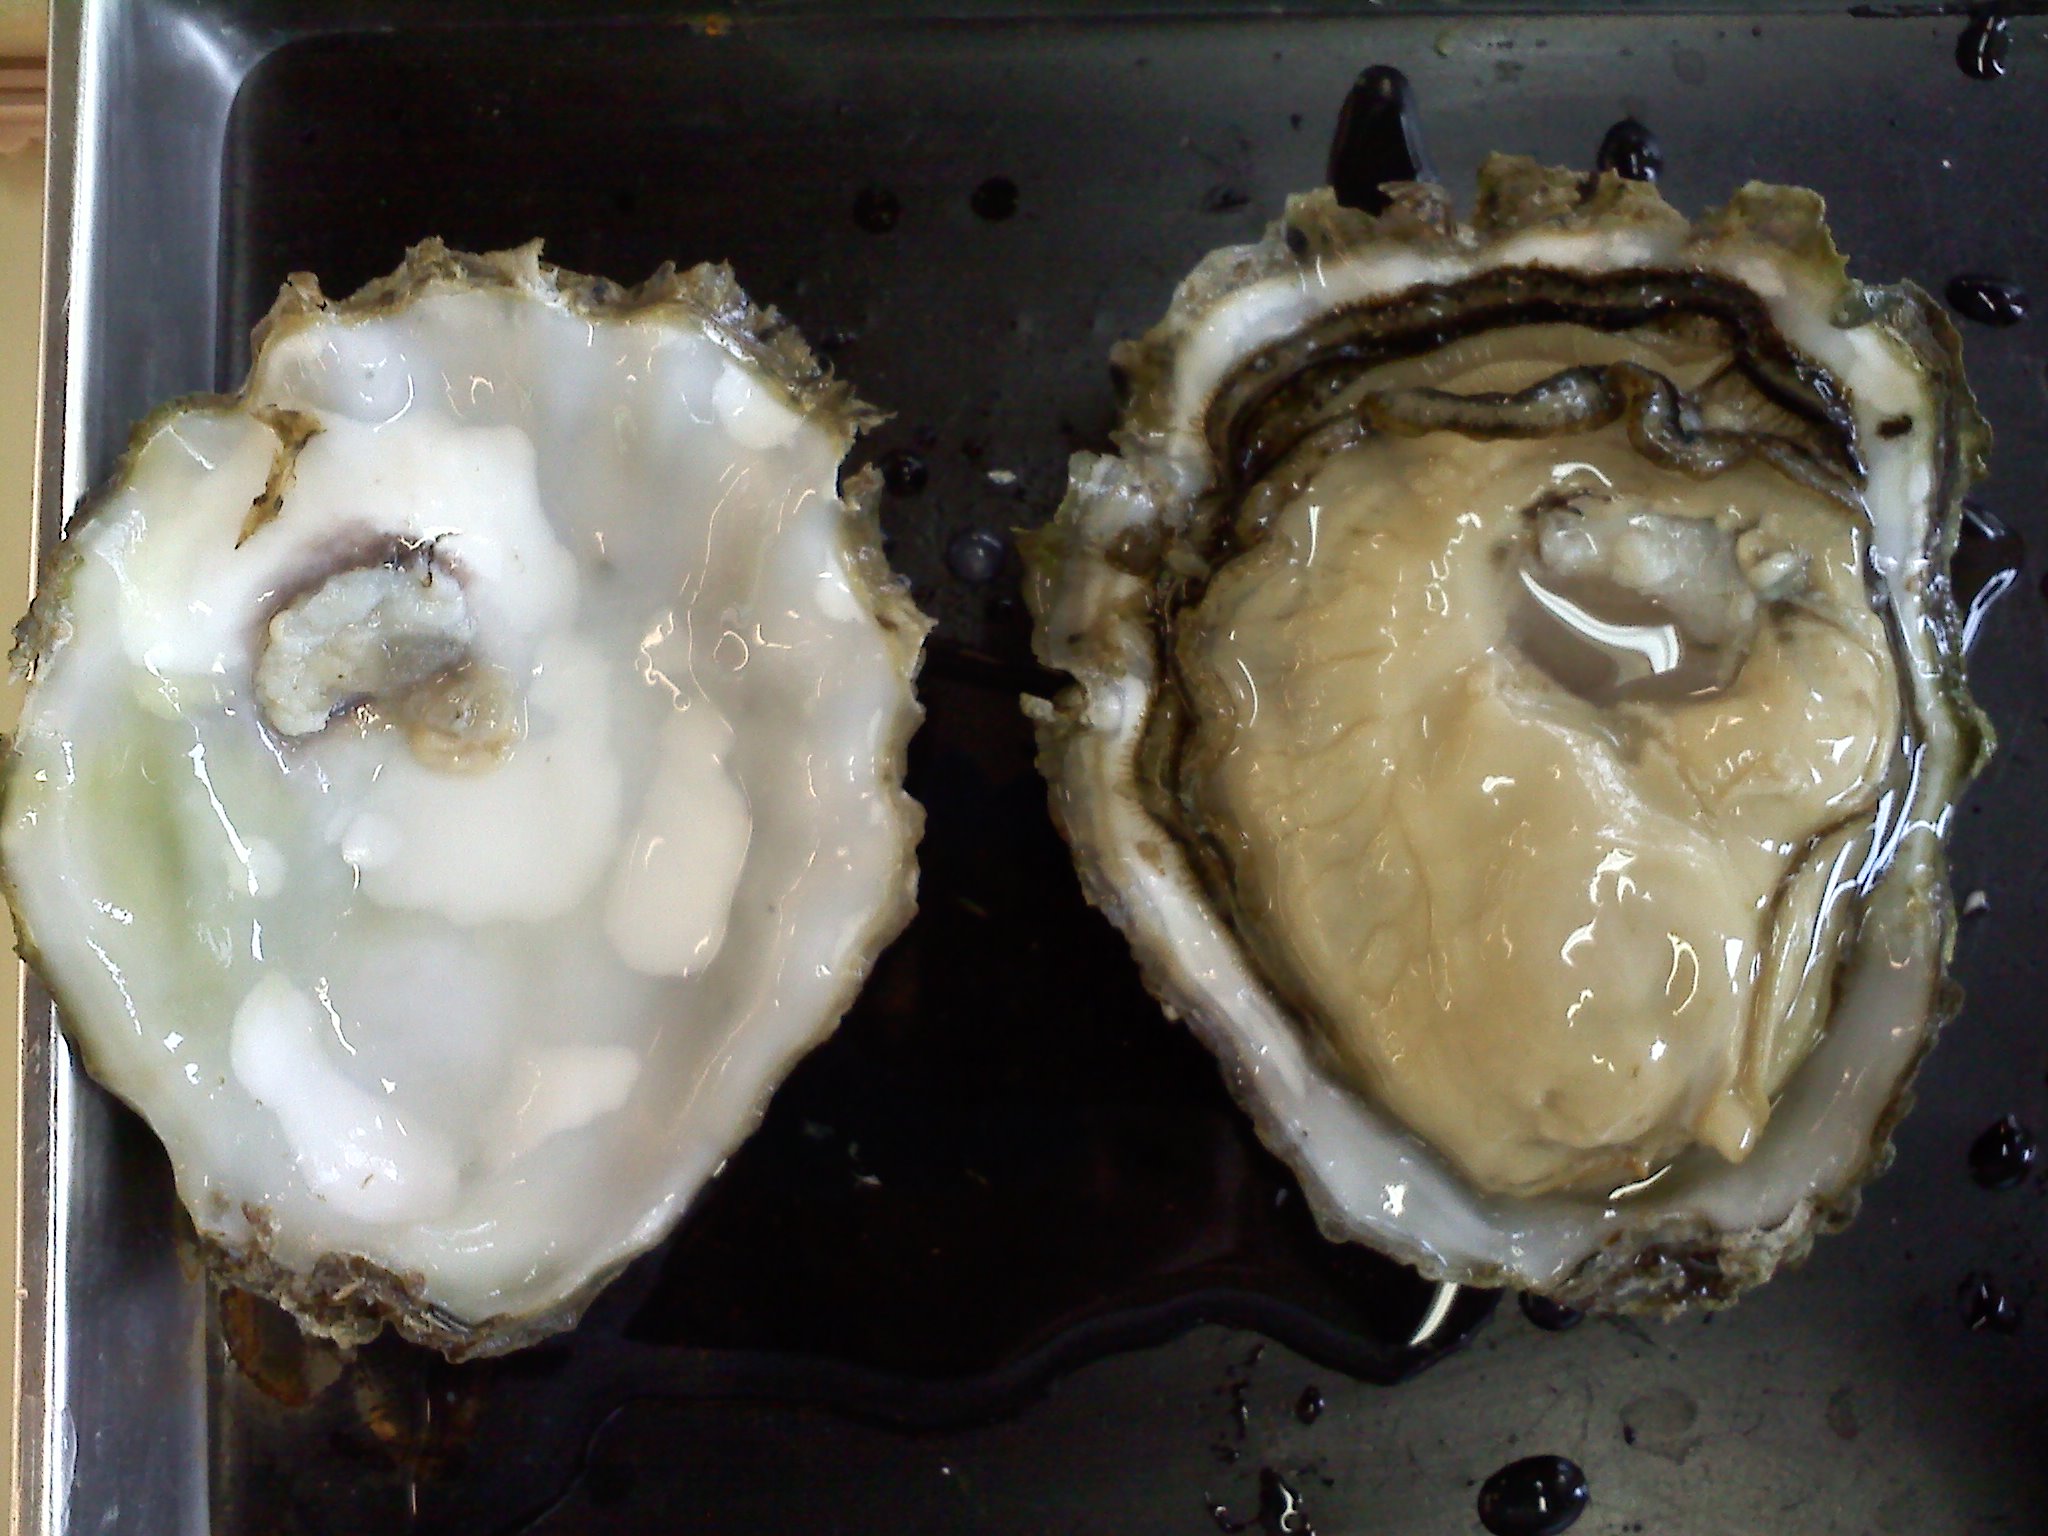
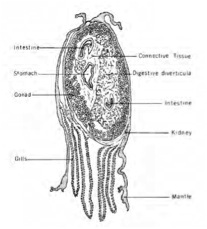
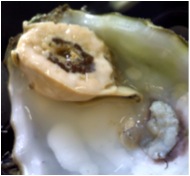
In our cross section it was difficult to find the intestine. However, our oyster was full of gonads and we were able to look at the sperm under a microscope.
Seastar Dissection
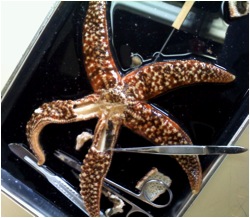
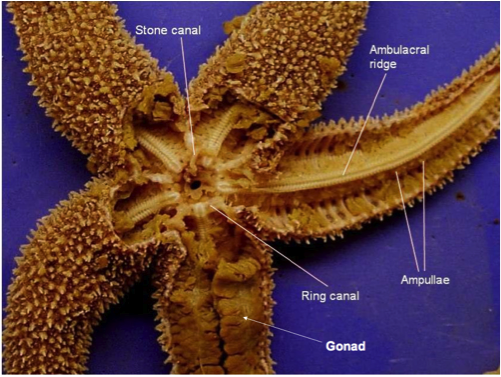
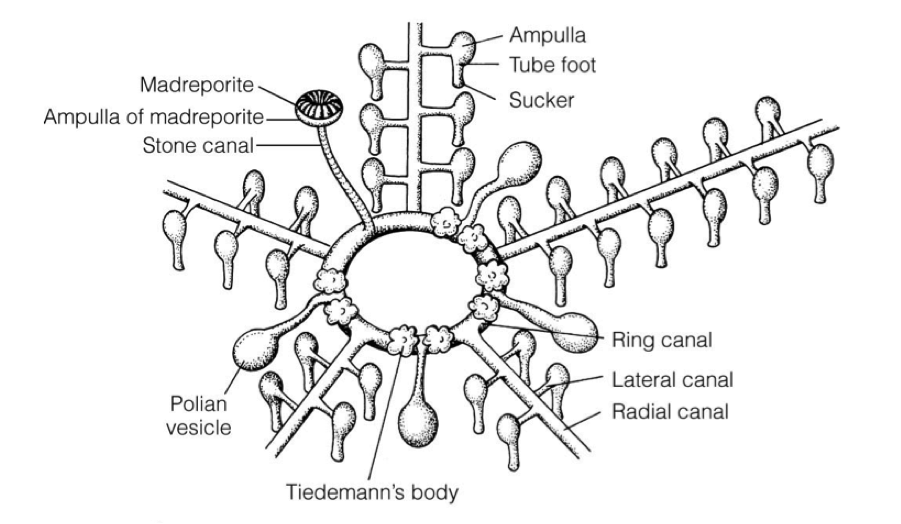
Seastar dissection is really difficult. We could barely get through to the ring canal. The Tiedemann’s body is an interesting part of the seastar anatomy since it’s function remains unknown. Some seastars from the biomechanics class are said to possibly be suffering from a form of Wasting’s disease.
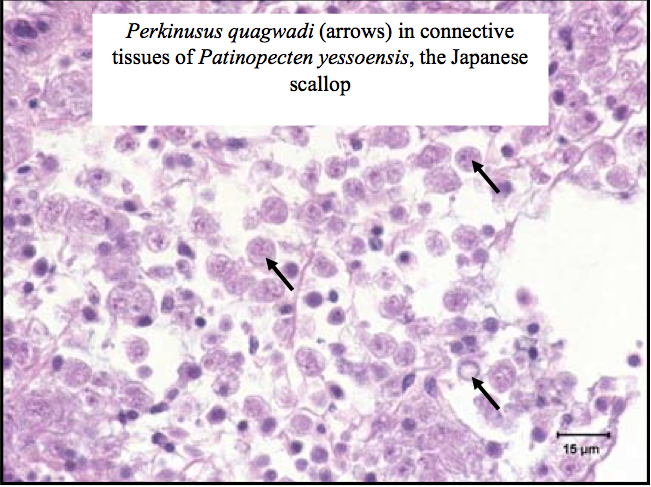
Histology is the study of tissue morphology and it is considered the “gold standard” for health examinations. Today we examined old histology slides of Abalone with Withering Syndrome, and Perkinsus quagwadi in Japanese scallops.
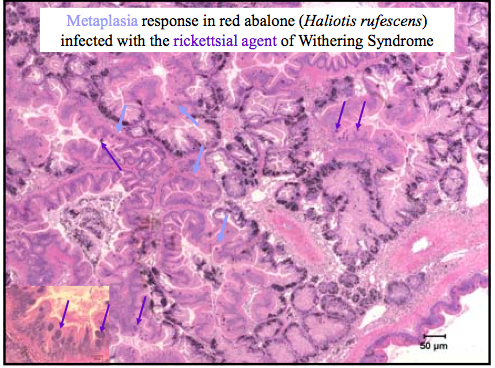
Metaplasia refers to the progression of the change of one cell type to another mature cell type. Rickettsial agents are gram-negative bacteria that enter, grow and reproduce in the cytoplasm of host cells. They are closely related to chlamydia-like organisms.
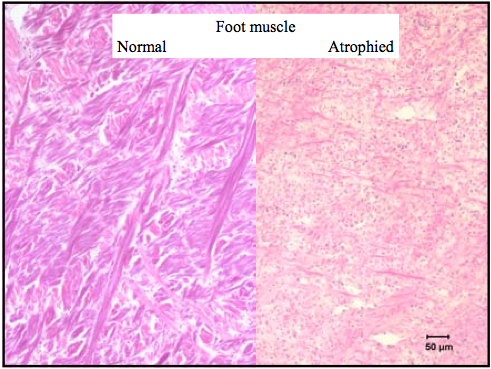
The atrophied foot muscle of an abalone refers to the nearly complete wasting of the tissue.
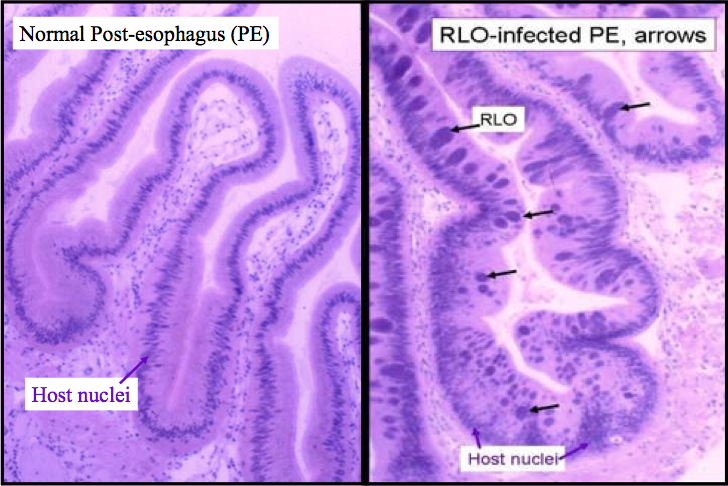
The slide above is stained with Harris’s hematoxylin and eosin (H & E), showing a healthy digestive gland next to a digestive gland with RLO infection. This can be scored in the following way:
0=abscent
1 = 1-10 inclusions
2 = 11-100 inclusions
3 = > 100
In the histology slide to the left we can see a grouping of daughter cells inside infected cells; they tend to stain darker, and on higher magnification it is easy to see the replicates of daughter cells.
July 25, 2012
Gross Examination and Dissection of Armina californica (sea slug) with Rickettsia-like Infections; Case Study 1
Accession No.: 12-1-4a
12-1-4b
Total Length: 36.7 mm
Total weight: 3.2 g
General Observations: Approximately 7 lesions (almost whole/circular tissue loss on dorsal layer), possible inflammation on the sides of the body
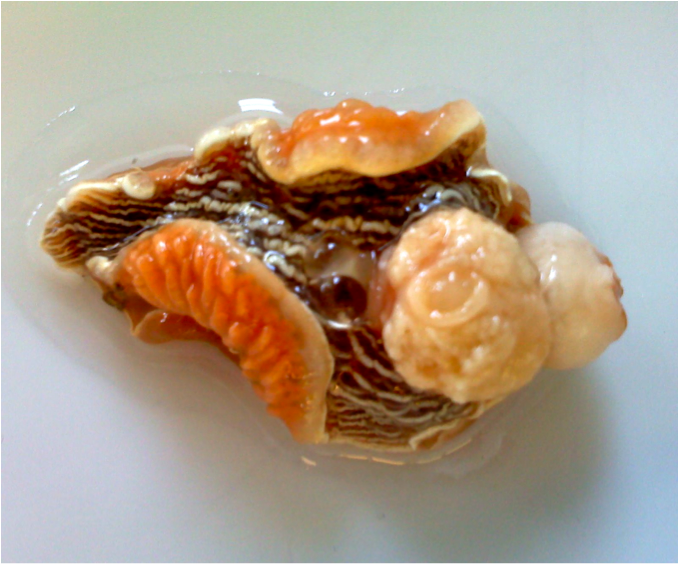
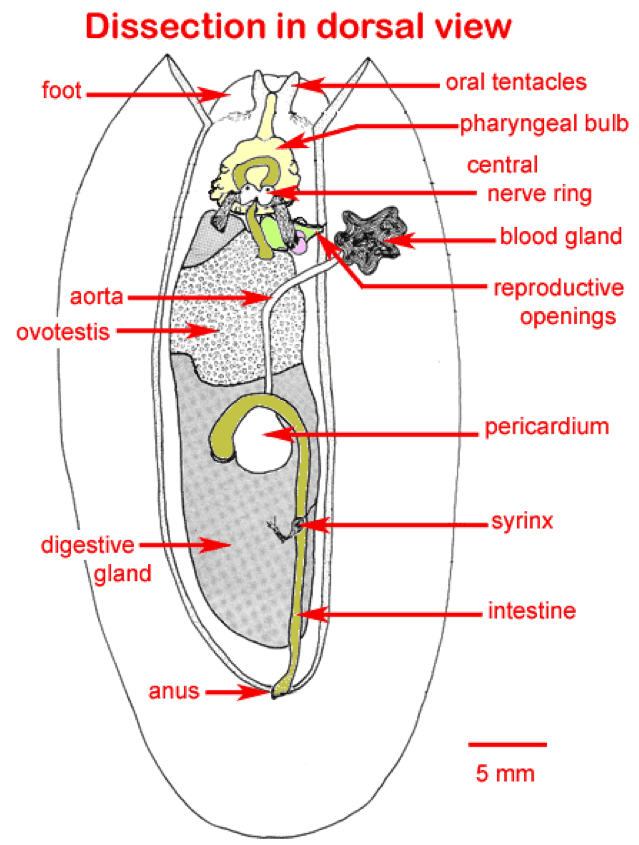 This specimen was first operated on by another lab to study their brain and possible use of magnetic fields for navigation (that is why there is bulbous tissue popping out before we began dissection).
The digestive gland is typically used for histology. To dissect the digestive gland of a sea slug we had to cut a horizontal slice about 1/4 inch below the surgical opening. You do not need to be too gentle when doing this. Once the incision was completed the bright orange digestive glad popped out and we divided the gland into two parts, to do a paired analysis using histology and PCR. The portion designated for histology was stored in a plate and sent off to be sectioned, whereas the portion designated for PCR was immediately stored in Ethanol for 24 hours (preparation for DNA extraction). Carolyn Friedman noticed gonads all over our digestive glad and = advised us to use this separate portion for comparison.
July 26, 2012
DNA Extraction
(Qiagen Stool Kit) *Pellet refers to the sample at different stages
- Pre-label all the microcentrifuge tubes you will need for this procedure. You will throw away most tubes used, so you need to only minimally label these tubes. You will need a final 1.5 mL microcentrifuge tube, please label this with the following information: your sample accession #, your initials, and the date. Please put the sample # on both the top and the side of the tube. Remember to always run a BLANK extraction as a negative control.
- Remove tissue from ethanol using good sterile technique and cut off a small piece of tissue approximately the size of ½ of a pencil eraser. Weigh the tissue and record in your notebook. Mince the tissue into small pieces and place them into a 2 mL microcentrifuge tube. Take care not to cross-contaminate samples.
- Add 1.4 mL Buffer ASL (lysis) to each sample. Do this by adding 700 µl of Buffer ASL, vortexing for a minute and then adding another 700 µl of Buffer ASL. Once all ASL has been added, vortex continuously for 1 min or until the sample is thoroughly homogenized. Please note: It is important to vortex the samples thoroughly as it will insure maximum DNA concentration.
- Heat for 5 min at 70º C.
- Vortex for 15 s and centrifuge sample at full speed for 1 min to pellet tissue particles.
- Pipet 1.2 mL of the supernatant (solution) into a new 2 mL microcentrifuge tube and discard the pellet.
- Add 1 InhibitEX tablet to each sample and vortex immediately and continuously for 1 min or until the tablet is completely dissolved. Incubate for 1 min at room temperature to allow inhibitors to absorb the InhibitEx matrix.
- Centrifuge sample at full speed for 3 min to pellet inhibitors bound to InhibitEX.
- Pipet all the supernatant into a new 1.5 mL microcentrifuge tube and discard the pellet. Centrifuge the sample at full speed for 3 min. *in this step, the transfer of small quantities of pelleted material will not affect the procedure*
- Pipet 15 ul Proteinase K (lysis) into a new 1.5 mL microcentrifuge tube.
- Pipet 200 ul supernatant from step 9 into the 1.5 mL microcentrifuge tube containing Proteinase K.
- Add 200 µl Buffer AL (buffer AL stabilizes solution) and vortex for 15s. *DO NOT ADD Proteinase K directly to Buffer AL* It is essential that the sample and Buffer AL are thoroughly mixed to form a homogenous solution.
- Incubate at 70 ºC for 10 min.
- Remove your samples from the incubator and briefly centrifuge. Add 200 µl of 95% molecular grade ethanol to the sample and vortex for 15 seconds. Briefly centrifuge the tubes. (This step is just to get any water off the lid)
- Carefully apply this mixture to a QIAamp spin column (QIAamp spin column has a filter). If a white precipitate has formed, make sure to add this to the column. Do not wet the rim of the spin column (this can allow cross-contamination of samples in the centrifuge). Centrifuge at 8000 rpm for 1 minute (to filter).
- Place the QIAamp spin column in a clean 2 mL collection tube.
- Carefully open the QIAamp spin column and add 500 µl of buffer AW1 without wetting the rim. Centrifuge at 8000 rpm for 1 minute.
- Discard the 2 mL collection tube containing the buffer and place the spin column into a new collection tube.
- Open the spin column and add 500 µl of buffer AW2 without wetting the rim. Centrifuge at full speed for 3 minutes.
- Place the spin column into your final microcentrifuge tube, add 100 µl of buffer AE to the column and allow to incubate at RT for 5 minutes.
- Centrifuge at 8000 rpm for 1 minute.
- Remove the spin column and throw it away. You now have a tube of DNA!
DNA extractions did not go perfectly today. It’s important to makes sure every step is sterile, otherwise there will be contamination in your sample! This is equally important during PCR.
Conventional Polymerase Chain Reaction: cPCR
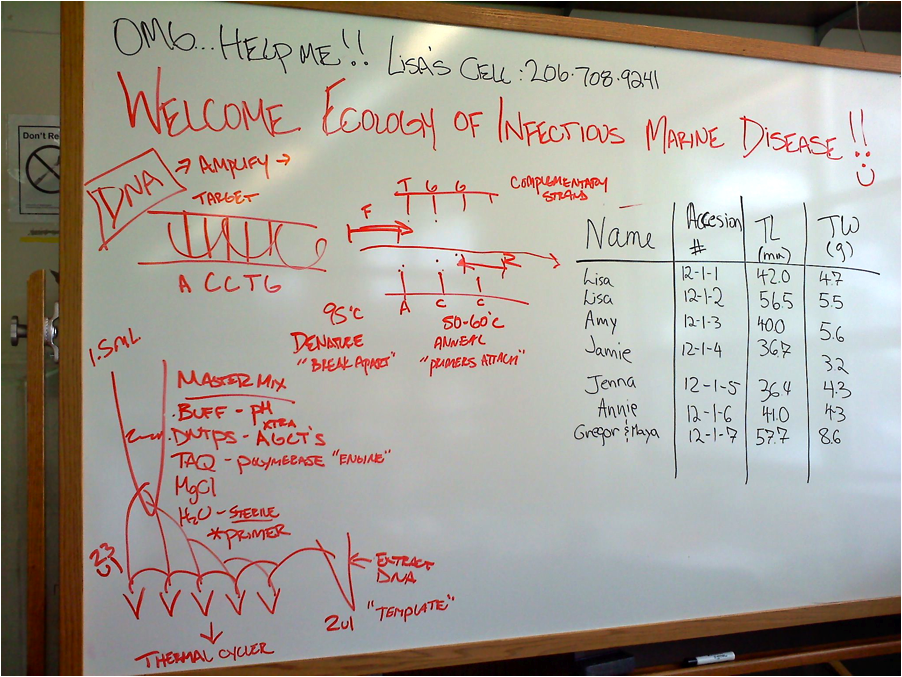
- Calculate the volumes you need for your PCR reactions (see master mix recipes below). Make at least 10% more than you need so that you do not run out of master mix. All calculations should be recorded in your notebook.
- Wipe down bench with 10% bleach.
- To a 1.5 mL tube add all reagents except the DNA template.
- Vortex briefly (pulse) (vortexing makes sure all droplets are in solution at the bottom).
- Label the PCR tubes with your sample # and primers. Label two tubes (–) for your negative control and two (+) for your positive control.
- For WS-RLO recipe, add 18 μL of master mix to each of the PCR tubes.
- For generic recipe, add 23 μL of master mix to each of the PCR tubes.
- Add 2 µL of PCR water to each negative control and cap.
- Add 2 μL of template DNA to each tube and cap, taking care not to cross contaminate between samples.
- Add 2 µL of known positive template into the positive control tubes.
- Vortex briefly (pulse) and spin down.
- Run thermal profiles for cPCR.
cPCR generic recipe
| Reagents |
uL/reaction |
| Immomix 2x |
12.5 |
| BSA (10mg/ml) |
1.5 |
| Fwd primer (10um) |
0.8 |
| Rev primer (10uM) |
0.8 |
| sH20 |
7.4 |
| Template |
2 |
| Total |
25 |
| [Stock] |
[End] |
Per |
|||||
| Reagent |
reaction (ml) |
||||||
| 5 X Buffer |
5x |
1 |
X |
4 |
|||
| MgCl2 |
25 mM |
1.5 |
mM |
1.2 |
|||
| BSA |
10 mg/ml |
400 |
ng/ml |
0.8 |
|||
| H2O |
11.08 |
||||||
| dNTP's |
10 mM |
200 |
µM |
0.4 |
|||
| RA 3-6 |
100 pmol/ml |
0.5 |
µM |
0.1 |
|||
| RA 5-1 |
100 pmol/ml |
0.5 |
µM |
0.1 |
|||
| Taq |
5 U/ml |
1.6 |
U |
0.32 |
|||
| Template |
2 |
||||||
| Total Reaction Volume |
20 ml |
||||||
Gel Electrophoresis
Today we used agarose to design a gel for gel electrophoresis. Gel electrophoresis is a way to visualize a PCR product. This approach is based on the fact that DNA is negatively charged. An electric current is passed through the gel and DNA moves towards the positive node. Gel electrophoresis specifically is used to visualize the size of the PCR product (therefore, if you have product you either have used a DNA-specific primer for your target, or had contamination).
TBE buffer was used to make the gel and it is a buffer made by a dilution.
Useful tips:
- Put water on the rubber liner of the electrophoresis tub to slip in and secure more easily
- Let gels cool before pouring them into the gel rig because they can melt the tub plastic and denature DNA
- Make sure there are no bubbles in the gel when poured in - you can push any bubbles to the side with a sterile tool
- Put black paper underneath the rigs when wet to see the wells
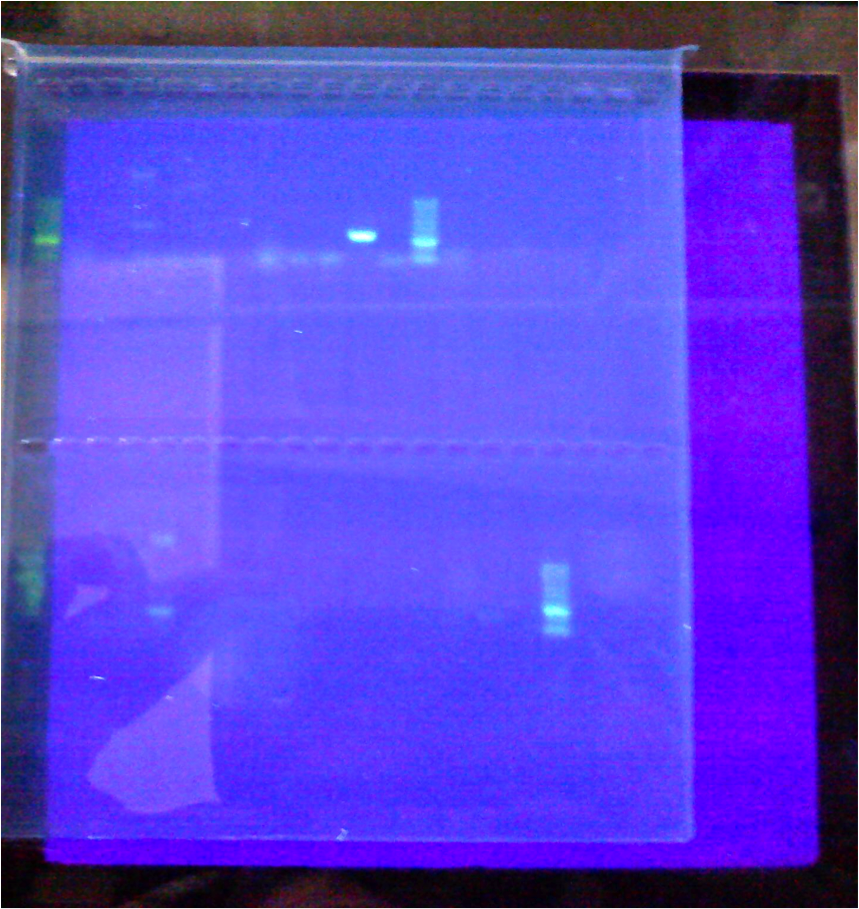
ladder - A B + space - A B + space - A B + space ladder
The first set of four had the universal primer EUB, the second set of four had the Ehrlichia - EHR16s, and the third set of four had the WS-RLO specific - RA 3-6/RA 5-1 primer.
July 30, 2012
Labyrinthula and Eelgrass; Case Study 2
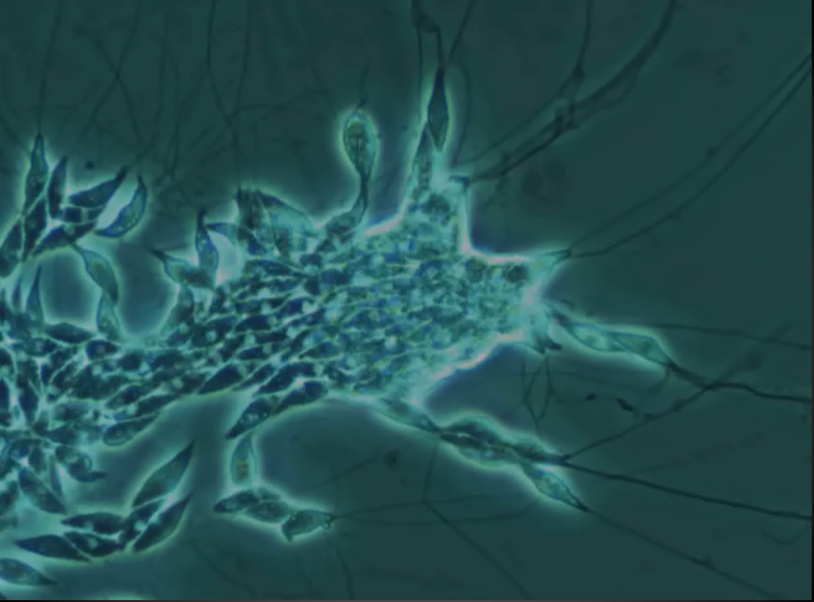
Laby are spindle-shapes cells with ectoplasmic networks and generally related to slime molds/fungi. They are common in the marine environment and also a pathogen for wasting disease. The picture below is a microscopic view of laby (it is actually a frozen frame from a video).

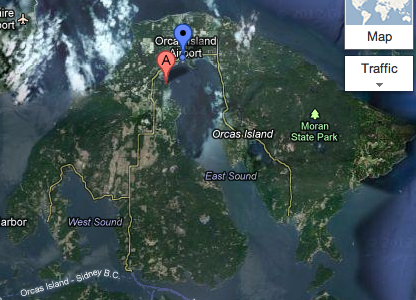
Today we sampled eelgrass beds in False Bay, Sand Juan Islands (map below) using two 10 meter transects. Our original plan was to sample along 3-4 transects runni
ng parallel to shore (based on work by, and in collaboration with, Sandy Wyllie-Echeverria). However, strong winds forced the tide to come in sooner than expected and we were only able to complete shallow transects. For each of these transects we (as a class) counted eelgrass densities in quadrats at 0, 2.5, 5, 7.5 and 10 m along the quadrat. In addition, we measured leasions and overall shoot length for all blades of eelgrass within 6 inches of the transect line with gross signs indicative of L. zosterae (Laby). We then collected some eelgrass with lesions along the transects in addition to some miscellaneously located eelgrass. Two students were also responsible for taking environmental parameters with temperature sensors for a few locations near the transects.
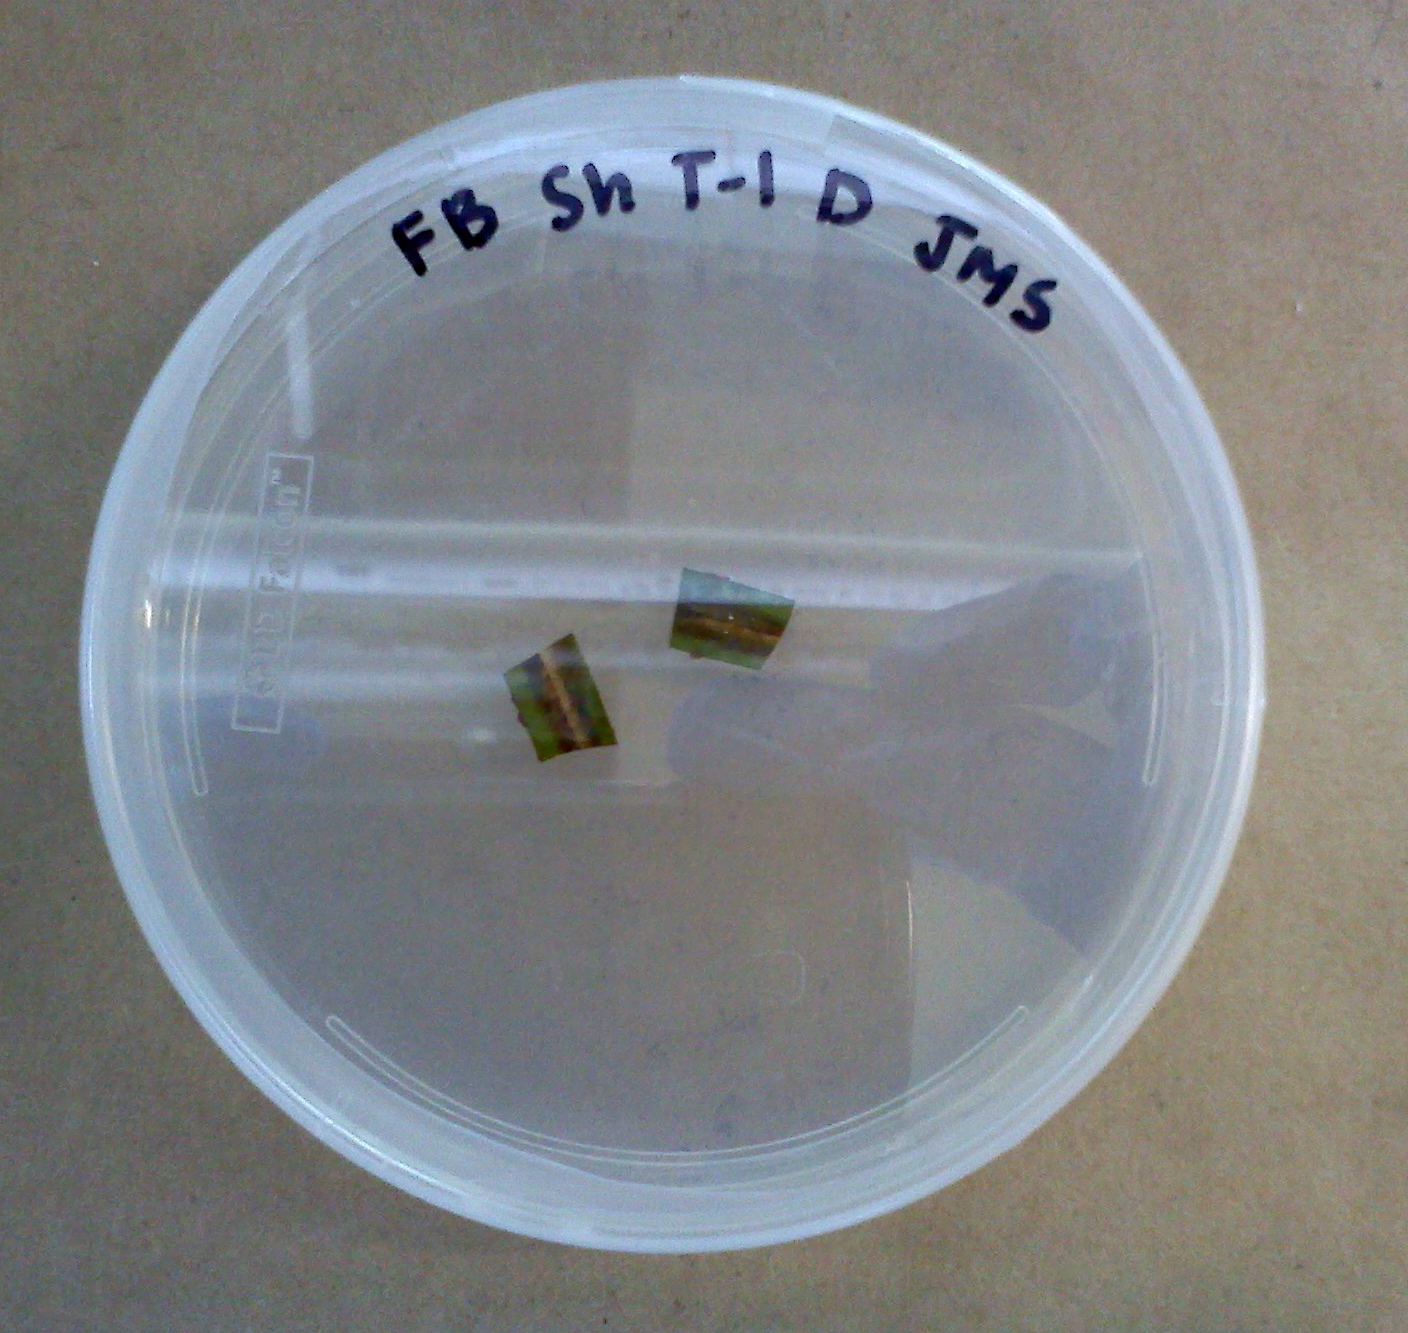
Below is a blade of eelgrass we collected in the field with a lesion. We prepped this blade for pathogen isolation in the plate labelled FB Sh T-1 D JMS. FB = False Bay, San Juan Island, T-1 = transect 1, Sh = shallow transect, D = diseased, JMS = my initials.

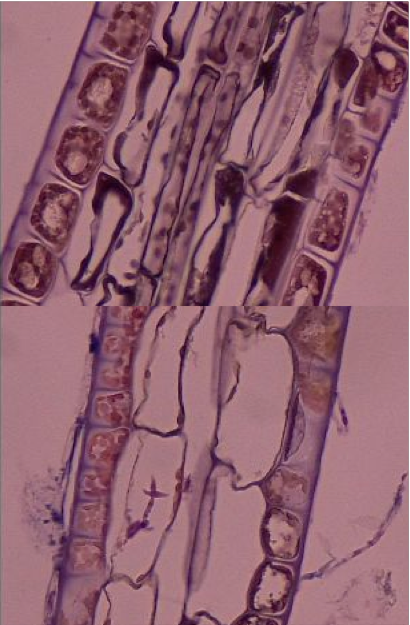
In the meantime we were able to visually look at histology slides that Cathryn created for us the previous week using eelgrass with similar lesions. Although previously determined “healthy” or “diseased” we quickly realized that this pathogen is extremely hard to detect. Laby has a spindle like shape, however, upon further investigation we quickly found nearly equal amounts of laby in both the slides labelled diseased AND healthy! This is a good lesson in the difficulties for determining pathogenesis with no prior information. We will continue to assess and discuss solutions to visually detect disease in eelgrass.
July 31, 2012
Eelgrass Sampling and Experimental Design
Fieldwork in Beach Comber on Orcas Island (map below) went much smoother today than yesterday. Beach Comber has a much higher density of eelgrass, and the wind was more forgiving today giving us a few hours to complete our surveys. In addition to our original sampling setup described for False Bay, we were able to sample two deep transects as well. As a result, we had to modify our sampling efforts. For this site we made three major modifications to our sampling setup:
- In each quadrat we counted flowering shoots separately from the rest of the eelgrass blades for density counts
- We randomly measured 5-10 shoots in the quadrats and counted eggs masses and adults for a measure of biodiversity
- We counted eelgrass blades with gross signs of lesions for only eelgrass located directly beneath the transect line
We feel these modifications greatly improve our sampling efforts and will repeat False Bay on Friday with this new design. A note to remember is that changing the area of eelgrass blades counted within a certain distance of the transect would not affect our study based on our experimental questions. Prevalence is a measurement of number of lesions / total number of blades, irrelevant of area surveyed.
In lab we plated more eelgrass with lesions, entered data, updated field protocol and discussed possible mesocosm experimental design. In addition, as a side experiment, we used six teapods to isolate snails and nudibranches with healthy and lesioned eelgrass to see if one of those organisms is eating the lesions in the wild. If so, this would indicate that they are acting as a vector for disease transmission. We left the teapods in the lab water table and will check the status tomorrow.
August 1, 2012
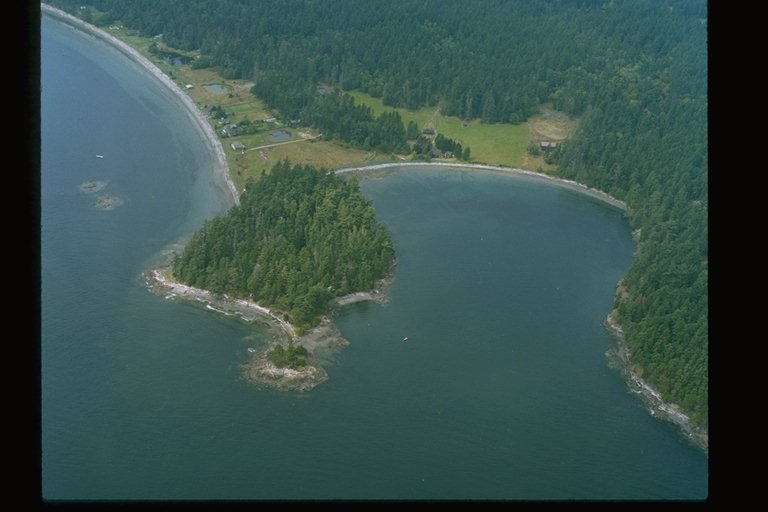
Laby fieldwork at Picnic Cove on Shaw Island (below). The eelgrass beds were very dense and it took hours to complete, but we were able to get data for all six transects!
Labwork revolved around DNA extractions of Laby. We followed the same protocol for DNA extractions as described earlier.
Accession No.: PC1H-13
Courtney entered field data, Ashton designed a quarantine setup, Maya cut eelgrass blades for an inoculation assay and Sammi and Amy extracted DNA from sea slugs and snails to see if either of them were eating Laby. If we get positive results from our PCR of sea slugs or snails than that will indicate which organism may be a possible vector for the disease.
August 2, 2012
Laby fieldwork at False Bay again - re-surveyed to include 3 deep transects and 3 shallow transects with all components observed to complement previous surveys.
PCR
Primer design:
Using Geneious software, information was gathered from examining the L. zosterae 154 sequence (west coast strain; GenBank: AF265335.1) against the L. zosterae MBL 93-2 sequence (east coast strain; GenBank: AF265334.1). An alignment of the 2 sequences were conducted and new primers were designed in Geneious using Primer 3 in a non-conflicting region (200-1180 bp) for the primers to lay down. Below is the new primer information:
Forward Primer:

Reverse Primer:

| Ingredient |
Amount per Rxn |
# of Rxns X 1.1* |
To add to Master Mix |
||
| GoTaq Mix |
12.5 uL |
X |
7 |
= |
75 |
| BSA |
1.5 uL |
X |
7 |
= |
9 |
| Forward Primer |
0.8 uL |
X |
7 |
= |
4.8 |
| Reverse Primer |
0.8 uL |
X |
7 |
= |
4.8 |
| PCR H2O |
7.4 uL |
X |
7 |
= |
44.4 |
| Time |
Temp (°C) |
|
| 1. |
10 min |
95 |
| 2. |
30 sec |
95 |
| 3. |
30 sec |
50 |
| 4. |
60 sec |
72 |
| 5. |
Repeat steps 2-4, 40 times |
|
| 6. |
10 min |
72 |
| 7. |
Hold @ 4 deg C |
August 3, 2012
Laby Get Electrophoresis
Comb 1:
1. Ladder
2. Jame
3. Maya
4. Sonia (2mL)
5. Positive control (2-4, 7)
6. Negative control (2-4, 7)
7. Sonia (5mL)
8. Negative control (9-16)
9. PCH-12
10. PC1-D12
11. PD1
12. PD2
13. LD1
14. LD2
15. LH
16. PH
17. Positive control (9-16)
Comb 2:
1. Ladder
2. Positive control (4-5)
3. Negative control (4-5)
4. Jenna
5. Ana
Intro to high-throughput sequencing:
QPX was grown in plates/cultures at 10 degrees C and 21 degrees C. 36-100 bp “reads” will be sequences for library 1 (10C) and library 2 (21C). The reads will go through a De Novo (self) Assembly to create multiple conigs (contiguous sequences). This will create the “backbone” or reference assembly. Then we will compare library 1 with library 2 RNA seq to identify differences in gene expression. This will give us an indication of which genes were transcribes, or a physiological response to changes in temperature. Then the reads will be annotated and blasted, then put to a swiss prot and gene ontology to determine gene function (i.e. virulence factors, apoptosis etc.)
August 4, 2012
Bleaching Sand Dollar study (Dendroidea)
Transmission experiments:
Setup:
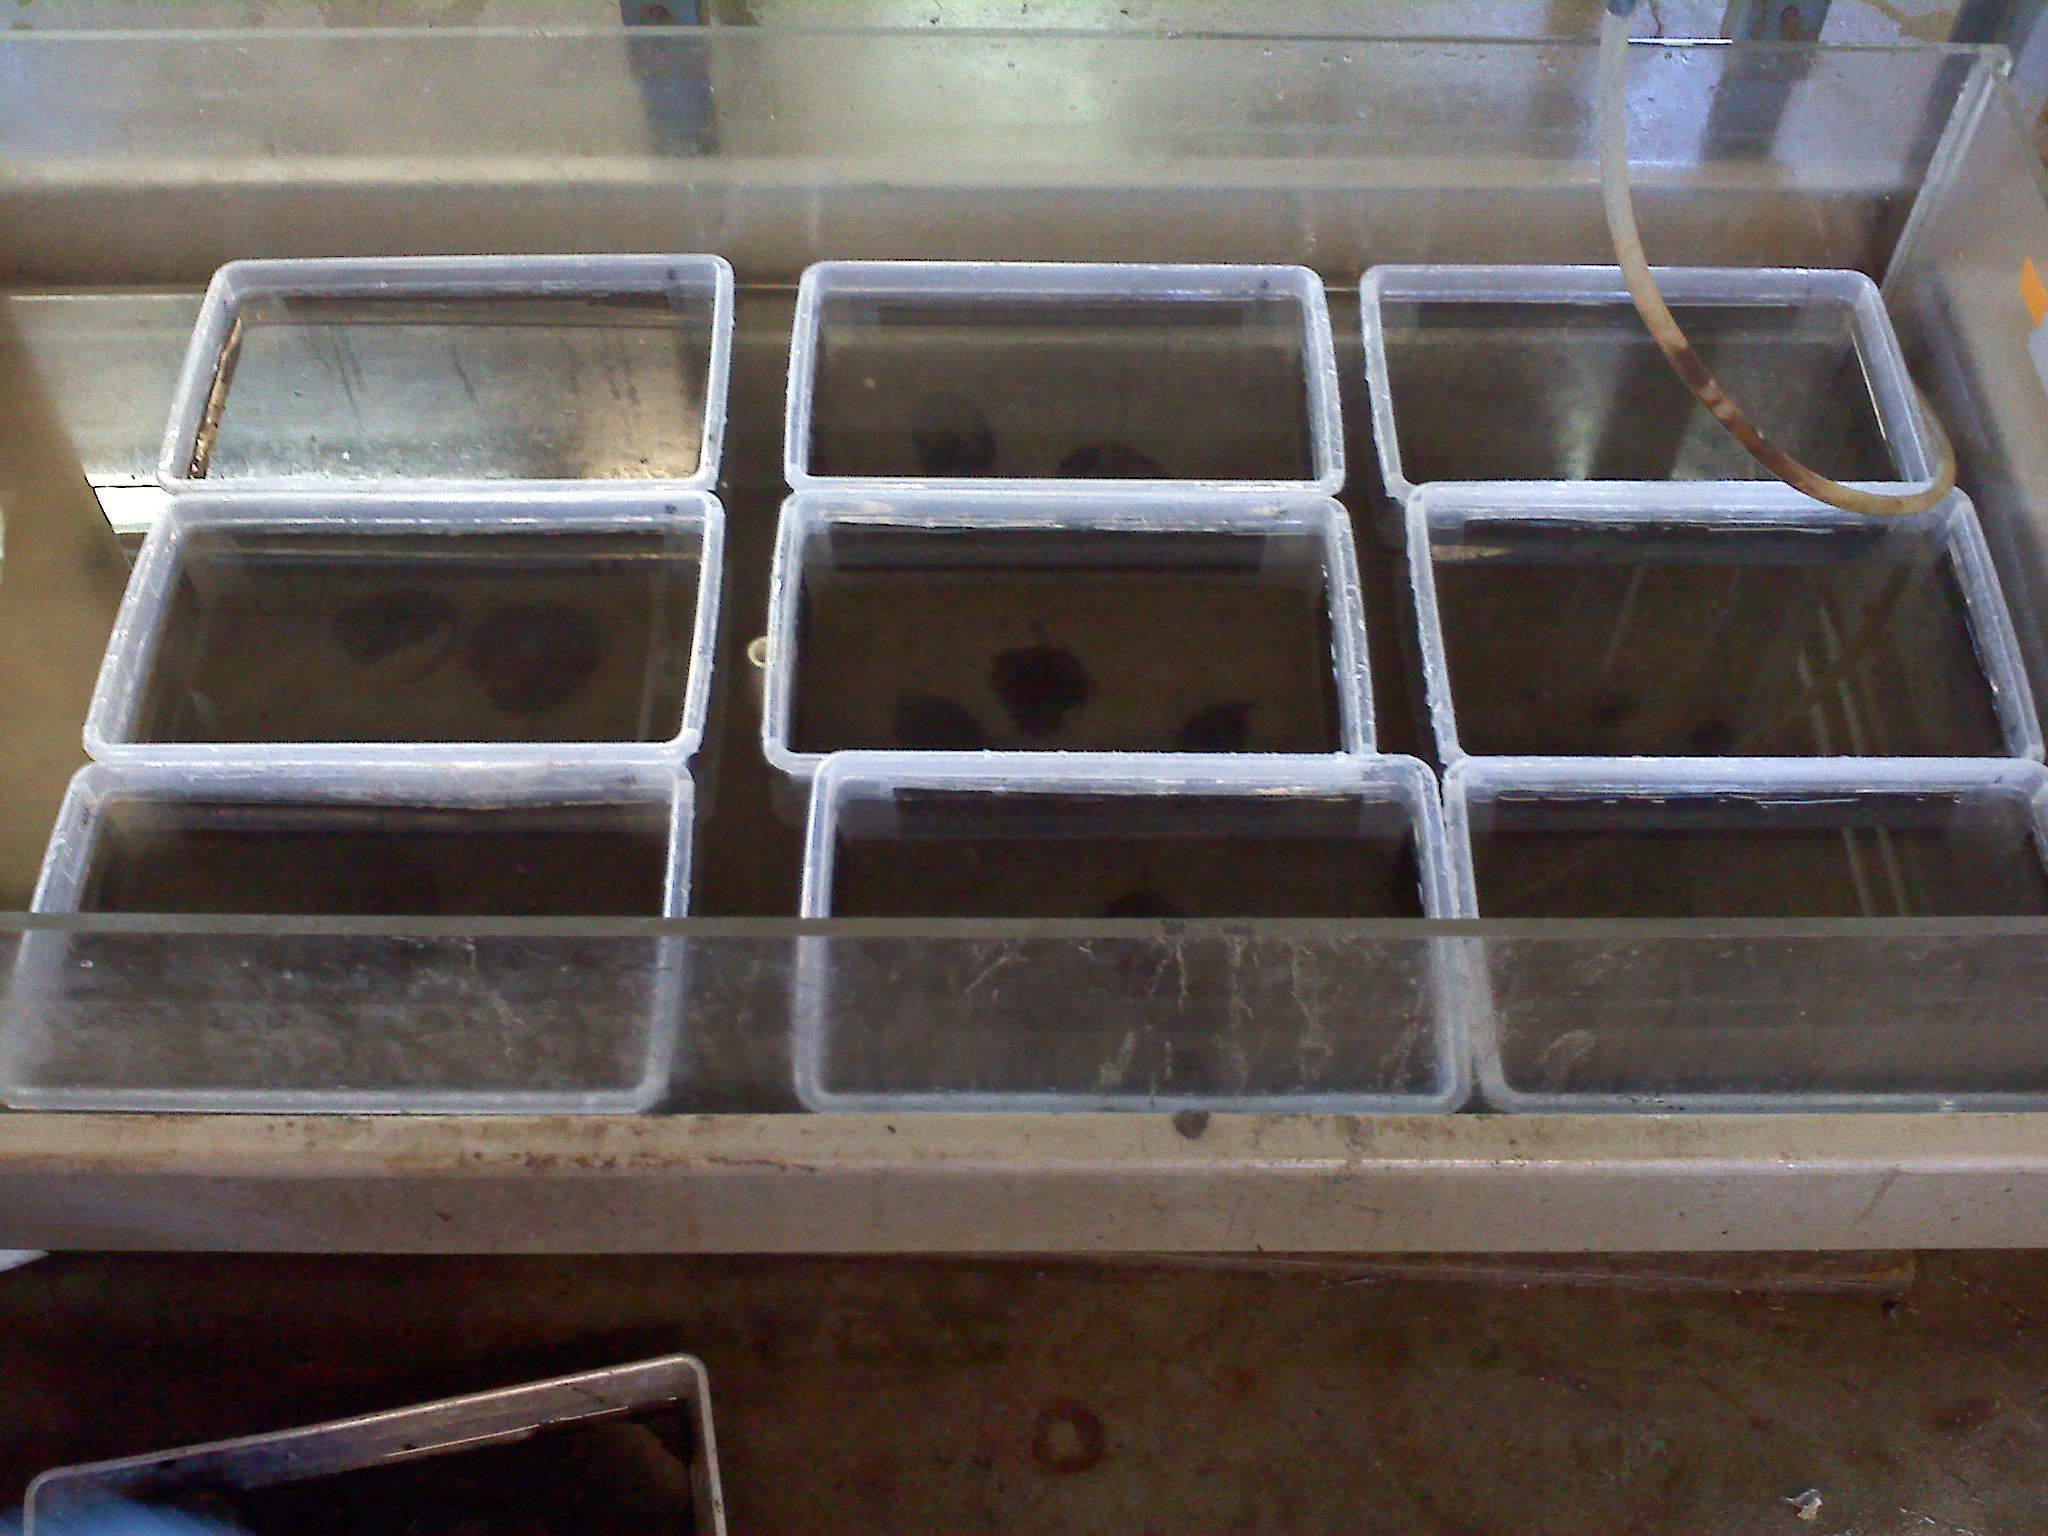
| Box 3: 1 bleached, 77mm 2 healthy, 51 mm, 66mm |
Box 6: 1 bleached, 89mm 2 healthy, 46mm, 68mm |
Box 2: Healthy babies, 22mm, 31mm, 30mm |
| Box 8: 3 healthy, 48mm, 71mm, 74mm *Larger dollars had predation |
Box 13: 1 bleached, 66mm 2 healthy, 72mm, 67mm |
Box 4: Bleached babies, 29mm, 30mm, 26mm |
| Box 16: 1 bleached, 89 mm 2 healthy, 46mm, 68 mm |
Box 10: 3 healthy, 72mm, 49mm, 54mm |
Empty |
Histology:
1. Fix in formalin for 24-48 hrs
2. Transfer to EtOH
3. Calcium carbonate dissolving agent
4. Section and send to histology
4 bleached babies were fixed in 3.5% formalin
Digestive tract and gonads of 1 healthy and 1 diseased adult were sectioned, placed in histology cassettes and put in Davidson’s fixative to be sent out to histology with the Armina cassettes.
Swab and culture:
H = healthy
B = bleached
L = lesions
TCBS (media specific for Vibrios)
SB-1-H: Inside/Outside
SB-5-BL: Inside/Outside
SB-3-B: Inside/Outside
SB-4-BL: Inside/Outside of bleached area
SB-4-BL: Inside/Outside of lesioned area
SB-2-B: Inside/Outside
SB-6-H: Inside/Outside
Marine Agar (generic media for bacteria)
SB-4-BL: Outside
SB-1-H: Inside/Outside
SB-3-B: Inside/Outside
SB-5-BL: Inside/Outside lesions
SB-4-BL: Inside/Outside bleached
SB-6-H: Outside
SB-2-B: Inside/Outside
Future steps could include: isolating cultured bacteria from single colonies and ran 3 times to fully isolate a bacteria individually, followed by sequencing to identify bacteria.
August 6, 2012
Total Alkalinity
Notes to compliment alkalinity protocol:
1. Circulating water bath should be at 25C
2. Swirl acid really well before use to make sure it’s homogeneous, sits in bath
3. Make sure grey cap is off pH probe when ready to use
4. Rinse pH probe with DI water, dry with kimwipes
5. Styrofoam is for heat insulation
6. Test all calibration solutions first - rinse instrument with DI water in between
7. SAVE calibrations to machine
8. Add cup for 3 rinse cycles to collect solution running through the machine
9. Mark down weight, volume titration and total alkalinity
August 7, 2012
Cut Laby (dry on media), moved to new pate and added autoclaved Zoestra; this will hopefully allow Zoestrea (clean) to act as an innoculum for Laby onto healthy, living Zoestrea
Vibrio culturing/passing plates:
T1N2 plates = one part triptone (sugar) plus two parts salt; generic media (vibrios need salt to grow)
TCBS plates = Vibrio specific media
Am = Aeromonas media A199 (probiotic)
Vibro strains with different pathogenicity:
Re 22
Re 66
Re 98
Re 101
ReX0123

Cultured Re 66, Plate 1 had T1N2 media, strait line was Am to see if it inhibited Re 66 growth, this is done after Re 66 streak as to notice inhibition only where the streak paths cross. Plate 2 was TCSB, each lab group streaked a different strain of Vibrios.
Tips:
1. Do not go back over streak pattern
2. For the left hand side of plate 1: 1 streak, dip tool in ethanol with sand to remove remaining bacteria, flame tool, cross last streak up and down to start the new streak pattern, sterilize tool and repeat.
3. Tap agar with tool after flame to cool before picking up bacterial culture
4. Don’t forget to label the plates!
Trained to do Spec pH - follow protocol in lab handouts
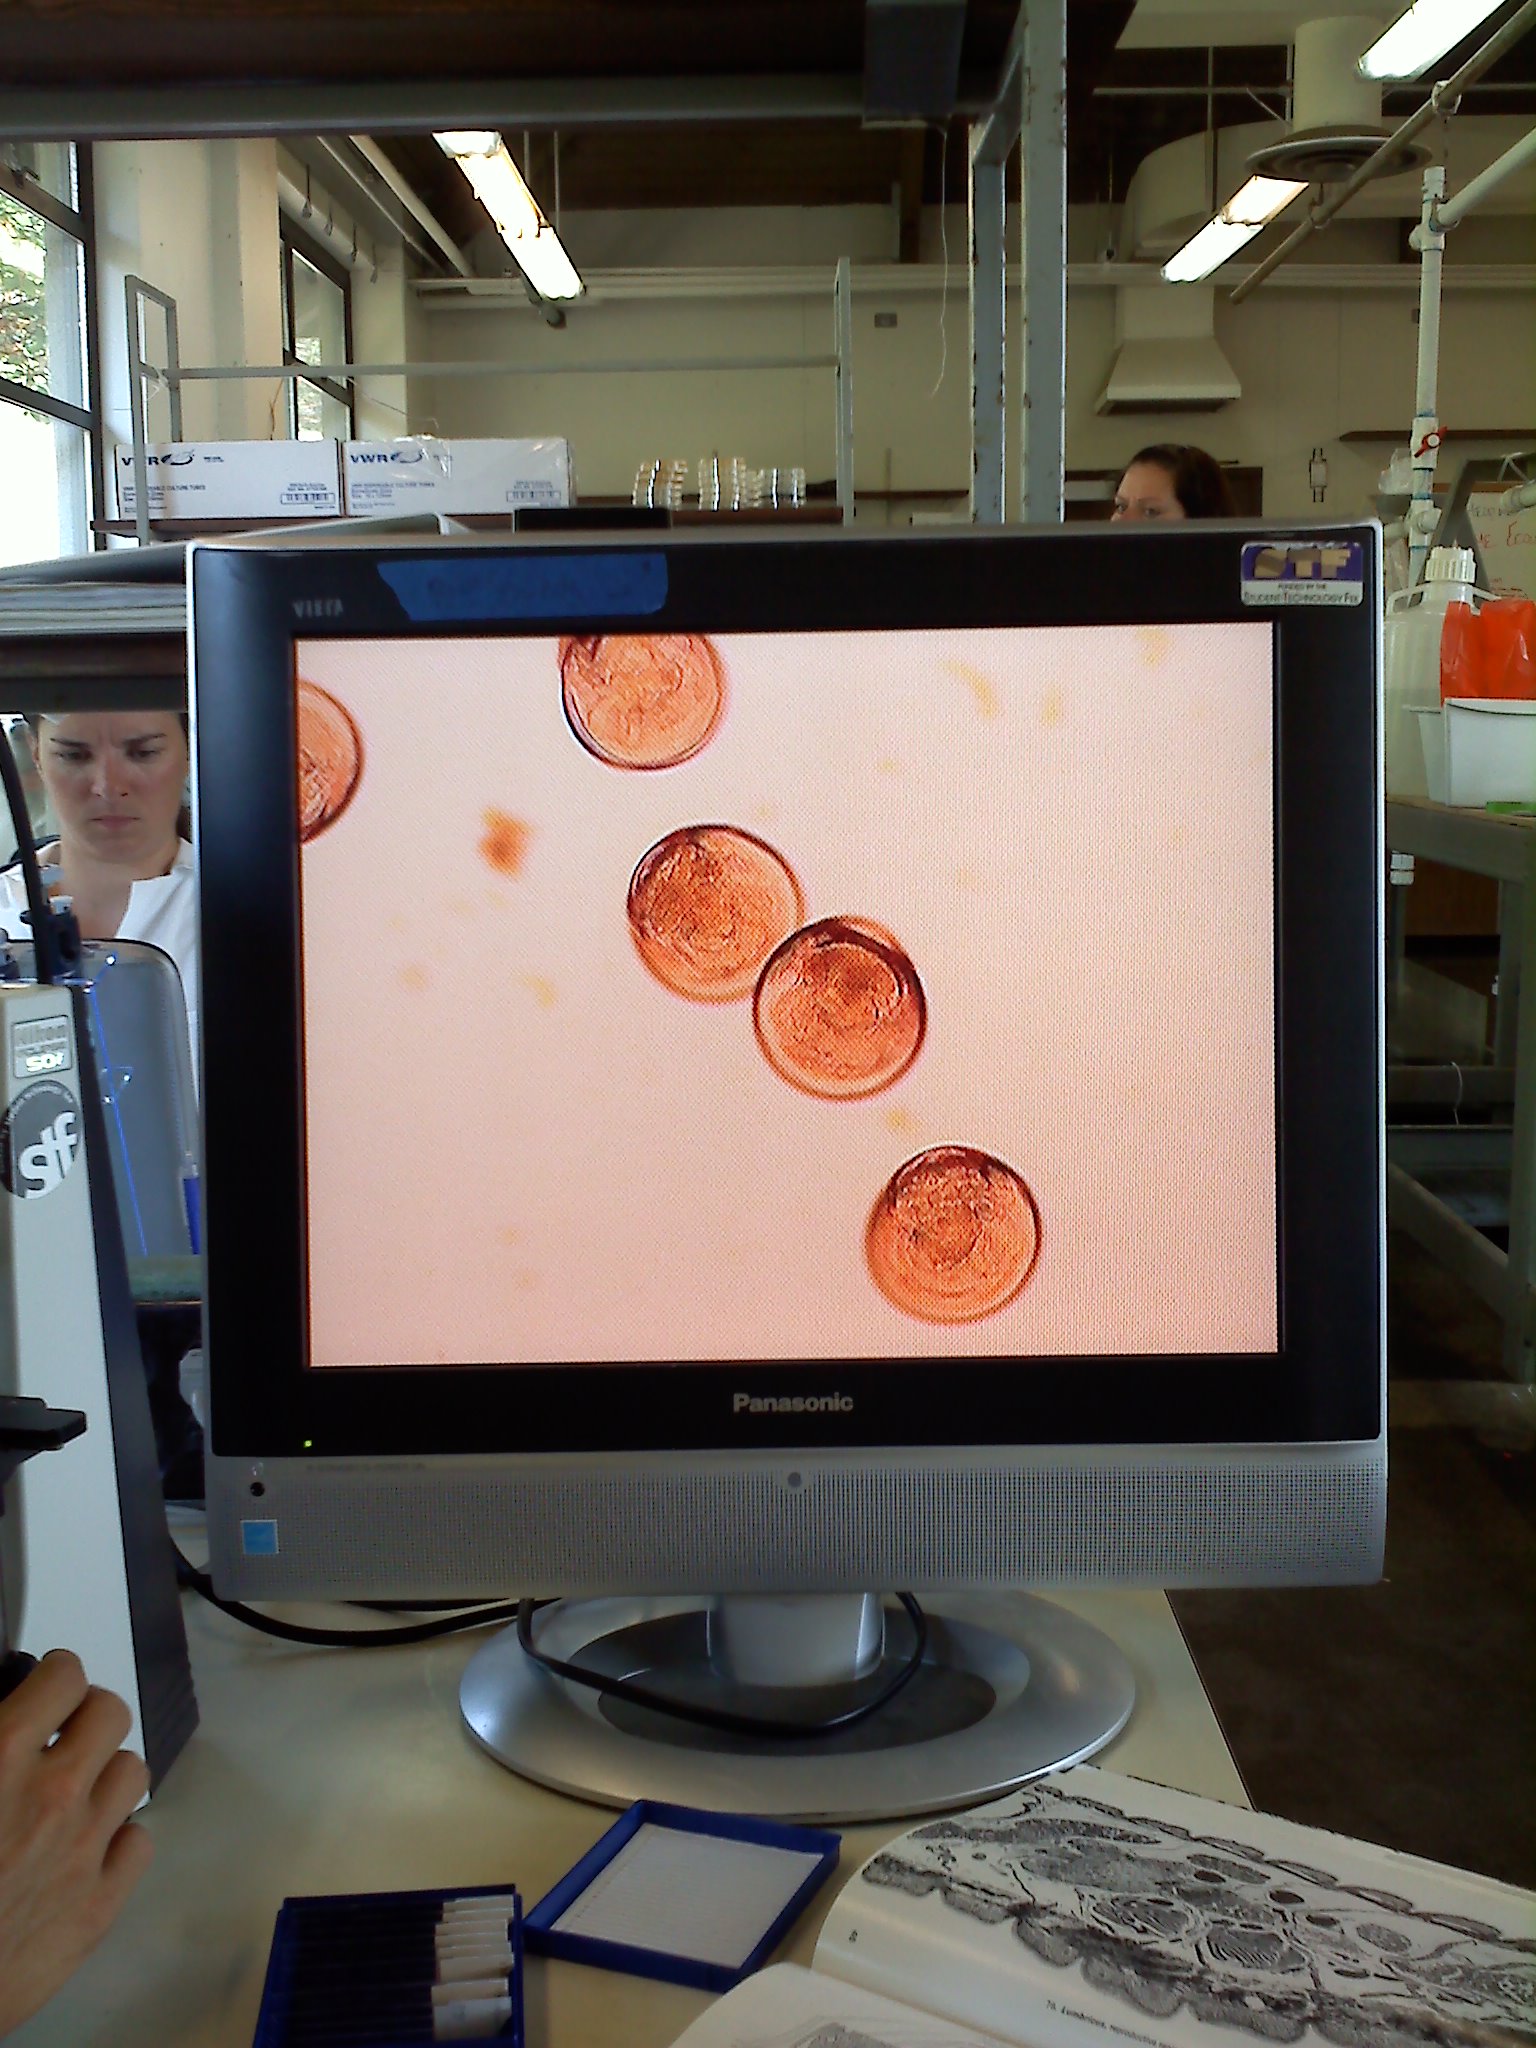
Larval counts equation:
X(larve concentration [1 x 10⁶]) = (larvae [40])(volume[100microl])
Tip: Use inverted microscope to count larvae, use fine focus to move depth of view above grid lines
August 8, 2012
Dilutions: with Am and Re 22Vt after 24 hours: growth at RT (~22C) ~ 3.0 x 10⁹ cfu/mL
cfu = colony forming units
Adding 100 microliters to the well...
(3.0 x 10⁹)(0.1 mL) = 3.0 x 10⁸ cfu/mL
3.0 x 10⁸ cfu/mL / 4.0 mL SW = 7.5 x 10⁷ cfu/mL
original culture:
7.5 x 10⁷ cfu/mL
(-1) 1:10 dilution = 7.5 x 10⁶ cfu/mL
(-2) 1:10 dilution = 7.5 x 10⁵ cfu/mL
(-3) 1:10 dilution = 7.5 x 10⁴ cfu/mL
Am after 24 hr at 37C ~ 1.5 x 10⁸ cfu/mL
1.5 x 108 x 0.1 = 1.5 x 10⁷ cfu/mL
1.5 x 10⁷/4.0 = 3.76 x 10⁶ / 100 (2 dilutions) = 3.75 x 10⁴ cfu/mL
Larval counts
Ambient stock = 2.65 x 10³/mL = 2.65/microliters
2000 stock = 3.15 larvae/microliter
(x volume have)(concentration want) = (volume want)(concentration want)
x(2.65 x 10³/mL) = 2mL(400/mL)
x = 301.89 microliter larvae
*Plus 2000-302 H2O
August 9, 2012
Gram stain for Serum Agglutination Test and Azocasein Protease Assay following lab protocol:
- Serum Agglutination Test
- Add 50 uL of sterile seawater and 25 uL of your culture to one slide (control)
- To one slide (your test slide) add 25 uL of sterile seawater and 25 uL of your culture and 25uL of the thawed polyclonal antibody.
- Gently mix solutions on both slides with sterile pipet tips (gently suck up and down)
- Incubate at room temperature for 5 mins
- View at 10x or 4x on the scope to compare degree of agglutination of the cells
More agglutination in test slide
- Azocasein Protease Assay (R. Elston protocol, Aquatechnics)
- Pick any suspicious yellow colonies off TCBS plates (test green ones too so you have a negative control for the azocasein)
- Grow colony in 5ml marine broth culture tube overnight (Lisa has done for you)
- Test for protease:
ii. Remove 100 μl of supernatant and add to a microcentrifuge tube (discard the rest of the pellet and culture supernatant)
iii. Add 400 μl of 1% azocasein
iv. Incubate for 30 min at 37°C
v. Stop reaction by adding 600 μl of 10% trichloric acetic acid (TCA)
vi. Incubate on ice for 30 min
vii. Centrifuge at 13,000 rpm for 5 min
viii. Add 200 μl of 1.8 N NaOH to a new microcentrifuge tube
ix. Add 800 μl of the reaction supernatant to the tube with the NaOH
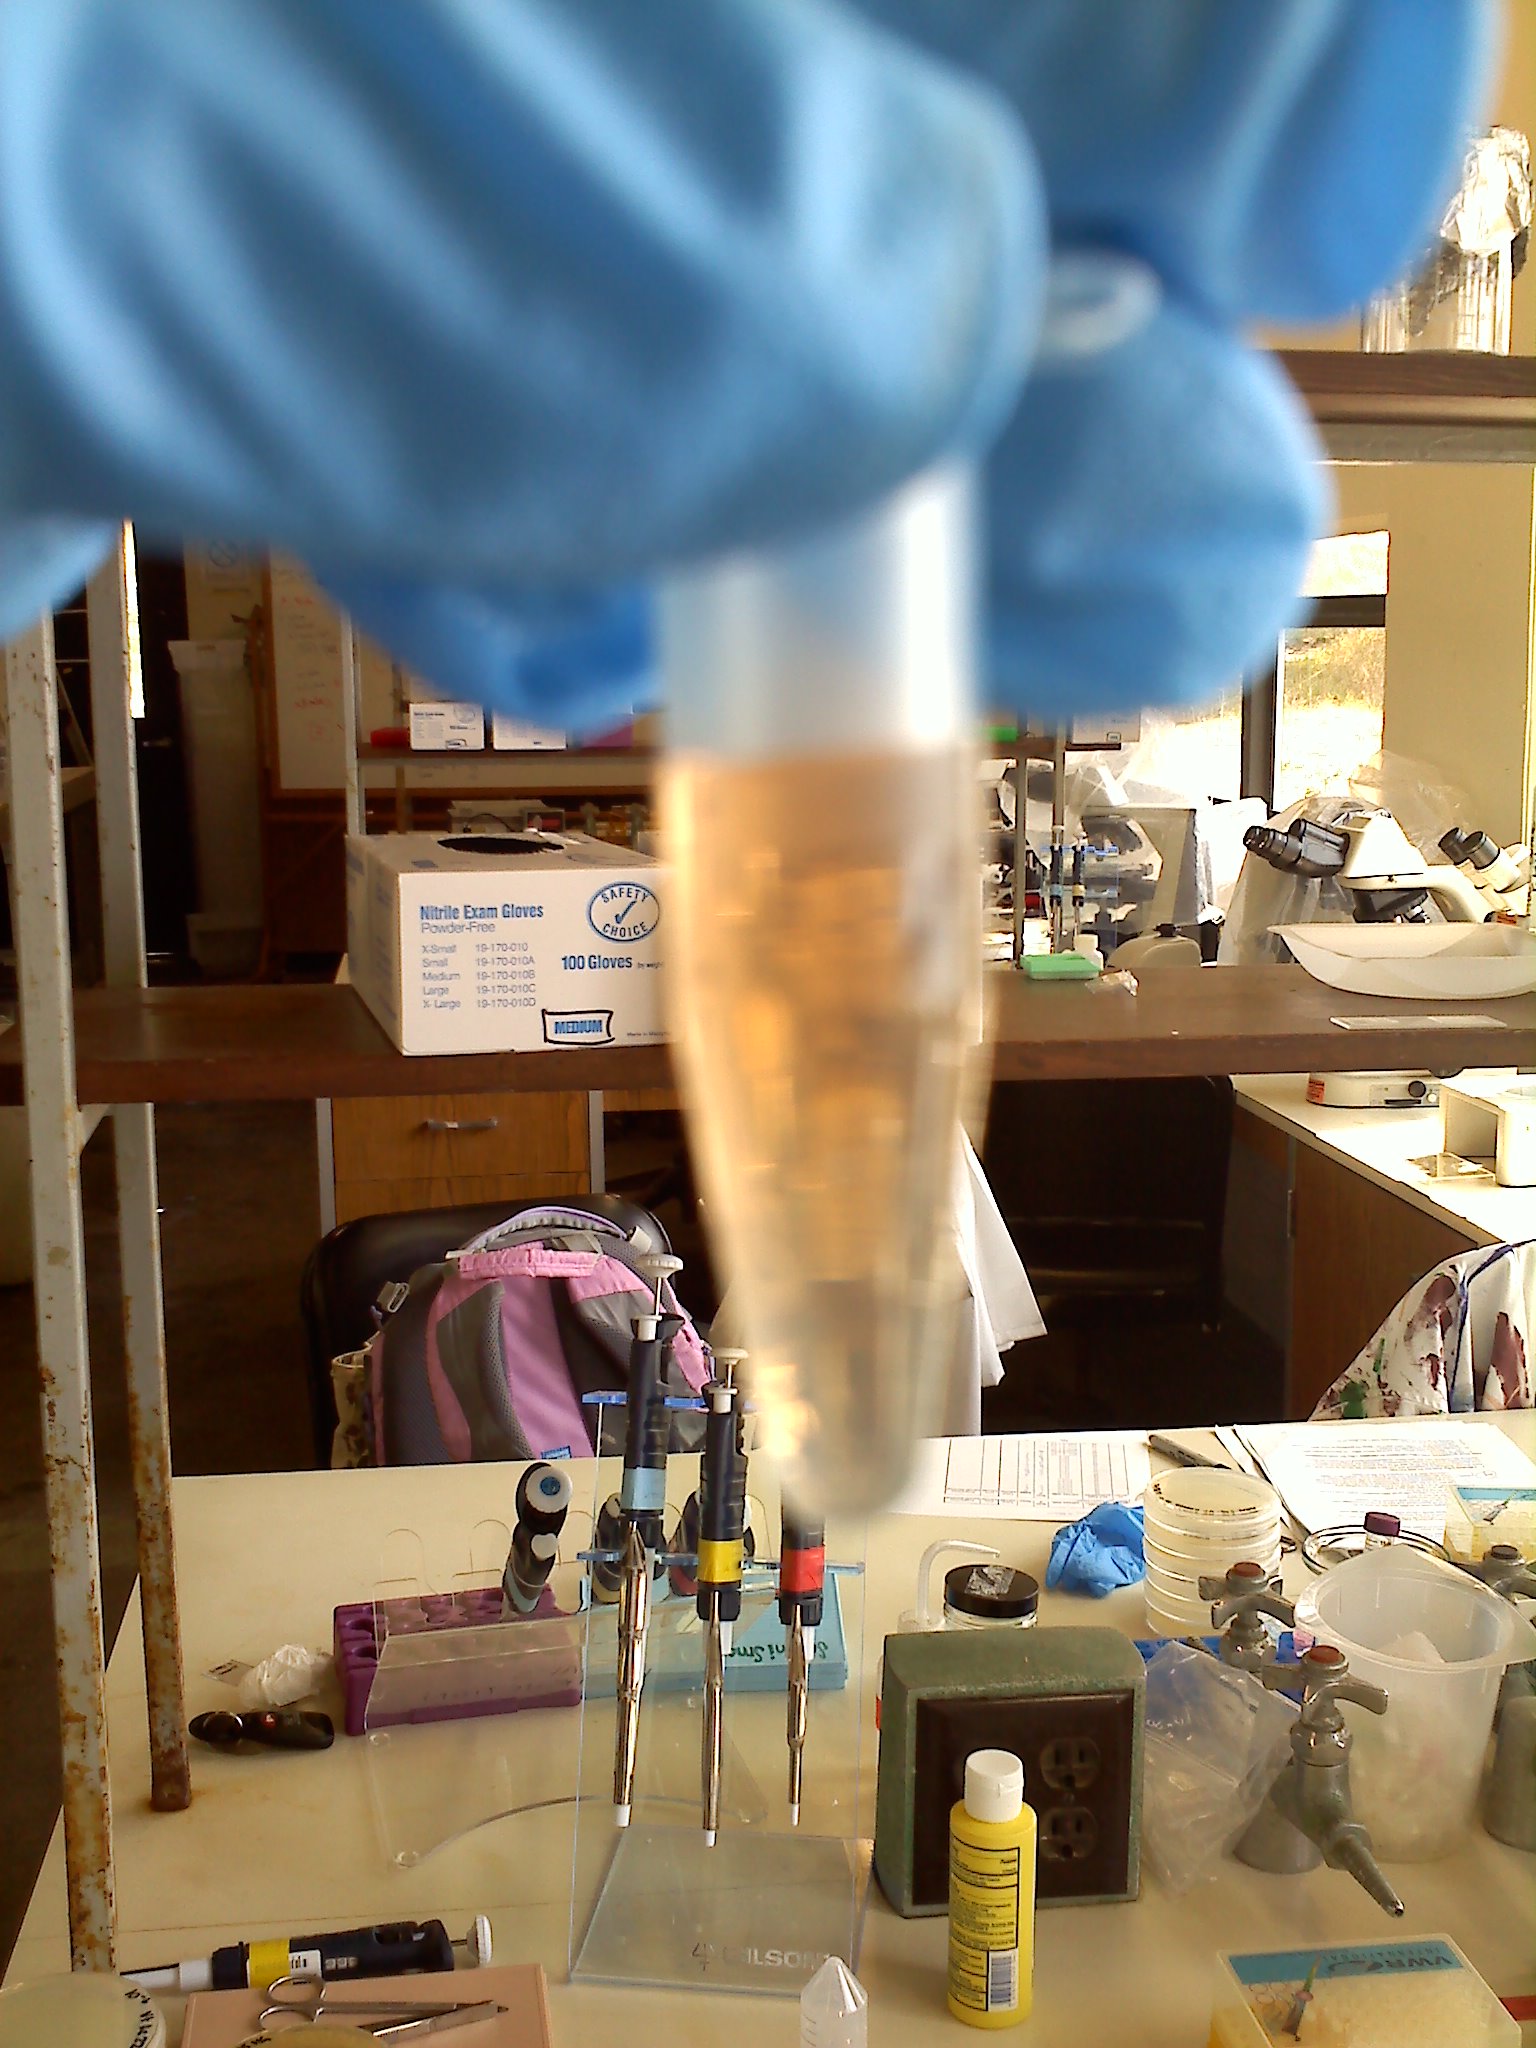
x. The supernatant will turn an extremely bright and obvious orange upon a positive result for the protease, it will remain whatever color the supernatant was (not always clear, might have slight yellowish tint) if it is negative for the protease
We had protease in our sample:
August 13, 2012
Useful codes for creating a database:
ls = library search
cd [drag and drop application or write path]
./makeblastdb
./makeblastdb -in /Users/Shared/EIMD_blast/db/uniprot_sprot.fasta -out /Users/Shared/EIMD_blast/db/uniprot_sprot -dbtype prot
./blastx - query/ drag and drop qpx transcriptome -db drag and drop untiprot from db
Blast query:
./blastx -query /Users/Shared/EIMD_blast/query/QPX_transcriptome_v1.fasta -db /Users/Shared/EIMD_blast/db/uniprot_sprot -max_target_seqs 1 -outfmt 6 -evalue 1E-5 -out /Users/Shared/EIMD_blast/out/qpxblastswissprot
August 14, 2012
My Favorite Gene Project
Explored functions in Galaxy, initiated transcriptome creation for our QPX library and began to examine functional groups associated with the two QPX treatments.
August 15, 2012
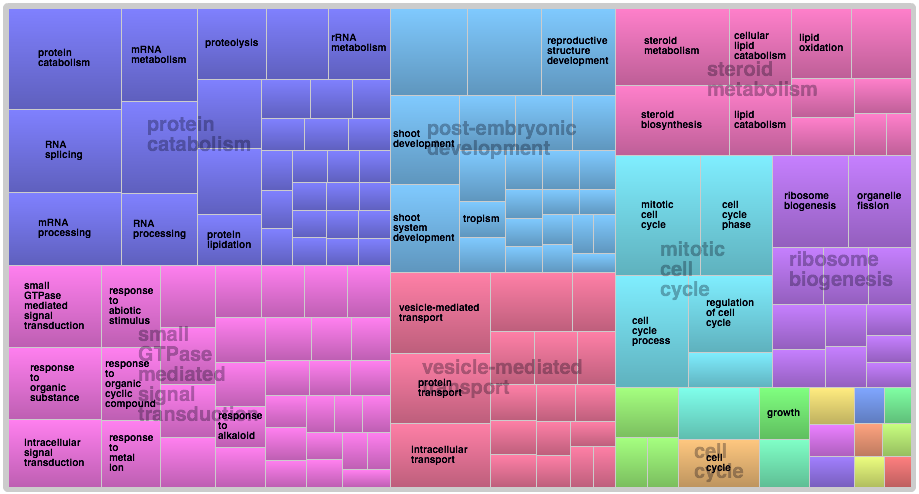
Awesome mds plot createed in REViGO/R to visualize a subset of differentially expressed genes from our QPX experiment.
August 16, 2012
Started comparing black abalone transcriptome using a library with no wither syndrome, a library with only withering syndrome and a third library with withering syndrome and phage.
Created an independent phylogeny for each library and and began a blast of no withering syndrome against a bacteria RefSeq and virus RefSeq. The Terminal code is below:
./ opens programs like blastx
inputs and outputs are files to blast
./makeblastdb -in (reference sequence goes here) -dbtype nucl -out (reference sequence without .fasta)
NWS blast against Bacteria RefSeq:
./makeblastdb -in /Users/Shared/EIMD_blast/db/BACTERIA_RefSeq.fasta -dbtype nucl -out /Users/Shared/EIMD_blast/db/BACTERIA_RefSeq
./blastn -query /Users/Shared/EIMD_blast/db/BlackAb_NWS_assembly1.fa -out /Users/Shared/EIMD_blast/db/BlackAb_NWS_assemblybacteria -db /Users/Shared/EIMD_blast/db/BACTERIA_RefSeq -max_target_seqs 1 -outfmt 6 -evalue 1E-10
NWS blast against Virus RefSeq:
./makeblastdb -in /Users/Shared/EIMD_blast/db/VIRUS_RefSeq.fasta -dbtype nucl -out /Users/Shared/EIMD_blast/db/VIRUS_RefSeq
./blastn -query /Users/Shared/EIMD_blast/db/BlackAb_NWS_assembly1.fa -out /Users/Shared/EIMD_blast/db/BlackAb_NWS_assemblyvirus -db /Users/Shared/EIMD_blast/db/VIRUS_RefSeq -max_target_seqs 1 -outfmt 6 -evalue 1E-10
August 17, 2012
Helped the oyster group with inoculations following the same protocol as our lab module.
August 18, 2012
1. Assisted the Laby group with PCR
2. Coral histopathology discussion with Courtney
3. Continuing to assess sand dollar transmission status:

August 19, 2012
Created pie charts that encompass the entire transcriptome’s known sequence functional groups based on GO slim terms and split into 3 components: Biological Processes, Cellular Component and Molecular Function.
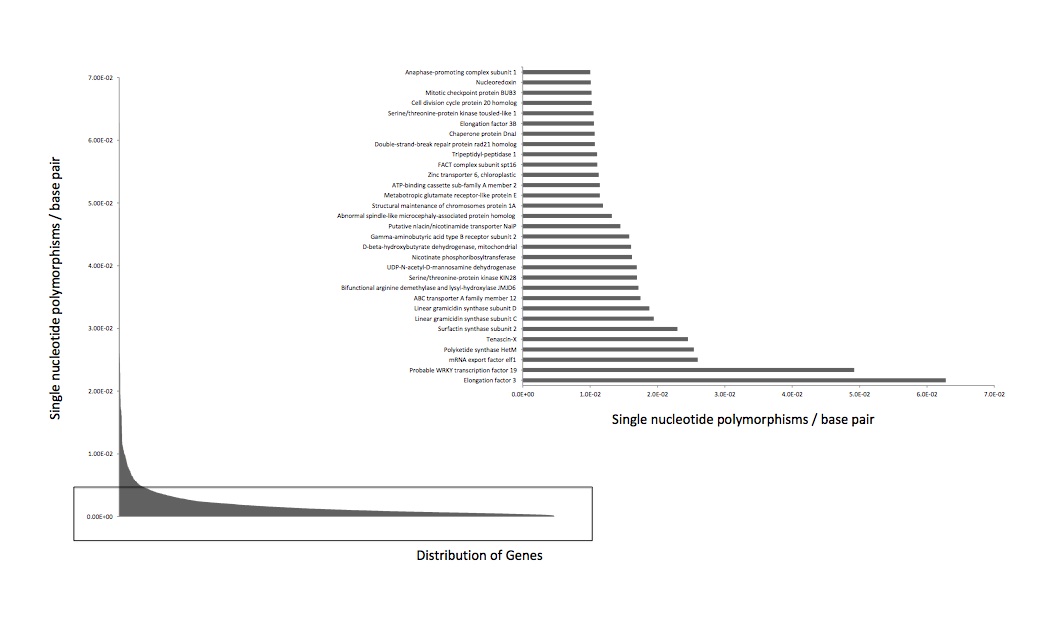
Continued SNP work and determined SNP rate per # bp for our QPX data. The SNPs are associated with contigs in our transcriptome which was blasted against the QPX genome.
August 20, 2012
Decalcification of sand dollars:
Sol A: 25 grams sodium citrate (citric acid) in 250 mL dI water
Sol B: 60 mL 90% formic acid in 120 mL dI water
-OR-
57 mL 95% formic acid in 123 mL dI water
*Tips
1. Wash organism with tap water before beginning (~5), can dissolve in cassette
2. Need to use glass F-ware
3. Use lid but do not screw shut so gas can escape
4. Shake every few hours or put bottles on shaker to homogenize acid
5. Add acid to water (sodium citrate) not water (sodium citrate) to acid. Very important!!!!
6. Switch solution every few hours/when bubbling stops
7. Put cassettes in EtOH afterwards (not Davidson's)
We used 75mL solution A + 25mL solution B
August 21, 2012
QPX
Created biological processes table of interesting genes associated with QPX and began to quantify and visualize SNP rate in QPX on the transcriptome that maps onto the genome (163 genes associated with stress response - link in google docs to entire document).

August 22, 2012
This graph represents the single nucleotide polymorphisms in our genome. We joined SNPs in the transcriptome to the genome to begin this analysis.
