Summary
Ran qPCR again
Procedure
Made new batch of 10µM working stock of primers, 10µL of primer and 90µL of water. Followed the same procedure for preparing PCR samples. Exception was that the master mix was made for each primer set including Immomix, dye, primers and water. Then each cDNA sample was added to each tube in an attempt to eliminate any contamination.
Reactions were 25µL instead of 50µL this time, but proportions were the same.
Results
There was no amplification in any of the samples including the water. Melting curves did not show any conclusive results.
Conclusion
The results showed that there was no contamination since the water samples did not amplify. However, none of the other samples amplified either. This most likely points to a flaw in the primer pairs. The cDNA could have been bad also. New cDNA was made from the same tissue. That will be tested again with new primers.
11/24
Summary
Reconstituted primers and made working stock. Made cDNA for all samples. Ran qPCR.
Procedure
Primers were reconstituted to 100µM by adding water. Multiplying the nM of primer by 10 gave us the µL of water to add.
| Primers |
F (nM) |
R (nM) |
H2O-F (µL) |
H2O-R (µL) |
| Cyp51 a |
32.1 |
27.9 |
321 |
279 |
| Cyp51b |
33.5 |
30.1 |
335 |
301 |
| Cyp51c |
32.2 |
28.7 |
322 |
287 |
| MYP a |
32.7 |
30.3 |
327 |
303 |
| MYP b |
21.7 |
26.4 |
217 |
264 |
| MYP c |
27.6 |
34.8 |
276 |
248 |
To make the cDNA 2µL of RNA was added to 3µL of H2O. Tubes were then placed in the thermocycler for 5 min. at 75° C. They were then placed on ice for 5 min. We then added 4µL of MMLV Buffer, 8µL dNTPs, 1µL MMLV RTranscriptase, 1µL Oligo dT Primer and 1 µL RNase free water. Total volume was 20µL for each sample. Each tube was vortexed, spot spun, and then loaded in the thermocycler. The profile for the thermocycler was: RT for 10 min., 37° C for 1 hr., and then heat inactivated at 95° C for 3 min. cDNA was then stored at -20° C.
PCR reactions were loaded next. Each of the three control tissues and the three test tissues were run with each primer pair as well as two H2O controls for each primer pair. To each tube we added 25 µL of immomix, 2µL Dye Syto-13, 1µL forward primer and 1µL reverse primer, 2µL cDNA and 19µL H2O, for a total volume of 50µL. Tubes were then loaded and run in Opticon.
Results
There were no definitive results from this PCR run. Some amplification was achieved with the MYP-a and Cyp-c primers. However, there was also amplification in the water samples.
Melting curves did not reveal any distinct patterns between the samples or between primer pairs.

Conclusion
Some of the samples had amplification, meaning that some of the primers worked. However, the water samples also showed some amplification most likely due to contamination. The MYP-a and Cyp-c primers will be run again on all tissues. Water samples will also be run along with them taking special care to avoid any contamination. A new working stock of 10µM primers will be made from the 100µM stock.
11/17/09
Summary
DNased samples, quantitated and normalized concentrations of RNA.
Procedure
Pipetted 2.5 µL of buffer, 1µL of Turbo DNase and 21.5 µL of RNA into 6 new 0.5 ml tubes. Incubated samples at 37° C for 30 min. Added 1µL of Turbo DNase to each tube and incubated again for 30 min at 37° C. 2.5µL of DNase inactivation reagent was added to each tube and incubated at RT for 2 min while flicking the tubes to mix. Tubes were then centrifuged for 1.5 min at 10,000 g. Supernatant was removed and placed into new tubes. -The control-small tube had very little supernatant. Cap may not have been on tightly and part of the sample might have evaporated.
Samples were quantated using the nanodrop. Nanodrop was blanked with water first. 2µL of each sample was placed on the pedestal. -The C-S sample was re-pipetted up because of the small amount collected after DNase. All others were wiped with kim wipe.
The samples were then normalized to the concentration of 634.95 ng/µL by mixing with 0.1% DEPC-H2O to a volume of 20µL. Samples were then stored at -80° C.
Results
| Sample |
ng/µL |
A260 |
A280 |
260/280 |
260/230 |
| c-s |
1080.98 |
27.024 |
14.026 |
1.93 |
1.85 |
| c-m |
1225.91 |
30.648 |
15.657 |
1.96 |
1.96 |
| c-lg |
3448.76 |
86.219 |
56.773 |
1.52 |
1.5 |
| c-lg2 |
2219.91 |
55.498 |
29.207 |
1.9 |
1.94 |
| t-s |
590.07 |
14.752 |
7.686 |
1.92 |
1.66 |
| t-m |
1574.57 |
39.364 |
20.349 |
1.93 |
1.68 |
| t-lg |
846.6 |
27.024 |
11.179 |
1.89 |
1.05 |
The samples obtained from the small seastars are both suspect. The control had very little supernatant left, so the final "normalized" concentration is probably below the target 634.95 ng/µL. The test-small sample had much lower concentration than the others and was already below the target concentration. The two small samples should be about the same concentration however. The absorption ratios are within the range for a clean sample except for the c-lg in the 260/280 (1.8-2.0) and the t-lg in the 260/320 (1.5-2.0) ratio.
Next the primers need to be reconstituted and a working stock of 10µM solution will be made. Reverse transcription will be carried out for the RNA samples and then qPCR.
11/10/09
Summary
Restarted trials with 3 seastars in each tank. Exposed to Roundup, extracted gonad tissue and isolated RNA.
Procedure
Placed 3 seastars in control tank with 10 L of seawater. Placed another 3 in 10L of seawater and 4.0 mL of Roundup. Sizes were approximately small, medium and large in each tank. Ran trial for 30 min.
- Seastars in variable tank showing movement in response to treatment. Moving to the top of the water and sticking arms out of water in places. Large seastar in test group was slightly larger than the large in the variable group.
Removed seastars after 30 min. Cut open arms and extracted gonad tissue. Tissue was deposited into 1.5 mL tubes. Approximately 75 mg samples for each tube.
- The small seastars were difficult to extract gonad from. Tissues from the two small samples could be contaminated with other tissue.
Added 500 µL of TriReagent to each tube and homogenized with disposable pestle. Then added and additional 500 µL of TriReagent and vortexed for 15s. Added 200 µL of chloroform and vortexed each tube. - solution turned into a milky emulsion.
Incubated at room temperature for 5 min and then spun in refrigerated microfuge for 15 min. at max speed. Transferred clear aqueous phase to new tube for each replicate. Added 500µL of isopropanol to each new tube and mixed by inverting a couple of times. Tubes were then incubated at RT for 10 min, spun in refrigerated microfuge at max speed from 8 min.
-White pellets formed in each of the tubes.
Supernatant was removed from each of the tubes leaving only the pellet. 1mL of 75% EtOH was added and tubes were vortexed to dislodge the pellet. Tubes were then spun in refrigerated microfuge for 5 min. at 7500 g. Supernatant was again removed, briefly spinning to pool extra EtOH. Tubes were left open to dry for ~4 min. Pellets were then resuspended in 100µL fo 0.1% DEPC-H2O. -most of the pellets dissolved, a couple didn't dissolve completely.
Samples were then stored at -80 ° C
Results
Obtained RNA samples for each of the three trial and control seastars
Conclusion
Procedures ran smoothly. No problems forseen. Continue with quantification of RNA, DNase samples and begin qPCR.
11/09/09
Summary
Began experiment with seastars exposure to Roundup
Procedures
Filled two aquarium tanks with 10 L of seawater. Placed 4 seastars in each tank. Approximate sizes were 1 large, 2 medium, and 1 small for each tank. Added 4.4 mL of roundup to variable tank.
- Water foamed after mixing. Seastars showed increased movement in reaction to treatment with Roundup. Control seastars were fairly stationary.
Results
Seastars in variable tank died in less than 18hrs. Found too late to take sample.
Conclusion
Need to restart experiment with new trial.
11/3/09
Summary
Ran quantitative PCR. Worked on timeline for project with sea stars.
Procedures
Prepared master mix. Solution was made to run two samples with cDNA, two negative controls with water, two to check for genomic DNA using RNA and one extra to ensure enough mix was retrievable. Master mix contained 175 µL of 2X Immomix- 25µL per tube, 14 µL Syto-13 dye (50µM)- 2 µL per tube, 7 µL upstream primer- 1µL per tube, 7 µL downstream primer- 1 µL per tube and 133 µL ultra pure water- 19 µL per tube. 2 µL of cDNA, water and RNA dilution were added to two samples, controls and genomic checks respectively. This brought the total reaction volume in each tube to 50 µL. RNA was diluted at a ratio of 1:4 with 2 µL RNA and 6 µL ultra pure water. This was done to keep the same dilution used in other PCR tests. Reactions were loaded in to 6 white PCR tubes in the order of Smpl, Smpl, Cont, Cont, RNA, RNA. with the tab at the Smpl end. The wells were then loaded in the Opticon and run for 4 hrs. The cycling parameters can be found at:
http://skitch.com/macgavery/nf793/cycling-params-fish441.bmp
Results
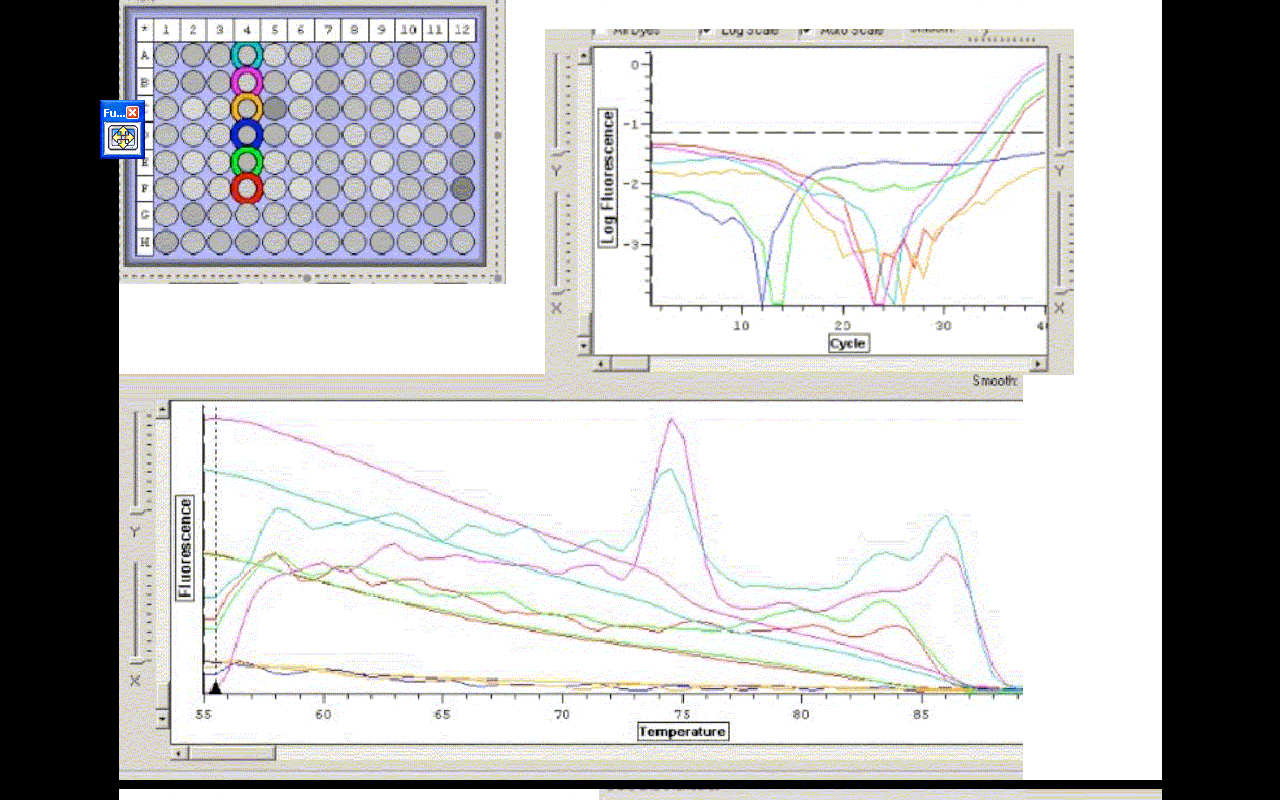
The efficiencies for A,B,E and F were- 72.44, 71.80, 71.34, 77.99 %
C(t) values for A,B,E, and F were- 35.06, 34.58, 36.97, 37.47
Conclusion
The two tubes with cDNA amplified. The controls with water did not. Those results were expected, however, the RNA samples amplified, which means there is probably DNA carryover in the smaples with cDNA. This is also apparent in the melting temp. profile. There are two distinct bumps, which most likely result from cDNA and carryover being present. The samples should be DNAased and re-run.
Timeline for Sea Star project.
Fri. 11/6 Order primers
Mon. 11/9 Transfer 8 starfish to aquaria. Add Roundup to variable tank.
Tue. 11/10 Extract and isolate RNA
Tue. 11/17 -
Tue. 11/24 Quantitate
Tue. 12/1 Interpret results/ write up
Tue. 12/8 Write up/ presentation
10/27/09
Summary
Ran PCR gel with prepared samples and blanks. Transferred proteins from gel to membrane (Western Blot). Blocking and antibody steps were carried out. Discussed topic for project, taxa and stress.
Procedures
PCR products on gels
Placed the gel in the box and filled with 1x TAE buffer until wells and gel were covered. Removed combs from wells. Loaded 7µL of 100 bp ladder into the far left lane. Loaded 25µL of control in the first lane, then the second control followed by the two PCR samples in the next two lanes.
-gels were loaded with 20-200 µL pipette. Loading went smoothly, but a small amount could have spilled outside the well.
Gel was run at 100v for 1 hr. Photos were taken of the gel on the UV transilluminator.
Western Blot
A new set of gels was created with our proteins. Lane 7 was filled with 12 µg (6.9µL) of herring heart protein.
The transfer buffer was cooled to 4°C. Filter paper, membrane and gel were all soaked in the transfer buffer for 15min.
-about 25 min.
In a semi-dry blotting apparatus the sandwich was assembled with the anode (+) on the bottom, filter paper, Nitrocellulose membrane, gel, filter paper and cathode(-) on top. Transfer was run for 30 min. at 20V. The membrane was removed and rinsed with transfer buffer.
-membrane was moved by only touching the corners to prevent contamination.
Prepared blocking solution with 14 mL ultra filtered water, 4 mL blocker A and 2 mL blocker B. Total solution was 20 mL. Membrane was placed in about 10 mL of blocking solution in a plastic dish with a cover. Dish was incubated on shaker for 30 min. at 1 rev/s. Blocking solution was drained and the membrane was rinsed with 20 mL of water for 5 min. Then rinsed again with 20 mL of water. The membrane was then incubated with 10 mL of Primary Antibody solution overnight. The Primary antibody solution consisted of 10mL blocking solution and 3.3 µL of HSP70 antibody.
Results
1 2 3 4 5 6 7 8
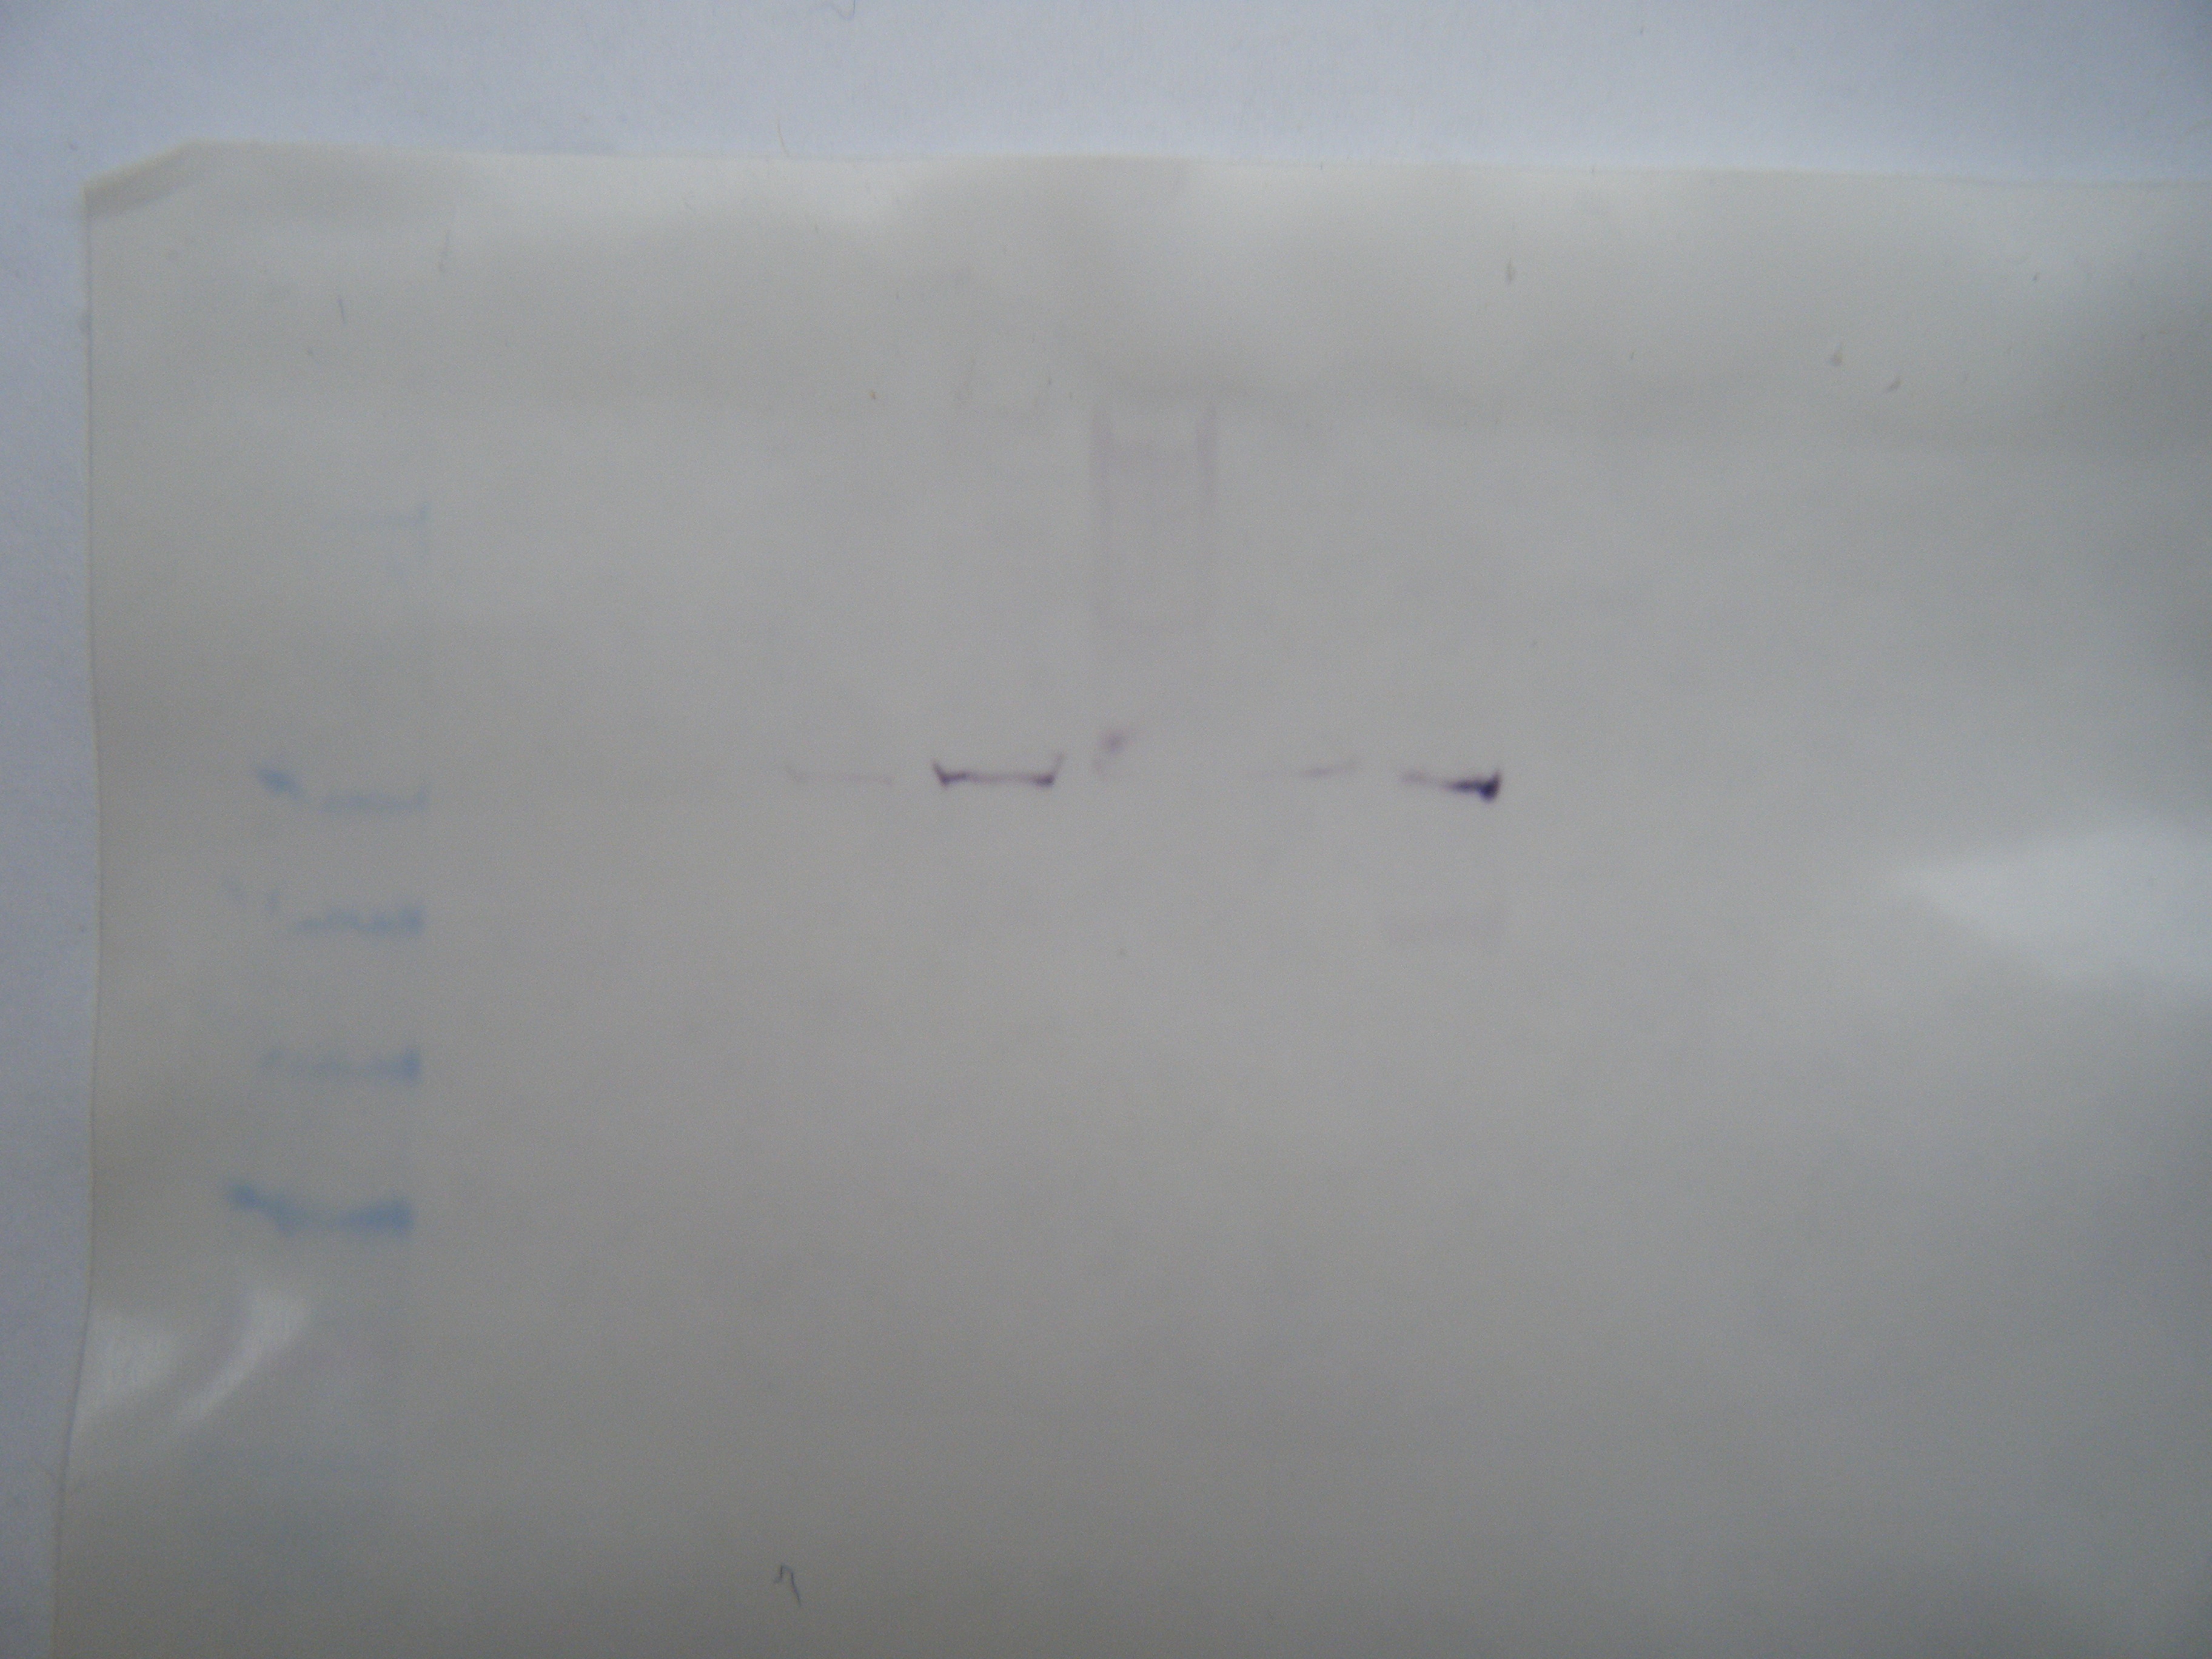

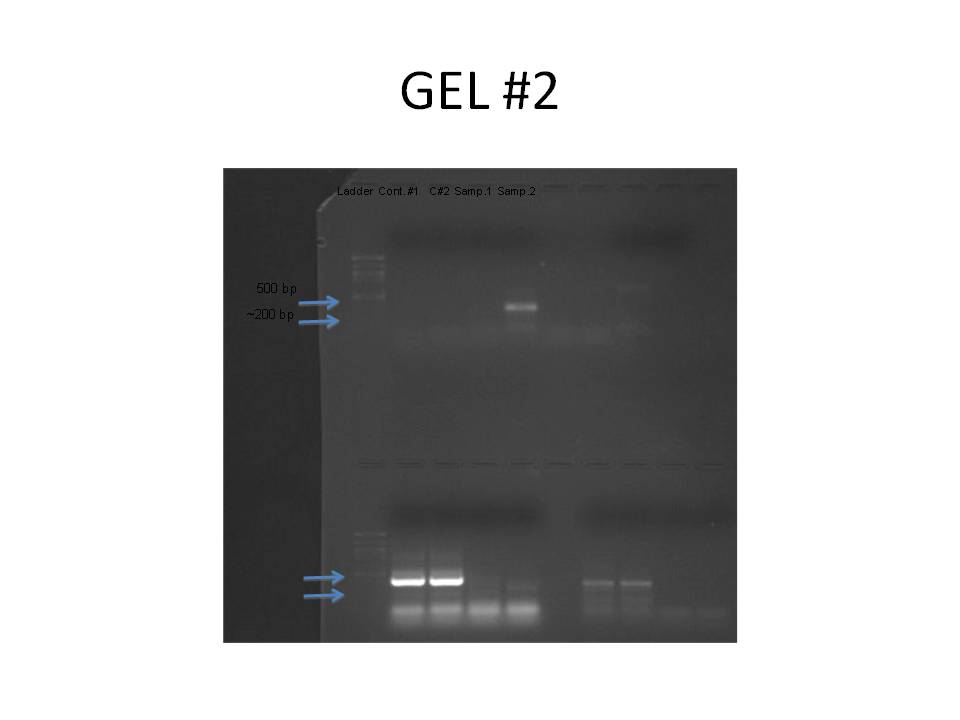
The primer designed was aimed at HSPb1 for herring heart tissue. The amplicon size was 180 bp. No bands showed up in the control wells for the PCR gel. The largest band that appeared was in sample #2 at ~500bp. This is too big to be the target sequence and probably resulted from genomic DNA. There is a hint of a band around 200bp in sample #2 but not in #1. The primer was designed using gene sequence from zebra fish, so it may not have been conserved in herring. The design of the primer may have been wrong as well.
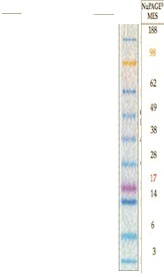
The Western Blot is difficult to read because the ladder on both the gel and the membrane is quite faint. There is an area of color on the membrane in lane #7 showing some HSP. The HSP is at the same mw for some of the other samples as well. It appears to about 38 kDa, which is also represented in the gel.
Next week we will run quantitative PCR
10/24/09
Summary
Performed RNA quantification using the Nanodrop. Measured A260 absorbance, RNA concentration, A260/280 and A260/320. Carried out reverse transcription, PCR and prepared agarose gel.Procedures
RNA quantificationCalibrated Nanodrop by placing 2
µL of 0.1% DEPC-H20 on pedestal and pressing “blank”. Used pipette to place 2
µL of RNA sample on pedestal, measured and recorded A 260 absorbance, RNA concentration in ng/mL as well as the A260/280 and A260/230 ratios. Cleaned off pedestal with a kim wipe and returned RNA sample to ice.
Reverse Transcription and PCR
Transferred 5
µL of RNA sample to new PCR tube along with 5
µL of PCR water. Incubated at 75°C for 5 min. in thermal cycler and then incubated on ice for 5 min. Added 4
µL of 5x buffer (AMV RT Buffer), 8
µL dNTPs (10mM total), 1
µL AMV Rtranscriptase, 1
µL Oligo dT Primer, and 1
µL Rnase free water. Vortexed, spot spun and incubated at RT for 10 min. Sample was then incubated at 37°C in thermocycler for 1 hr and then heat inactivated at 95°C for 3 min.
-
Reconstituted primers. Primer was 33.6 nM, so 336
µL of H2O was added to bring it to 100 mM and then further diluted to 10 mM, which was used as the working stock.
Prepared 50
µL reactions. Two with cDNA and 2 with water as a control. To each of the 4 tubes, 25
µL fo GoTaq Green Master mix was added, 2.5
µL of upstream primer and 2.5
µL of downstream primer. 2
µL of DNA template was added to 2 of the tubes and 2
µL of water was added to the other 2 tubes. Reactions were then loaded into the thermocycler.
Thermocycler Profile
95°C 10 min.
40 Cycles:
95°C- 30 sec
55°C- 30 sec
72°C- 90 sec
72°C 3 min
4°C - remainder
Prepared agarose gel. Weighed 2 g of agarose and mixed with 150 mL of 1 x TAE in a 1 L flask. Microwaved for 3 min.
-opened occasionally to prevent boil over.
Let solution cool for a minute and then added 12
µL of ethidium bromide. Mixed by swirling and then poured into gel tray. Added gel combs and let sit.
Results
Absorbance of RNA sample: A260= 5.807, A260/280= 1.89, A260/230= 1.74RNA concentration = 232.3 ng/mL,
Conclusion
The concentration of the RNA sample was similar to other values in the class. The ratios of A260/280 and A260/230 were both in the ranges of a clean sample, 1.8-2.0 and 1.5-20 respectively. All of the other procedures went smoothly and no problems are forseen.Perform western transfer immunoblots next week. PCR samples will be transferred to gel.
-
10/6/09
Began the process of isolating RNA from Herring heart tissue. Added TriReagent to tissue and froze. Extracted protein form a different sample of Herring heart using CelLytic MT solution. Determined the concentration of protein in sample using spectrophotometer.
Procedures
RNA Isolation
Added 500 mL of TriReagent to 1.5 mL snap cap tube containing 50 mg of herring heart. Used pestle to homogenize. Added another 500 mL of TriReagent and vortexed. Stored sample at -80° C.
- small piece of tissue remained in bottom of tube
Protein Extraction
Added 0.5 mL of CelLytic MT solution and 25 mg sample of herring heart tissue to a 1.5 mL snap cap tube. Used Pestle to homogenize and mix, then spun in microfuge for 10 min at max speed. Diluted 15mL of sample with 15mL of DI water. Created a blank with 30 mL of DI water. Added 1.5 mL of Bradford reagent to sample and blank, mixed and let sit at room temp. for 10 min. Transferred 1 mL of blank to clean cuvette and used it to zero the spectrophotometer. Transferred 1 mL of sample to a clean cuvette and measured absorbance at 595nm. Back calculated protein concentration using the standard curve equation. Stored sample at -20° C.
- Only measured absorbance of sample once
- Multiplied calculated protein concentration by 2 to account for dilution.
Results
Absorbance of protein sample- 0.862
872.26mg/mL =1011.9*(0.862)
872.26*2=1744.52 mg/mL protein
Conclusions
Need to verify that results are within expected range.
Continue with RNA isolation using chloroform.
Separate proteins using SDS - Polyacrylamide Gel Electorophoresis.
Begin design of primer.
10/15/09
Designed primer to target HSP27 (hspb 1). This heat shock protein has been shown to protect muscle fibers during heat stress, so it is a good choice for herring heart tissue. There wasn’t information on herring specifically, but the sequence was the same in many bony fish including zebrafish, so it is most likely conserved in herring as well.
The accession number: NM_001008615.
Primer forward: TGCAGGGCCCACCTGTGATG
Primer reverse: CCACACCAGGGGGCAGAGTG
10/16/09
RNA Isolation cont’d
Continued isolation of RNA from herring heart tissue. Separated RNA from other organic material by adding chloroform and then washed with ethanol. Separated proteins using SDS-Page.
Procedure
RNA Isolation
Thawed and incubated sample at RT for 5 min. Added 200 mL of chloroform and vortexed for 30 s. After incubating at RT for 5 min., the sample was spun in the microfuge for 15 min on high. Transferred the aqueous phase (on top) to a new microfuge tube, leaving the interphase.
-Solution was well separated. Left about 0.5mm of fluid on top of interphase to prevent contamination.
Added 500 mL of isopropanol to the new tube, mixed and incubated for 10 min. (closer to 12 min) Microfuged for another 8 min on high, then removed supernatant with small pipette.
-Small white pellet present at bottom of tube.
Added 1 mL of 75% EtOH to tube with pellet, vortexed briefly and microfuged at 7500 for 5 min. Removed the supernatant, spun in microfuge for a few seconds and removed the remaining EtOH. Let pellet dry with the cap of the tube open for 5 min. Added 100 mL of 0.1% DEPC-H20 and dissolved pellet.
-Pellet completely dissolved
Incubated at 55°C for 5 min. Removed, mixed and stored on ice for Quantification.
Protein Gel SDS-Page
Thawed protein extract and mixed. Added 15 mL of protein sample and 15 mL of 2X Reducing Sample Buffer. Mixed and centrifuged for 10 s. Sample was then boiled for 5 min. Gel box and gels were set up by Mac. Sample was centrifuged for 1 min. and then loaded into well 2 of the gel box. 4-20% Tris-HEPES gel was used.
-Only loaded 20 mL of protein solution into well. That might mean that there was some inaccurate pipetting when adding the protein sample to the reducing buffer.
Gel box was turned on to 150 V for 25 min. Gel was removed and put into container with Coomassie Stain and set on rocker for 5 min. Stain was poured out and gel was rinsed with 10% acetic acid. Gel was then incubated in acetic acid solution overnight and then removed by Mac.
Results
Amount of protein loaded into gel box. 1744.52 mg/mL *0.010 mL = 17.45 mg of protein.
kDA
188
98
62
49
38
28
17
14
6
3
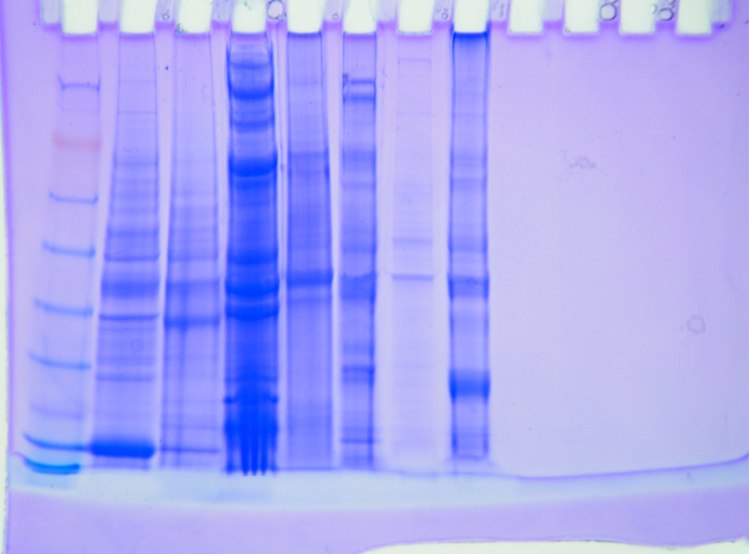
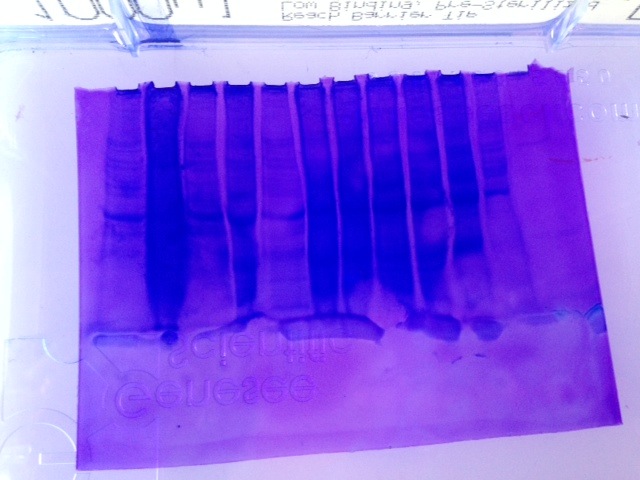

Conclusion
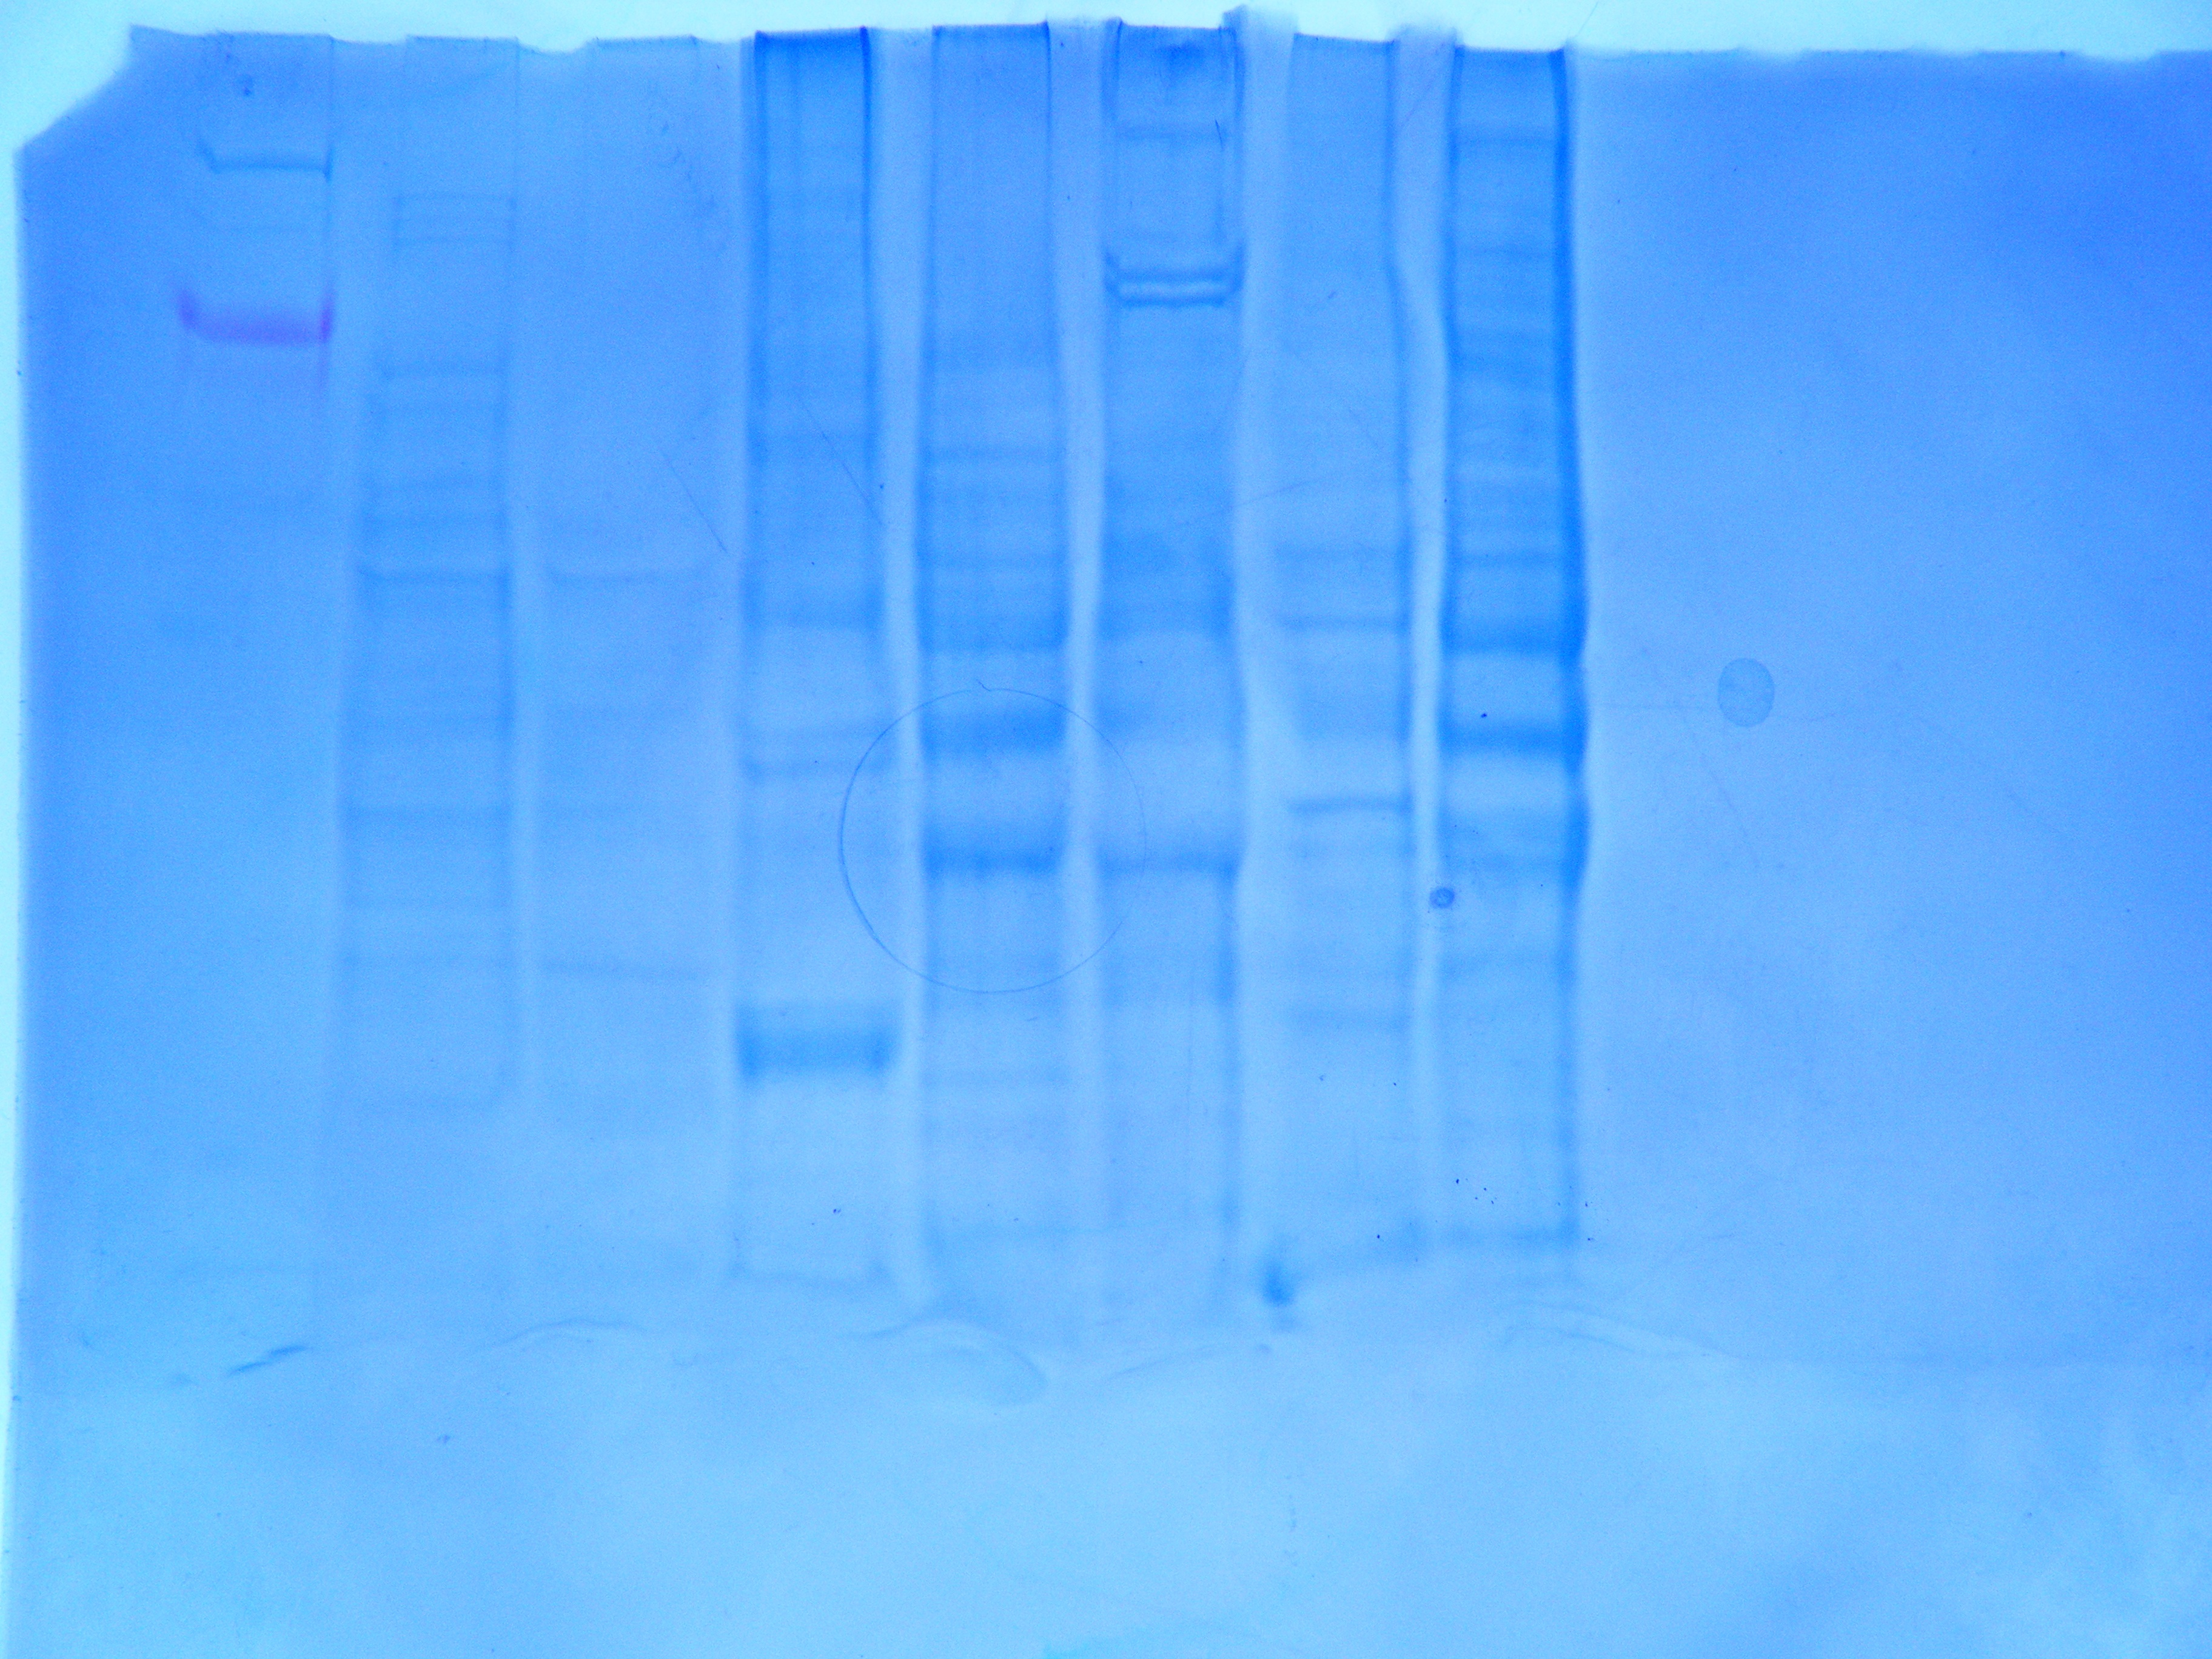
The protein gel shows a large band along the weight of 6 kDa. There are also definite bands at the 49 and 38 kDa weights. The second thickest band is in between 49 kDa and 38 kDa. Everyone appears to have had a band at that weight as well. The other distinctive mark is on either side of 26 kDa. There are no proteins specifically at that weight though. Continue with RNA quantification and PCR.