MeDIP analyses
A MeDIP procedure was performed to enrich for methylated DNA sequences by isolating methylated DNA fragments through an antibody raised against 5-methylcytosine. Results from MeDIP analyses indicated methylation changes as a result of heat shocks in both C. gigas and O. lurida. Graphing the ratio of methylated to unmethylated values indicated a 20% decrease in methylation between control and heat shock C. gigas samples. Similar results were seen for O. lurida, with decreasing methylation levels between control and 35° heat shock samples. Levels of methylated and unmethylated DNA were lower for O. lurida than C. gigas. We furthermore divided each expression value (10^(-(0.3012*Ct)+11.434) by the total amount of DNA in each reaction. These results confirmed higher values for methylated data than unmethylated for the same treatments. I furthermore found that methylation patterns were different between C. gigas and O. lurida, which is likely attributable to the differences in size between these species. In the future, I am hoping to repeat this experiment and incorporate more samples into my analyses and see if similar trends hold true. The fact that methylation decreased between control and treatment samples is an interesting find.
12/3/12
MeDIP Protocol- Day 4
Ethanol precipitation of MeDIP genomic DNA was finished. The samples were pelleted at 16,000g at 4°C for 30 minutes. The supernatant was discarded and samples were washed with 1mL of 70% ethanol and pelleted at 16,000g at 4°C for 15 minutes. The supernatant was discarded and the MeDIP DNA was resuspended in 100uL of TE (pH=8.5). The wash samples (containing unmethylated DNA) were resuspended/combined in a total of 100uL of TE (pH=8.5). Samples were quantified on the nanodrop.
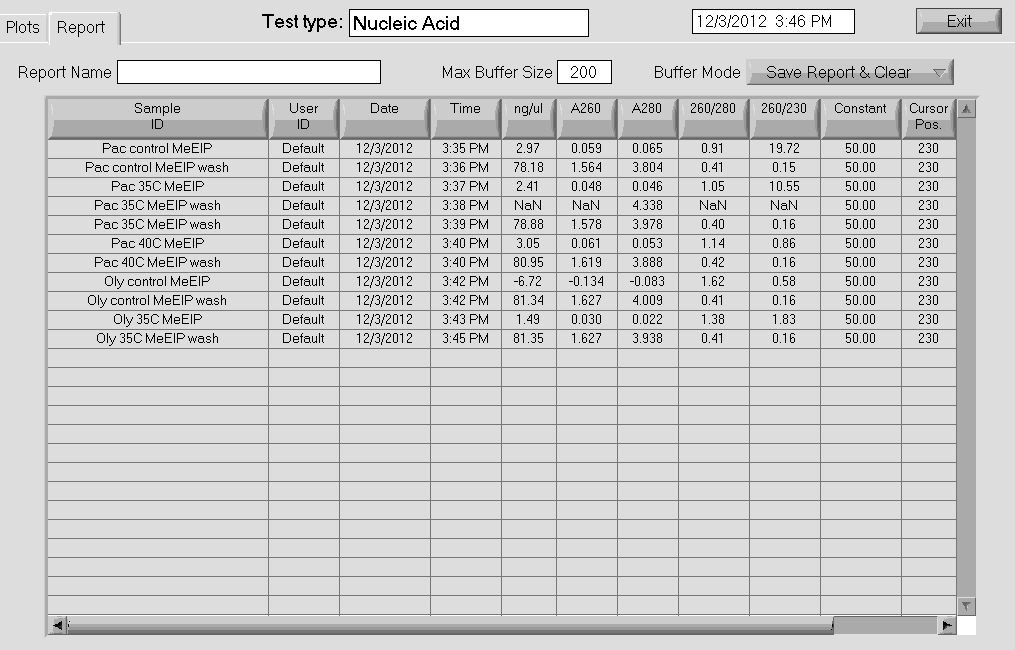
Nanodrop results- MeDIP procedure
Note: Wash samples contain unmethylated DNA, MeDIP samples contain methylated DNA. My samples either didn't contain any methylated DNA or the methylated DNA was lost at some point during the recovery process. My MeDIP DNA samples will be further verified using qPCR to examine chaperonin gene expression.
http://eagle.fish.washington.edu/Mollusk/MeDIP_nanodrop_12312.jpg
11/30/12
MeDIP Protocol- Day 3
DNA samples were phenol:chloroform:isoamyl alcohol extracted and then purified by an ethanol precipitation. An equal volume (250uL) of phenol:chloroform:IAA was added, tubes were vortexed and spun at 12,500g for 5 minutes at 4°C. The aqueous phase was transfered to a new tube and an equal volume of chloroform was added (250uL), and the tube was vortexed and spun at 12,500g for 5 minutes at 4°C. The aqueous phase was transferred to a new tube and 0.1 vols 3M NaOAc (pH=5.2), 2.5 vols of 100% EtOH were added to each tube. Tubes were mixed and stored at -20°C over the weekend. Precipitation will be finished and quantified for recovery next week.
11/29/12
MeDIP Protocol- Day 2
Protein A/G Beads (Santa Cruz Biotech) were prewashed on PBS-BSA 0.1% and resuspended in 40uL 1x MeDIP IP Buffer. Washed included incubation for 5 minutes at 4°C on a rotating platform and then centrifugation at 6000 rpm for 2 minutes. Tube was removed and supernatant was saved to retain unmethylated DNA. This process was then repeated two more times. Beads-DNA-antibody complex were then resuspended in 250uL MeDIP Digestion Buffer (50mM Tris HCl pH 8, 10mM EDTA, 0.5% SDS) and 3.5uL of proteinase-K (20mg/mL) was added to each sample and then incubated overnight at room temperature on a rotating platform.
*Note*: The protocol we have says to incubate the Proteinase K digest @ 55C. However, I don't have a means to do so, since we need a rocker/rotator to keep the agarose beads in suspension. According to various sources, Proteinase K retains >80% of it's enzymatic activity between 20C-50C. So, the digest was allowed to run longer (24hrs) than recommended (O/N).
11/28/12
MeDIP Protocol- Day 1
DNA was extracted from gill tissue samples (see 11/15/12) and sheared on a Covaris to approximately 800-1000bp. Sheared DNA was resuspended in 350uL of TE and denatured/heated for 10 minutes at 95°C and then immediately placed on ice for 5 minutes. After incubation, 100uL of 5x MeDIP IP Buffer (50mM Sodium phosphate pH7, 700 mM NaCl, 0.25% Triton X-100) was added to the sonicated and denatured DNA. An overnight incubation of the DNA was performed with 5ug of antibody anti-5-methylCytidine monoclonal (Diagenode S.A.) at 4°C on a rotating platform.
11/27/12
qPCR for Chaperonin protein
Summary of Lab:
Ran qPCR for my primer of interest (chaperonin-containing TCP1 subunit 7 isoform b) on Pacific oyster control and heat shock cDNA samples. I ran 30 samples and 2 blanks with my primer set and this data was normalized to X to get a relative level of gene expression among samples. Gene expression levels between samples and among treatments were compared and a T-test was performed to test for statistical significance.
Materials
Sterile pipettes and tips, 1.5mL microcentrifuge tube for master mix, tube rack, tip waste jar, 0.5mL PCR tubes, cDNA, Sybr 25X, MasterMix 2X (Immomix), 10uM primer F, 10uM primer R, nuclease-free water, thermal cycler, kimwipes, microfuge tube rack, PCR tube rack, ice bucket, gloves.
Methods
We prepared 25uL qPCR reactions using Pacific oyster gill cDNA tissues for our template. I made reaction mastermix for 35 reactions, which included my template samples, two negative controls and room for pipetting error. We prepared mastermixes by calculating the total volume required for each component of the mastermix, then pipetting each reagent, mixing, and adding the master mix aliquot to our strip tubes. The following volumes were added:
| Reagent |
1 Reaction |
35 Reactions |
| Master Mix 2x (Immomix) |
12.5uL |
437.5uL |
| Sybr 25x |
1uL |
35uL |
| 10uM primer F |
1.25uL |
43.75uL |
| 10uM primer R |
1.25uL |
43.75uL |
| Sterile Water |
7uL |
245uL |
A 1-10) Pacific oyster control #1-10
A 11-12, B 1-8) Pacific oyster 35°C #31-40
B 9-12, C 1-6) Pacific oyster 40°C #41-50
C 7-8) Blank A and B
The qPCR conditions were as follows:
1) 95°C for 10 minutes
2) 95°C for 15 seconds
3) 55°C for 15 seconds
4) 72°C for 30 seconds plus plate read
5) Return to step 2, 39 more times
6) 95°C for 10 seconds
Raw data transformation for analysis:
Data was downloaded from qPCR machine and rows were changed using the concatenate function to join cell gene names with sample numbers. Data was pasted into qPCR miner (http://www.miner.ewindup.info/Version2) and run. Results were copied and pasted into Excel and normalizing was pasted into the same data file. The R(0) value was calculated using the formula: 1/(1+average efficiency)^Ct for each sample. The normalized gene expression value for each sample was calculated by dividing the gene of interest R(0) by the normalizing R(0). A t-test was performed to assess the differences between samples and between heat shock treatments.
Results
Relative gene expression of chaperonin protein as seen in control, 35°C and 40°C heat shock treatments is shown below. In general, gene expression increases as temperature increases, however the only significant difference was between control and 40°C heat shock Pacific oysters. Gene expression of individual samples is shown below as well.


Conclusion
A significant difference was seen between control oyster and 40°C heat shock samples with a p-value of 0.001. There was a significant difference between control versus 40°C heat shock samples, meaning that the oyster proteins required the help of the chaperonin gene to stabilize protein conformation. The chaperonin gene was likely preventing proteins from unfolding during the heat shock stress. The p-value between oyster control and 35°C heat shock samples was 0.10, however this is not statistically significant. A relatively high variation was seen between samples of the same treatment, which may be a product of different oyster sizes. As a result this caused high standard deviation values for each treatment. My overall trends indicated increasing gene expression as temperature increased, meaning that the chaperonin gene was up-regulated during temperature stress.
Summary
Due to the sensitive nature of qPCR, there were a lot of variation per treatment. In order to lower the standard deviation values, I would suggest running samples in biological duplicates or triplicates and then averaging these values per sample.
11/26/12
Shearing DNA for MeDIP protocol
DNA was extracted from gill tissue samples (see 11/15/12) and sheared to the 800-1000bp for MeDIP (Methylated DNA Immunoprecipitation) procedure. All DNA was quantified and diluted to a total of 10ug at 100uL each. Therefore, equal amounts of DNA was added to the MeDIP protocol. 10ug of genomic DNA was subjected to series of three 20 pulse sonications at 20% amplitude (Covaris S-series Sonolab Series v2.54). Fragment size was verified through a 1% agarose gel with approximately 800bp in size.
11/15/12
DNA Extractions
Summary of Lab:
Extracted 5 samples for DNA from our experimental samples. These samples will be used to perform a MeDIP procedure in order to examine changes in methylation. The MeDIP procedure will be performed with chaperonin PCR primers to enrich for methylated DNA sequences.
Materials
Sterile pipettes and tips, 1.5mL microcentrifuge tubes, tube rack, sterile pestles, vortexer, ice buckets, gloves, lab pens, microcentrifuge, razor blades, weigh boats, scale, kim wipes, safety glasses, nanodrop, 100% ethanol, 75% ethanol, 0.1% DEPC Water, Tri-Reagent, DNAzol, and oyster gonad tissue.
Methods
Samples extracted were Pacific oyster control, 35°C and 40°C heat shocks, and Olympia oyster control and 35°C heat shock. Sterile tubes were obtained and labelled with sample name, initials (CHE), the date (11/15/12) and DNA. Tissue was trimmed with a razor blade and weighed to the approximate amount of tissue required for a DNA extraction, about 30 mg. All samples were kept on ice and gloves were worn throughout the procedure to prevent RNase contamination.
DNA Extraction
500uL of DNazol was added to the 1.5mL microcentrifuge tubes containing female oyster gill tissues intended for DNA isolation. Using a different sterile pestle to prevent-cross contamination between reagents, the sample was homogenized in DNazol. After homogenization, an additional 500uL of DNazol was added to the same tube, bringing the total volume up to 1mL. 2.3uL of Proteinase K was added to each tube and the samples were incubated overnight on a rotator. The homogenate was sedimented by spinning in a microcentrifuge for 10 minutes at 10,000 rpm (g). This step removed insoluble tissue fragments, partially hydrolyzed RNA and excess polysaccharides from the lysate. The resulting supernatant was transferred to a new labeled tube and the DNA was precipitated by adding 500mL of 100% ethanol. DNA and ethanol were mixed by inverting the tube 5-8 times to form a homogenous solution. DNA became visible as a cloudy precipitate as the top layer of the solution. It was difficult to remove the DNA precipitate, so the sample was centrifuged for 5 minutes at 5,000 rpm (g). The supernatant was discarded from this tube and the resulting pellet was further processed. The DNA pellet was washed twice with 1mL of 75% ethanol. For each wash, the DNA was suspended in ethanol by inverting the tube about 6 times, storing the tube for 1 minute at room temperature, and the ethanol was removed by pipetting. Any remaining ethanol left after these washes was removed with a small pipette. 150uL of 0.1% DEPC water was added to the tube and the DNA pellet was dissolved in the water and quantified.
DNA Quantification
DNA was quantified using a nanodrop spectrophotometer. "Nucleic Acid" was selected from the nanodrop software menu and 2uL of sterile water was added to the pedestal. We then selected "dsDNA" (double-stranded DNA) form the pulldown menu on the right side, and clicked "Blank" to zero the instrument and set water as the blank for our sample. Since our sample was diluted in water, we use this to blank our sample. For each DNA sample, 2uL was added to the pedestal, the arm was lowered, and "Measure" was clicked to obtain our DNA concentration. Using the Beer-Lambert Law, the concentration of our DNA was calculated. After quantification, samples were stored in a -20°C freezer.
Results
DNA concentration and nanodrop values were as indicated
Pacific control:
334.1 ng/uL
7.579 Abs.
260/280: 1.80
260/230: 0.88
Total DNA concentration= 50,115ng= 50.115ug
Pacific 35°C:
320.7 ng/uL
10.027 Abs.
260/280: 1.76
260/280: 0.64
Total DNA concentration= 48,105ng= 48.105ug
Pacific 40°C:
120.4 ng/uL
2.216 Abs.
260/280: 1.88
260/230: 1.09
Total DNA concentration= 18,060ng = 18.06ug
Olympia control:
446.3 ng/uL
9.593 Abs.
260/280: 1.71
260/230: 0.93
Total DNA concentration= 66,945ng= 66.945ug
Olympia 35°C:
487.9 ng/uL
10.688 Abs.
260/280: 1.73
260/230: 0.91
Total DNA concentration= 73,185ng= 73.185ug
Conclusion
I was able to successfully extract DNA from all of my experimental oyster samples. On Tuesday 11/20/12 I will shear these DNA samples to be between 800-1000bp and will perform the MeDIP protocol. I will use gill tissue from the Pacific and Olympia oyster both before and after a temperature shock, using MeDIP to assess differences in methylation patterns.
Reflection
These methods will aim to provide characterization of DNA methylation patterns in the Pacific and Olympia oyster. After shearing and immunoprecipitating my DNA I will be able to perform the MeDIP procedure to examine methylated DNA sequences.
11/13/12
RNA Extractions
Summary of Lab:
Extracted 6 samples for RNA from our experimental oyster samples. I extracted gill tissue from Pacific oysters heat shocked at 40°C and still have 7 RNA extractions left to do which will be completed on 11/19/12 (samples 41-50 and Pacific control samples 13-15). These samples along with Pacific and Olympia oyster heat shock samples at 35°C will be used for gene expression analyses as a general indicator of cellular stress.
Materials
Sterile pipettes and tips, 1.5 mL microcentrifuge tubes, tube racks, lab coats, safety glasses, gloves, lab pens, timers, ice buckets filled with ice, phenol/chloroform waste containers (both liquid and solid), vortex, hot water bath, nanodrop spectrophotometer, chloroform, RNase free water, isopropanol, 75% ethanol, 0.1% DEPC treated water, and oyster gonad tissue previously isolated and incubated in Tri-Reagent.
Methods
RNA Extraction
Gloves were worn at all times during this protocol to prevent contamination from RNases and were kept on ice when possible to prevent activity of RNases in samples. 6 Pacific oyster samples heat shocked at 40°C were processed for RNA extractions. These samples each weighed approximately 75 mg. Samples were obtained from the freezer and incubated at room temperature for 5 minutes. While samples were incubating we made sure the water bath was set to 55°C. In the fume hood, we added 200uL of chloroform and vortexed the tube vigorously for 30 seconds. The resulting solution appeared cloudy, which is an indicator of correct vortexing. The tube was incubated for 5 minutes at room temperature and then spun in a cold microfuge for 15 minutes at maximum speed. The tube was removed from the microfuge and the resulting substance had three layers: an upper aqueous phase, middle interphase, and lower organic phase. Our RNA was located in the upper aqueous phase, which is what we pipetted off, making sure not to disturb any of the other layers. The aqueous phase was transferred to a new clean and labeled microcentrifuge tube and 500uL of isopropanol was added to this tube. The tube was mixed by inversion until the solution appeared to be uniform. This solution was incubated for 10 minutes at room temperature, then spun in a cold microfuge for 8 minutes at maximum speed. A small white pellet was present after this spin, which was my isolated RNA. The isopropanol supernatant was removed and 1mL of 75% ethanol was added to the pellet. The tube was vortexed and spun in a cold microfuge for an additional 5 minutes at 7500g. After the spin, all traces of ethanol were removed by pipetting and allowing the tube to dry at room temperature for about 5 minutes. The RNA pellet was suspended in 100uL of 0.1% DEPC-H2O and mixed by pipetting to ensure the pellet dissolved in water. To solubilize the RNA, the tube was incubated in the water bath for 5 minutes at 55°C. Samples were labelled with my initials (CHE) the date and the word "RNA" and sample number.
RNA Quantification
RNA was quantified using a nanodrop spectrophotometer. "Nucleic Acid" was selected from the nanodrop software menu and 2uL of sterile water was added to the pedestal. We then selected "RNA-40" from the pulldown menu on the right side, and clicked "Blank" to zero the instrument and set water as the blank for our sample. Since our sample was diluted in water, we use this to blank our sample. For each RNA sample, 2uL was added to the pedestal, the arm was lowered, and "Measure" was clicked to obtain our RNA concentration. Using the Beer-Lambert Law, the concentration of our RNA was calculated. After quantification, samples were stored in a -80°C freezer.
Results
RNA concentration and nanodrop values were as indicated
(will nanodrop on 11/20/12)
Total RNA concentrations
| Sample Name |
Concentration |
Total RNA Concentration |
Absorbance |
260/280 |
260/230 |
| Pacific 40°C #41 |
614.9 ng/uL |
61,490ng/61.49ug |
8.070 |
1.98 |
1.90 |
| Pacific 40°C #42 |
673.1 ng/uL |
67,310ng/67.31ug |
9.928 |
1.99 |
1.69 |
| Pacific 40°C #43 |
864.9 ng/uL |
86,490ng/86.49ug |
12.021 |
1.95 |
1.80 |
| Pacific 40°C #44 |
1059.9 ng/uL |
105,990ng/105.99ug |
15.742 |
2.03 |
1.68 |
| Pacific 40°C #45 |
325.0 ng/uL |
32,500ng/32.5ug |
6.149 |
2.20 |
1.32 |
| Pacific 40°C #46 |
1026.6 ng/uL |
102,660ng/102.66ug |
13.936 |
1.93 |
1.84 |
| Pacific 40°C #47 |
593.4 ng/uL |
59,340ng/59.34ug |
9.097 |
1.94 |
1.63 |
| Pacific 40°C #48 |
666.2 ng/uL |
66,200ng/66.62ug |
12.531 |
1.91 |
1.33 |
| Pacific 40°C #49 |
1024.4 ng/uL |
102,400ng/102.4ug |
14.665 |
2.03 |
1.75 |
| Pacific 40°C #50 |
781.3 ng/uL |
78,130ng/78.13ug |
15.687 |
1.98 |
1.25 |
| Pacific control #11 |
406.2 ng/uL |
40,620ng/40.62ug |
7.070 |
1.92 |
1.44 |
| Pacific control #12 |
1037.1 ng/uL |
103,710ng/103.71ug |
15.537 |
1.92 |
1.67 |
| Pacific control #13 |
883.0 ng/uL |
88,300ng/88.3ug |
13.278 |
1.96 |
1.66 |
RNA extractions were successfully completed on 13 Pacific oyster samples that were heat shocked at 40°C. Next lab I will create cDNA from these RNA samples and perform qPCR to examine gene expression of the chaperonin protein.
Reflection
I will use these RNA samples along with Pacific and Olympia oyster control RNA and 35°C heat shock tissues. These samples will be used to examine gene expression levels of the chaperonin protein by comparing the amount of DNA amplified in qPCR between heat shock treatment samples. This will help describe the cellular response to heat shock stress with different temperatures.
11/6/12
Lab 7- Protein SDS/PAGE and Western Blot, Agarose Gel and analysis of qPCR data
Summary of Lab:
Olympia oyster extracted protein samples were run on a Western blot immunodetection and Pacific oyster conventional PCR samples were run on an agarose gel. We also analyzed the results of our qPCR data and were able to determine the efficiency of our designed primers. These procedures allowed us to visualize the results of our protein and DNA extractions.
Protein Analysis
Materials
Sterile pipettes and tips, gel loading tips, tip waste jar, 1.5mL screw cap tubes, microfuge tube rack, heating block with water bath, floatie for holding tubes in water bath, glass container to hold heated tubes, protein gel box, SDS/PAGE gels, staining trays, power supply, platform shaker/rotator, plastic wrap, 2X SDS reducing sample buffer, protein ladder marker (SeeBlue Plus2 from Invitrogen), gel running buffer, nanopure water, blocking solution, primary antibody solution, chromogenic substrate, Tris-Glycine transfer buffer, filter paper, nitrocellulose membrate, semi-dry transfer solution, light box, camera, gloves.
Methods
SDS-Polyacrylamide Gel Electrophoresis (SDS-PAGE)
Water was boiled in a glass beaker on a hot plate. 15uL of our previously extracted protein stocks was added to a sterile screw-cap tube and 15uL of 2X Reducing Buffer was added to the same tube. We mixed the sample by pipetting or flicking the tubes and our tubes were briefly spun down to collect the liquid on the bottom of the tubes. Samples were boiled for 5 minutes, and immediately centrifuged for about 1 minute to pool the liquid. While samples were boiling, we prepared the gel rig by adding the pre-packaged gel, pouring buffer into the gel box, and rinsing gel wells with buffer. Samples were loaded into the appropriate wells using gel loading tips. The lid was placed on the gel box and electrodes were plugged into the power supply, and the protein gel was run for 35 minutes at 150 volts. During this time, we set up the procedure for the Western Blot protocol (see methods for Western Blot below). After the protein gel had been run, the power supply was turned off and gel box was disconnected. We removed the lid from the gel box and disengaged the tension wedge. The gel was removed from the gel box and the cassette was cracked open to expose the gel. Wells at the top of the gel were trimmed and we made a notch in the top left corner of the gel so that it could be correctly oriented for the Western Blot procedure.
WesternBreeze Chromogenic Western Blot Immunodetection
Filter paper, membrane and gel were soaked in Tris-Glycine Transfer Buffer for about 15 minutes. The blotting "sandwich" was assembled in the semi-dry blotting apparatus in the following order: Anode (+), filter paper, membrane, gel, filter paper, cathode (-). There were 4 pieces of filter paper on each side. The blot was transferred for about 30 minutes at 20 volts and the gel was removed from the "sandwich" and rinsed off with transfer buffer. The membrane was washed 2 times for 5 minutes each, and with 20mL of pure water. The membrane was put in a plastic box and 10mL of blocking solution was added. This was then covered and incubated overnight. The rest of the protocol was done by Mackenzie our TA, and we were able to visualize the results of our Western Blot the next day. The liquid was decanted and and the membrane was rinsed with 20mL of water for 5 minutes, then decanted and repeated again. The membrane was incubated with 10mL of Primary Antibody Solution and decanted. The membrane was then rinsed with 20mL of Antibody Wash (1:3000) for 5 minutes, then decanted and repeated 3 times. The membrane was rinsed with 20mL of pure water for 2 minutes, then decanted and repeated twice. Lastly, the membrane was incubated in 5mL of Chromogenic Substrate until a purple band appeared. The membrane was dried on a clean piece of filter paper to the open air and visualized on a light box. The development time was about 60 minutes.
Agarose Gel Electrophoresis
Materials
Sterile pipettes and tips, tip waste jar, 1L flask, agarose, 1X TAE, ethidium bromide, microwave, gel rigs and gel box, kimwipes, gloves.
Methods
Our agarose gel was pre-prepared by Mackenzie our TA so we had the convenience of just loading our sample into the gel. To pour an agarose gel, 2g of agarose is weighed and mixed with 150mL of 1x TAE in a 1L flask. This solution is then microwaved for about 3 minutes, making sure it doesn't boil over. The solution should be clear with no precipitate. The solution was cooled a bit then 12uL of ethidium bromide was added to the solution. Since ethidium bromide is a carcinogen gloves should be worn at all times. The solution was mixed thoroughly by swirling, then poured into a gel tray. The gel combs were quickly added and bubbles in the gel were popped using a gel tip. The gel was left alone to set, which takes about 20 minutes. For the electrophoresis procedure, we placed the gel in the gel box, and this was filled with 1x TAE buffer to fully cover the wells. Combs were removed from the wells and 7uL of our ladder (Hyper Ladder II from Bioline) was added to the far left lanes on the top and bottom of the gel. About 25uL of our PCR reactions were added to the gel and the gel was run for about an hour at 100 volts. The resulting product was visualized on a UV transilluminator.
Results
My extracted protein samples for Olympia oyster gill with heat shock at 35°C were run on a gel along with controls and other experimental protein extractions. The following numbers in each lane correspond to these Olympia oyster samples:
L=Ladder
1&2 = Olympia oyster pre-stress
3&4 = Olympia oyster heat shock at 35°C
5&6 = Olympia oyster gradual temperature increase of 35°C
7&8 = Olympia oyster control
The lanes that included my protein samples (3&4) were much lighter than the other lanes, meaning that my samples likely had less protein than the other Olympia gill samples. This was confirmed last week when my calculated protein concentrations from the spectrophotometer were less than other's protein concentrations in our class.

The Western blot was used to bind an antibody to a protein and measure the amount present. For this experiment, we examined HSP70 protein binding on gel, which is a general stress response gene. If this protein is present, we would expect binding in the 70 kilodalton range. Interestingly enough, our control (lane 8) were the only samples that indicated the presence of HSP70. No other samples had a band in the 70 kilodalton range, indicating that HSP70 was not being highly expressed at the time these oysters were sampled.

Our PCR samples were run out on an agarose gel for visualization. My PCR templates were Pacific oyster cDNA and gDNA as well as duplicate negative controls. My two samples are indicated in brackets and the samples next to them are my negative controls. There isn't a band in these wells, which is what we would expect since there is no amplification for negative controls. Pacific oyster DNA was run with my designed chaperonin primers, so the expected size of my fragments are 167 base pairs. The two bands highlighted on the gel are about 167 bp, indicating that this fragment was amplified during PCR. My bands are clear and distinct, indicating that my primers are likely successfully designed.

I was furthermore able to visualize the results from my qPCR last week. I received the following Cq values:
A) Pacific oyster gonad A- 26.07
B) Pacific oyster gonad B- 25.86
C) Pacific oyster gill A- N/A
D) Pacific oyster gill B- N/A
E) Pacific oyster gDNA A- 24.93
F) Pacific oyster gDNA B- 25.05
G) Blank A- N/A
H) Blank B- N/A
Conclusion
We received many important results from this lab. It was interesting to visually see protein concentrations by running our product out on a gel, as well as performing a Western blot. It was surprising that the only HSP70 protein binding that occurred for the Olympia oyster was for a control sample, and this is something that warrants further examination. For my qPCR results, I was surprised that there wasn't any amplification for Pacific oyster gill tissue, when there was amplification for gonad tissue. However, this could be due to the fact that the tissues came from different organisms, so gene expression levels would be different. I will be interested in comparing gene expression levels from this experiment to those from our Pacific oyster samples that were heat shocked at 35°C and 40°C. I would expect that gene expression levels of the chaperonin protein will be greater in samples that have been heat shocked, since this gene is important in maintaining cell viability in response to stress.
Reflection
Our SDS-PAGE gel seperated our proteins according to size and conformation, and the Western Blot was used to probe the separated proteins with protein-specific antibodies. For the Western blot, our control (lane 8) was the only sample that indicated the presence of HSP70, indicating that these oysters were under some kind of environmental or physical stress. This could be due to the fact that the Olympia oysters were spawning at the time they were sampled, or any other number of factors. To further test this finding, I would perform qPCR on both control and heat shocked Olympia oyster samples using HSP70 and chaperonin primers to examine gene expression. It would be interesting to use this procedure to compare gene expression levels between control Olympia oysters and those that have been heat shocked. The methods we have learned in lab so far will be helpful when I am working on my own project, examining gene expression levels of chaperonin protein and determining DNA methylation levels on oysters that were heat shocked.
10/30/12
Lab 6- Conventional PCR, qPCR and Protein Isolation
Summary of Lab:
Pacific oyster DNA samples were amplified using PCR and proteins were isolated from samples. We performed conventional PCR on both genomic DNA and cDNA samples and qPCR on both Pacific oyster gonad and gill cDNA and gonad gDNA. We furthermore did a protein extraction on oyster tissue to determine the total protein concentration using the Bradford protein assay.
Conventional PCR
Materials
Sterile pipettes and tips, 1.5mL microcentrifuge tube for master mix, tube rack, tip waste jar, 0.5mL PCR tubes, cDNA and gDNA, 2X Apex Red, 10uM primer F, 10uM primer R, nuclease-free water, thermal cycler, kimwipes, microfuge tube rack, PCR tube rack, ice bucket, gloves.
Methods
We prepared 25uL PCR reactions using both Pacific oyster gonad cDNA and gDNA tissues for our template. I made reaction mastermix for 5 reactions, which included my template samples, two negative controls and room for pipetting error. We prepared mastermixes by calculating the total volume required for each component of the mastermix, then pipetting each reagent, mixing, and adding the master mix aliquot to our strip tubes. The following volumes were added:
| Reagent |
1 Reaction |
5 Reactions |
| 2X Apex Red |
12.5uL |
62.5uL |
| 10uM primer F |
1uL |
5uL |
| 10uM primer R |
1uL |
5uL |
| Sterile Water |
8.5uL |
42.5uL |
| Step |
Temperature |
Time |
Cycles |
| Denaturation |
95°C |
5 minutes |
1 |
| Denaturation |
95°C |
30 seconds |
40 |
| Annealing |
55°C |
30 seconds |
40 |
| Extension |
72°C |
90 seconds |
40 |
| Final Extension |
72°C |
3 minutes |
1 |
| Hold |
4°C |
forever |
1 |
Quantitative PCR
Materials
Sterile pipettes and tips, 1.5mL microcentrifuge tube for master mix, tube rack, tip waste jar, 0.5mL qPCR tubes (white with clear caps), cDNA and gDNA, 2X Immomix, Syto-13 dye, forward primer, reverse primer, nuclease-free water, qPCR machine, kimwipes, microfuge tube rack, PCR tube rack, ice bucket, gloves.
Methods
I prepared 25uL qPCR reactions using Pacific oyster gonad and gill tissue cDNA as well as Pacific oyster gonad gDNA. Each sample was furthermore run in duplicates (A and B). A reaction mastermix for 9 reactions was made, which included negative controls or blanks and an extra well for pipetting error. We prepared mastermixes by calculating the total volume required for each component of the mastermix, then pipetting each reagent, mixing, and adding the master mix aliquot to our strip tubes. The following volumes were added for qPCR reactions:
| Component |
Volume |
Final Concentration |
9 Reactions |
| Master mix, 2X (Immomix) |
12.5uL |
1x |
112.5uL |
| Syto-13 dye (50uM) |
1uL |
2uM |
9uL |
| Forward Primer |
1.25uL |
2.5uM |
11.25uL |
| Reverse Primer |
1.25uL |
2.5uM |
11.25uL |
| Sterile Water |
7uL |
NA |
63uL |
A) Pacific oyster gonad A
B) Pacific oyster gonad B
C) Pacific oyster gill A
D) Pacific oyster gill B
E) Pacific oyster gDNA A
F) Pacific oyster gDNA B
G) Blank A
H) Blank B
The qPCR conditions were as follows:
1) 95°C for 10 minutes
2) 95°C for 15 seconds
3) 55°C for 15 seconds
4) 72°C for 30 seconds plus plate read
5) Return to step 2, 39 more times
6) 95°C for 10 seconds
Protein Extraction and Analysis
Materials
Sterile pipettes and tips, 1.5mL microcentrifuge tubes, sterile 2mL screw cap microcentrifuge tubes, sterile pestles, spectrophotometer, spectrophotometer cuvettes, microcentrifuge, ice buckets, gloves, kim wipes, lab pens, CellLytic MT Cell Lysis Reagent (with Protease Inhibitor Cocktail added), Coomassie Protein Assay Reagent, sterile water.
Methods
I extracted protein from two Olympia oyster tissues that had been heat shocked at 35°C for one hour (#61 and 62). I added about 25mg of tissue to each reaction and labelled the tubes with the sample name, my initials, and the date. 500uL of CellLytic MT solution was added to the sample tubes and the tissue in solution was homogenized with a sterile disposable pestle. The tube was closed and inverted several times to mix the solution and centrifuged for 10 minutes at maximum speed in a cold centrifuge. The resulting liquid should have three layers- two cloudy layers with a clear layer in the middle, however our tubes didn't have distinct layers. We centrifuged the samples an additional 10 minutes and collected the resulting clear layer from each tube, transferring this to a new clean labelled tube. For quantification, we diluted our protein aliquot by half. We added 15uL of our protein sample and 15uL of water to a tube. Then we made a blank tube by adding 30uL of water to a separate tube. We added 1.5mL of Bradford reagent to each tube, inverted the tubes several times and incubated them for 10 minutes at room temperature. We zeroed the spectrophotometer by adding our blank sample to a cuvette and obtaining a reading, then measured our protein samples. Each sample was mixed and added to a cuvette. The absorbance was read at 595nm and values were recorded. Each sample was ready twice to ensure accuracy of readings. Cuvettes were wiped with a kim wipe before each reading, and our protein calculations were back-calculated using a standard curve. The equation for this standard curve was: y=996.52x-43.64, where y=protein concentration in ug/mL.
Results
We will be examining the results from our PCR analyses next week, however we were able to obtain protein concentrations. My concentrations were as follows:
| Sample |
Absorbance (A) |
Protein concentration |
Absorbance (B) |
Protein concentration |
| 61- Olympia 35°C heat shock |
0.261 |
216.45ug/mL |
0.257 |
212.47ug/mL |
| 62- Olympia 35°C heat shock |
0.242 |
197.52ug/mL |
0.238 |
193.53ug/mL |
We were able to successfully complete a protein extraction on oyster tissue samples. Our conventional PCR samples were run on the thermal cycler and we will check the accuracy of these next week by running our samples on a gel and checking for bands. We will also run a size standard ladder along with our samples, so that we can determine the size of our PCR fragments in base pairs. We will also examine our qPCR results next week, and I am interested in seeing if gene expression occurs in these samples. If gene expression for chaperonin-containing TCP1 subunit 7 isoform b is occurring, this will be surprising to me since these oysters were sampled without any stress and my gene of interest is involved in maintaining cell viability in response to stress.
Reflection
We were able to complete three important procedures in this lab including isolating proteins, and performing conventional PCR and qPCR. I am still a little unclear about how we will use our protein samples, but it was interesting to practice isolating proteins since I'd never done this before. These protocols were important for us to practice on control samples so that we can successfully implement them on our experimental tissues. Conventional PCR will be used to confirm presence of the chaperonin gene and qPCR will be used to examine gene expression patterns of the chaperonin gene. Furthermore, qPCR will be used to provide quantitative measurements of expressed RNA. The up regulation of chaperonin gene expression levels will be used to confirm cellular stress in my oyster heat shock samples. I also hope to examine changes in DNA methylation by using the MeDIP procedure, since I expect a change in methylation as a result of stress with heat shock.
10/23/12
Lab 5- Experiment Implementation, Tissue Sampling, Primer Reconstitution
Summary of Lab:
Oysters were subjected to various stressors including treatments with cyclodextrin and temperature changes. Oysters exposed to temperature shocks were either gradually exposed to increasing temperature or subjected to a heat shock. After these experiements, Pacific and Olympia oyster samples were collected and frozen at -80°C for subsequent gene expression analyses.
Experimental Protocol and tissue sampling
Materials
Water tanks for various treatments, ruler for measuring oyster shells, oyster shuckers, tweezers, scissors, bleach, ethanol, water, dry ice, 1.5mL tubes
Methods
The class was divided up into groups based on our different research interests. There were groups for temperature pre-stress, a gradual increase in temperature, heat shock with temperature, and response to cyclodextrin. Our experimental design was as follows:
| Oyster species |
Treatment |
Number of Samples |
Tube Numbers |
| Pacific |
Control |
15 |
1-15 |
| Pacific |
Cyclodextrin |
15 |
16-30 |
| Pacific |
35°C |
10 |
31-40 |
| Pacific |
40°C |
10 |
41-50 |
| Olympia |
Control |
10 |
51-60 |
| Olympia |
35°C |
10 |
61-70 |
| Olympia |
Gradual 35°C |
10 |
71-80 |
| Olympia |
Pre-stress 35°C |
9 |
81-89 |


Primer Reconstitution
Materials
Sterile pipettes and tips, sterile water, primer stocks, 1.5mL tubes
Methods
We created stock solutions of our ordered primers. Based on the number of nanomoles the primer concentration was, we added a certain amount of water. My forward primer was 34.6 nm, so I added 346uL of sterile water. My reverse primer was 27.6nm, so I added 276uL of sterile water. Then we made 1:10 dilutions of these primer stocks to create working stock solutions for our PCR reactions. To make these, we aded 10uL of the primer stocks to 90uL of sterile water. My primers were labelled as following: CE_gigas_chaperonin_F and CE_gigas_chaperonin_R. We will perform PCRs during our next lab meeting.
Results
During this lab, we were able to successfully carry out our oyster stress experiments, and it will be interesting to examine genetic responses as a result of these stressors. We were able to dissect tissues from our experimental animals and store oyster tissue samples for future gene expression analyses. We were also able to rehydrate and dilute primers so they are ready to use for PCR next week.
Conclusion
It was helpful to set up our experimental designs last week, so we could effectively implement our experiments this week. I was able to successfully complete heat shock experiments on Pacific and Olympia oysters, and collect tissues from these samples for gene expression analyses using qPCR and potential epigenetic analyses using RNA-seq.
Reflection
Heat shock experiments were performed on Pacific and Olympia oysters at two different temperatures of 35°C and 40°C for one hour each. I will be specifically examining Pacific oyster (Crassostrea gigas) response to heat shock using primers for chaperonin-containing TCP1 subunit 7 isoform b, which is a gene involved in maintaining cell viability in response to stress. I will determine Pacific oyster gene expression patterns using qPCR and gene expression levels will be used to confirm cellular stress. In the future, I hope to couple these results with epigenetic analyses, using RNA-seq to determine methylation and associated changes in gene expression.
10/16/12
Lab 4- Reverse transcription to create cDNA and primer design
Summary of Lab:
Single-stranded RNA was reverse transcribed to create cDNA. This cDNA will be used to examine gene expression patterns in my female Pacific oyster gonad tissue sample. We were also able to set up our class experiments and design primers based on mRNA sequences for examining gene expression.
Reverse Transcription
Materials
Sterile pipettes and tips, .2mL tubes, tube racks, lab coats, safety glasses, gloves, lab pens, timers, ice buckets filled with ice, tip waste containers, M-MLV reverse transcriptase, M-MLV 5X reaction buffer, Oligo dT, dNTPs, Nuclease-free water, thermal cycler, kimwipes, and RNA previously isolated from Pacific oyster tissue sample.
Methods
Reverse Transcription
The RNA stock sample was mixed by inverting the tube, and this tube was kept on ice at all times. A 0.2mL PCR tube was labelled with my initials (CHE) and "cDNA". The following reagents were added to the labelled tube, including 5uL of total RNA, 1uL of oligo dT, and 4uL of nuclease-free water. This tube was briefly mixed and incubated for 5 minutes at 70°C in a thermal cycler. After this incubation, the tube was centrifuged briefly and immediately transferred to ice. We then added 5uL of M-MLV 5X reaction buffer, 5uL of dNTPs, 1uL of M-MLV RT, and 4uL of nuclease free water to the tube. This mixture was briefly mixed and incubated for 60 minutes at 42°C, then heat inactivated for 3 minutes at 70°C using a thermal cycler. Samples were briefly spun down and stored in a -20°C freezer for later use.
Oyster Dissection
We got oysters from Taylor Shellfish Farms in Capitol Hill for a dissection and "tasting" session. Using oyster shuckers we were each able to practice the shucking technique. We shucked the oysters by inserting the shucker at the hinge of the oyster shell and twisting it, then removing the adductor muscle from the shell. After shucking we were able to examine all the basic organs within the oyster.
Primer and Experimental Design
We were able to create a mock-up of our experimental design so that we are organized and ready to begin treatments on oyster samples starting next Tuesday (10/23/12). I am particularly interested in performing 2 heat shock treatments on oysters, so I labelled containers for both Olympia and Pacific oysters that will be shocked for one hour at both 35°C and 40°C.
For this experiment, I am interested in examining the oyster's response to the stress of heat shock, which is what I kept in mind when designing primers. I picked primers for chaperonin-containing TCP1 subunit 7 isoform b, which is a gene involved in maintaining cell viability in response to stress. Using NCBI Primer, I was able to pick primers while keeping a few things in mind:
-Primers designed to be within 18-30 base pairs in length
-Melting temperatures of primers were around 60°C and within 2°C of each other
-Primer dimers and hairpins (self annealing) was avoided
-High G/C stretches were avoided, especially at the 3' end
-G/C clamp at 3' end of the primers.
In the end, these are the primers I generated from my primer search:
| Primer Name |
Primer Sequence |
Amplicon size |
G/C content |
Melting Temperature (Tm) |
| CE_Gigas_chaperonin_F |
TTTGTGTGGGAACCAGCAGT |
167 bp |
50% |
60.03° |
| CE_Gigas_chaperonin_R |
TGTCTTCACATGGGCCTTCC |
167 bp |
55% |
59.96° |
Results
We didn't receive any results from this lab, but learned how to make cDNA using reverse transcription. We were able to reach a conclusion about our class experiment and divide up into groups based on similar research interests.
Conclusion
There are no results to analyze at this point, but this was a successful completion of creating cDNA for gene expression analyses. It was also helpful to examine the oyster anatomy so that we can visualize where our previously extracted tissues came from. I also enjoyed trying my first raw oyster!
Reflection
This lab was important for us to understand the processes involved in reverse transcription. In our experiment, our RNA sample was reverse transcribed into its DNA complement (cDNA), using the enzyme reverse transcriptase. In the next lab, our resulting cDNA will be amplified using PCR. This is a protocol that is commonly used to transcribe RNA to cDNA for gene expression analyses using qPCR. This method is furthermore valuable in determining the abundance of RNA molecules within a tissue as a measure of gene expression. The method was fairly straightforward, and it is different from the reverse transcription that I've done in the past which involved an overnight step. I prefer this method since it was easily understood and involved a better time frame.
10/12/12
Lab 3- RNA Extraction
Summary of Lab:
RNA was extracted from Pacific oyster female gonad tissue sample 233.go from 6/27/12. The extracted RNA was quantified using a nanodrop spectrophotometer to determine RNA concentration and quality. The purpose of this lab was to learn the RNA extraction protocol and to incorporate this knowledge into our class experimental design. This also got us thinking about what genes we want to examine for our experiment, allowing us to design primers for our next session.
RNA Extraction
Materials
Sterile pipettes and tips, 1.5 mL microcentrifuge tubes, tube racks, lab coats, safety glasses, gloves, lab pens, timers, ice buckets filled with ice, phenol/chloroform waste containers (both liquid and solid), vortex, hot water bath, nanodrop spectrophotometer, chloroform, RNase free water, isopropanol, 75% ethanol, 0.1% DEPC treated water, and oyster gonad tissue previously isolated and incubated in Tri-Reagent.
Methods
RNA Extraction
Gloves were worn at all times during this protocol to prevent contamination from RNases and were kept on ice when possible to prevent activity of RNases in samples. Sample 233.go was selected for DNA extraction last week and further processed for RNA extraction this week. This particular sample weighed 62.0 mg and was collected on 6/27/12 and is a Pacific oyster female gonad tissue. Sample was obtained from the freezer and incubated at room temperature for 5 minutes. While sample was incubating we made sure the water bath was set to 55°C. In the fume hood, we added 200uL of chloroform and vortexed the tube vigorously for 30 seconds. The resulting solution appeared cloudy, which is an indicator of correct vortexing. The tube was incubated for 5 minutes at room temperature and then spun in a cold microfuge for 15 minutes at maximum speed. The tube was removed from the microfuge and the resulting substance had three layers: an upper aqueous phase, middle interphase, and lower organic phase. Our RNA was located in the upper aqueous phase, which is what we pipetted off, making sure not to disturb any of the other layers. The aqueous phase was transferred to a new clean and labeled microcentrifuge tube and 500uL of isopropanol was added to this tube. The tube was mixed by inversion until the solution appeared to be uniform. This solution was incubated for 10 minutes at room temperature, then spun in a cold microfuge for 8 minutes at maximum speed. A small white pellet was present after this spin, which was my isolated RNA. The isopropanol supernatant was removed and 1mL of 75% ethanol was added to the pellet. The tube was vortexed and spun in a cold microfuge for an additional 5 minutes at 7500g. After the spin, all traces of ethanol were removed by pipetting and allowing the tube to dry at room temperature for about 5 minutes. The RNA pellet was suspended in 100uL of 0.1% DEPC-H2O and mixed by pipetting to ensure the pellet dissolved in water. To solubilize the RNA, the tube was incubated in the water bath for 5 minutes at 55°C. Sample was labelled with my initials (CHE) the date and the word "RNA".
RNA Quantification
RNA was quantified using a nanodrop spectrophotometer. "Nucleic Acid" was selected from the nanodrop software menu and 2uL of sterile water was added to the pedestal. We then selected "RNA-40" from the pulldown menu on the right side, and clicked "Blank" to zero the instrument and set water as the blank for our sample. Since our sample was diluted in water, we use this to blank our sample. For each RNA sample, 2uL was added to the pedestal, the arm was lowered, and "Measure" was clicked to obtain our RNA concentration. Using the Beer-Lambert Law, the concentration of our RNA was calculated. After quantification, samples were stored in a -80°C freezer.
Results
RNA concentration and nanodrop values were as indicated
Absorbance: 32.677
260: 48.455
280: 24.073
260/280: 2.01
260/230: 1.48
Concentration: 1938.2 ng/uL
Total RNA concentration= 1938.2ng/uL*100uL= 193820ng= 193.82ug
Conclusions
After the past two labs I noticed one interesting observation, that there are different patters we observe from isolating different tissues of the oyster. For example, those students working with gill tissue commonly saw a spike on the nanodrop in the 230 range, indicating that there are likely salts still in their sample. This is due to the fact that oyster gills are filtering water, and it is difficult to remove these salts during the extraction. My extraction resulted in an abundance of RNA, indicated by the quantification from the nanodrop. After this extraction, I didn't notice a large spike near the 230 value, indicating that I was hopefully successful in removing all traces of ethanol from my sample. However, the expected values for the 260/230 ratio are within the range of 2-2.2, and since my value was outside this range my RNA might contain some contaminants that absorb at 230 nm. This may indicate that my sample has some traces of ethanol, but much less than last week when I extracted DNA. My ratio of absorbance of 260/280 value was 2.01. This is just outside the 1.8-2 ratio range that is generally accepted as pure RNA, meaning my sample is almost pure.
Reflection
The purpose of this lab was to expose us to a common molecular methods used in the laboratory, the isolation of RNA from a tissue sample. This is important because RNA is the expressed form of a gene, and by isolating it we can determine which genes are being expressed in our oyster samples. This lab was important for the class experiment we will be completing later in the quarter, examining the affect of temperature stress and the presence of cyclodextrin on the Pacific oyster (C. gigas) and Olympia oyster (O. lurida). Next week we will be using reverse transcriptase to creat cDNA from our RNA which can be used for gene expression studies.
In this lab we were also able to outline our experimental design in which we have control oysters, controls exposed to a heat shock, heat shock oysters, and heat shock oysters with the addition of cyclodexrin. We are using Pacific and Olympia oysters in this experiment, and it will be interesting to examine gene expression similarities and differences between these two species. After reading some papers about the differential expression of genes in oysters (particularly the Pacific oyster) prolonged to thermal stress, it will be interesting to examine the biochemical and molecular pathways affected by this stressor. Since oysters are intertidal organisms they are generally exposed to fluctuating temperatures, so it will be important to examine what genes are expressed or up-regulated during heat shock treatments. This will give us general information about how oysters respond to stresses such as an increase in temperature. Most studies to date have focused on heat shock proteins (HSPs) in response to heat stress, but it will also be important to examine other genes involved in cellular stress. This includes chaperonin-containing subunit 7 and isoform b. It would also be worthwhile to examine Cu-Zn superoxide dismutase and metallothionein (MT), which are involved in the regulation of oxidative stress. Also of notable interest are genes involved in cell detoxification, such as glutathione S-transferase, cytocrome P450 and multidrug resistance (MDR1).
10/2/12
Lab 2- DNA Extraction, Begin RNA Extraction
Summary of lab:
DNA was extracted from female oyster gonad tissue and an RNA extraction was initiated on the same tissue type. The isolated DNA was quantified using a nanodrop spectrophotometer to determine DNA concentration and quality. The purpose of this lab was to learn the methods used to extract DNA and RNA from our samples, and use these samples to examine oyster gene expression.
RNA and DNA Extraction
Materials
Sterile pipettes and tips, 1.5mL microcentrifuge tubes, tube rack, sterile pestles, vortexer, ice buckets, gloves, lab pens, microcentrifuge, razor blades, weigh boats, scale, kim wipes, safety glasses, nanodrop, 100% ethanol, 75% ethanol, 0.1% DEPC Water, Tri-Reagent, DNAzol, and oyster gonad tissue.
Methods
Sample 233.go was selected for extraction. This particular sample was collected on 6/27/12 and is a female oyster gonad tissue. Sterile tubes were obtained and labelled with sample name, initials (CHE), the date (10/2/12) and either DNA or RNA depending on the sample. Tissue was trimmed with a razor blade and weighed to the approximate amount of tissue required for either a DNA or RNA extraction (See table). All samples were kept on ice to prevent activity of RNases in samples from occurring and gloves were worn throughout the procedure to prevent RNase contamination.
| Tissue Weight Required |
Weight |
| DNA:25-50 mg |
52.0 mg |
| RNA: 50-100 mg |
62.0 mg |
500uL of Tri-Reagent was added to the 1.5 mL microcentrifuge tube containing female oyster gonad tissue intended for RNA isolation, and sample was homogenized using a sterile pestle. Sample was further vortexed to ensure homogenization. An additional 500uL of Tri-Reagent was added to the same tube, bringing the volume up to 1mL. The sample was vigorously vortexed for 15 seconds and stored in the freezer until next week when the extraction will be completed.
DNA Extraction
500uL of DNazol was added to the 1.5mL microcentrifuge tube containing female oyster gonad tissue intended for DNA isolation. Using a different sterile pestle to prevent-cross contamination between reagents, the sample was homogenized in DNazol. After homogenization, an additional 500uL of DNazol was added to the same tube, bringing the total volume up to 1mL. The tissue sample was incubated for 5 minutes at room temperature and the homogenate was sedimented by spinning in a microcentrifuge for 10 minutes at 10,000 rpm (g). This step removed insoluble tissue fragments, partially hydrolyzed RNA and excess polysaccharides from the lysate. The resulting supernatant was transferred to a new labeled tube and the DNA was precipitated by adding 500mL of 100% ethanol. DNA and ethanol were mixed by inverting the tube 5-8 times to form a homogenous solution. DNA became visible as a cloudy precipitate as the top layer of the solution. It was difficult to remove the DNA precipitate, so the sample was centrifuged for 5 minutes at 5,000 rpm (g). The supernatant was discarded from this tube and the resulting pellet was further processed. The DNA pellet was washed twice with 1mL of 75% ethanol. For each wash, the DNA was suspended in ethanol by inverting the tube about 6 times, storing the tube for 1 minute at room temperature, and the ethanol was removed by pipetting. Any remaining ethanol left after these washes was removed with a small pipette. 150uL of 0.1% DEPC water was added to the tube and the DNA pellet was dissolved in the water and quantified.
DNA Quantification
DNA was quantified using a nanodrop spectrophotometer. "Nucleic Acid" was selected from the nanodrop software menu and 2uL of sterile water was added to the pedestal. We then selected "dsDNA" (double-stranded DNA) form the pulldown menu on the right side, and clicked "Blank" to zero the instrument and set water as the blank for our sample. Since our sample was diluted in water, we use this to blank our sample. For each DNA sample, 2uL was added to the pedestal, the arm was lowered, and "Measure" was clicked to obtain our DNA concentration. Using the Beer-Lambert Law, the concentration of our DNA was calculated. After quantification, samples were stored in a -20°C freezer.
Results
DNA concentration and nanodrop values were as indicated
Absorbance: 3.639
260: 3.573
280: 1.837
260/280: 1.94
260/230: 0.98
Concentration: 178.7 ng/uL
Total DNA concentration= 178.7ng/uL*150uL= 26805ng= 26.805ug
Conclusions
Results from the nanodrop quantification revealed an abundant amount of DNA. On the nanodrop plot, I noticed a small spike before the wavelength value of 230nm, indicating that there is likely some ethanol still in my DNA sample. In the future, I'd like to perform an ethanol precipitation on this sample if it is going to be used for sequencing. For my next DNA extraction, I will practice more careful pipetting techniques to ensure that all the ethanol is removed from the tube before I elute the DNA pellet in water. Furthermore, the ratio of absorbance of 260/280 is used to assess the purity of DNA. Since a ratio of about 1.8-2 is generally accepted as pure DNA, I can assume that the DNA is pure since it is within the range values. The 260/230 ratio is used as a secondary measure of nucleic acid purity. Expected values for this ratio are within the range of 2-2.2. Since my 260/230 value is outside of this range, this likely indicates the presence of contaminants that absorb at 230 nm. As I previously stated, this is likely ethanol or salt contamination, which I hope to remove at later steps in the experimental protocol.
Reflection
The purpose of this lab was to expose us to some common molecular methods used in the laboratory. DNA extractions are frequently used to isolate the genetic material from the nucleus (DNA) and we can amplify DNA to examine out a particular sequence or gene by performing PCR, or use DNA to examine DNA methylation or epigenetics. It is important to isolate RNA as well to examine gene expression using qPCR for a particular organism. These methods are applicable for any molecular study, such as those previously mentioned examining epigenetics or gene expression. This particular lab was helpful to get us thinking about our class project, to examine how stressors like temperature or water contaminants affect oysters on a genetic level, by seeing which genes are involved in each of these mechanisms. The procedure was straightforward, however I was wondering how effectively the DNA pellet would dissolve in water if the tube were left to dry in the hood in order to remove all traces of ethanol. I am wondering this because my samples were contaminated a bit with ethanol and am thinking of future methods to get rid of any residual ethanol in the sample after the washes.