Links to all qPCR Raw files and PCR Miner files from the olympia oyster larval qPCR experiment are provided below.
In addition, all files are located in the Roberts lab "Sites" folder under "Dave--OlyOA"
Ef1alpha Raw qPCR data
Ef1alpha RFU no baseline subtraction
Ef1alpha data formatted for PCR Miner
Ef1alpha PCRMiner output file
IsotRNA Raw qPCR data
IsotRNA RFU no baseline subtraction
IsotRNA data formatted for PCR Miner
IsotRNA PCRMiner output file
GPx3 Raw qPCR data
GPx3 RFU no baseline subtraction
GPx3 data formatted for PCR Miner
GPx3 PCRMiner output file
Hemi Raw qPCR data
Hemi RFU no baseline subtraction
Hemi data formatted for PCR Miner
Hemi PCRMiner output file
Hypoxy Raw qPCR data
Hypoxy RFU no baseline subtraction
Hypoxy data formatted for PCR Miner
Hypoxy PCRMiner output file
SAMPLE LOCATIONS:
All cDNA is at 4 degrees in the Roberts lab in 96 well pcr plates. Plate maps can be found by scrolling down.
Oly cDNA has been diluted 1:2 and 2ul were used in qPCR reactions.
Clam cDNA is undiluted and 2ul should be used for qPCR reactions.
All RNA is in the -80. All total RNA has been DNased due to low yields. Oly RNA is located on the top left shelf. Clam RNA is located on the second shelf from the top.
August 7, 2012
Ran RT reactions for all manila clam larval RNA extracted over the past week.
I had to load 150ng total RNA as template in the RT reactions due to low concentrations for total RNA in several of the samples.
Plate map of cDNA samples is provided below.

Because of the low amount of total RNA used as a template in the RT reactiosn, I ran a test qPCR on cDNA to determine optimal concentration of cDNA to load for qPCR reactions. The test included 5ul of undiluted cDNA, 2ul of undiluted cDNA, and 2ul of cDNA diluted 1:5.
Click here for raw qPCR Data
Results:
Looks like loading 2ul of undiluted cDNA will work best...at least for ef1alpha and perlucin 6
-
"Lets take the example "1C3"
The "1" refers to the CO2 treatment
1 = 1000ppm
3 = 750ppm
4 = 400ppm
The "C" refers to which of the grey tubs over at noaa the larval
chambers were in. All of mine were in "C" for clam so the C is more or
less irrelevant at this point.
The third character, in this case "3" refers to which of the 6
replicate chambers the samples came from. There are 6 total chambers
total but only 3 were sampled on any given day. So for a particular
date you should only have three different numbers here (except the
final day of sampling there are 4 just to make it confusing)."
August 6, 2012
Ran qPCR plates to quantified Isoleucyl-tRNA synthetase and GPx3 in the Oly larval OA samples from 7.23.12 using the same platemap as 8.1.12.
Links to raw data will be provided shortly
Also DNase treated RNA extracted last year rom the manila clam larval OA experiment. I'm gearing up to run some qPCR assays to compliment the NGS data. RNA concentrations were quantified using a nanodrop.
| User ID |
Date |
Time |
ng/ul |
A260 |
A280 |
260/280 |
260/230 |
Constant |
Cursor Pos. |
Cursor abs. |
340 raw |
|
| 1C2 8.5.11 DNase |
Default |
8/6/12 |
3:06 PM |
29.04 |
0.726 |
0.497 |
1.46 |
0.31 |
40 |
230 |
2.343 |
0.004 |
| 1C3 8.5.11 DNase |
Default |
8/6/12 |
3:06 PM |
41.85 |
1.046 |
0.642 |
1.63 |
0.48 |
40 |
230 |
2.185 |
-0.008 |
| 1C4 8.5.11 DNase |
Default |
8/6/12 |
3:07 PM |
13.78 |
0.344 |
0.274 |
1.26 |
0.18 |
40 |
230 |
1.92 |
0.025 |
| 3C1 8.5.11 DNase |
Default |
8/6/12 |
3:07 PM |
26.84 |
0.671 |
0.467 |
1.44 |
0.11 |
40 |
230 |
6.288 |
-0.009 |
| 3C2 8.5.11 DNase |
Default |
8/6/12 |
3:08 PM |
13.18 |
0.33 |
0.287 |
1.15 |
0.13 |
40 |
230 |
2.608 |
-0.014 |
| 3C3 8.5.11 DNase |
Default |
8/6/12 |
3:08 PM |
36.87 |
0.922 |
0.595 |
1.55 |
0.39 |
40 |
230 |
2.379 |
0.001 |
| 4C1 8.5.11 DNase |
Default |
8/6/12 |
3:09 PM |
15.52 |
0.388 |
0.303 |
1.28 |
0.13 |
40 |
230 |
3.064 |
-0.002 |
| 4C2 8.5.11 DNase |
Default |
8/6/12 |
3:09 PM |
10.11 |
0.253 |
0.237 |
1.07 |
0.12 |
40 |
230 |
2.072 |
0.003 |
| 4C3 8.5.11 DNase |
Default |
8/6/12 |
3:09 PM |
23.91 |
0.598 |
0.454 |
1.32 |
0.24 |
40 |
230 |
2.467 |
-0.001 |
| 1C1 7.29.11 Dnase |
Default |
8/6/12 |
3:10 PM |
26.08 |
0.652 |
0.461 |
1.42 |
0.21 |
40 |
230 |
3.098 |
-0.012 |
| 1C2 7.29.11 DNase |
Default |
8/6/12 |
3:11 PM |
25.1 |
0.627 |
0.455 |
1.38 |
0.25 |
40 |
230 |
2.516 |
-0.024 |
| 1C3 7.29.11 DNase |
Default |
8/6/12 |
3:11 PM |
11.29 |
0.282 |
0.239 |
1.18 |
0.09 |
40 |
230 |
3.155 |
-0.004 |
| 3C1 7.29.11 DNase |
Default |
8/6/12 |
3:12 PM |
15.99 |
0.4 |
0.296 |
1.35 |
0.44 |
40 |
230 |
0.904 |
-0.001 |
| 3C2 7.29.11 DNase |
Default |
8/6/12 |
3:12 PM |
42.77 |
1.069 |
0.752 |
1.42 |
0.16 |
40 |
230 |
6.577 |
-0.018 |
| 3C3 7.29.11 DNase |
Default |
8/6/12 |
3:12 PM |
13.85 |
0.346 |
0.254 |
1.36 |
0.34 |
40 |
230 |
1.013 |
0.001 |
| 4C1 7.29.11 DNase |
Default |
8/6/12 |
3:13 PM |
9.77 |
0.244 |
0.221 |
1.11 |
0.29 |
40 |
230 |
0.852 |
-0.013 |
| 4C2 7.29.11 DNase |
Default |
8/6/12 |
3:13 PM |
9.1 |
0.228 |
0.219 |
1.04 |
0.1 |
40 |
230 |
2.356 |
-0.015 |
| 4C3 7.29.11 DNase |
Default |
8/6/12 |
3:14 PM |
26.94 |
0.673 |
0.469 |
1.44 |
0.22 |
40 |
230 |
3.052 |
0.035 |
-
"Lets take the example "1C3"
The "1" refers to the CO2 treatment
1 = 1000ppm
3 = 750ppm
4 = 400ppm
The "C" refers to which of the grey tubs over at noaa the larval
chambers were in. All of mine were in "C" for clam so the C is more or
less irrelevant at this point.
The third character, in this case "3" refers to which of the 6
replicate chambers the samples came from. There are 6 total chambers
total but only 3 were sampled on any given day. So for a particular
date you should only have three different numbers here (except the
final day of sampling there are 4 just to make it confusing)."
August 3, 2012
DNase treated RNA samples extracted on 8/1 and 8/2 2012
Because concentrations were so low I DNase treated the entire RNA sample
quantified using nanodrop
| Sample ID |
User ID |
Date |
Time |
ng/ul |
A260 |
A280 |
260/280 |
260/230 |
Constant |
Cursor Pos. |
Cursor abs. |
340 raw |
| Day 0-1 DNase |
Default |
8/3/12 |
2:02 PM |
329.45 |
8.236 |
4.275 |
1.93 |
1.48 |
40 |
230 |
5.575 |
0.029 |
| Day 0-2 DNase |
Default |
8/3/12 |
2:03 PM |
291.52 |
7.288 |
3.78 |
1.93 |
0.71 |
40 |
230 |
10.222 |
0.023 |
| Day 0-3 DNase |
Default |
8/3/12 |
2:03 PM |
87.42 |
2.186 |
1.239 |
1.76 |
0.43 |
40 |
230 |
5.027 |
-0.005 |
| Day 0-4 DNase |
Default |
8/3/12 |
2:04 PM |
304.21 |
7.605 |
3.911 |
1.94 |
1.1 |
40 |
230 |
6.923 |
0.014 |
| Day 0-5 DNase |
Default |
8/3/12 |
2:04 PM |
119.54 |
2.989 |
1.617 |
1.85 |
0.55 |
40 |
230 |
5.47 |
-0.004 |
| 3C6 8.12.11 DNase |
Default |
8/3/12 |
2:05 PM |
111.78 |
2.794 |
1.496 |
1.87 |
1.14 |
40 |
230 |
2.443 |
0.047 |
| 3C2 8.12.11 DNase |
Default |
8/3/12 |
2:05 PM |
318.33 |
7.958 |
4.08 |
1.95 |
0.99 |
40 |
230 |
8.057 |
0.075 |
| 3C4 8.12.11 DNase |
Default |
8/3/12 |
2:06 PM |
578.43 |
14.461 |
7.492 |
1.93 |
1.3 |
40 |
230 |
11.12 |
0.181 |
| 3C5 8.12.11 DNase |
Default |
8/3/12 |
2:06 PM |
142.75 |
3.569 |
1.894 |
1.88 |
0.95 |
40 |
230 |
3.759 |
0.063 |
| 4C4 8.12.11 DNase |
Default |
8/3/12 |
2:07 PM |
75.03 |
1.876 |
1.058 |
1.77 |
0.74 |
40 |
230 |
2.54 |
0.047 |
| 4C6 8.12.11 DNase |
Default |
8/3/12 |
2:07 PM |
159.89 |
3.997 |
2.074 |
1.93 |
0.81 |
40 |
230 |
4.934 |
0.058 |
| 4C5 8.12.11 DNase |
Default |
8/3/12 |
2:08 PM |
93.64 |
2.341 |
1.288 |
1.82 |
0.3 |
40 |
230 |
7.733 |
0.03 |
| 4C2 8.12.11 DNase |
Default |
8/3/12 |
2:08 PM |
61.79 |
1.545 |
0.898 |
1.72 |
0.32 |
40 |
230 |
4.838 |
0.044 |
| 1C2 8.12.11 DNase |
Default |
8/3/12 |
2:09 PM |
640.6 |
16.015 |
8.177 |
1.96 |
0.99 |
40 |
230 |
16.172 |
0.243 |
| 1C6 8.12.11 DNase |
Default |
8/3/12 |
2:09 PM |
206.62 |
5.166 |
2.751 |
1.88 |
0.54 |
40 |
230 |
9.512 |
0.088 |
| 1C5 8.12.11 DNase |
Default |
8/3/12 |
2:10 PM |
183.92 |
4.598 |
2.427 |
1.89 |
0.63 |
40 |
230 |
7.262 |
0.082 |
| 1C1 8.12.11 DNase |
Default |
8/3/12 |
2:10 PM |
331.78 |
8.295 |
4.303 |
1.93 |
1.39 |
40 |
230 |
5.988 |
0.091 |
| 4C5 8.9.11 DNase |
Default |
8/3/12 |
2:11 PM |
34.7 |
0.867 |
0.597 |
1.45 |
0.16 |
40 |
230 |
5.345 |
-0.001 |
| 4C4 8.9.11 DNase |
Default |
8/3/12 |
2:12 PM |
17.94 |
0.448 |
0.33 |
1.36 |
0.24 |
40 |
230 |
1.863 |
-0.002 |
| 4C6 8.9.11 DNase |
Default |
8/3/12 |
2:12 PM |
44.52 |
1.113 |
0.721 |
1.54 |
0.19 |
40 |
230 |
5.802 |
-0.006 |
| 1C6 8.9.11 DNase |
Default |
8/3/12 |
2:12 PM |
75.11 |
1.878 |
1.286 |
1.46 |
0.21 |
40 |
230 |
8.96 |
0.009 |
| 1C5 8.9.11 DNase |
Default |
8/3/12 |
2:13 PM |
67.44 |
1.686 |
1.134 |
1.49 |
0.19 |
40 |
230 |
8.708 |
-0.004 |
| 1C1 8.9.11 DNase |
Default |
8/3/12 |
2:13 PM |
91.25 |
2.281 |
1.466 |
1.56 |
0.34 |
40 |
230 |
6.616 |
-0.001 |
| 3C6 8.9.11 DNase |
Default |
8/3/12 |
2:14 PM |
40.5 |
1.013 |
0.672 |
1.51 |
0.27 |
40 |
230 |
3.744 |
0.017 |
| 3C5 8.9.11 DNase |
Default |
8/3/12 |
2:14 PM |
38.63 |
0.966 |
0.626 |
1.54 |
0.24 |
40 |
230 |
4.099 |
0.01 |
| 1C4 8.2.11 DNase |
Default |
8/3/12 |
2:16 PM |
129.98 |
3.249 |
1.976 |
1.64 |
0.3 |
40 |
230 |
10.812 |
0.012 |
| 1C5 8.2.11 DNase |
Default |
8/3/12 |
2:17 PM |
73.43 |
1.836 |
1.051 |
1.75 |
0.18 |
40 |
230 |
10.045 |
0.001 |
| 1C6 8.2.11 DNase |
Default |
8/3/12 |
2:18 PM |
191.9 |
4.797 |
2.828 |
1.7 |
0.46 |
40 |
230 |
10.326 |
0.011 |
| 4C5 8.2.11 DNase |
Default |
8/3/12 |
2:18 PM |
194.67 |
4.867 |
2.949 |
1.65 |
0.48 |
40 |
230 |
10.067 |
-0.007 |
| 4C6 8.2.11 DNase |
Default |
8/3/12 |
2:19 PM |
141.24 |
3.531 |
2.103 |
1.68 |
0.31 |
40 |
230 |
11.387 |
-0.002 |
| 4C4 8.2.11 DNase |
Default |
8/3/12 |
2:19 PM |
163.35 |
4.084 |
2.471 |
1.65 |
0.4 |
40 |
230 |
10.326 |
0.01 |
| 3C5 8.2.11 DNase |
Default |
8/3/12 |
2:20 PM |
231.46 |
5.786 |
3.379 |
1.71 |
0.62 |
40 |
230 |
9.351 |
0.017 |
| 3C6 8.2.11 DNase |
Default |
8/3/12 |
2:21 PM |
123.26 |
3.082 |
1.906 |
1.62 |
0.29 |
40 |
230 |
10.531 |
0.003 |
| 3C4 8.2.11 DNase |
Default |
8/3/12 |
2:21 PM |
296.03 |
7.401 |
4.182 |
1.77 |
1.02 |
40 |
230 |
7.268 |
0.031 |
Also quantified RNA from larval samples that were extracted a year ago to check on RNA integrity/quanityt
| Sample ID |
User ID |
Date |
Time |
ng/ul |
A260 |
A280 |
260/280 |
260/230 |
Constant |
Cursor Pos. |
Cursor abs. |
340 raw |
| 1C4 8.5.11 |
Default |
8/3/12 |
2:43 PM |
18.17 |
0.454 |
0.31 |
1.46 |
0.21 |
40 |
230 |
2.147 |
0.011 |
| 1C2 8.5.11 |
Default |
8/3/12 |
2:43 PM |
39.03 |
0.976 |
0.614 |
1.59 |
0.35 |
40 |
230 |
2.749 |
0.008 |
| 1C3 8.5.11 |
Default |
8/3/12 |
2:44 PM |
40.88 |
1.022 |
0.576 |
1.77 |
0.54 |
40 |
230 |
1.899 |
0.007 |
| 3C2 8.5.11 |
Default |
8/3/12 |
2:44 PM |
14.17 |
0.354 |
0.26 |
1.36 |
0.13 |
40 |
230 |
2.805 |
-0.021 |
| 3C3 8.5.11 |
Default |
8/3/12 |
2:45 PM |
41.41 |
1.035 |
0.606 |
1.71 |
0.43 |
40 |
230 |
2.419 |
0.038 |
| 3C1 8.5.11 |
Default |
8/3/12 |
2:45 PM |
34.16 |
0.854 |
0.527 |
1.62 |
0.11 |
40 |
230 |
7.616 |
0.004 |
| 4C1 8.5.11 |
Default |
8/3/12 |
2:45 PM |
15.6 |
0.39 |
0.243 |
1.61 |
0.13 |
40 |
230 |
3.11 |
0.008 |
| 4C2 8.5.11 |
Default |
8/3/12 |
2:46 PM |
10.95 |
0.274 |
0.192 |
1.42 |
0.12 |
40 |
230 |
2.275 |
0.039 |
| 4C3 8.5.11 |
Default |
8/3/12 |
2:46 PM |
31.98 |
0.799 |
0.545 |
1.47 |
0.27 |
40 |
230 |
2.926 |
0.008 |
| 1C1 7.29.11 |
Default |
8/3/12 |
2:47 PM |
36.12 |
0.903 |
0.582 |
1.55 |
0.23 |
40 |
230 |
3.897 |
-0.013 |
| 1C2 7.29.11 |
Default |
8/3/12 |
2:47 PM |
35.45 |
0.886 |
0.624 |
1.42 |
0.29 |
40 |
230 |
3.009 |
-0.003 |
| 1C3 7.29.11 |
Default |
8/3/12 |
2:48 PM |
11.68 |
0.292 |
0.211 |
1.38 |
0.09 |
40 |
230 |
3.362 |
-0.019 |
| 3C1 7.29.11 |
Default |
8/3/12 |
2:48 PM |
17.47 |
0.437 |
0.281 |
1.56 |
0.57 |
40 |
230 |
0.762 |
0.063 |
| 3C2 7.29.11 |
Default |
8/3/12 |
2:49 PM |
50.22 |
1.255 |
0.835 |
1.5 |
0.17 |
40 |
230 |
7.263 |
0.003 |
| 3C3 7.29.11 |
Default |
8/3/12 |
2:49 PM |
16.28 |
0.407 |
0.252 |
1.62 |
0.44 |
40 |
230 |
0.916 |
0.008 |
| 4C1 7.29.11 |
Default |
8/3/12 |
2:50 PM |
10.14 |
0.253 |
0.193 |
1.32 |
0.47 |
40 |
230 |
0.542 |
0.003 |
| 4C2 7.29.11 |
Default |
8/3/12 |
2:50 PM |
7.07 |
0.177 |
0.132 |
1.34 |
0.07 |
40 |
230 |
2.361 |
0.016 |
| 4C3 7.29.11 |
Default |
8/3/12 |
2:51 PM |
31.92 |
0.798 |
0.516 |
1.55 |
0.24 |
40 |
230 |
3.264 |
-0.017 |
-
"Lets take the example "1C3"
The "1" refers to the CO2 treatment
1 = 1000ppm
3 = 750ppm
4 = 400ppm
The "C" refers to which of the grey tubs over at noaa the larval
chambers were in. All of mine were in "C" for clam so the C is more or
less irrelevant at this point.
The third character, in this case "3" refers to which of the 6
replicate chambers the samples came from. There are 6 total chambers
total but only 3 were sampled on any given day. So for a particular
date you should only have three different numbers here (except the
final day of sampling there are 4 just to make it confusing)."
August 2, 2012
Ran qPCR for Ef1-alpha on olympia oyster larval cDNA from 7/23/12. Used same plate map as 8/1/2012.
Data files can be found here.
Continued extracting RNA from larval clam samples from yesterday.
Same deal...
| Sample ID |
User ID |
Date |
Time |
ng/ul |
A260 |
A280 |
260/280 |
260/230 |
Constant |
Cursor Pos. |
Cursor abs. |
340 raw |
| 3C6 8.12.11 |
Default |
8/2/12 |
6:26 PM |
85.99 |
2.15 |
1.195 |
1.8 |
1.64 |
40 |
230 |
1.308 |
0.028 |
| 1C6 8.12.11 |
Default |
8/2/12 |
6:26 PM |
149.07 |
3.727 |
1.968 |
1.89 |
1 |
40 |
230 |
3.73 |
0.04 |
| 3C5 8.12.11 |
Default |
8/2/12 |
6:27 PM |
145.98 |
3.65 |
1.97 |
1.85 |
1.47 |
40 |
230 |
2.476 |
0.064 |
| 4C2 8.12.11 |
Default |
8/2/12 |
6:27 PM |
72.85 |
1.821 |
0.996 |
1.83 |
1.26 |
40 |
230 |
1.44 |
0.046 |
| 4C5 8.12.11 |
Default |
8/2/12 |
6:28 PM |
133.53 |
3.338 |
1.753 |
1.9 |
1.45 |
40 |
230 |
2.3 |
0.05 |
| 4C6 8.12.11 |
Default |
8/2/12 |
6:28 PM |
198.53 |
4.963 |
2.626 |
1.89 |
1.67 |
40 |
230 |
2.966 |
0.094 |
| 1C5 8.12.11 |
Default |
8/2/12 |
6:29 PM |
317.14 |
7.928 |
4.012 |
1.98 |
1.7 |
40 |
230 |
4.662 |
0.167 |
| 3C2 8.12.11 |
Default |
8/2/12 |
6:29 PM |
307.31 |
7.683 |
4.002 |
1.92 |
1.71 |
40 |
230 |
4.493 |
0.037 |
| 3C4 8.12.11 |
Default |
8/2/12 |
6:30 PM |
655.35 |
16.384 |
8.236 |
1.99 |
1.75 |
40 |
230 |
9.372 |
0.131 |
| 1C1 8.12.11 |
Default |
8/2/12 |
6:30 PM |
790.69 |
19.767 |
9.698 |
2.04 |
2.03 |
40 |
230 |
9.738 |
0.19 |
| 4C4 8.12.11 |
Default |
8/2/12 |
6:31 PM |
123.07 |
3.077 |
1.645 |
1.87 |
1.52 |
40 |
230 |
2.022 |
0.165 |
| 1C2 8.12.11 |
Default |
8/2/12 |
6:31 PM |
570.85 |
14.271 |
7.125 |
2 |
1.41 |
40 |
230 |
10.155 |
0.182 |
-
"Lets take the example "1C3"
The "1" refers to the CO2 treatment
1 = 1000ppm
3 = 750ppm
4 = 400ppm
The "C" refers to which of the grey tubs over at noaa the larval
chambers were in. All of mine were in "C" for clam so the C is more or
less irrelevant at this point.
The third character, in this case "3" refers to which of the 6
replicate chambers the samples came from. There are 6 total chambers
total but only 3 were sampled on any given day. So for a particular
date you should only have three different numbers here (except the
final day of sampling there are 4 just to make it confusing)."
August 1, 2012
Started to run qPCR assays on Olympia oyster cDNA from 7/23/12
Ran assays for 3-beta-hydroxysteroid sulfotransferase and Hemicentin-1
Diluted stock cDNA 1:2 and loaded 2uL as template.
Master mix recipe and plate map are provided on the scanned sheet below
All samples were run in triplicate (loaded as indicated on plate map...then shift everything to the right)
Started RNA extracts of manila clam larvae from the OA experiment that was conducted July/August 2011
Extractions were done using tri-reagent
Quantified using nanodrop
| Sample ID |
User ID |
Date |
Time |
ng/ul |
A260 |
A280 |
260/280 |
260/230 |
Constant |
Cursor Pos. |
Cursor abs. |
340 raw |
| Day 0-1 |
Default |
8/1/12 |
6:02 PM |
390.17 |
9.754 |
5.188 |
1.88 |
1.66 |
40 |
230 |
5.862 |
0.038 |
| Day 0-2 |
Default |
8/1/12 |
6:02 PM |
407.85 |
10.196 |
5.482 |
1.86 |
1.72 |
40 |
230 |
5.942 |
0.038 |
| Day 0-3 |
Default |
8/1/12 |
6:02 PM |
79.55 |
1.989 |
1.162 |
1.71 |
0.8 |
40 |
230 |
2.492 |
0.002 |
| Day 0-4 |
Default |
8/1/12 |
6:03 PM |
378.94 |
9.473 |
5.019 |
1.89 |
1.5 |
40 |
230 |
6.315 |
0.008 |
| Day 0-5 |
Default |
8/1/12 |
6:03 PM |
145.04 |
3.626 |
2.018 |
1.8 |
1.16 |
40 |
230 |
3.138 |
-0.011 |
| 4C5 8.9.11 |
Default |
8/1/12 |
6:04 PM |
24.56 |
0.614 |
0.385 |
1.59 |
0.28 |
40 |
230 |
2.174 |
-0.007 |
| 4C6 8.9.11 |
Default |
8/1/12 |
6:04 PM |
32.14 |
0.804 |
0.512 |
1.57 |
0.42 |
40 |
230 |
1.914 |
-0.003 |
| 3C6 8.9.11 |
Default |
8/1/12 |
6:05 PM |
36.27 |
0.907 |
0.574 |
1.58 |
0.35 |
40 |
230 |
2.558 |
0.005 |
| 3C5 8.9.11 |
Default |
8/1/12 |
6:06 PM |
33.84 |
0.846 |
0.532 |
1.59 |
0.45 |
40 |
230 |
1.876 |
-0.009 |
| 3C4 8.9.11 |
Default |
8/1/12 |
6:06 PM |
123 |
3.075 |
1.89 |
1.63 |
0.43 |
40 |
230 |
7.074 |
0.023 |
| 1C1 8.9.11 |
Default |
8/1/12 |
6:06 PM |
96.48 |
2.412 |
1.507 |
1.6 |
0.37 |
40 |
230 |
6.438 |
0.019 |
| 4C4 8.9.11 |
Default |
8/1/12 |
6:07 PM |
11.34 |
0.283 |
0.187 |
1.52 |
0.33 |
40 |
230 |
0.848 |
-0.005 |
| 1C6 8.9.11 |
Default |
8/1/12 |
6:08 PM |
86.83 |
2.171 |
1.408 |
1.54 |
0.28 |
40 |
230 |
7.747 |
0.006 |
| 1C5 8.9.11 |
Default |
8/1/12 |
6:08 PM |
80.12 |
2.003 |
1.307 |
1.53 |
0.27 |
40 |
230 |
7.38 |
0.005 |
| 1C5 8.2.11 |
Default |
8/1/12 |
1:21 PM |
74.96 |
1.874 |
1.109 |
1.69 |
0.61 |
40 |
230 |
3.058 |
0.001 |
| 3C5 8.2.11 |
Default |
8/1/12 |
1:22 PM |
221.12 |
5.528 |
3.215 |
1.72 |
0.49 |
40 |
230 |
11.388 |
0 |
| 3C6 8.2.11 |
Default |
8/1/12 |
1:22 PM |
137.61 |
3.44 |
2.085 |
1.65 |
0.38 |
40 |
230 |
8.997 |
0.001 |
| 4C4 8.2.11 |
Default |
8/1/12 |
1:23 PM |
191.94 |
4.799 |
2.856 |
1.68 |
0.43 |
40 |
230 |
11.083 |
-0.004 |
| 1C4 8.2.11 |
Default |
8/1/12 |
1:23 PM |
134.89 |
3.372 |
2.056 |
1.64 |
0.41 |
40 |
230 |
8.308 |
-0.007 |
| 4C6 8.2.11 |
Default |
8/1/12 |
1:24 PM |
116.85 |
2.921 |
1.731 |
1.69 |
0.44 |
40 |
230 |
6.659 |
-0.006 |
| 4C5 8.2.11 |
Default |
8/1/12 |
1:24 PM |
187.69 |
4.692 |
2.819 |
1.66 |
0.42 |
40 |
230 |
11.069 |
0.005 |
| 1C6 8.2.11 |
Default |
8/1/12 |
1:25 PM |
175.95 |
4.399 |
2.609 |
1.69 |
0.42 |
40 |
230 |
10.472 |
-0.011 |
| 2C4 8.2.11 |
Default |
8/1/12 |
1:25 PM |
309.13 |
7.728 |
4.326 |
1.79 |
0.72 |
40 |
230 |
10.769 |
-0.002 |
-
"Lets take the example "1C3"
The "1" refers to the CO2 treatment
1 = 1000ppm
3 = 750ppm
4 = 400ppm
The "C" refers to which of the grey tubs over at noaa the larval
chambers were in. All of mine were in "C" for clam so the C is more or
less irrelevant at this point.
The third character, in this case "3" refers to which of the 6
replicate chambers the samples came from. There are 6 total chambers
total but only 3 were sampled on any given day. So for a particular
date you should only have three different numbers here (except the
final day of sampling there are 4 just to make it confusing)."
July 27, 2012
Ran qPCR to test Olympia oyster qPCR primers.
Used Evagreen ssofast supermix
For a 1x rxn volume:
2x SsoFast Evagreen Supermix: 10uL
Forward Primer: 0.5uL
Reverse Primer: 0.5uL
Water: 7uL
Template: 2uL (diluted template 1:5)
used cDNA from well A12 on 7/23/12 as template to test the primers
Ran Sam's 2-step EVAGREEN 65+Amp protocol
Results:

Primers ready to go:
Isoleucyl-tRNA synthetase
3-beta-hydroxysteroid sulfotransferase
GPx3
Primers that dont work:
Hemicentin
Primers that need some optimization but could work:
Calmodulin
Aryl Sulfatase
I might try to redesign the Hemicentin primers. This gene looked really interesting and it's a shame that it didnt work
Also helping Selina test her primers. Among them is a set for ef1a, which, if it works, could be used as a normalizing gene...
July 26, 2012
Ran RT reations using MMLV for Selina and Miranda's capstone project.
Below are the samples I selected and the corresponding number/sampleID used to label the cDNA tubes.
1: O.lurida 5.6.12 2200 D1
2: O. lurida 5.6.12 400 D1
3: O. lurida 5.6.12 1000 D1
4: 106A6 5.16.12
5: 107B8 5.16.12
6: 108A7 5.16.12
Added 1ul Oligo-dT to 0.5 ug of RNA. Brought volume to 14uL with sterile water. Incubated at 72 for 5min and placed on ice.
Master mix:
Buffer: 41ul
dNTP: 41ul
RT: 8.2
Added 11uL of master mix to each sample. Incubated at 42 degrees for 1hr.
July 24, 2012
Designed primers to genes identified from yesterday's RNA-seq experiment.
Ran enrichment analysis using DAVID to identify potential biological processes of interest and selected genes involved in those processes as well as a few other's that I recognized and thought would be interesting.
having some trouble posting images from the "sites" folder right now. Need to ask sam about that so I can post images of my work flow.
July 23, 2012
Need to develop primers for Olympia oyster larval samples from FHL experiment. Previously I used a de novo assembly from the oly experiment conducted at the UW facility (larvae treated at 400 and 2000ppm) but since then Steven has played around with the data a bit more so I am going to run another RNA-seq analysis with his assembly to compare to mine prior to picking genes and generating qPCR primers.
Steven's de novo assembly .fasta file can be downloaded from this link to his notebook:
https://www.evernote.com/shard/s10/sh/97c8da2f-1262-4d58-b3be-4a0de2122f9e/97d072a0f80ad80039089a11cadb6dca
Annotation to GO_slim can be downloaded form this link to his notebook:
https://www.evernote.com/shard/s10/sh/fa2009c6-5190-4df5-93fc-e8e317bbd3b5/fbb2de86b1b60b431ea220c68a814dac
Oly OA
Made cDNA from DNAsed RNA samples 7/20/2012
Added 1ul oligo/dt to 0.5ug (13ul) of total RNA. Incubated 70deg 5min. Iced.
Added 11ul of RT mastermix
5xbuffer: 5ul
dNTPS: 5ul
MMLV RT: 1ul
Total Rxn volume = 25ul
Incubate 40deg 1hr. samples were stored at 4deg until tomorrow to avoid freeze/thaw prior to testing primers.
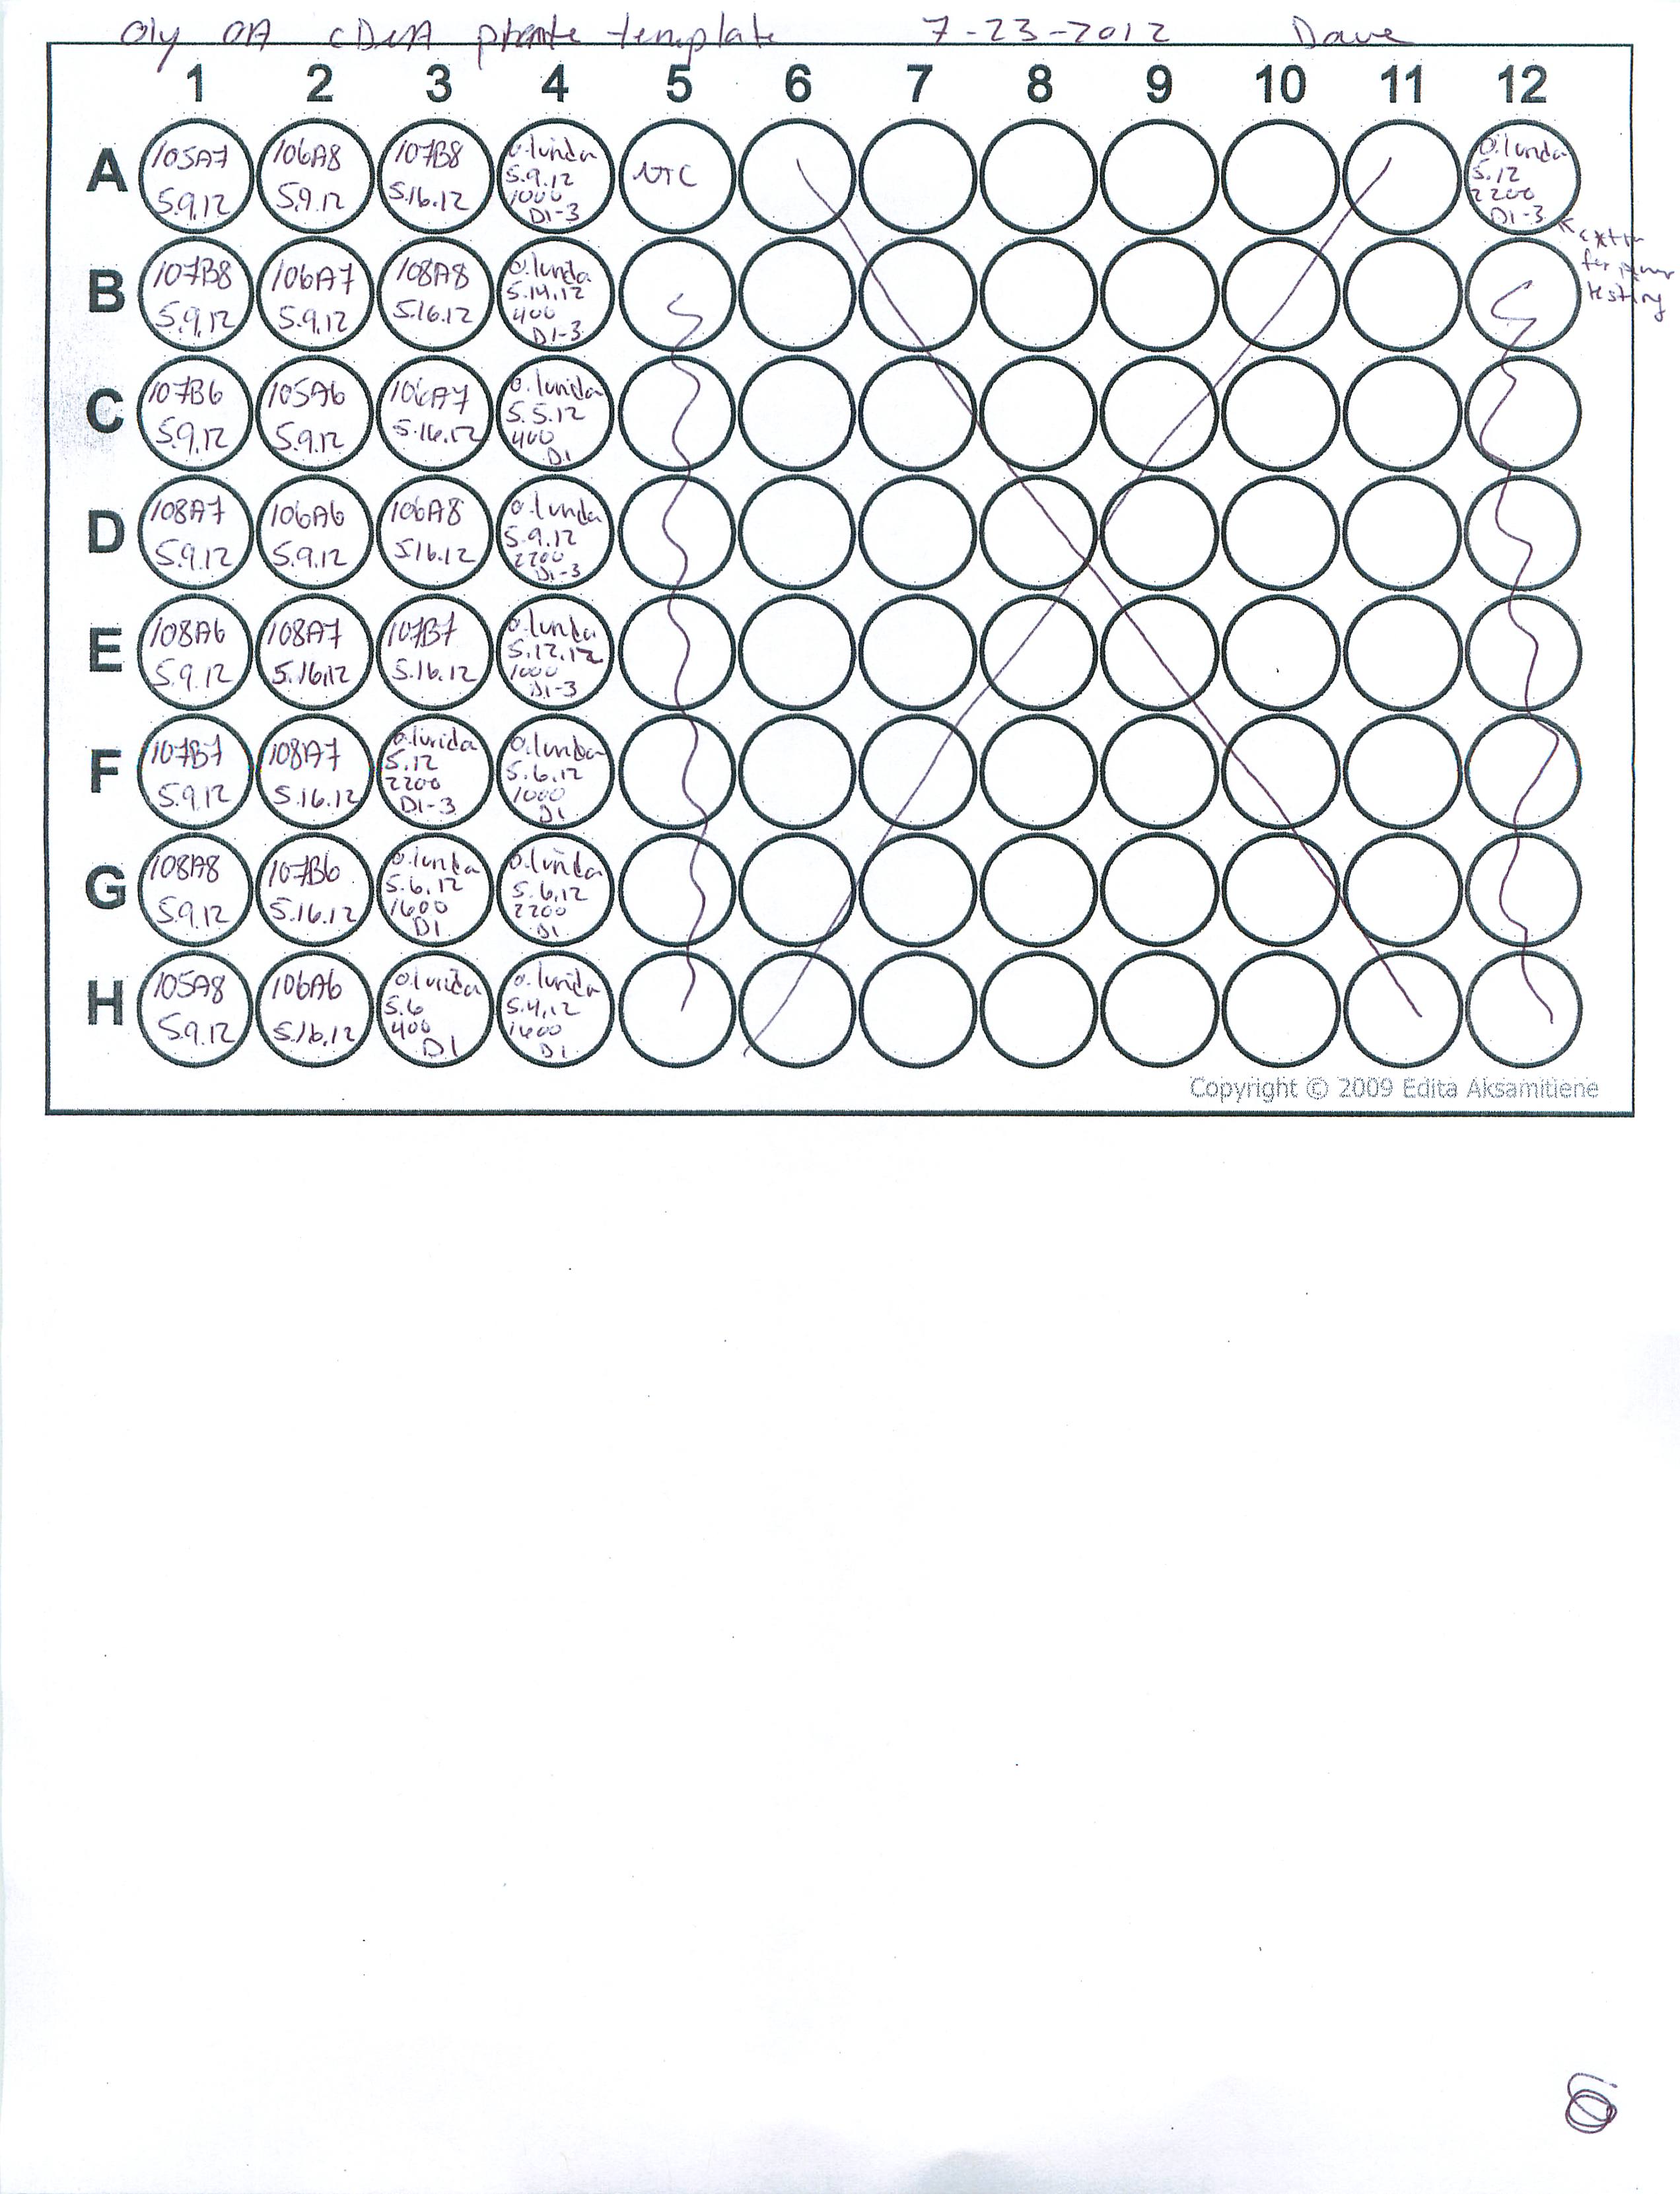
Below is a plate map of how samples were loaded and will be loaded for future qPCR assays...
July 20th, 2012
Set up DNase reactions of O. lurida larval RNA samples isolated on 7/18, 7/19, and Day1 RNA that Sam isolated. Mixed RNA and Water as described below to bring volume to 45 ul. Added 5ul 10x buffer and followed "Rigorous" protocol by adding 0.5ul DNase and incubated at 37C for 30 min and adding another 0.5ul for another 30min.
| Sample ID |
ng/ul |
ul sample |
ul water |
| 5-16-12 106A6 |
1239.26 |
6.46 |
38.54 |
| 5-16-12 106A7 |
338.22 |
23.65 |
21.35 |
| 5-16-12 106B7 |
1571.98 |
5.09 |
39.91 |
| 5-16-12 106B8 |
812.88 |
9.84 |
35.16 |
| 5-16-12 108A8 |
86.48 |
all |
|
| 5-16-12 108A7 |
303.86 |
26.33 |
18.67 |
| 5-16-12 107B6 |
101.51 |
all |
|
| 5-16-12 105A6 |
43.44 |
all |
|
| 5-9-12 106A8 |
49.39 |
all |
|
| 5-9-12 106A7 |
112.31 |
all |
|
| 5-9-12 105A7 |
118.54 |
all |
|
| 5-9-12 105A8 |
106.29 |
alll |
|
| 5-9-12 107B6 |
84.07 |
all |
|
| 5-9-12 107B8 |
33.84 |
all |
|
| 5-9-12 108A6 |
254.3 |
31.46 |
13.54 |
| 5-9-12 108A7 |
108.2 |
all |
|
| 5-9-12 108A8 |
69.39 |
all |
|
| 5-9-12 107B7 |
51.5 |
all |
|
| 5-16-12 108A7 |
131.14 |
all |
|
| 5-16-12 106A8 |
1119.51 |
7.15 |
37.85 |
| 5-9-12 106A6 |
66.35 |
all |
|
| O. lurida 5-6 400 D1 |
592.05 |
13.51 |
31.49 |
| O.lurida 5.14.12 400 D1-3 |
1254.59 |
6.38 |
38.62 |
| O.lurida 5.5.12 400 D1 |
624.42 |
12.81 |
32.19 |
| O.lurida 5.6.12 1000 D1 |
1096.71 |
7.29 |
37.71 |
| O.lurida 5.09.12 1000 D1-3 |
1443.59 |
5.54 |
39.46 |
| O.lurida 5.12.12 1000 D-3 |
1061.55 |
7.54 |
37.46 |
| O.lurida 5.4.12 1600 D1 |
271.97 |
29.42 |
15.58 |
| O.lurida 5-6 1600 D1 |
93.63 |
all |
|
| O.lurida 5-6-12 2200 D1 |
1128.51 |
7.09 |
37.91 |
| O.lurida 5-9 2200 D1-3 |
1096.27 |
7.30 |
37.70 |
| O.lurida 5.12 2200 D1-3 |
1324.9 |
6.04 |
38.96 |
| Sample ID |
Date |
ng/ul |
A260 |
A280 |
260/280 |
260/230 |
Constant |
Cursor Pos. |
Cursor abs. |
340 raw |
| DNase 5.9.12 105A7 |
7/20/12 |
68.14 |
1.703 |
1.1 |
1.55 |
0.23 |
40 |
230 |
7.408 |
0.008 |
| DNase 5.9.12 107B8 |
7/20/12 |
20.44 |
0.511 |
0.317 |
1.61 |
0.32 |
40 |
230 |
1.591 |
0.002 |
| DNase 5.9.12 107B6 |
7/20/12 |
50.72 |
1.268 |
0.764 |
1.66 |
0.38 |
40 |
230 |
3.363 |
0.008 |
| DNase 5.9.12 108A7 |
7/20/12 |
68.34 |
1.708 |
1.05 |
1.63 |
0.36 |
40 |
230 |
4.696 |
-0.005 |
| DNase 5.9.12 108A6 |
7/20/12 |
125.84 |
3.146 |
1.668 |
1.89 |
0.78 |
40 |
230 |
4.055 |
0.012 |
| DNase 5.9.12 107B7 |
7/20/12 |
35.97 |
0.899 |
0.497 |
1.81 |
0.5 |
40 |
230 |
1.784 |
0.006 |
| DNase 5.9.12 108A8 |
7/20/12 |
52.38 |
1.31 |
0.771 |
1.7 |
0.33 |
40 |
230 |
4.008 |
0.019 |
| DNase 5.9.12 105A8 |
7/20/12 |
67.92 |
1.698 |
1.08 |
1.57 |
0.21 |
40 |
230 |
8.011 |
0.017 |
| DNase 5.9.12 106A8 |
7/20/12 |
39.89 |
0.997 |
0.642 |
1.55 |
0.24 |
40 |
230 |
4.195 |
0.017 |
| DNase 5.9.12 106A7 |
7/20/12 |
73.27 |
1.832 |
1.189 |
1.54 |
0.2 |
40 |
230 |
9.182 |
0.035 |
| DNase 5.9.12 105A6 |
7/20/12 |
44.44 |
1.111 |
0.681 |
1.63 |
0.14 |
40 |
230 |
8.045 |
0.009 |
| DNase 5.9.12 106A6 |
7/20/12 |
43.86 |
1.096 |
0.694 |
1.58 |
0.24 |
40 |
230 |
4.624 |
0.007 |
| DNase 5.16.12 108A7 |
7/20/12 |
56.64 |
1.416 |
0.738 |
1.92 |
1.12 |
40 |
230 |
1.263 |
0.082 |
| DNase 5.16.12 108A7 |
7/20/12 |
128.38 |
3.209 |
1.636 |
1.96 |
1.55 |
40 |
230 |
2.076 |
0.034 |
| DNase 5.16.12 107B6 |
7/20/12 |
72.91 |
1.823 |
0.976 |
1.87 |
0.74 |
40 |
230 |
2.448 |
0.013 |
| DNase 5.16.12 106A6 |
7/20/12 |
125.41 |
3.135 |
1.564 |
2 |
1.72 |
40 |
230 |
1.818 |
0.015 |
| DNase 5.16.12 107B8 |
7/20/12 |
128.95 |
3.224 |
1.587 |
2.03 |
1.69 |
40 |
230 |
1.913 |
0.047 |
| DNase 5.16.12 108A8 |
7/20/12 |
74.09 |
1.852 |
1.033 |
1.79 |
0.71 |
40 |
230 |
2.605 |
0 |
| DNase 5.16.12 106A7 |
7/20/12 |
137.74 |
3.444 |
1.799 |
1.91 |
0.89 |
40 |
230 |
3.883 |
0.04 |
| DNase 5.16.12 106A8 |
7/20/12 |
116.49 |
2.912 |
1.478 |
1.97 |
1.78 |
40 |
230 |
1.636 |
0.045 |
| DNase 5.16.12 107B7 |
7/20/12 |
131.02 |
3.275 |
1.649 |
1.99 |
1.61 |
40 |
230 |
2.033 |
0.052 |
| O.lurida 5.12 2200 D1-3 |
7/20/12 |
140.73 |
3.518 |
1.77 |
1.99 |
1.56 |
40 |
230 |
2.25 |
0.093 |
| O.lurida 5.6.12 1600 D1 |
7/20/12 |
61.55 |
1.539 |
0.926 |
1.66 |
0.14 |
40 |
230 |
11.13 |
0.03 |
| O.lurida 5.6 400 D1 |
7/20/12 |
115.68 |
2.892 |
1.459 |
1.98 |
1.32 |
40 |
230 |
2.191 |
0.035 |
| O.lurida 5.9.12 1000 D1-3 |
7/20/12 |
154.09 |
3.852 |
1.926 |
2 |
1.59 |
40 |
230 |
2.42 |
0.044 |
| O.lurida 5.14.12 400 D1-3 |
7/20/12 |
127.04 |
3.176 |
1.589 |
2 |
1.6 |
40 |
230 |
1.986 |
0.039 |
| O.lurida 5.5.12 400 D1 |
7/20/12 |
127.66 |
3.192 |
1.627 |
1.96 |
1.47 |
40 |
230 |
2.176 |
0.04 |
| O.lurida 5.9.12 2200 D1-3 |
7/20/12 |
133.24 |
3.331 |
1.671 |
1.99 |
1.69 |
40 |
230 |
1.971 |
0.043 |
| O.lurida 5.12.12 1000 D1-3 |
7/20/12 |
151.63 |
3.791 |
1.932 |
1.96 |
1.62 |
40 |
230 |
2.335 |
0.043 |
| O.lurida 5.6.12 1000 D1 |
7/20/12 |
139.19 |
3.48 |
1.734 |
2.01 |
1.68 |
40 |
230 |
2.067 |
0.019 |
| O.lurida 5.6.12 2200 D1 |
7/20/12 |
134.96 |
3.374 |
1.7 |
1.98 |
1.68 |
40 |
230 |
2.013 |
0.045 |
| O.lurida 5.4.12 1600 D1 |
7/20/12 |
148.18 |
3.704 |
1.946 |
1.9 |
1.44 |
40 |
230 |
2.575 |
0.037 |
July 11th
Extracted RNA from gonad tissue that was isolated from frozen body on July 10th using TriReagent. RNA pellets were resuspended in 500ul of DEPC treated water and quantified using a nanodrop (see below).
| Sample ID |
Date |
ng/ul |
Vol mixed |
| Male 106A-3 |
7/11/12 |
216.4 |
4.62 |
| Male 106A-9 |
7/11/12 |
212.65 |
4.70 |
| Male 106A-23 |
7/11/12 |
621.41 |
1.61 |
| Male 106A-20 |
7/11/12 |
182.72 |
5.47 |
| Male 106A-17 |
7/11/12 |
164.6 |
6.08 |
| Male 108A-6 |
7/11/12 |
178.91 |
5.59 |
| Male 108A-20 |
7/11/12 |
186.76 |
5.35 |
| Male 108A-19 |
7/11/12 |
296.65 |
3.37 |
| Male 108A-5 |
7/11/12 |
219.46 |
4.56 |
| Male 108A-7 |
7/11/12 |
228.29 |
4.38 |
| Female 106A-11 |
7/11/12 |
270.42 |
3.70 |
| Female 106A-7 |
7/11/12 |
231.41 |
4.32 |
| Female 106A-21 |
7/11/12 |
93.71 |
10.67 |
| Female 106A-10 |
7/11/12 |
148.88 |
6.72 |
| Female 106A-6 |
7/11/12 |
347.53 |
2.88 |
| Female 108A-26 |
7/11/12 |
208.56 |
4.79 |
| Female 108A-8 |
7/11/12 |
203.32 |
4.92 |
| Female 108A-21 |
7/11/12 |
289.53 |
3.45 |
| Female 108A-23 |
7/11/12 |
177.2 |
5.64 |
| Female 108A-4 |
7/11/12 |
122.71 |
8.15 |
1ug of each sample was mixed for sequencing. Gender and treatments were kept separate for a total of four mixed samples. Each mixture contains ~5ug of total RNA in a volume of ~20ul.
| Sample ID |
Date |
ng/ul |
| Male 106a Mix |
7/11/12 |
230.45 |
| Male 108a Mix |
7/11/12 |
218.08 |
| Female 106a Mix |
7/11/12 |
183.32 |
| Female 106a Mix |
7/11/12 |
191.78 |
July 10th
Dissected gonad and digestive gland tissue from frozen oly bodies. Tomorrow will extract RNA from gonads.
July 9th
Basement update: Connected Durafet pH probe to honeywell controller. Next step will be to figure out how to connect the honeywell to the computer and how to connect the solenoid valves (to the honeywell, labview, or somewhere else?)
Oly update: Met with Carolyn, Steven, and Sam to discuss progress and future plans for oly genomics. Have whole body samples of oly adults, 4 male and 4 female from 400 and 2200ppm CO2 treatments. Need to dissect out pieces of gonad and DG. Will extract RNA from gonad and send for sequencing (Illumina HiSeq, paired end, 50bp reads).
Also have larvae samples from "several days" (need to find samples to identify exact sampling days) of the 11 day experiment. Larvae were treated with 400, 1000, 1600, or 2200ppm CO2 seawater. Can start extracting RNA for future qPCR assays but need to create the backbone from the gonads first (from samples described above).
Developed qPCR primers with Selina and Miranda (capstone students) to test on oly larvae from Muk. Developed 5 primer sets including ef1a as potential housekeeping gene. Sequences were identified using NGS data from oly larvae. They will be coming back on monday once reagents arrive to start RNA extractions and make cDNA.
Normalizing qPCR data with "zero" values.
Having samples in your qPCR dataset below the detectable limit of the assay (ie Ct >40) can impact the statistical analysis by disrupting the normal distribution of the data. This data, however, is still important and should be included in the statistical analysis. While there are nonparametric tests to get around datasets like this, these tend to lack in statistical power. Below is a method to transform your "zero" data so that it becomes normally distributed and appropriate for parametric analysis.
1st. Check the raw "relative" expression data first by plotting every point on a histogram as seen below:

Notice how the distribution is shifted to the left due to the abundance of "zero" values.
2nd. Now determine the appropriate transformation to achieve normalcy. Unfortunately in this case, each treatment group only has 7 datapoints which is not enough to see the true distribution of the data. To obtain enough datapoints, I will need to combine data from all treatments to have enough datapoints to see the distribution. To do this, transform the data so that it is centered around mean "0". Essentially what we are seeing above a dataset with two separate means. To determine the appropriate transformation procedure, we must first generate a dataset in which all of the datapoints are centered around the same mean. To do this, calculate the individual means and standard deviations for each individual treatment group. For each datapoint, subtract the mean from the group and divide by the standard deviation. The data should now be transformed to a single mean of zero and a standard deviation of one. Test this by adding all of the values from a treatment group together, this should equal zero.
Now plot the histogram again:

Note at the distribution is still shifted to the left, but that's ok. We now have a dataset that is large enough to test different transformation to achieve normalcy.
3rd. Transform the data. Because qPCR data is normalized to a housekeeping gene, the expression values are actually proportions and should be transformed by taking the natural log (ln) of the data. Additionally, because the distribution is shifted, there needs to be some sort of adjustment to center the distrubtion, this can be done simply by adding "1" to the relative expression data prior to taking its natural log. Taking the natural log of one plus the relative expression value for each individual datapoint will results in the following histogram:

Check out that curve!!
this indicates that the following transformation ln(relative expression value +1), when applied to the data, will result in a normal distribution even when zeros are present.
Now, go back to the original "relative expression data," forgetting all of that "center around mean zero" business (remember that was just to test different transormations and is not useful for the actually statistical analysis), and apply the ln(relative expression value +1) transformation and run some stats!
April 9, 2012
For the past three days I've been running qPCR assays on the juvenile manila clam gill tissue from the FHL experiment.
All qPCR master mixes were made as follows (with the appropriate primers of course!)
MasterMix: 1010uL
Fwd Primer: 50.5uL
Rev Primer: 50.5uL
Water: 707uL
Plate map for all of the assays is the same and can found here.
Note on naming: Names correspond to treatment tank ID and sampling date
101A# = Ambient treatment plus replicate tank number
102A# = Elevated treatment plus replicate tank number
1/24/12 = Week 1
2/1/2012 = Week 2
2/9/2012 = Week 3
so....101A7 1/24/12 would be and ambient treatment from replicate tank 7 sampled on week 1.
Links to raw data are linked to the assays below:
Calmodulin
Elongation factor 2
hsp90
Perlucin-6
Cathepsin
GPX3
Elongation factor alpha
Analysis Note: Two samples consistently displayed delayed amplification curves corresponding to wells E1,E4,G4,andG10 on the plate map. These samples were removed prior to miner analysis as they are most likely technical outliers.
PCR miner was used to calculate efficiencies and raw expression values. All expression data was normalized to elongation factor alpha expression values.
Ran two-way anova analysis on time and treatment for all assays....no significant differences were detected in any of the assays.
Results!
Blue=ambient
Red=elevated


Still need to run stats to see if there's anything interesting hidden in all of this data!
April 2, 2012
First qPCR assays I would like to run on my "real" samples are:
Perlucin
Ef1 alpha
Calmodulin
GPX3
Ef2
Cathepsin
April 1, 2012
Ran qPCR assays on R.philippinarm gill and mantle tissue to test new primers. Summary of results is as follows:
Perlucin:
Low expression in gill and mantle (Ct~39). Consistent with what was seen in larvae. Allows for potential induction?
Melt curve looks good.
GPX3:
Higher in gill compared to mantle but expressed at low levels in both (Ct ~38)
Melt curve looks good
Beta Actin
Good expression (Ct in low to mid 20's). Higher in gill compared to mantle.
Bad Melt curve!
Ef1 alpha
Good expression (Ct in low to mid 20's). Higher in gill compared to mantle.
Great melt curve
Better normalizer assuming treatment has no impact.
f0 ATP
No expression in gill or mantle.
EF2
Good expression (Ct in low to mid 20's). Higher in gill compared to mantle.
Great melt curve
f1 ATP
Good expression (mid 20's). Similar between gill and mantle.
Poor melt curve
hsp70
Good expression (mid 20's)
Questionable melt curve....isoforms?
NADH
Good expression (mid 20's)
Questionable melt curve
Crumbs
Good expression in both tissues (mid 30's)
Great melt curve
Calreticulin
Good expression (mid to late 20's)
Questionable melt curve
Prefolding
Good expression (late 20's)
Questionable melt curve
Calmodulin
Good expression (late 20's). higher in gill compared to mantle
Good melt curve
hsp90
good expression (mid 20's)
good melt curve
Cathepsin
Low expression in both gill and mantle (late 30's)
Good melt curve.
Results Summary:
1. Assays that are good to move forward with are Perlucin, GPX3, EF1 alpha, EF2, Crumbs, Calmodulin, hsp90, and Cathepsin.
2. Could try out f0 ATPase assay using "acidified" tissue to see if there's any detectable expression.
3. Could also adjust Tm to clean up some melting curves but at this point I think I have enough assays to work with and will only do this if I need more options.
March 16, 2012
Because most of the assays that I designed from Ruphibase contigs did not amplify, there is a possiblity that these genes are only expressed, or at least expressed at detectable levels when exposed to higher CO2 conditions. I am going to re run the assays that showed no amplification using a small amount of pooled cDNA that Sam prepared from my experimental samples (ie clams exposed to 1000ppm CO2 seawater)
Used the same mastermix ratio as listed below.
Again, nothing amplified.
One the plus side, I forgot to test the Serum Lectin assay that I designed awhile ago to the available genbank sequence and it looks good! just nothing designed to Ruphibase looks great. Will to back to the drawing boards to see what's going on with primer designs etc.
March 15, 2012
Testing R.philippinarum qPCR primers on gill and mantle tissue.
Resuspened all primes in RNase free water to a stock concentration of 100uM. Diluted 1:10 to make working stocks of 10uM.
Pooled identical cDNA samples from March 9, 2012 to make 3 gill and 3 mantle cDNA samples. Pooled equal amounts of gill and mantle to make a working stock of cDNA, diluted 1:5 with RNase free water. Will run pooled gill and pooled mantle cDNA in triplicate.I'm not sure which tissue (if any) these genes will be expressed in so by testing both gill and mantle at the early stages of assay validation I will have a better idea of what to expect later on.
Set up Sso Fast qPCR mastermix
Sso Fast qPCR Mix: 10uL
Forward primers: 0.5uL
Reverse primers: 0.5uL
Water: 7uL
Add 18uL of master mix to each well
Add 2uL of cDNA as template
Raw qPCR data and plate map can be found in the qPCR data file.
March 9, 2012
Extracted RNA from juvenile clam gill and mantle tissue.
This tissue came from the same group of clams that were used in the FHL experiment during Jan/Feb or this year. These were not subjected to any kind of treatment other then sitting in the basement at UW for a week until I could get around to sampling them.
The purpose of these extractions is to have RNA from clam gill and mantle of the same age as used in the experiment to test the primers once they come in.
Set up RT reactions
Added sterile water to 1ug RNA to bring to 9ul. Added 1ul Oligo-dt. Incubate
Ran RT reactions in triplicate for each sample
| RT Rxn |
1x |
15x |
| 5x MMLV Buffer |
5 |
75 |
| dNTPs |
5 |
75 |
| MMLV |
1 |
15 |
| Water |
4 |
60 |
March 8, 2012
Ordered primers for R.philippinarum juvenile clam qPCR assays. (Check primer stock list for sequences).
Primers were designed based on Ruphibase contigs. Some of the sequences (ie. beta actin) are different from previously reported genbank submissions. Will test primers designed to each sequence and assess expression pattern before proceeding with full assays.
February 29, 2012
Some summary stats for manila larvae libraries.
1000ppm:
17,411 of the 23,944 contigs in Ruphi base were represented in the 1000ppm library (>10 reads)
Average Coverage = 44.9
Average Length of Consensus = 197.76
Average number of reads = 861.54
400ppm:
18,333 of the 23,944 contigs in Ruphi base were represented in the 400ppm library
Average Coverage = 97.04
FHL Heat Shock Summary
| Tank |
Temp |
2/11 |
2/12 |
2/13 |
2/14 |
2/15 |
2/16 |
2/17 |
| 101A1 |
38 |
0 |
0 |
0 |
1 |
0 |
2 |
|
| 101A2 |
38 |
0 |
0 |
0 |
0 |
0 |
0 |
|
| 101A3 |
39 |
0 |
0 |
2 |
2 |
2 |
1 |
|
| 101A4 |
39 |
0 |
0 |
2 |
3 |
2 |
- |
- |
| 101A5 |
40 |
0 |
1 |
4 |
2 |
- |
- |
- |
| 101A6 |
40 |
0 |
0 |
4 |
2 |
1 |
1 |
- |
| 102A1 |
38 |
0 |
0 |
0 |
0 |
0 |
2 |
|
| 102A2 |
38 |
0 |
0 |
0 |
0 |
0 |
2 |
|
| 102A3 |
39 |
0 |
0 |
2 |
4 |
1 |
- |
- |
| 102A4 |
39 |
0 |
0 |
2 |
5 |
- |
- |
- |
| 102A5 |
40 |
0 |
1 |
6 |
- |
- |
- |
- |
| 102A6 |
40 |
0 |
2 |
5 |
- |
- |
- |
- |
Manila OA Workflow: Combining with Ruphi annotations for GO enrichment analysis
1.Download all contigs from ruphibase by selecting "ID" and "Sequence" from their query menu and clicking "search." By not filling in any of the spaces above, the download will automatically begin.
Ruphi fasta file

2.Upload sequence to CLC.
3. Run a reference assembly with 400ppm and 1000ppm Manila OA Illumina Hiseq libraries using the ruphibase contigs as the backbone. Make sure unmapped reads are saved as a separate file.


4. Run a de novo assembly using the unmapped reads from the de novo assembly in step 3. This should, in theory, provide you with a list of contigs not present in ruphibase.


5. Open the new file generated from the de novo assembly, select all of the lines in the file and click on "open consensus" to save the consensus sequences from the de novo assembly as a separate file.

6. Export the consensus sequence file as a .fasta.
Consensus sequences from de novo assembly of unmapped reads
7. Export the ruphibase .fasta file from CLC (same file as step 1).
8. Open both the fasta file from ruphibase and the fasta file from the consensus sequences of the de novo assembly of unmapped reads (fastas from step 6 and 7)
9. Copy and paste the two .fasta files together to make a single fasta file. Upload this new .fasta file to CLC. This is now a combined sequnce file that contains all of the ruphibase contigs plus all of the contigs generated from the de novo assembly of the unmapped reads.
Combined Ruphi and Manila fasta file
Combined Ruphi and Manila txt file
RNAseq analysis
10. Using the uploaded file from step 9 as a backbone, run RNAseq analysis for both the 400ppm and 1000ppm Manila OA Illumina Hiseq libraries.


Annotate consensus contigs from step 6
11. Upload the .fasta file exported from step 6 to the SAFS Inquiry Portal for annotation. Click on NCBI then Blastall. Upload the .fasta file, select blastx from the dropdown menu, and swissprot from the protein database. Change both short descriptions and alignments go "1" and change output to "tabular"


12. When the blastx is complete (this can take awhile), download the .txt file
13. Upload the.txt Blastx file from step 8 to Galaxy.
14. Join the uploaded table containing blastx output with swiss prot identifiers using (these are not provided and must be downloaded from the swissprot database or obtained from steven).

TABLE JOINING
Upload the following tables to Galaxy
A. Annotations from BlastX
NOTE: Need to separate column using "|" as delimiter so that SPID is isolated
B. Uniprot swissprot titles
C. Associates uni swissprot
D. GO to GOslim
Joined tables in order listed above
Joined A&B based on SPID column
Join new table with table C based on SPID column
Join new table with Table D with GO ID column
15. Download the newly combined table which now contains Blastx information (ie. E-values) as well as swissprot identifiers such as species and gene name and the associated GO terms.
16. Sort the entire into two categories. One category contains all contigs more likely to be clam sequence, the second category contains all contigs most likely not clam contigs. This was done by looking at the species ID and keeping all species from worms and higher as potential clam genes, and all plants, algae, virus, bacteria, fungi, protist etc. as not clam genes.
Sorted file can be found here
17. Create a separate file that contains only the contig identfiers and the associated go terms for the "clam" genes and upload this to galaxy as a .txt tabular file.
18. Following this how to video, concatenate all of the go terms for a contig ID into a single cell.
19. Download the file and open in excel. Change all "GO:" into three hash lines "///" this is the code that CLC will use to identify the following number as a GO term and save as .csv file.
For more information on formatting annotation files for CLC click on this link.
Note: Make sure the column headings appear exactly as they do in this video or CLC will not identify this file as an annotation file.
20. Download IDs and GO terms from ruphibase.
Ruphi GO IDs

21. Open in excel. Combine all GO terms into a single cell sing the following command "=A1&B1&C1...etc..."so that all cells containing a GO term are included.
22. Paste all of the ruphi IDs and their associtaed GO terms into the .CSV file generated in step 19. You now have a complete list of all GO terms corresponding to all contigs used in the RNAseq analyis.
Complete list of Ruphi and Manila GO annotations formatted for CLC Annotation
23. Upload the annotation file to CLC. The how two video is in the second half of the video from step 18.
Running an Experiment and HyperG analysis in CLC
24. Create an experiment in CLC using the RNAseq files generated in step 10.
25. Using the newly generated experimental file, run statistical analysis on proportions to obtain p-values.

26. Annotate the experimental file using the uploaded .csv file from step 23.

27. Sort the experimental file based on fold change so that all contigs >2fold and <-2fold are kept. Accomplish this by making sure the "must satisfy at lease one parameter" option is selected.
28. "Select all" and open as a sub experiment.....no need to save this yet.
29. Sort the data again based on p-vale so that all remaining lines have a p-value <0.05.
30. Now select all lines and save this as a sub experiment ( it will actually be a subexperiment subexperiment).
31. Run hyper G analysis using the original experimental file and the new subexperiment file from step 30 (See figure from step 26).
Hyper G File
32. Congrats! you now have a list of enriched GO terms that you can upload to REViGO or do whatever!

February 15, 2012
Yesterday I started analysis of the manila OA data but using a combined backbone of ruphibase and manila OA contigs.
First I did a reference assemble of the manila OA reads to ruphibase and kept all reads that did not align.
Next I did a de novo assembly of the unmapped reads to assemble a list of contigs presumably not represented in ruphibase
I then exported .fasta files for both ruphibase and the contigs from the de novo assembly of unmapped reads and joined them together (copy and paste).
Next I uploaded the joined file into CLC and used this combined list of contigs as my backbone for RNAseq
Total number of contigs in ruphibase alone = 32,606
Number of reads for manila OA that map to ruphibase = 27,414
Number of reads that do no map to ruphibase =173,329,257
Total number of contigs from de novo of unmapped reads = 14,135
Total number of reads from de novo that map = 33,473,330
Total number of contigs in combined RuphiManilaOA = 46,740
Parameters from de novo assembly of unmapped reads:
Minimum contig length = 200
Limit = 8
Cost = 2
Summary statistics from RNAseq analaysis of Manila OA contigs to the combined RuphiOA backbone
Parameters:
minimum number of reads = 10
Max mismatch = 2
Total number of contigs with fold change > 2 and p-value < .05 = 3,087
1000ppm
mapped reads=32,507,593
unmapped reads=35,183,627
400ppm
mapped reads = 80,996,394
unmapped reads = 94,728,618
....46.6% of all reads incorporated in RNAseq analysis!
February 10, 2012
Working on GO enrichment analysis from Manila clam RNAseq analysis using the combined De novo assembly from our Illumina Hiseq libraries and the Ruphi database.
Some summary statistics:
Total number of significantly enriched GO processes: 10
Number of genes associated with those processes: 562
February 6, 2012
Reran de novo on manila clam Illumina data. Combined illumina data and ruphibase in de novo assembly.
= 30,053 contigs
Original number of contigs from Ruphibase = 32,606
hm.....I seem to be losing contigs AFTER assembly Ruphibase with Illumina compared to just Ruphibase. There are 1,183 contigs in Ruphibase that are < 200pb. These would be lost due to setting a minimum contig length to 200pb for my de novo assembly.
If other contigs from Ruphi are not present in my illumina library then those would also be lost becuase of my minimum number of reads = 10 setting...
Ran RNAseq analysis with 400ppm and 1000ppm data using the combined Illumina/Ruphi consensus sequences
= 8,483 contigs significantly regulated (Fold>2, P-value<.05)
Still Testing O2 probes.
Set up six replicate jars with 5 clams/jar
waited 5min after insterting probe to allow them to equilibrate before recording first (time 0) measurement. Recorded O2 every 10min for one hour.
| Time |
Jar 1 |
Jar 2 |
Jar 3 |
Jar 4 |
Jar 5 |
Jar 6 |
| 0 |
9.4 |
9.3 |
9.7 |
9.4 |
9.7 |
9.7 |
| 10 |
8.6 |
9.1 |
9.2 |
9.3 |
9.3 |
9.4 |
| 20 |
7.7 |
8.8 |
8.7 |
8.7 |
9.1 |
9.2 |
| 30 |
7.1 |
8.6 |
8.5 |
8.5 |
8.7 |
8.7 |
| 40 |
6.7 |
8.3 |
7.9 |
8.1 |
8.4 |
8.8 |
| 50 |
6.4 |
8 |
7.7 |
7.8 |
8.1 |
8.5 |
| 60 |
6.2 |
7.8 |
7.5 |
7.7 |
7.8 |
8.4 |
Testing O2 probes from Kristian:
Probe Model: PinPoint II from American Marine Inc.
Probes are extremely sensitive to movement. It takes ~5min for probes to settle and calibrate. Takes another ~5min once reading starts for probes to settle down. Once this is accomplished the probes read within 0.3 units of each other....close enough? Touching the probe caused O2 readings to jump. Considering that the probes will have to be swirled to ensure even mixing, this is a consern.
Starting O2: Determined by measuring the jars without animals in them and swirling probe = 10.1ish
O2 after 20min: 9.3 and 9.1....difference could easily be due to different sized clams in each jar.
Note: Be careful not to bump clams. Pull probe as high as possible while keeping metal "dot" submerged.
Looks like probes do detect changes in O2 when 5 clams are placed in the jars....
January 31, 2012
Juvenile Clam HS at FHL
2 white, 2 purple, 1 yellow dead
Final Tally: All yellow (40) dead, 2 purple (39) alive, 6 white (38) alive.
Result: 40 is the new lethal temp (up from 39)
FISH546
Repeating the de novo assembly. Change parameter for "minimum contig length" from 100 as previously run to 200.
Result: 48,222 contigs with an average length of 539 with 149,896,928 reads mapping out of 387,720,843 (39%). Still a fairly high percentage mapping compared to previous data sets and much more then I original thought after doubling the minimum contig length.
Will proceed with RNA-seq, annotation, GO enrichment etc. with this second denovo aka "de novo 200" and compare to "de novo 100"
January 30, 2012
Clam HS FHL
1 white dead
FISH546
RNAseq notes: 6,020 contigs out of 134,810 are significantly regulated (Fold Change > 2, P-value <.05)
22 unique to 400ppm
0 unique to 2000ppm...interesting.
January 29, 2012
3 yellow, 2 purple dead
FISH546
De novo assembly of Oly Illumina HI-seq reads
Results:
Out of 387,720,843 total reads, 181,293,112 mapped to 134,810 contigs! Granted, there are not as many genes in the clam genome as I have contigs but it's still pretty exciting that 47% of the reads were mapped!
Exported consensus sequences and saved as .fasta. Uploaded to inquiry and used blastx to swissprot to annotate.
Started RNAseq analysis for the 400 and 2000ppm libraries.
January 28, 2012
1 yellow dead
January 27, 2012
1 yellow dead
January 26, 2012
1 purple and 1 yellow dead
January 25, 2012
Clam LT Trial
1 dead yellow (40)
1 dead purple (39)
Olympia Oyster Larvae
Illumina Hi-seq data from the Olympia oyster larval experiment arrived today
2000ppm
192,340,255 total reads
400ppm
196,054,564 total reads
Good news: Librarys are pretty even pre trimming!
Started quality trimming:
FISH546
Trying to replicate Steven's results using the hard clam data. Only difference between analysis (besides user) is that I performed the de novo, RNAseq, etc.. independently.
920 differentially expressed genes (2fold, P<.05) no E-value limit. Removed duplicate Contig/SPIDs
13 unique in Barns
5 uniquq in Mash
344 remain after keeping e-values <0.009
313 after deleting duplicate SPIDs
Uploaded SPIDs as genelist to DAVID
For background gene list, keep all genes with e-values <0.009.
2019 remain after dups removed.
Downloaded the "Gene_Ontology" "GOTERM_BP_FAT" File from DAVID
Open file in Excel and separate "Term" column by "~" to isolate just the GO ID. Copy and paste GO IDs and associated P-values to REViGO (Only terms P < 0.05)
WOW!
Not similar to Steven's results but really interesting considering the experimental objective...
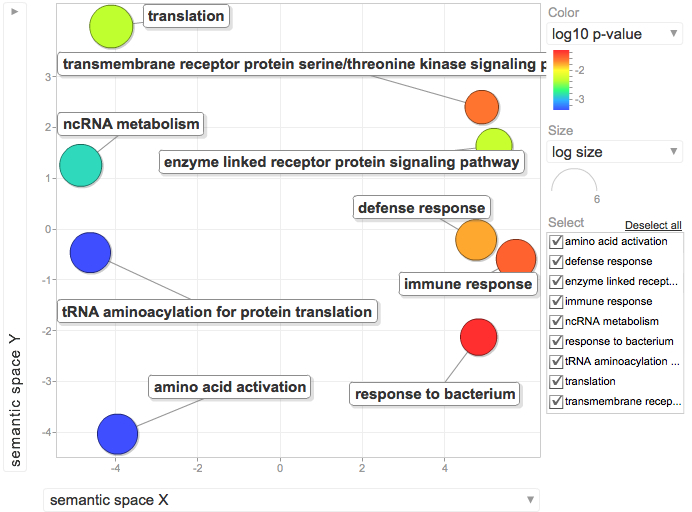
Isolate SPIDs from enriched GO terms presented above
61 unique genes from GO enrichment....seems low.
Upload SPID list to Galaxy and merge with RNAseq master file to identify gene names and regulation pattern.
January 24, 2012
Juvenile clam OA exp
Drove up to FHL with Carolyn to sample clams, oysters, and geoducks for her feeding experiment. I will piggy back on the clam experiment and take genomic samples every week for three weeks before exposing them to LT thermal stress.
Experimental overview
pCO2 treatments: 400ppm and 1000ppm
8 reps/treatment
8 clams per rep
n=64 total clams per treatment
Today I dissected one juvenile clam from each replicate tank (total n=8/treatment). Isolated gill, mantle, and the rest of the body in separate tubes and froze in LN2 for future RNA extractions.
Emma took water samples and processed them for TA today. Not sure how many.
Will update with other details tomorrow when I have carolyn's notebook
Need info on:
Start Date
Treatment temp
Flow rate
Chemistry sampling (spec pH and TA)
LT trial:
Started another trial experiment to confirm lethal temp for new clams. Previous trials identified the LT at 39 degrees C. Will test 38, 39, and 40. Emma will be at FHL all week to check mortalities for me...thanks Emma!
Notes:
n clams=8/temp
10min pre incubation at designated temperature
After 10min, moved clams to second beaker and incubated 1hr.
After 1hr, moved clams to ambient 13 degree C water
Color Code:
White = 38
Purple = 39
Yellow = 40
Below is a copy/paste from Carolyn's email regarding system/experimental specs
"We are targeting 400 uatm (pH 8.03) and 1000 uatm CO2 (pH 7.67) at 13C for the 2 treatments. 1.9L/hr is flow rate and jars are 3L suing drip emitters. Seawater is stripped of CO2 using membrane contactors under vacuum. A Honeywell controller connected to a Durafet pH probe are used to set the pH as a proxy for desired CO2 level. CO2 is mixed with CO2-free air using gas proportionators (is this rigth Emma) and solenoid valves into a venturi injector. Emma can correct all of my errors. Also what she is doing is in her paper.
Feeding, I forget...sorry...Emma we need you :-)
There are 20 ducks, 10 manila, 10 gigas and 4 lurida in each jar.
Attached is most of the starting data. Once Emma drops off my notebook, I'll add in the rest of the data.
cheers,
C
ps I collected the animals on jan 9 and took to FHL on the 10th. manila clams were fedex'd on the 10th to FHL to arrive the 11th. Feb 14 was when we measured the animals and placed into the system and CO2 was turned on on the 16th. Ambient was 11C. You will need to add a BIG thank you to Ro for helping set up the experiment as he helped make bivalve pillow bags (so did Robyn) and he also helped Emma and I weigh, measure, and enter data. Emma is taking all pics of morts and did so at start and is running the entire system, with the help of Moose O'Donnell and Matt?? (not sure of his last name) and this is all being done in Emily Carrington's lab....did I forget anyone?"
January 16, 2012
Modified "significantly regulated" genes to be those with E-value <.001 Fold Change >2.0 and P value < 0.05
REViGO results
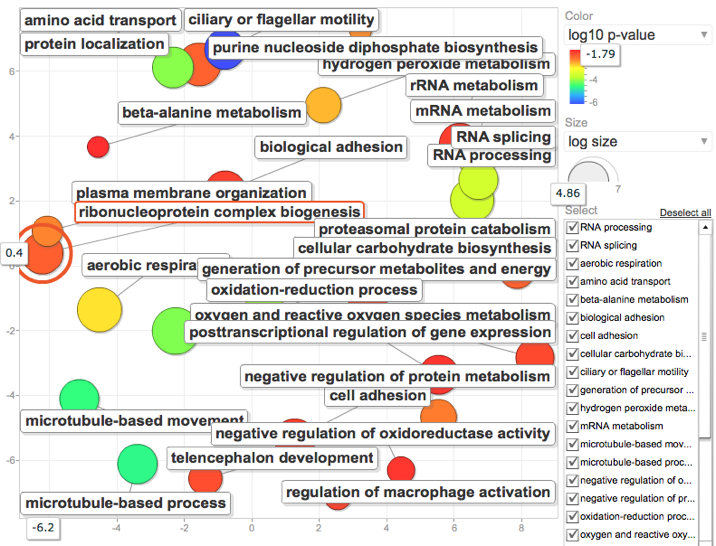
January 12, 2012
FISH546
Tweaked my parameters a little to see how this would affect the GO enrichment analysis
Specifically: Instead of using 1e-5 as my E-value cutoff I tried using .001. From this I generated my "background" or reference list of annotated genes to do my GO enrichment analysis from. Generated a new page of all SPIDs that fid the E-value .001 cutoff.
I then generated a list of genes I considered to be "significantly" regulated using a 2Fold cutuff in expression and Pvalue of 0.1. Yes 0.1...Since I'm dealing with a non model and only a fraction of my genes map to the de novo and only a fraction of those can be annotated, I'm already starting with a reduced library and want to give my self the best shot at finding something interesting by using a loose parameter that is within the realm of acceptability. Dr. Conquest also convinced me in last quarters class that 0.1 is better anyway. Once the data was sorted by the designated E value, P value, and Fold enrichment, I generated a second list of those SPIDs to use as my gene list in the DAVID analysis.
Following the same steps as described below, I generated a list of enriched GO processes and visualized with REViGO
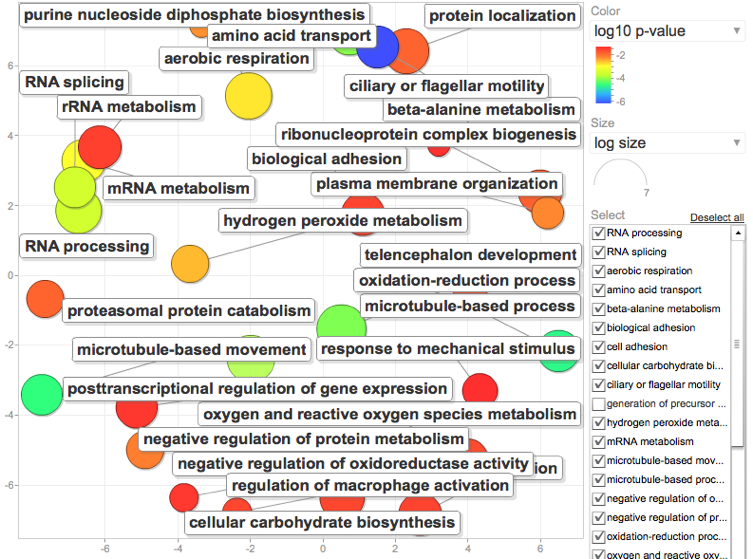
Yuck. Super cluttered but goes to show you what a difference changing the E value from 1e-5 to .001 can do. Since this seems to generate a lot more information, I now want to go back and try the same keeping E.001 but change the P-value to .05.
January 10, 2012
FISH546
Ran CLC experiment with RNAseq files created January 9, 2012.
Upon completion of experiment, performed Baggerly's statistitcal analysis on proportions.
Paramaters for "experiment" and subsequent statistical analysis are found in the screen shot below...
ANNOTATING CONSENSUS SEQUENCES FROM DE NOVO
Exported consensus sequenses as .fasta file
Open SAFS inquiry portal
---> NCBI
---> BLASTALL
---> Select BLASTX from dropdown menu
---> Upload the .fasta file containing your consensus sequences
---> Select "Swissprot" database from protein database dropdown menu
---> Scroll to bottom and change both "short descriptions" and "how many alignments" to "1"
---> From "alignment view option" select "tabular" form the dropdown menu
--->START BLASTALL
Downloaded tabular file from blastall result
TABLE JOINING
Upload the following tables to Galaxy
1. RNAseq experiment with stats
NOTE: remove spaces from "consensus from contig #" so that it will match the annotation file from the BLASTX
2. Annotations from BlastX
NOTE: Need to separate column using "|" as delimiter so that SPID is isolated
3. Uniprot swissprot titles
4. Associates uni swissprot
5. GO to GOslim
Joined tables in order listed above
Joined 1&2 based on "consensus from contig" column
Joined with 3 based on SPID column
Joined with 4 based on SPID column
Joined with 5 based on GO ID column
Here's the unfiltered data after all that table joining...
ENRICHED GO ANALYSIS
--->Sorted table based on E-vale and removed all annotations with e-values < 1e-5
--->Removed all duplicate SPIDs and uploaded the SPIDs as the "background" list in DAVID
--->continued sorting by fold change and removed all contigs <2 fold differentially expressed between libraries
--->Sorted again based on p-value and removed all contigs wiht p-values <0.1
--->Uploaded remaining SPIDs to DAVID as the "gene list"
--->Select "Gene Ontology" form menu
--->Select "Chart" next to "GOfat" and download the associated table.
--->Separate the GO ID from the GO annotation in the chart downloaded from DAVID
--->Copy the GO ID and the associated P-value (only those with P-values<0.1)
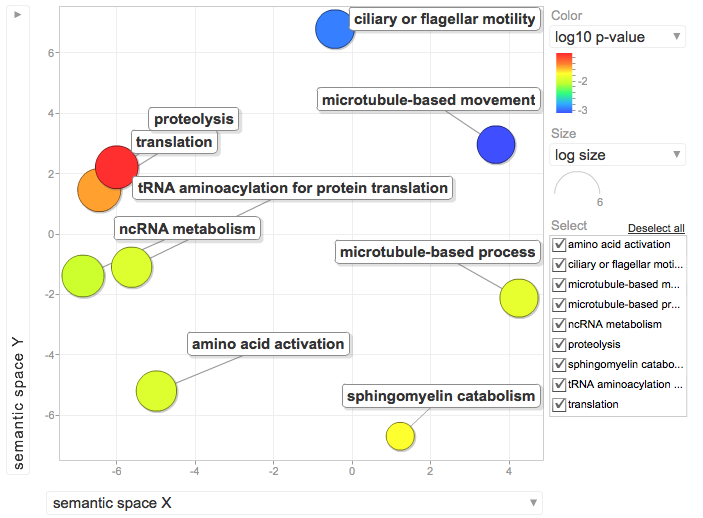
--->Paste into REViGO screen and run REViGO visualization
January 9, 2012
FISH 546
Ran De novo assembly of MX and BX hard clam data.
Results: 8,842 lines
Exported consensus
Started RNAseq analyis. Started two RNAseq jobs. one for MX and one for BX. Both use consenesus contigs from de novo assemble described above.
January 5, 2012
Dropped of water samples at NOAA for DIC/TA analysis. Cynthia thought it would take roughly 3 weeks before I would get the data back. Sample information provided to PMEL can be found in the chart below.
| Sample ID |
Sample Date |
Salinity (ppt) |
DIC (umol/kg) |
TA (umol/kg) |
Spectrophotometric pH (all measured at 25C) |
Sampling Temp. (C) |
Notes |
| 2000ppm |
12/15/11 |
33 |
7.31 |
17.4 |
100 ul saturated HgCl2 |
||
| 750ppm |
12/15/11 |
33 |
7.64 |
17.4 |
100 ul saturated HgCl2 |
||
| Ambient |
12/15/11 |
33 |
7.79 |
17.4 |
100 ul saturated HgCl2 |
||
| 2000ppm |
12/17/11 |
33 |
7.32 |
17.4 |
100 ul saturated HgCl2 |
||
| 750ppm |
12/17/11 |
33 |
7.67 |
17.4 |
100 ul saturated HgCl2 |
||
| Ambient |
12/17/11 |
33 |
7.77 |
17.4 |
100 ul saturated HgCl2 |
January 4, 2012
Pooling total RNA from Oly OA experiment for NGS sample prep.
Typically, at least 200ng of mRNA is needed to make a library. Assuming 1% recover of mRNA from total RNA quantity, a minimum of 20ug of total RNA is needed. To be conservative, I'm aiming for 40ug of total RNA.
Pool:
400A: 15.85ul
400B: 13.41ul
400C: 19.41ul
2000A: 11.81ul
2000B: 11.09ul
2000C: 14:43ul
Spec pooled samples using nanodrop
| Sample ID |
User ID |
Date |
Time |
ng/ul |
A260 |
A280 |
260/280 |
260/230 |
Constant |
Cursor Pos. |
Cursor abs. |
340 raw |
| 400 |
Default |
1/4/12 |
10:44 AM |
822.78 |
20.569 |
9.589 |
2.15 |
2.09 |
40 |
230 |
9.863 |
0.872 |
| 2000 |
Default |
1/4/12 |
10:45 AM |
1062.93 |
26.573 |
12.461 |
2.13 |
2.18 |
40 |
230 |
12.205 |
0.699 |
400 total volume after spec = 45ul = 37ug total RNA
2000 total volume after spec = 35ul = 37ug total RNA
lookes good! Gave pooled samples to Sam to drop off at the UW HTGU and put the remaining total run samples into the "Dave's Clam OA larvae" box on the bottom shelf of the -80.
January 3, 2012
Talked with Steven and Carolyn and both agree that days 1-3 of the ambient(400) and the 2000 treatment should be pooled to make NGS libraries. Sam is out today so I will do the pooling tomorrow before he takes them to the UW HTGU downtown.
January 2, 2012
Back in the lab for a quick round of RNA extractions from the Oly OA experiment (See below).
Extracted all nine samples from the experiment (days1-3 from ambient, 750, and 2000ppm) using tri reagent.
Added 300ul Trireagent, homogenized, added remaining 700 and followed the rest of the standard protocol.
Samples were resuspended in 100ul sterile water and quantified using the nanodrop.
| Sample ID |
User ID |
Date |
Time |
ng/ul |
A260 |
A280 |
260/280 |
260/230 |
Constant |
Cursor Pos. |
Cursor abs. |
340 raw |
| 400 A |
Default |
1/2/12 |
12:27 PM |
841.24 |
21.031 |
9.715 |
2.16 |
2.16 |
40 |
230 |
9.734 |
0.771 |
| 400 B |
Default |
1/2/12 |
12:28 PM |
994.01 |
24.85 |
11.407 |
2.18 |
2.19 |
40 |
230 |
11.344 |
1.089 |
| 400 C |
Default |
1/2/12 |
12:28 PM |
686.75 |
17.169 |
8.008 |
2.14 |
2.1 |
40 |
230 |
8.16 |
0.718 |
| 750 A |
Default |
1/2/12 |
12:29 PM |
1383.8 |
34.595 |
16.38 |
2.11 |
2.25 |
40 |
230 |
15.402 |
0.905 |
| 750 B |
Default |
1/2/12 |
12:29 PM |
976.77 |
24.419 |
11.768 |
2.08 |
2.25 |
40 |
230 |
10.833 |
0.568 |
| 750 C |
Default |
1/2/12 |
12:30 PM |
743.2 |
18.58 |
9.004 |
2.06 |
2.2 |
40 |
230 |
8.443 |
0.584 |
| 2000 A |
Default |
1/2/12 |
12:30 PM |
1128.56 |
28.214 |
13.082 |
2.16 |
2.19 |
40 |
230 |
12.884 |
0.763 |
| 2000 B |
Default |
1/2/12 |
12:31 PM |
1202.5 |
30.062 |
14.038 |
2.14 |
2.19 |
40 |
230 |
13.701 |
0.832 |
| 2000 C |
Default |
1/2/12 |
12:31 PM |
924.15 |
23.104 |
10.844 |
2.13 |
2.24 |
40 |
230 |
10.325 |
0.364 |
December 17, 2011
Last day of Oly experiment and everything is still bubbling.
Took speck pH samples of remaining larval chambers (only one per treatment at this stage)
Took samples for water chemistry (DIC/TA).
Took samples for mortality counts as described previously (12/15/2011) and froze remaining larvae in LN2 and stored at -80 deg C.
Ambient: Jar C
750: Jar C
2000: Jar B
Summary:
pH was consistent between chambers within each treatment and across all sampling days.
No difference in mortality between treatments and no major mortalities for the duration of the experiment.
December 16, 2011
All jars still bubbling!!
Temp is holding at a comfortable 17.4 degrees C
Took samples for mortality for all remaining jars (2/treatment) as described previously.
Sampled entire jar for transcriptome analysis.
Ambient: Jar B
750ppm: Jar A
2000ppm: Jar A
December 15, 2011
Sampling Oly larvae
Started sampling at 3pm = Full 24 hours of larvae being exposed to treatment water = larvae are ~24-36 hours post spawn.
Spec pH samples were taken from all larval nine larval chambers.
Chambers sampled for 24 hour NGS timepoint:
Ambient "A"
750ppm "B"
2000 "C"
Also took water samples for DIC/TA from the same jars that were sampled for NGS. Water chemistry samples were taken BEFORE all other sampling.
Two replicates of 3 x 30ul were taken from all larval chambers for mortality counts.
The remaining jars were given ~33% water change with water that had been equilibrating over night with the appropriate gas mix in the treatment boxes.
December 14, 2011
Drove to Taylor Shellfish hatchery in Quilcene to pick up ~1million 12hour old Oly veliger larvae.
Initial counts in 50ml of sterile seawater = ~215larvae/10ul = 21,500 larvae/mL x 50ml = 1,075,000 total larvae
Added 2.5ml from the 50mL stock to each of the 4.5L treatment "chambers" = 53,750 total larvae = ~12larvae/ml
Each treatment chamber has it's own airstone with a steady stream of SMALL bubbles from the appropriate designer gas or ambient air source.
Treatments are:
Ambient air from the air lines in the basement
750ppm CO2 designer gas
2000ppm CO2 designer gas
Bubbling began at 9am. Could not start bubbling yesterday because gas was limited and we did not know if we would have larvae until this morning. Larvae went into treatment chamber around 3pm so the water had been equilibrating for ~6 hours. Sammi took spec pH of treatment water before we added the larvae
Sammi and Emma made fresh dye for the spec pH and did the dye corrections.
December 13, 2011
Prepared experimental system for Oly experiment tomorrow.
3 sweater boxes were outfitted with a gas line that came in from either a designer gas tank or ambient air source. The gas line was then split into 4 lines inside the sweater boxes. One line for each of the three oly larval chambers and another line for an "empty" control chamber.
Filter sea water to .22uM to remove ciliates and other nasty bits. This water will be used for all larval treatments.
November 30, 2011
Identification of unique sequence reads from OA illumina libraries
- Ran a reference assembly in CLC of both 400 and 1000ppm libraries against 454/Gonad backbone. Saved list of unmapped reads
- De novo assembly of unmapped reads
- Blastx of de novo consensus contigs to swissprot in SAFS portal. Raw output can be found here.
- Merged Blastx tabular file with swissport titles/descriptions and GO/GO_Slim terms. galaxy output file can be found here.
Result:
198 unique sequences (E value <.001) characterized to GO_Slim
17 involved in stress response
Some genes hit multiple contigs
Nevember 28, 2011
Kegg pathway analysis
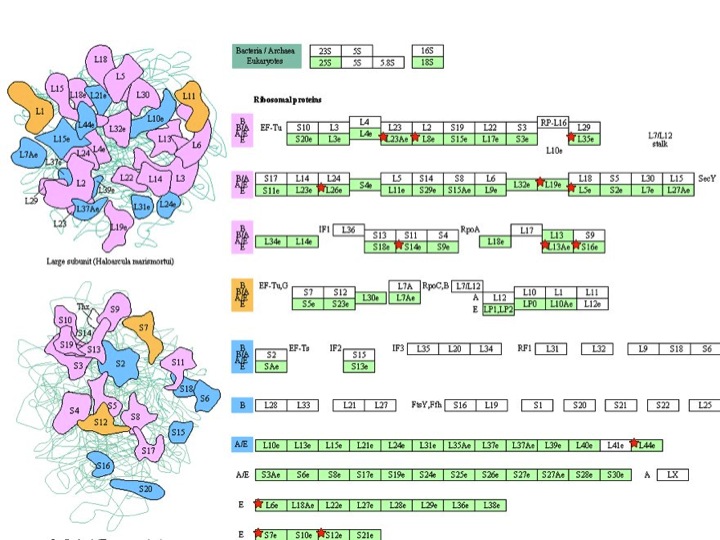
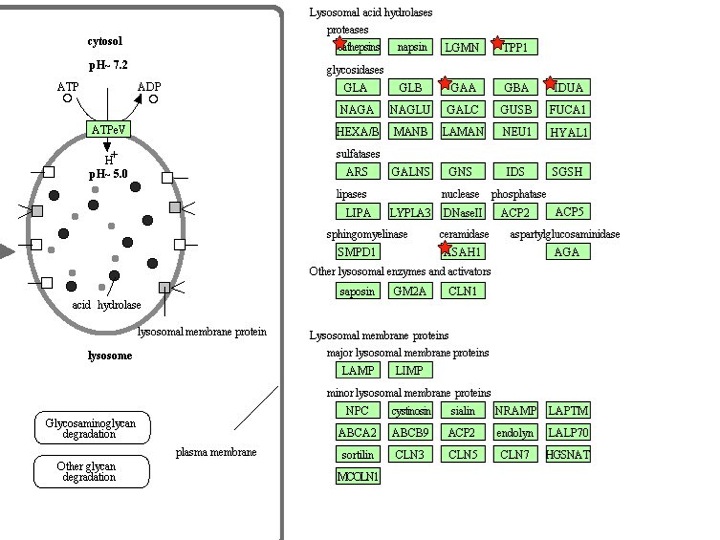
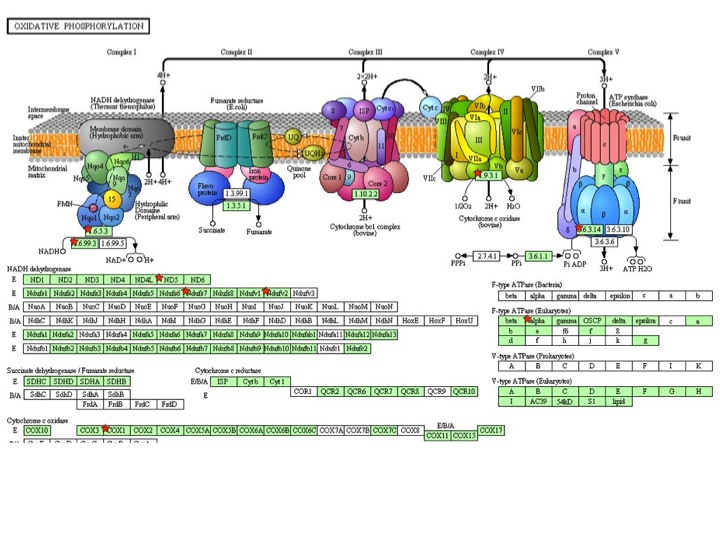
November 15, 2011
Re-analyzing OA/454/Gonad de novo and rnaseq data
Checking for duplicate annotations in the de novo assembly annotations running RNAseq with modified consensus file.
What I'm doing:
In Galaxy...
- Ran "statistics" "count" command to determine if there were "overrepresented" swissprot IDs in my de novo assembly
Answer = Yes several SPID accession numbers are represented by 10 or more contigs....some by more than 1000 contigs.
-Sort the annotation file in excel SPID and e-value. Removing dups will delete all contigs with the highest e-vale to a particular ID leaving just the the contig with the lowest e-vale score.
-Save as tabular and upload to galaxy.
-Upload .fa file of de novo contig sequences from CLC into galaxy.
-Convert fasta file to tabular in Galaxy
-Join sequence file with the annotation file where duplicate SPIDs were removed.
Some statistics so far...
Total number of contigs from de novo of OA, Gonad, and 454 data = 153,192
Total number of blastall hits of de novo contigs = ~170,000
Total number of blastall hits with dups removed = 66,921 = final number of contigs used in de novo.
November 3, 2011
I've been playing around with the OA Illumina data and I think I'm starting to get somewhere.
I've spent a lot of time trying to filter through RNAseq data in which I used ONLY my OA data in a de novo assembly and then used the consensus from that to perform RNAseq analysis from the 1000ppm and 400ppm treatment
The other analysis was combining my OA Illumina data with previously published 454 data and Illumina data from Rp gonads to do a de novo assembly (this took forever and generated an enormous amount of data....possible drawback?). In any event, I used the consensus sequences from that de novo to perform RNAseq using my OA Illumina data. The hope being that I would have more, larger contigs to deal with when it came time for annotating.
I have now managed to do some preliminary GO term enrichment analysis from both sets of analysis and the results are surprising.
Quick summary of parameters
DAVID Gene List:
all SPIDS that were 2 fold or more enriched in RNAseq analysis, had a p-value less than or equal to .05, and had an e-value less than or equal to 0.001.
DAVID Reference:
all SPIDs that had an e-value less than or equal too 0.001 (ie I considered them properly "annotated")
For REViGO visualization, I uploaded all enriched GO terms for Biological Processes that had and FDR of 0.01 or lower.
And....?
My OA Illumina ONLY analysis had Translation as the ONLY enriched GO term!
The OA/454/Gonad analysis is summarized in the figure below:
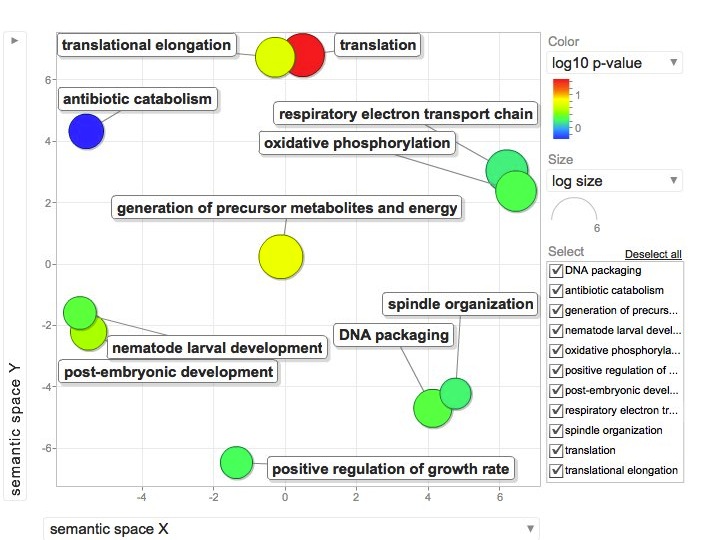
October 27, 2011
Percent survival summary from second pilot experiment to identify lethal HS treatment for manila clams (see 10/18/2011 for details)
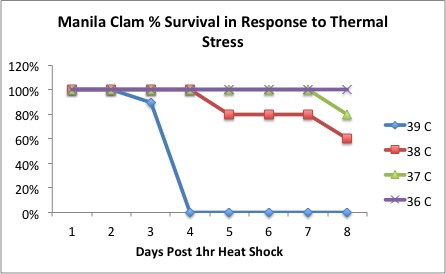
Colors indicate temperature of 1hr HS treatment.
Lethal temperature for this experiment appears to be 39 degrees C for 1hr followed by recovery at 16 degrees C.
Note: None of the clams were HS at 36 in pilot 1 and then again at 39 in pilot2 (this study) died during this experiment.
October 25, 2011
Fed clams/oysters in the afternoon....see spreadsheet.
Found two dead clams in the dark blue (38 degree) bag.
October 22, 2011
Fed clams/oysters in the morning....see spreadsheet.
Found 2 dead clams in the dark blue (38 degree) bag!
October 21, 2011
Fed Clams/oysters in the afternoon....see spreadsheet.
Found 6 dead clams in Brown (39 degree) bag. There are no more live 39 degree HS clams.
October 20, 2011
Fed Clams and oysters in the am...see spreadsheet
1 Dead clam in Brown (39 degree) bag!!
October 19, 2011
Fed Clams and oysters...see spreadsheet.
Nothing was dead from HS experiment after 24hours recovery.
October 18, 2011
Starting second pilot HS trial with clams
n=10 clams/treatment
Set up two 2L beakers in the water bath. One will be used as a "preheat" beaker to bring clams up to temp and the other as a 1hr "HS" beaker.
Clams were preheated for 10min before being transferred to HS beaker for 1hr and then returned to 16 degrees
Note: Transferred all clams from previous trial to new bag w/ two zip tip ties.
| Temp: |
36 |
37 |
38 |
39 |
39 SLT36 |
| Color Code: |
Red |
Light Blue |
Dark Blue |
Brown |
Purple |
Fed Clams as oysters as usual...see spreadsheet.
October 17, 2011
Fed Clams and Oysters at 3:30pm. Check spreadsheet.
Nothing was dead from HS trial.
This marks the end of the one week mortality period for the heat shock trial.
Results summary:
None of the oysters died. Most likely due to changes in HS waterbath temp upon submersion of oysters. Will need to preheat oysters before HS treatment for next trial.
All clams at 42 degrees C died DURING their HS treatment. This temp is way too high.
All clams at 39 degrees C died four days after HS treatment (2 on day 3, and 5 on the fourth day).
Will start another HS pilot tomorrow with HS temps of 36, 37, 38, and 39 degrees C. Will also HS clams from previous pilot that were HS at 36 for fun to see if there might be an impact of SLT.
October 16, 2011
Fed Clams and Oysters 6:00pm. Check the spreadsheet.
Nothing was dead from HS trial.
October 15, 2011
Fed Clams and Oysters 6:30am. Check the spreadsheet.
Nothing was dead from HS trial.
October 14, 2011
Fed Clams and oysters 9:30am. Check the spreadsheet.
Found two dead clams in the 39 C heat shock treatment!
Fed Clams and oysters 4:30pm. Check the spreadsheet.
The remaining 3 clams in the 39 C bag were dead.
Emptied and cleaned all alkalinity bottles. They are currently sitting in the hood drying.
October 12, 2011
Fed clams and oysters as usual.
No mortality was seen in any of the heat shocked animals.
October 11, 2011
Fed and check clams/oysters from October 10, 2011 heat shock experiment at 4:30pm. There were no mortalities.
Some preliminary RNAseq data...
Below is a volcano plot of RPKM values for 1000ppm (Y axis) and 400ppm (X axis) from the RNAseq of the OA data ONLY. This is just my own data and was not combined with the 454 or Gonad data...I'm still working on that.
NOTE: Duplicates have not been removed, Non significant have not been removed, No groupings have been performed, this is just an initial observation of what the RNAseq expression data looks like.
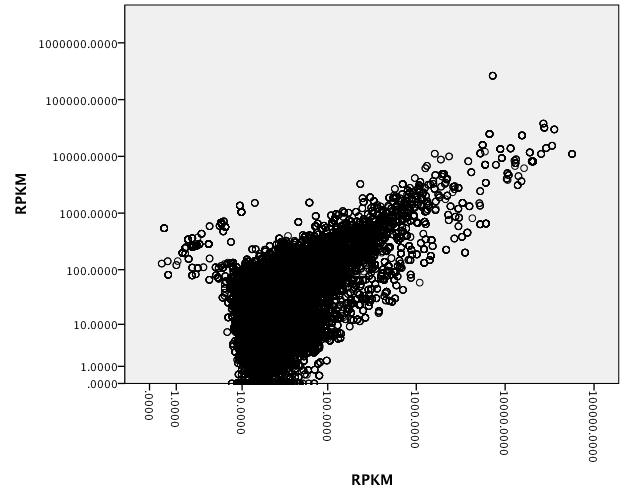
Looks like there might be an interesting cluster to look at in the 1000ppm as well as some genes unique to 400ppm.
Starting a DAVID analysis of OA ONLY data.
Submitted SPID to DAVID that fit the following criteria:
1. Over 2 fold change in expression (+/-)
2. P-value < .05
3. E-value < .001
N=1,715 SPID's submitted to DAVID
--> Downloaded enriched BP from DAVID output and uploaded to REVIGO with associated DAVID p-values
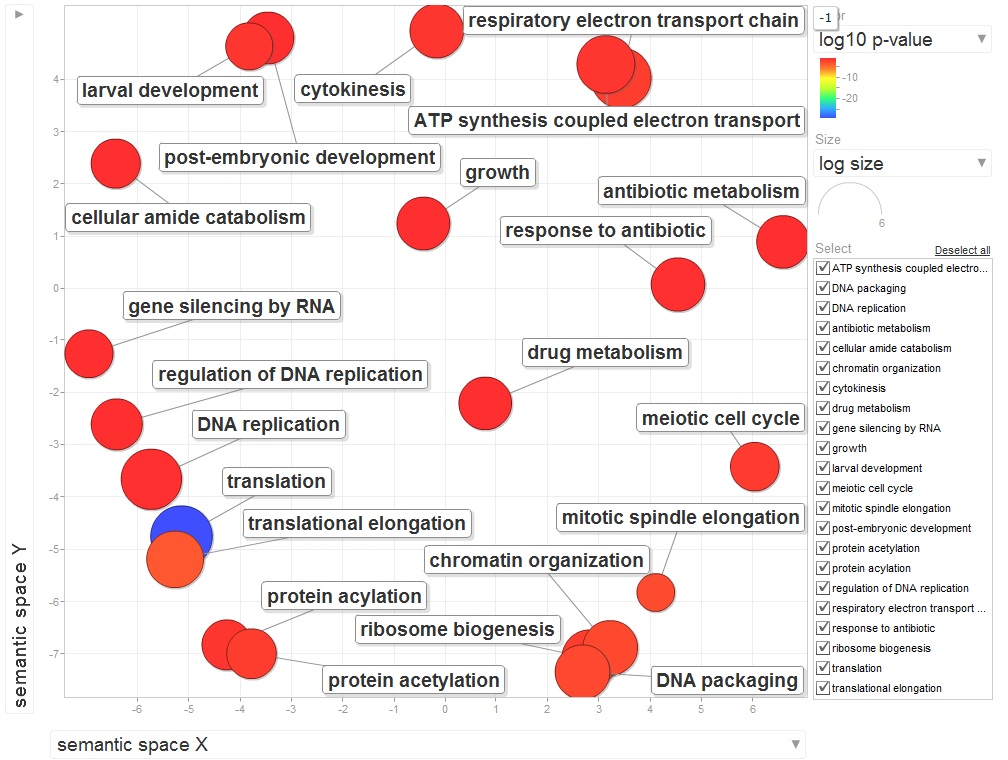
Below is the pie cart for BP of RNAseq data with the same criteria as above...
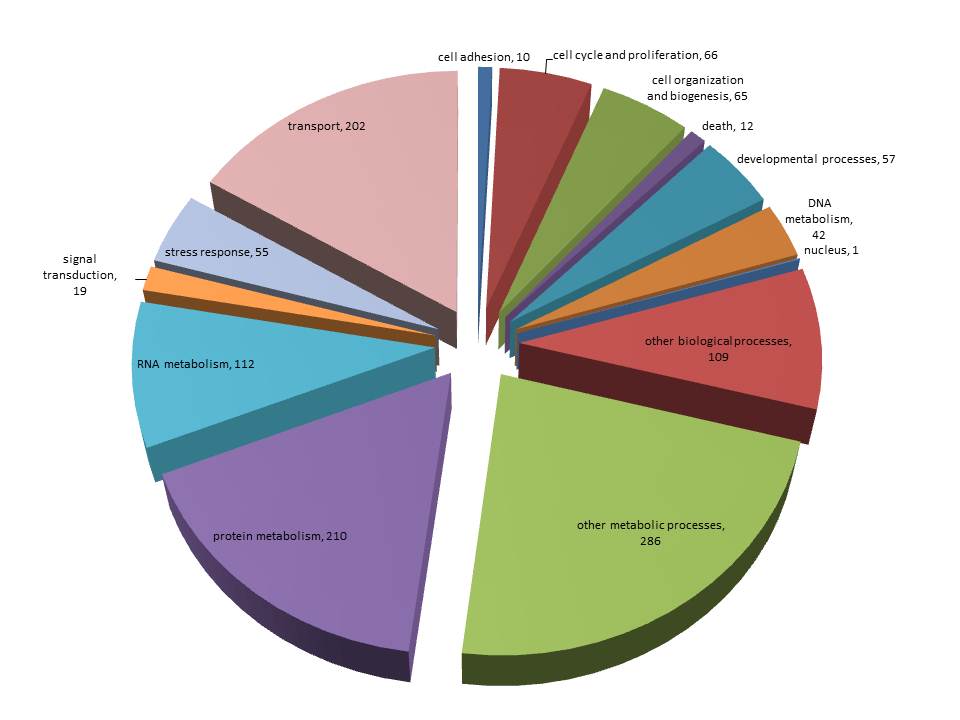
GO Slim Pies
Up in 400ppm 2 Fold N=909 Up in 1000ppm 2 Fold N=33
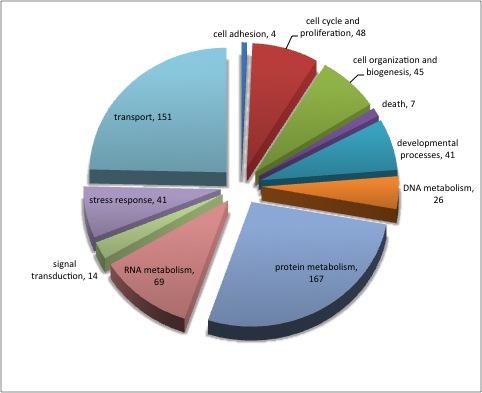
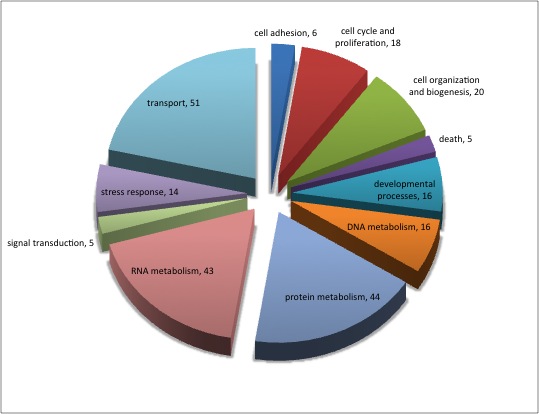
October 10, 2011
Started RNAseq on 400ppm and 1000ppm samples to OA 454 Gonad consensus, OA 454 consenses, and OA only consensus.
starting heat shock exp. with oysters and clams.
General protocol:
Heat shocking temperatures: 30, 33, 36, 39, 42, 45 degrees C
10 clams/bag
Heat shock 1hr and return to tank at 16 degrees C
Clam color code:
Brown: 30 C
Dark Blue: 33 C
Light Blue: 36 C
Purple: 39 C
Green: 42 C
45 C
October 7, 2011
BlastX is done!
Time for some extreme table joining to figure out what I have....
Preliminary results for Clam OA NGS data.
Below is a pie chart that represents a summary of the identified biological processes from my clam OA illumina data. This data is NOT RNAseq data, wrather it is a summary the biological processes identified from the raw data. No information is available regarding changes in expression in these data between treatments. Duplicates have not been removed. A fairly liberal E-value cut off .001 was used for annoatation.
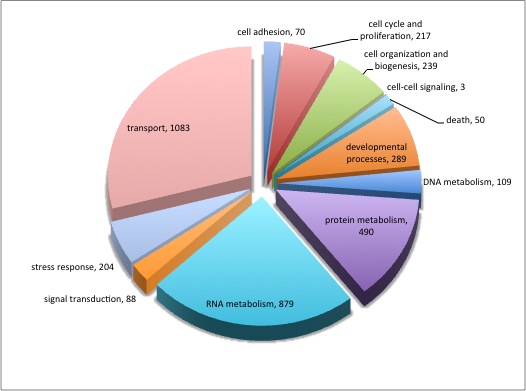
Results from Reference assemblies of OA data back to OA consensus sequences and OA data to the combined de novo of OA/454/Gonad consensus sequences.
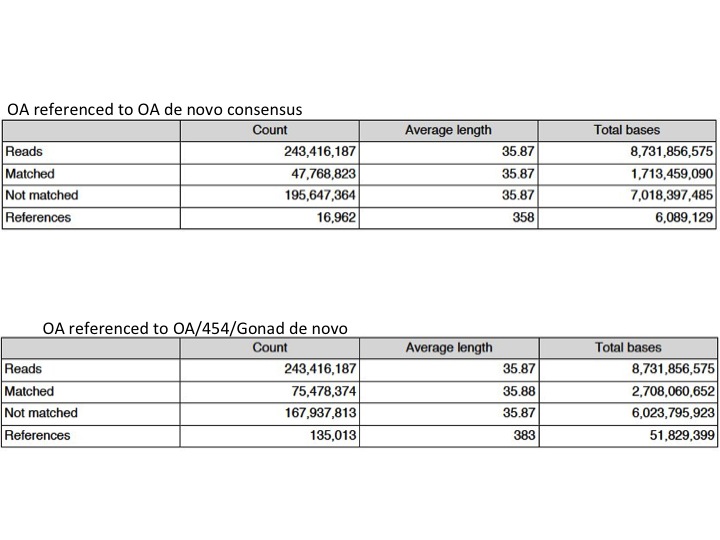
Note: Gonad paper was published today!
October 6, 2011
Started BlastX of OA Illumina data consensus sequences in portal...
Started BlaxtX of 454 adult gill and mantle data sequences in portal...
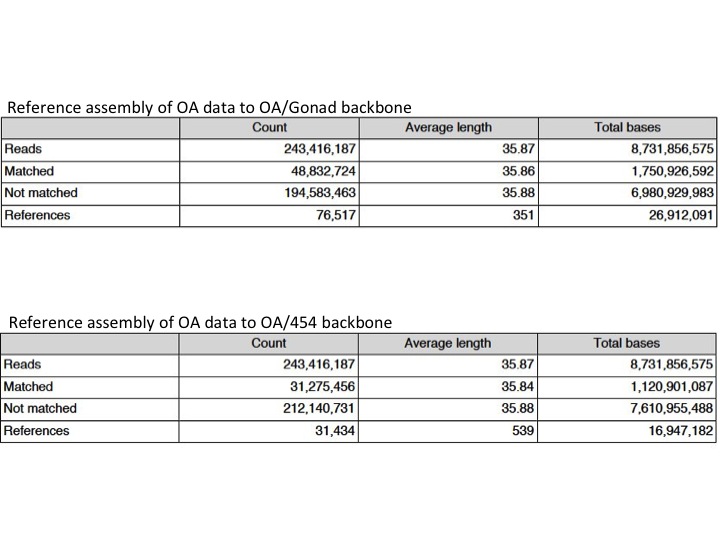
October 4, 2011
Some de novoing results...
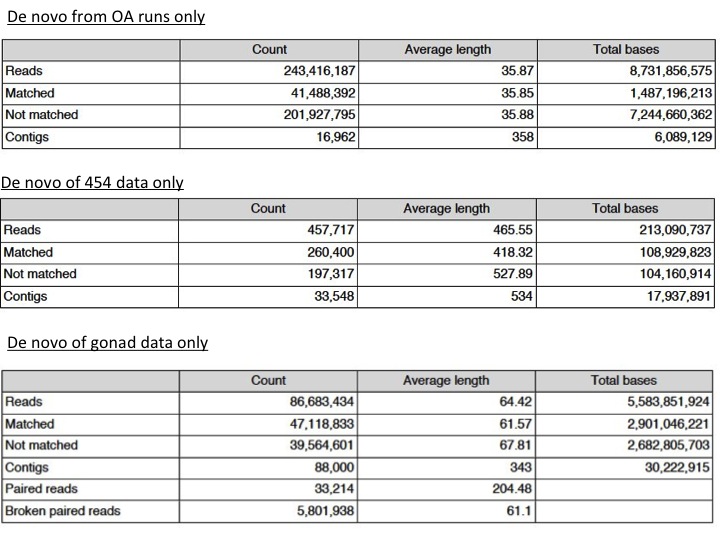
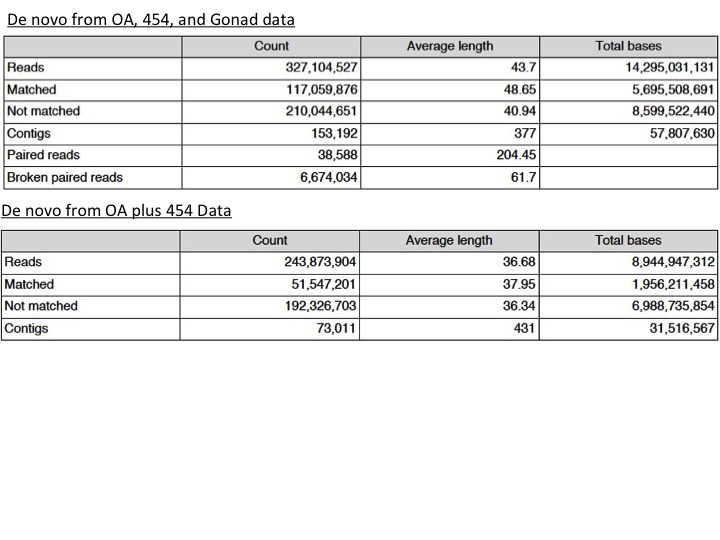
Currently working on reference assemblies of OA data back to de novo consensus sequences from the OA+454 de novo, OA+gonad de novo, and OA+454+gonad de novo before drawing conclusions...results will probably not come back until tomorrow.
October 3, 2011
Started Running the following assemblies:
1. De novo of all illumina gonad sequences
2. Denovo of OA illumina, gonad illumina, and 454 (so bascially all NGS data available for manila clams)
3. Backbone assembly using consensus contigs from 454 as backbone and mapping OA illumina data onto that
Other things to try
1. Using gonad illumina data as backbone and assembling OA illumina data onto that (need to wait for de novo of gonad data to finish first!)
Summary of my illumina data de novo 9/28/1022
Total number of contigs = 16,962
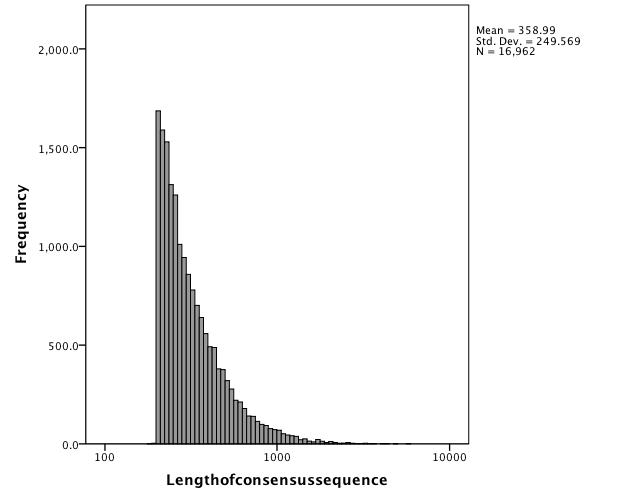
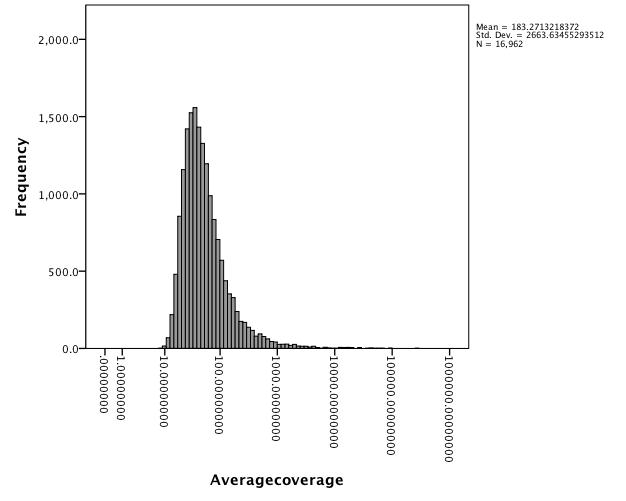
Converted illumina .sra files downloaded on 9/28/11 to .fastq files using the following terminal code:
purplepelican:sratoolkit.2.1.6-mac32 srlab$ ./fastq-dump -A SRR281065 --split-spot /Volumes/bass/Dave/Gonads/SRR281065/SRR281065.sra -O /Volumes/bass/Dave/Gonads
Translation of code:
(location of sra toolkit) (./(name of toolkit)) (-A=accession) (name of file) (split spot command for paired end reads) (location of .sra file) (-O = output) (Desired output file destination)
For more information visit guide on NCBI webiste
Converted .sra --> .fastq files were then imported onto CLC server and trimmed.
Note: Steven converted the 454 data using sff-dump (for 454) instead of fastq (for illumina) and uploaded to CLC. See his notebook for details.
September 28, 2011
OA Clam NGS data is here!!
Steven beat me to the punch of doing the trimming on the reads but you can see his full report and a summary of #reads etc.. here.
Started de novo assembly with the following parameters using the trimmed files from the 1000ppm and 400ppm data combined:
Add conflict annotations = No
Conflict resolution = Vote
Create Contigs = Yes
Create list of un-mapped reads = No
Create Report = No
Match mode = random
Minimum contig length = 200
Limit = 8
Mismatch cost = 2
Alignment = ungapped
Global alignment = No
Color space alignment = Yes
Color error cost = 3
Downloaded SRA files from two other Manila Clam Transcriptome studies. Once files are downloaded and converted, will use these to do other de novo assembly to, hopefully, get better/longer contigs/annotations.
454 data from DG and Gill Tissue of //R.phillipinarum// was downloaded from this study.
Clam gonad NGS data downloadad from this study
Note: This appears to be unpublished data
Directions for converting SRA files can be found here.
Note: purple pelican requires the 32 bit version of sra toolkit.
September 27, 2011
Emma took spec pH samples from experimental jars in the morning BEFORE their morning feeding.
Summary of spec pH results:
pH in ALL oyster jars dropped below 7.0 (all were closer to pH 6.8).
pH in clams jars appears to be holding. Jars with 5 clams held a pH consistent with control jars. Jars with 10 clams appears to decrease pH slightly but no where near as much as oysters.
Afternoon: Spec pH and Alkalinity samples were taken from a subset of jars in both beer bottles (for us and forestry) and "PMEL" bottles (for us). We will process one set of beer bottles and all PMEL bottles to compare the two systems directly. Beer bottles will also be sent of forestry to assess the quality of data we get back form them by comparing with our own readings.
Conclusions ?: It may be impossible to do proper experiments with oysters in static jars since they appear to have dramatic effects on pH. However, it is unclear if it is the presence of the oysters that is is dropping the pH or the act of feeding the oysters. To determine which is the cause, I only fed REP 1 jars for both clams and oysters around 7pm before going home. REP 2 jars have not received a meal since having their water changed this afternoon. So in addition to animal density and pCO2 differences, we will also be comparing feeding vs no feeding tomorrow.
September 26, 2011
Starting "new" notebook since last one became too large to edit.
Pumped water from garbage cans back into OA holding.
Pumped water directly from truck into garbage cans. Truck water is from Muk and should have a higher pH. Added 4 airstones to one of the garbage cans and started bubbling pure CO2 around 1pm.
2000ppm CO2 gas and CO2 free gas was bubbled into garbage cans full of filtered sea water starting saturday morning september 24th. As of Monday morning, September, 26th, pH of seawater has not changed. Will meet with OA crew about how to proceed.
Catching up on notebooking:
Click here for a link regarding clam and oyster feeding for juvenile trials...