Links to all qPCR Raw files and PCR Miner files from the olympia oyster larval qPCR experiment are provided below.
In addition, all files are located in the Roberts lab "Sites" folder under "Dave--OlyOA"
Ef1alpha Raw qPCR data
Ef1alpha RFU no baseline subtraction
Ef1alpha data formatted for PCR Miner
Ef1alpha PCRMiner output file
IsotRNA Raw qPCR data
IsotRNA RFU no baseline subtraction
IsotRNA data formatted for PCR Miner
IsotRNA PCRMiner output file
GPx3 Raw qPCR data
GPx3 RFU no baseline subtraction
GPx3 data formatted for PCR Miner
GPx3 PCRMiner output file
Hemi Raw qPCR data
Hemi RFU no baseline subtraction
Hemi data formatted for PCR Miner
Hemi PCRMiner output file
Hypoxy Raw qPCR data
Hypoxy RFU no baseline subtraction
Hypoxy data formatted for PCR Miner
Hypoxy PCRMiner output file
SAMPLE LOCATIONS:
All cDNA is at 4 degrees in the Roberts lab in 96 well pcr plates. Plate maps can be found by scrolling down.
Oly cDNA has been diluted 1:2 and 2ul were used in qPCR reactions.
Clam cDNA is undiluted and 2ul should be used for qPCR reactions.
All RNA is in the -80. All total RNA has been DNased due to low yields. Oly RNA is located on the top left shelf. Clam RNA is located on the second shelf from the top.
August 7, 2012
Ran RT reactions for all manila clam larval RNA extracted over the past week.
I had to load 150ng total RNA as template in the RT reactions due to low concentrations for total RNA in several of the samples.
Plate map of cDNA samples is provided below.

Because of the low amount of total RNA used as a template in the RT reactiosn, I ran a test qPCR on cDNA to determine optimal concentration of cDNA to load for qPCR reactions. The test included 5ul of undiluted cDNA, 2ul of undiluted cDNA, and 2ul of cDNA diluted 1:5.
Click here for raw qPCR Data
Results:
Looks like loading 2ul of undiluted cDNA will work best...at least for ef1alpha and perlucin 6
-
"Lets take the example "1C3"
The "1" refers to the CO2 treatment
1 = 1000ppm
3 = 750ppm
4 = 400ppm
The "C" refers to which of the grey tubs over at noaa the larval
chambers were in. All of mine were in "C" for clam so the C is more or
less irrelevant at this point.
The third character, in this case "3" refers to which of the 6
replicate chambers the samples came from. There are 6 total chambers
total but only 3 were sampled on any given day. So for a particular
date you should only have three different numbers here (except the
final day of sampling there are 4 just to make it confusing)."
August 6, 2012
Ran qPCR plates to quantified Isoleucyl-tRNA synthetase and GPx3 in the Oly larval OA samples from 7.23.12 using the same platemap as 8.1.12.
Links to raw data will be provided shortly
Also DNase treated RNA extracted last year rom the manila clam larval OA experiment. I'm gearing up to run some qPCR assays to compliment the NGS data. RNA concentrations were quantified using a nanodrop.
| User ID |
Date |
Time |
ng/ul |
A260 |
A280 |
260/280 |
260/230 |
Constant |
Cursor Pos. |
Cursor abs. |
340 raw |
|
| 1C2 8.5.11 DNase |
Default |
8/6/12 |
3:06 PM |
29.04 |
0.726 |
0.497 |
1.46 |
0.31 |
40 |
230 |
2.343 |
0.004 |
| 1C3 8.5.11 DNase |
Default |
8/6/12 |
3:06 PM |
41.85 |
1.046 |
0.642 |
1.63 |
0.48 |
40 |
230 |
2.185 |
-0.008 |
| 1C4 8.5.11 DNase |
Default |
8/6/12 |
3:07 PM |
13.78 |
0.344 |
0.274 |
1.26 |
0.18 |
40 |
230 |
1.92 |
0.025 |
| 3C1 8.5.11 DNase |
Default |
8/6/12 |
3:07 PM |
26.84 |
0.671 |
0.467 |
1.44 |
0.11 |
40 |
230 |
6.288 |
-0.009 |
| 3C2 8.5.11 DNase |
Default |
8/6/12 |
3:08 PM |
13.18 |
0.33 |
0.287 |
1.15 |
0.13 |
40 |
230 |
2.608 |
-0.014 |
| 3C3 8.5.11 DNase |
Default |
8/6/12 |
3:08 PM |
36.87 |
0.922 |
0.595 |
1.55 |
0.39 |
40 |
230 |
2.379 |
0.001 |
| 4C1 8.5.11 DNase |
Default |
8/6/12 |
3:09 PM |
15.52 |
0.388 |
0.303 |
1.28 |
0.13 |
40 |
230 |
3.064 |
-0.002 |
| 4C2 8.5.11 DNase |
Default |
8/6/12 |
3:09 PM |
10.11 |
0.253 |
0.237 |
1.07 |
0.12 |
40 |
230 |
2.072 |
0.003 |
| 4C3 8.5.11 DNase |
Default |
8/6/12 |
3:09 PM |
23.91 |
0.598 |
0.454 |
1.32 |
0.24 |
40 |
230 |
2.467 |
-0.001 |
| 1C1 7.29.11 Dnase |
Default |
8/6/12 |
3:10 PM |
26.08 |
0.652 |
0.461 |
1.42 |
0.21 |
40 |
230 |
3.098 |
-0.012 |
| 1C2 7.29.11 DNase |
Default |
8/6/12 |
3:11 PM |
25.1 |
0.627 |
0.455 |
1.38 |
0.25 |
40 |
230 |
2.516 |
-0.024 |
| 1C3 7.29.11 DNase |
Default |
8/6/12 |
3:11 PM |
11.29 |
0.282 |
0.239 |
1.18 |
0.09 |
40 |
230 |
3.155 |
-0.004 |
| 3C1 7.29.11 DNase |
Default |
8/6/12 |
3:12 PM |
15.99 |
0.4 |
0.296 |
1.35 |
0.44 |
40 |
230 |
0.904 |
-0.001 |
| 3C2 7.29.11 DNase |
Default |
8/6/12 |
3:12 PM |
42.77 |
1.069 |
0.752 |
1.42 |
0.16 |
40 |
230 |
6.577 |
-0.018 |
| 3C3 7.29.11 DNase |
Default |
8/6/12 |
3:12 PM |
13.85 |
0.346 |
0.254 |
1.36 |
0.34 |
40 |
230 |
1.013 |
0.001 |
| 4C1 7.29.11 DNase |
Default |
8/6/12 |
3:13 PM |
9.77 |
0.244 |
0.221 |
1.11 |
0.29 |
40 |
230 |
0.852 |
-0.013 |
| 4C2 7.29.11 DNase |
Default |
8/6/12 |
3:13 PM |
9.1 |
0.228 |
0.219 |
1.04 |
0.1 |
40 |
230 |
2.356 |
-0.015 |
| 4C3 7.29.11 DNase |
Default |
8/6/12 |
3:14 PM |
26.94 |
0.673 |
0.469 |
1.44 |
0.22 |
40 |
230 |
3.052 |
0.035 |
-
"Lets take the example "1C3"
The "1" refers to the CO2 treatment
1 = 1000ppm
3 = 750ppm
4 = 400ppm
The "C" refers to which of the grey tubs over at noaa the larval
chambers were in. All of mine were in "C" for clam so the C is more or
less irrelevant at this point.
The third character, in this case "3" refers to which of the 6
replicate chambers the samples came from. There are 6 total chambers
total but only 3 were sampled on any given day. So for a particular
date you should only have three different numbers here (except the
final day of sampling there are 4 just to make it confusing)."
August 3, 2012
DNase treated RNA samples extracted on 8/1 and 8/2 2012
Because concentrations were so low I DNase treated the entire RNA sample
quantified using nanodrop
| Sample ID |
User ID |
Date |
Time |
ng/ul |
A260 |
A280 |
260/280 |
260/230 |
Constant |
Cursor Pos. |
Cursor abs. |
340 raw |
| Day 0-1 DNase |
Default |
8/3/12 |
2:02 PM |
329.45 |
8.236 |
4.275 |
1.93 |
1.48 |
40 |
230 |
5.575 |
0.029 |
| Day 0-2 DNase |
Default |
8/3/12 |
2:03 PM |
291.52 |
7.288 |
3.78 |
1.93 |
0.71 |
40 |
230 |
10.222 |
0.023 |
| Day 0-3 DNase |
Default |
8/3/12 |
2:03 PM |
87.42 |
2.186 |
1.239 |
1.76 |
0.43 |
40 |
230 |
5.027 |
-0.005 |
| Day 0-4 DNase |
Default |
8/3/12 |
2:04 PM |
304.21 |
7.605 |
3.911 |
1.94 |
1.1 |
40 |
230 |
6.923 |
0.014 |
| Day 0-5 DNase |
Default |
8/3/12 |
2:04 PM |
119.54 |
2.989 |
1.617 |
1.85 |
0.55 |
40 |
230 |
5.47 |
-0.004 |
| 3C6 8.12.11 DNase |
Default |
8/3/12 |
2:05 PM |
111.78 |
2.794 |
1.496 |
1.87 |
1.14 |
40 |
230 |
2.443 |
0.047 |
| 3C2 8.12.11 DNase |
Default |
8/3/12 |
2:05 PM |
318.33 |
7.958 |
4.08 |
1.95 |
0.99 |
40 |
230 |
8.057 |
0.075 |
| 3C4 8.12.11 DNase |
Default |
8/3/12 |
2:06 PM |
578.43 |
14.461 |
7.492 |
1.93 |
1.3 |
40 |
230 |
11.12 |
0.181 |
| 3C5 8.12.11 DNase |
Default |
8/3/12 |
2:06 PM |
142.75 |
3.569 |
1.894 |
1.88 |
0.95 |
40 |
230 |
3.759 |
0.063 |
| 4C4 8.12.11 DNase |
Default |
8/3/12 |
2:07 PM |
75.03 |
1.876 |
1.058 |
1.77 |
0.74 |
40 |
230 |
2.54 |
0.047 |
| 4C6 8.12.11 DNase |
Default |
8/3/12 |
2:07 PM |
159.89 |
3.997 |
2.074 |
1.93 |
0.81 |
40 |
230 |
4.934 |
0.058 |
| 4C5 8.12.11 DNase |
Default |
8/3/12 |
2:08 PM |
93.64 |
2.341 |
1.288 |
1.82 |
0.3 |
40 |
230 |
7.733 |
0.03 |
| 4C2 8.12.11 DNase |
Default |
8/3/12 |
2:08 PM |
61.79 |
1.545 |
0.898 |
1.72 |
0.32 |
40 |
230 |
4.838 |
0.044 |
| 1C2 8.12.11 DNase |
Default |
8/3/12 |
2:09 PM |
640.6 |
16.015 |
8.177 |
1.96 |
0.99 |
40 |
230 |
16.172 |
0.243 |
| 1C6 8.12.11 DNase |
Default |
8/3/12 |
2:09 PM |
206.62 |
5.166 |
2.751 |
1.88 |
0.54 |
40 |
230 |
9.512 |
0.088 |
| 1C5 8.12.11 DNase |
Default |
8/3/12 |
2:10 PM |
183.92 |
4.598 |
2.427 |
1.89 |
0.63 |
40 |
230 |
7.262 |
0.082 |
| 1C1 8.12.11 DNase |
Default |
8/3/12 |
2:10 PM |
331.78 |
8.295 |
4.303 |
1.93 |
1.39 |
40 |
230 |
5.988 |
0.091 |
| 4C5 8.9.11 DNase |
Default |
8/3/12 |
2:11 PM |
34.7 |
0.867 |
0.597 |
1.45 |
0.16 |
40 |
230 |
5.345 |
-0.001 |
| 4C4 8.9.11 DNase |
Default |
8/3/12 |
2:12 PM |
17.94 |
0.448 |
0.33 |
1.36 |
0.24 |
40 |
230 |
1.863 |
-0.002 |
| 4C6 8.9.11 DNase |
Default |
8/3/12 |
2:12 PM |
44.52 |
1.113 |
0.721 |
1.54 |
0.19 |
40 |
230 |
5.802 |
-0.006 |
| 1C6 8.9.11 DNase |
Default |
8/3/12 |
2:12 PM |
75.11 |
1.878 |
1.286 |
1.46 |
0.21 |
40 |
230 |
8.96 |
0.009 |
| 1C5 8.9.11 DNase |
Default |
8/3/12 |
2:13 PM |
67.44 |
1.686 |
1.134 |
1.49 |
0.19 |
40 |
230 |
8.708 |
-0.004 |
| 1C1 8.9.11 DNase |
Default |
8/3/12 |
2:13 PM |
91.25 |
2.281 |
1.466 |
1.56 |
0.34 |
40 |
230 |
6.616 |
-0.001 |
| 3C6 8.9.11 DNase |
Default |
8/3/12 |
2:14 PM |
40.5 |
1.013 |
0.672 |
1.51 |
0.27 |
40 |
230 |
3.744 |
0.017 |
| 3C5 8.9.11 DNase |
Default |
8/3/12 |
2:14 PM |
38.63 |
0.966 |
0.626 |
1.54 |
0.24 |
40 |
230 |
4.099 |
0.01 |
| 1C4 8.2.11 DNase |
Default |
8/3/12 |
2:16 PM |
129.98 |
3.249 |
1.976 |
1.64 |
0.3 |
40 |
230 |
10.812 |
0.012 |
| 1C5 8.2.11 DNase |
Default |
8/3/12 |
2:17 PM |
73.43 |
1.836 |
1.051 |
1.75 |
0.18 |
40 |
230 |
10.045 |
0.001 |
| 1C6 8.2.11 DNase |
Default |
8/3/12 |
2:18 PM |
191.9 |
4.797 |
2.828 |
1.7 |
0.46 |
40 |
230 |
10.326 |
0.011 |
| 4C5 8.2.11 DNase |
Default |
8/3/12 |
2:18 PM |
194.67 |
4.867 |
2.949 |
1.65 |
0.48 |
40 |
230 |
10.067 |
-0.007 |
| 4C6 8.2.11 DNase |
Default |
8/3/12 |
2:19 PM |
141.24 |
3.531 |
2.103 |
1.68 |
0.31 |
40 |
230 |
11.387 |
-0.002 |
| 4C4 8.2.11 DNase |
Default |
8/3/12 |
2:19 PM |
163.35 |
4.084 |
2.471 |
1.65 |
0.4 |
40 |
230 |
10.326 |
0.01 |
| 3C5 8.2.11 DNase |
Default |
8/3/12 |
2:20 PM |
231.46 |
5.786 |
3.379 |
1.71 |
0.62 |
40 |
230 |
9.351 |
0.017 |
| 3C6 8.2.11 DNase |
Default |
8/3/12 |
2:21 PM |
123.26 |
3.082 |
1.906 |
1.62 |
0.29 |
40 |
230 |
10.531 |
0.003 |
| 3C4 8.2.11 DNase |
Default |
8/3/12 |
2:21 PM |
296.03 |
7.401 |
4.182 |
1.77 |
1.02 |
40 |
230 |
7.268 |
0.031 |
Also quantified RNA from larval samples that were extracted a year ago to check on RNA integrity/quanityt
| Sample ID |
User ID |
Date |
Time |
ng/ul |
A260 |
A280 |
260/280 |
260/230 |
Constant |
Cursor Pos. |
Cursor abs. |
340 raw |
| 1C4 8.5.11 |
Default |
8/3/12 |
2:43 PM |
18.17 |
0.454 |
0.31 |
1.46 |
0.21 |
40 |
230 |
2.147 |
0.011 |
| 1C2 8.5.11 |
Default |
8/3/12 |
2:43 PM |
39.03 |
0.976 |
0.614 |
1.59 |
0.35 |
40 |
230 |
2.749 |
0.008 |
| 1C3 8.5.11 |
Default |
8/3/12 |
2:44 PM |
40.88 |
1.022 |
0.576 |
1.77 |
0.54 |
40 |
230 |
1.899 |
0.007 |
| 3C2 8.5.11 |
Default |
8/3/12 |
2:44 PM |
14.17 |
0.354 |
0.26 |
1.36 |
0.13 |
40 |
230 |
2.805 |
-0.021 |
| 3C3 8.5.11 |
Default |
8/3/12 |
2:45 PM |
41.41 |
1.035 |
0.606 |
1.71 |
0.43 |
40 |
230 |
2.419 |
0.038 |
| 3C1 8.5.11 |
Default |
8/3/12 |
2:45 PM |
34.16 |
0.854 |
0.527 |
1.62 |
0.11 |
40 |
230 |
7.616 |
0.004 |
| 4C1 8.5.11 |
Default |
8/3/12 |
2:45 PM |
15.6 |
0.39 |
0.243 |
1.61 |
0.13 |
40 |
230 |
3.11 |
0.008 |
| 4C2 8.5.11 |
Default |
8/3/12 |
2:46 PM |
10.95 |
0.274 |
0.192 |
1.42 |
0.12 |
40 |
230 |
2.275 |
0.039 |
| 4C3 8.5.11 |
Default |
8/3/12 |
2:46 PM |
31.98 |
0.799 |
0.545 |
1.47 |
0.27 |
40 |
230 |
2.926 |
0.008 |
| 1C1 7.29.11 |
Default |
8/3/12 |
2:47 PM |
36.12 |
0.903 |
0.582 |
1.55 |
0.23 |
40 |
230 |
3.897 |
-0.013 |
| 1C2 7.29.11 |
Default |
8/3/12 |
2:47 PM |
35.45 |
0.886 |
0.624 |
1.42 |
0.29 |
40 |
230 |
3.009 |
-0.003 |
| 1C3 7.29.11 |
Default |
8/3/12 |
2:48 PM |
11.68 |
0.292 |
0.211 |
1.38 |
0.09 |
40 |
230 |
3.362 |
-0.019 |
| 3C1 7.29.11 |
Default |
8/3/12 |
2:48 PM |
17.47 |
0.437 |
0.281 |
1.56 |
0.57 |
40 |
230 |
0.762 |
0.063 |
| 3C2 7.29.11 |
Default |
8/3/12 |
2:49 PM |
50.22 |
1.255 |
0.835 |
1.5 |
0.17 |
40 |
230 |
7.263 |
0.003 |
| 3C3 7.29.11 |
Default |
8/3/12 |
2:49 PM |
16.28 |
0.407 |
0.252 |
1.62 |
0.44 |
40 |
230 |
0.916 |
0.008 |
| 4C1 7.29.11 |
Default |
8/3/12 |
2:50 PM |
10.14 |
0.253 |
0.193 |
1.32 |
0.47 |
40 |
230 |
0.542 |
0.003 |
| 4C2 7.29.11 |
Default |
8/3/12 |
2:50 PM |
7.07 |
0.177 |
0.132 |
1.34 |
0.07 |
40 |
230 |
2.361 |
0.016 |
| 4C3 7.29.11 |
Default |
8/3/12 |
2:51 PM |
31.92 |
0.798 |
0.516 |
1.55 |
0.24 |
40 |
230 |
3.264 |
-0.017 |
-
"Lets take the example "1C3"
The "1" refers to the CO2 treatment
1 = 1000ppm
3 = 750ppm
4 = 400ppm
The "C" refers to which of the grey tubs over at noaa the larval
chambers were in. All of mine were in "C" for clam so the C is more or
less irrelevant at this point.
The third character, in this case "3" refers to which of the 6
replicate chambers the samples came from. There are 6 total chambers
total but only 3 were sampled on any given day. So for a particular
date you should only have three different numbers here (except the
final day of sampling there are 4 just to make it confusing)."
August 2, 2012
Ran qPCR for Ef1-alpha on olympia oyster larval cDNA from 7/23/12. Used same plate map as 8/1/2012.
Data files can be found here.
Continued extracting RNA from larval clam samples from yesterday.
Same deal...
| Sample ID |
User ID |
Date |
Time |
ng/ul |
A260 |
A280 |
260/280 |
260/230 |
Constant |
Cursor Pos. |
Cursor abs. |
340 raw |
| 3C6 8.12.11 |
Default |
8/2/12 |
6:26 PM |
85.99 |
2.15 |
1.195 |
1.8 |
1.64 |
40 |
230 |
1.308 |
0.028 |
| 1C6 8.12.11 |
Default |
8/2/12 |
6:26 PM |
149.07 |
3.727 |
1.968 |
1.89 |
1 |
40 |
230 |
3.73 |
0.04 |
| 3C5 8.12.11 |
Default |
8/2/12 |
6:27 PM |
145.98 |
3.65 |
1.97 |
1.85 |
1.47 |
40 |
230 |
2.476 |
0.064 |
| 4C2 8.12.11 |
Default |
8/2/12 |
6:27 PM |
72.85 |
1.821 |
0.996 |
1.83 |
1.26 |
40 |
230 |
1.44 |
0.046 |
| 4C5 8.12.11 |
Default |
8/2/12 |
6:28 PM |
133.53 |
3.338 |
1.753 |
1.9 |
1.45 |
40 |
230 |
2.3 |
0.05 |
| 4C6 8.12.11 |
Default |
8/2/12 |
6:28 PM |
198.53 |
4.963 |
2.626 |
1.89 |
1.67 |
40 |
230 |
2.966 |
0.094 |
| 1C5 8.12.11 |
Default |
8/2/12 |
6:29 PM |
317.14 |
7.928 |
4.012 |
1.98 |
1.7 |
40 |
230 |
4.662 |
0.167 |
| 3C2 8.12.11 |
Default |
8/2/12 |
6:29 PM |
307.31 |
7.683 |
4.002 |
1.92 |
1.71 |
40 |
230 |
4.493 |
0.037 |
| 3C4 8.12.11 |
Default |
8/2/12 |
6:30 PM |
655.35 |
16.384 |
8.236 |
1.99 |
1.75 |
40 |
230 |
9.372 |
0.131 |
| 1C1 8.12.11 |
Default |
8/2/12 |
6:30 PM |
790.69 |
19.767 |
9.698 |
2.04 |
2.03 |
40 |
230 |
9.738 |
0.19 |
| 4C4 8.12.11 |
Default |
8/2/12 |
6:31 PM |
123.07 |
3.077 |
1.645 |
1.87 |
1.52 |
40 |
230 |
2.022 |
0.165 |
| 1C2 8.12.11 |
Default |
8/2/12 |
6:31 PM |
570.85 |
14.271 |
7.125 |
2 |
1.41 |
40 |
230 |
10.155 |
0.182 |
-
"Lets take the example "1C3"
The "1" refers to the CO2 treatment
1 = 1000ppm
3 = 750ppm
4 = 400ppm
The "C" refers to which of the grey tubs over at noaa the larval
chambers were in. All of mine were in "C" for clam so the C is more or
less irrelevant at this point.
The third character, in this case "3" refers to which of the 6
replicate chambers the samples came from. There are 6 total chambers
total but only 3 were sampled on any given day. So for a particular
date you should only have three different numbers here (except the
final day of sampling there are 4 just to make it confusing)."
August 1, 2012
Started to run qPCR assays on Olympia oyster cDNA from 7/23/12
Ran assays for 3-beta-hydroxysteroid sulfotransferase and Hemicentin-1
Diluted stock cDNA 1:2 and loaded 2uL as template.
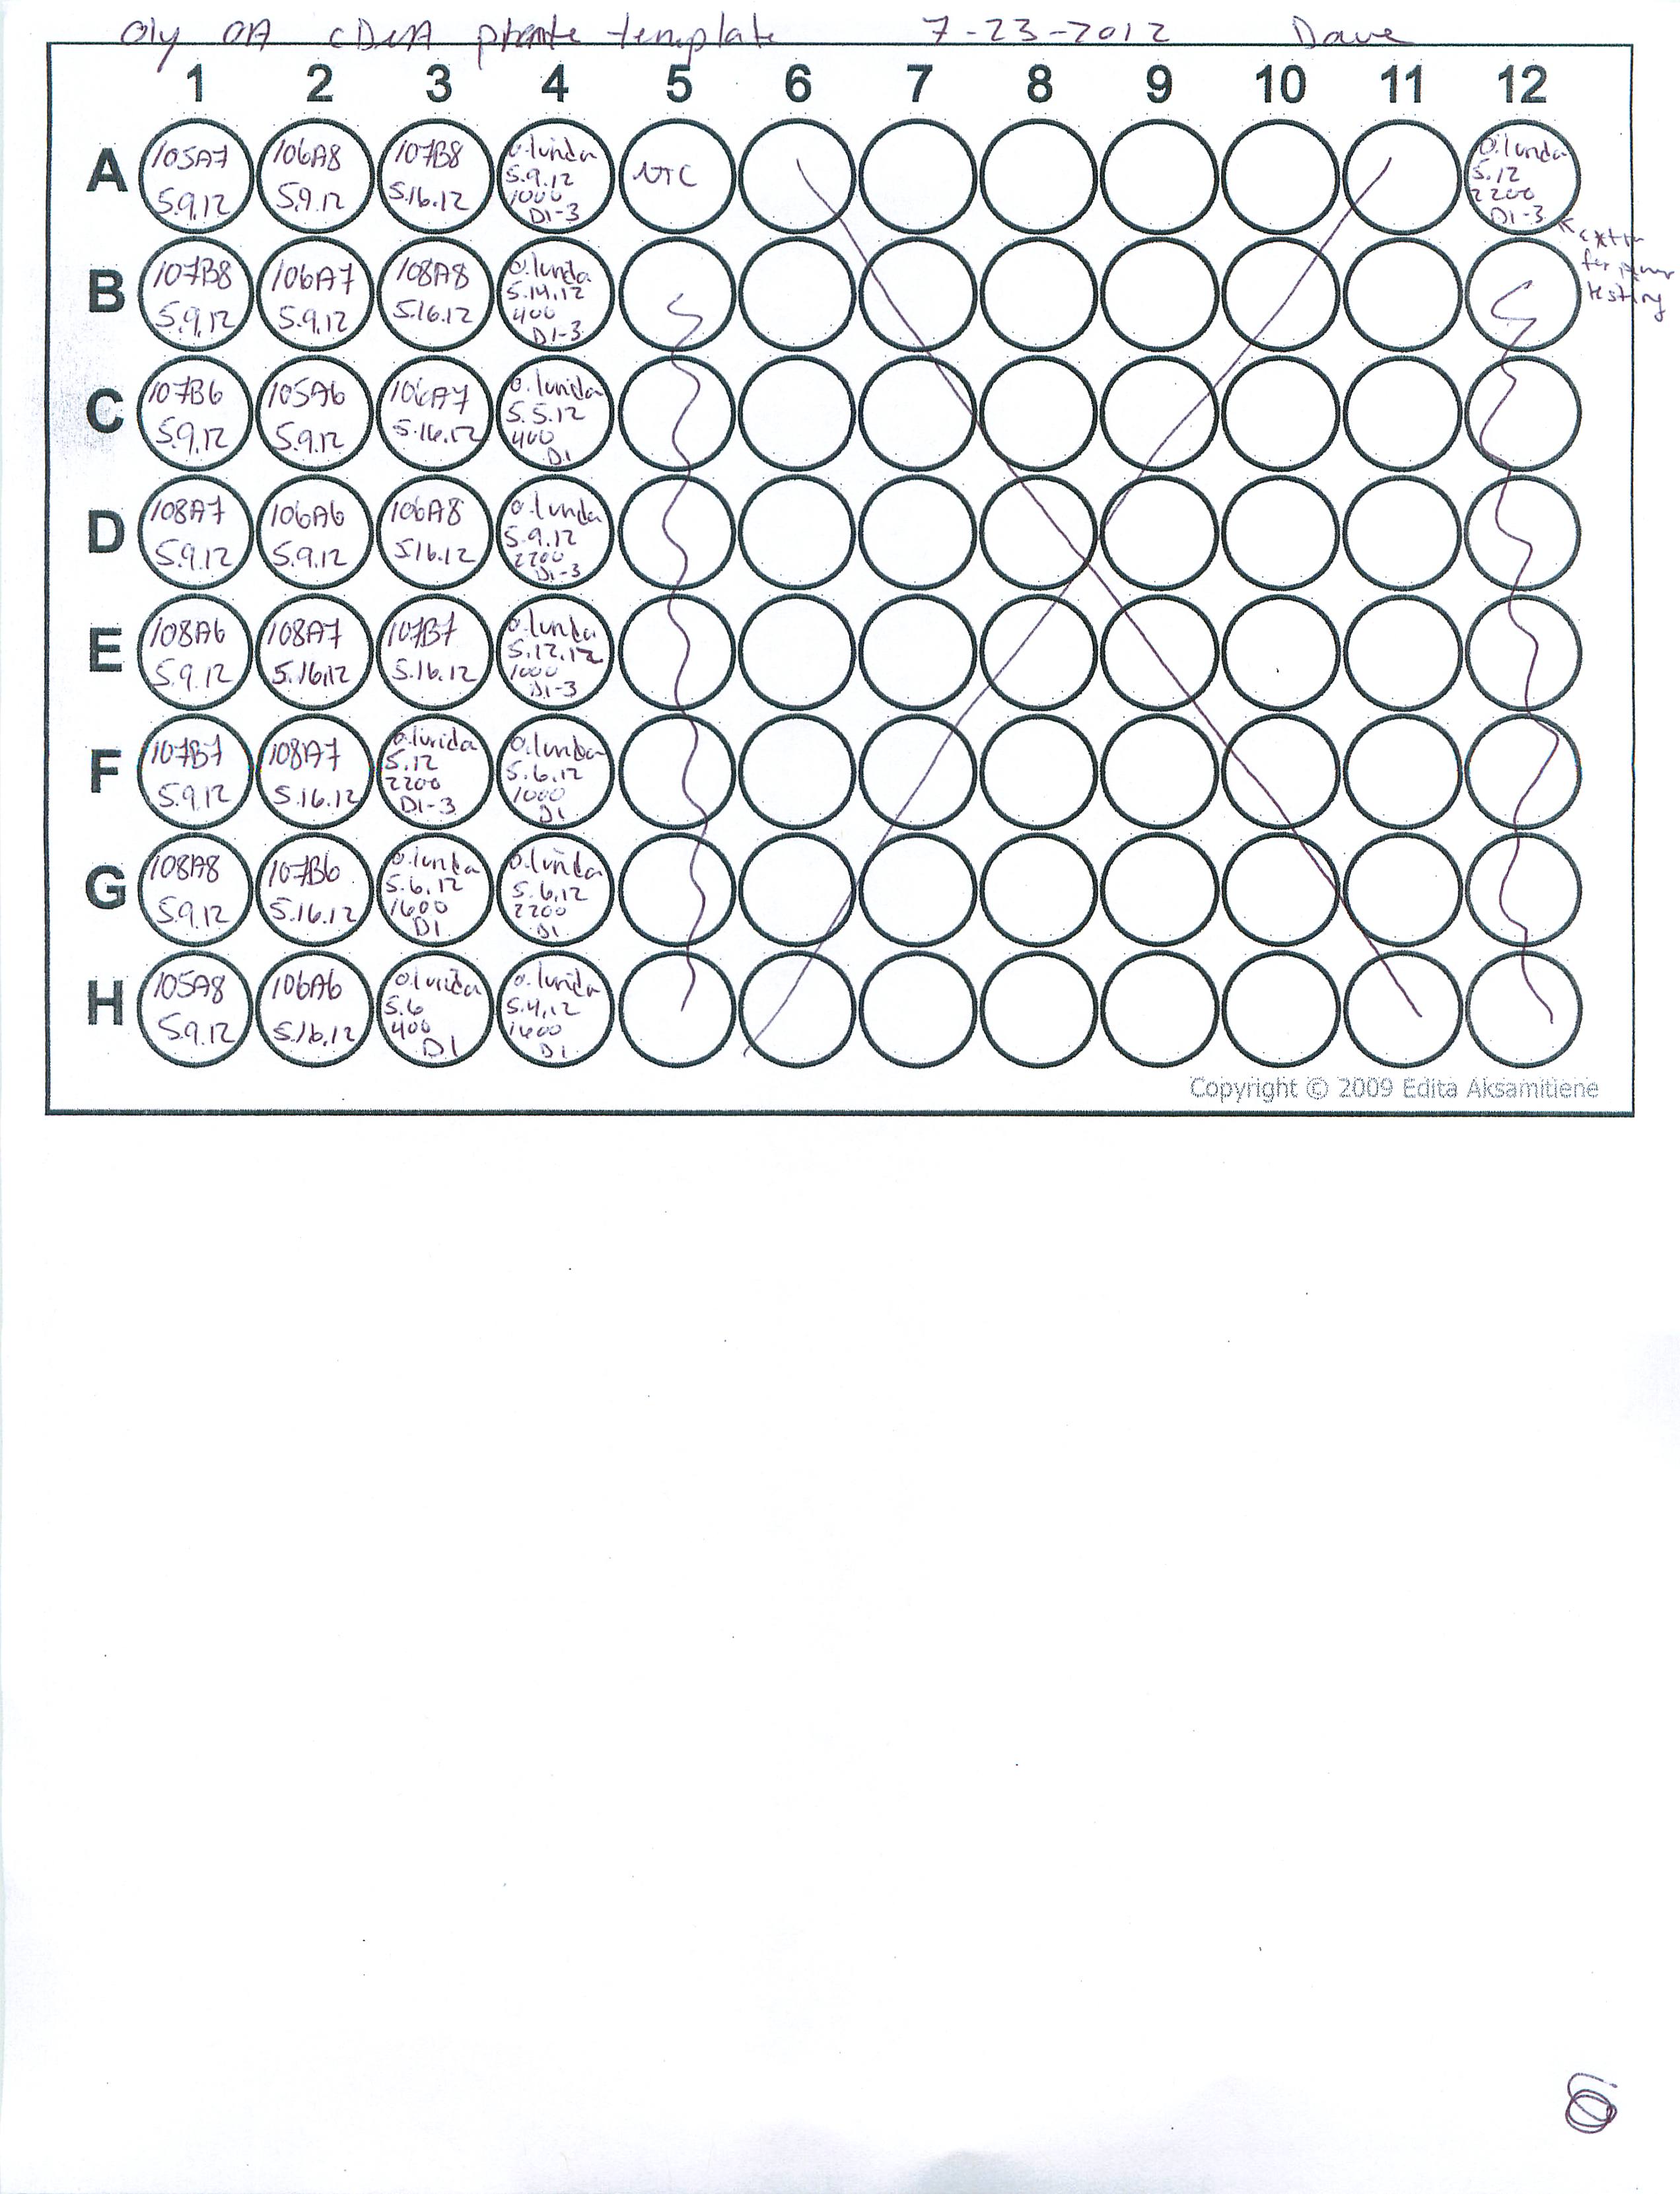
Master mix recipe and plate map are provided on the scanned sheet below
All samples were run in triplicate (loaded as indicated on plate map...then shift everything to the right)
Started RNA extracts of manila clam larvae from the OA experiment that was conducted July/August 2011
Extractions were done using tri-reagent
Quantified using nanodrop
| Sample ID |
User ID |
Date |
Time |
ng/ul |
A260 |
A280 |
260/280 |
260/230 |
Constant |
Cursor Pos. |
Cursor abs. |
340 raw |
| Day 0-1 |
Default |
8/1/12 |
6:02 PM |
390.17 |
9.754 |
5.188 |
1.88 |
1.66 |
40 |
230 |
5.862 |
0.038 |
| Day 0-2 |
Default |
8/1/12 |
6:02 PM |
407.85 |
10.196 |
5.482 |
1.86 |
1.72 |
40 |
230 |
5.942 |
0.038 |
| Day 0-3 |
Default |
8/1/12 |
6:02 PM |
79.55 |
1.989 |
1.162 |
1.71 |
0.8 |
40 |
230 |
2.492 |
0.002 |
| Day 0-4 |
Default |
8/1/12 |
6:03 PM |
378.94 |
9.473 |
5.019 |
1.89 |
1.5 |
40 |
230 |
6.315 |
0.008 |
| Day 0-5 |
Default |
8/1/12 |
6:03 PM |
145.04 |
3.626 |
2.018 |
1.8 |
1.16 |
40 |
230 |
3.138 |
-0.011 |
| 4C5 8.9.11 |
Default |
8/1/12 |
6:04 PM |
24.56 |
0.614 |
0.385 |
1.59 |
0.28 |
40 |
230 |
2.174 |
-0.007 |
| 4C6 8.9.11 |
Default |
8/1/12 |
6:04 PM |
32.14 |
0.804 |
0.512 |
1.57 |
0.42 |
40 |
230 |
1.914 |
-0.003 |
| 3C6 8.9.11 |
Default |
8/1/12 |
6:05 PM |
36.27 |
0.907 |
0.574 |
1.58 |
0.35 |
40 |
230 |
2.558 |
0.005 |
| 3C5 8.9.11 |
Default |
8/1/12 |
6:06 PM |
33.84 |
0.846 |
0.532 |
1.59 |
0.45 |
40 |
230 |
1.876 |
-0.009 |
| 3C4 8.9.11 |
Default |
8/1/12 |
6:06 PM |
123 |
3.075 |
1.89 |
1.63 |
0.43 |
40 |
230 |
7.074 |
0.023 |
| 1C1 8.9.11 |
Default |
8/1/12 |
6:06 PM |
96.48 |
2.412 |
1.507 |
1.6 |
0.37 |
40 |
230 |
6.438 |
0.019 |
| 4C4 8.9.11 |
Default |
8/1/12 |
6:07 PM |
11.34 |
0.283 |
0.187 |
1.52 |
0.33 |
40 |
230 |
0.848 |
-0.005 |
| 1C6 8.9.11 |
Default |
8/1/12 |
6:08 PM |
86.83 |
2.171 |
1.408 |
1.54 |
0.28 |
40 |
230 |
7.747 |
0.006 |
| 1C5 8.9.11 |
Default |
8/1/12 |
6:08 PM |
80.12 |
2.003 |
1.307 |
1.53 |
0.27 |
40 |
230 |
7.38 |
0.005 |
| 1C5 8.2.11 |
Default |
8/1/12 |
1:21 PM |
74.96 |
1.874 |
1.109 |
1.69 |
0.61 |
40 |
230 |
3.058 |
0.001 |
| 3C5 8.2.11 |
Default |
8/1/12 |
1:22 PM |
221.12 |
5.528 |
3.215 |
1.72 |
0.49 |
40 |
230 |
11.388 |
0 |
| 3C6 8.2.11 |
Default |
8/1/12 |
1:22 PM |
137.61 |
3.44 |
2.085 |
1.65 |
0.38 |
40 |
230 |
8.997 |
0.001 |
| 4C4 8.2.11 |
Default |
8/1/12 |
1:23 PM |
191.94 |
4.799 |
2.856 |
1.68 |
0.43 |
40 |
230 |
11.083 |
-0.004 |
| 1C4 8.2.11 |
Default |
8/1/12 |
1:23 PM |
134.89 |
3.372 |
2.056 |
1.64 |
0.41 |
40 |
230 |
8.308 |
-0.007 |
| 4C6 8.2.11 |
Default |
8/1/12 |
1:24 PM |
116.85 |
2.921 |
1.731 |
1.69 |
0.44 |
40 |
230 |
6.659 |
-0.006 |
| 4C5 8.2.11 |
Default |
8/1/12 |
1:24 PM |
187.69 |
4.692 |
2.819 |
1.66 |
0.42 |
40 |
230 |
11.069 |
0.005 |
| 1C6 8.2.11 |
Default |
8/1/12 |
1:25 PM |
175.95 |
4.399 |
2.609 |
1.69 |
0.42 |
40 |
230 |
10.472 |
-0.011 |
| 2C4 8.2.11 |
Default |
8/1/12 |
1:25 PM |
309.13 |
7.728 |
4.326 |
1.79 |
0.72 |
40 |
230 |
10.769 |
-0.002 |
-
"Lets take the example "1C3"
The "1" refers to the CO2 treatment
1 = 1000ppm
3 = 750ppm
4 = 400ppm
The "C" refers to which of the grey tubs over at noaa the larval
chambers were in. All of mine were in "C" for clam so the C is more or
less irrelevant at this point.
The third character, in this case "3" refers to which of the 6
replicate chambers the samples came from. There are 6 total chambers
total but only 3 were sampled on any given day. So for a particular
date you should only have three different numbers here (except the
final day of sampling there are 4 just to make it confusing)."
July 27, 2012
Ran qPCR to test Olympia oyster qPCR primers.
Used Evagreen ssofast supermix
For a 1x rxn volume:
2x SsoFast Evagreen Supermix: 10uL
Forward Primer: 0.5uL
Reverse Primer: 0.5uL
Water: 7uL
Template: 2uL (diluted template 1:5)
used cDNA from well A12 on 7/23/12 as template to test the primers
Ran Sam's 2-step EVAGREEN 65+Amp protocol
Results:

Primers ready to go:
Isoleucyl-tRNA synthetase
3-beta-hydroxysteroid sulfotransferase
GPx3
Primers that dont work:
Hemicentin
Primers that need some optimization but could work:
Calmodulin
Aryl Sulfatase
I might try to redesign the Hemicentin primers. This gene looked really interesting and it's a shame that it didnt work
Also helping Selina test her primers. Among them is a set for ef1a, which, if it works, could be used as a normalizing gene...
July 26, 2012
Ran RT reations using MMLV for Selina and Miranda's capstone project.
Below are the samples I selected and the corresponding number/sampleID used to label the cDNA tubes.
1: O.lurida 5.6.12 2200 D1
2: O. lurida 5.6.12 400 D1
3: O. lurida 5.6.12 1000 D1
4: 106A6 5.16.12
5: 107B8 5.16.12
6: 108A7 5.16.12
Added 1ul Oligo-dT to 0.5 ug of RNA. Brought volume to 14uL with sterile water. Incubated at 72 for 5min and placed on ice.
Master mix:
Buffer: 41ul
dNTP: 41ul
RT: 8.2
Added 11uL of master mix to each sample. Incubated at 42 degrees for 1hr.
July 24, 2012
Designed primers to genes identified from yesterday's RNA-seq experiment.
Ran enrichment analysis using DAVID to identify potential biological processes of interest and selected genes involved in those processes as well as a few other's that I recognized and thought would be interesting.
having some trouble posting images from the "sites" folder right now. Need to ask sam about that so I can post images of my work flow.
July 23, 2012
Need to develop primers for Olympia oyster larval samples from FHL experiment. Previously I used a de novo assembly from the oly experiment conducted at the UW facility (larvae treated at 400 and 2000ppm) but since then Steven has played around with the data a bit more so I am going to run another RNA-seq analysis with his assembly to compare to mine prior to picking genes and generating qPCR primers.
Steven's de novo assembly .fasta file can be downloaded from this link to his notebook:
https://www.evernote.com/shard/s10/sh/97c8da2f-1262-4d58-b3be-4a0de2122f9e/97d072a0f80ad80039089a11cadb6dca
Annotation to GO_slim can be downloaded form this link to his notebook:
https://www.evernote.com/shard/s10/sh/fa2009c6-5190-4df5-93fc-e8e317bbd3b5/fbb2de86b1b60b431ea220c68a814dac
Oly OA
Made cDNA from DNAsed RNA samples 7/20/2012
Added 1ul oligo/dt to 0.5ug (13ul) of total RNA. Incubated 70deg 5min. Iced.
Added 11ul of RT mastermix
5xbuffer: 5ul
dNTPS: 5ul
MMLV RT: 1ul
Total Rxn volume = 25ul
Incubate 40deg 1hr. samples were stored at 4deg until tomorrow to avoid freeze/thaw prior to testing primers.
Below is a plate map of how samples were loaded and will be loaded for future qPCR assays...
July 20th, 2012
Set up DNase reactions of O. lurida larval RNA samples isolated on 7/18, 7/19, and Day1 RNA that Sam isolated. Mixed RNA and Water as described below to bring volume to 45 ul. Added 5ul 10x buffer and followed "Rigorous" protocol by adding 0.5ul DNase and incubated at 37C for 30 min and adding another 0.5ul for another 30min.
| Sample ID |
ng/ul |
ul sample |
ul water |
| 5-16-12 106A6 |
1239.26 |
6.46 |
38.54 |
| 5-16-12 106A7 |
338.22 |
23.65 |
21.35 |
| 5-16-12 106B7 |
1571.98 |
5.09 |
39.91 |
| 5-16-12 106B8 |
812.88 |
9.84 |
35.16 |
| 5-16-12 108A8 |
86.48 |
all |
|
| 5-16-12 108A7 |
303.86 |
26.33 |
18.67 |
| 5-16-12 107B6 |
101.51 |
all |
|
| 5-16-12 105A6 |
43.44 |
all |
|
| 5-9-12 106A8 |
49.39 |
all |
|
| 5-9-12 106A7 |
112.31 |
all |
|
| 5-9-12 105A7 |
118.54 |
all |
|
| 5-9-12 105A8 |
106.29 |
alll |
|
| 5-9-12 107B6 |
84.07 |
all |
|
| 5-9-12 107B8 |
33.84 |
all |
|
| 5-9-12 108A6 |
254.3 |
31.46 |
13.54 |
| 5-9-12 108A7 |
108.2 |
all |
|
| 5-9-12 108A8 |
69.39 |
all |
|
| 5-9-12 107B7 |
51.5 |
all |
|
| 5-16-12 108A7 |
131.14 |
all |
|
| 5-16-12 106A8 |
1119.51 |
7.15 |
37.85 |
| 5-9-12 106A6 |
66.35 |
all |
|
| O. lurida 5-6 400 D1 |
592.05 |
13.51 |
31.49 |
| O.lurida 5.14.12 400 D1-3 |
1254.59 |
6.38 |
38.62 |
| O.lurida 5.5.12 400 D1 |
624.42 |
12.81 |
32.19 |
| O.lurida 5.6.12 1000 D1 |
1096.71 |
7.29 |
37.71 |
| O.lurida 5.09.12 1000 D1-3 |
1443.59 |
5.54 |
39.46 |
| O.lurida 5.12.12 1000 D-3 |
1061.55 |
7.54 |
37.46 |
| O.lurida 5.4.12 1600 D1 |
271.97 |
29.42 |
15.58 |
| O.lurida 5-6 1600 D1 |
93.63 |
all |
|
| O.lurida 5-6-12 2200 D1 |
1128.51 |
7.09 |
37.91 |
| O.lurida 5-9 2200 D1-3 |
1096.27 |
7.30 |
37.70 |
| O.lurida 5.12 2200 D1-3 |
1324.9 |
6.04 |
38.96 |
| Sample ID |
Date |
ng/ul |
A260 |
A280 |
260/280 |
260/230 |
Constant |
Cursor Pos. |
Cursor abs. |
340 raw |
| DNase 5.9.12 105A7 |
7/20/12 |
68.14 |
1.703 |
1.1 |
1.55 |
0.23 |
40 |
230 |
7.408 |
0.008 |
| DNase 5.9.12 107B8 |
7/20/12 |
20.44 |
0.511 |
0.317 |
1.61 |
0.32 |
40 |
230 |
1.591 |
0.002 |
| DNase 5.9.12 107B6 |
7/20/12 |
50.72 |
1.268 |
0.764 |
1.66 |
0.38 |
40 |
230 |
3.363 |
0.008 |
| DNase 5.9.12 108A7 |
7/20/12 |
68.34 |
1.708 |
1.05 |
1.63 |
0.36 |
40 |
230 |
4.696 |
-0.005 |
| DNase 5.9.12 108A6 |
7/20/12 |
125.84 |
3.146 |
1.668 |
1.89 |
0.78 |
40 |
230 |
4.055 |
0.012 |
| DNase 5.9.12 107B7 |
7/20/12 |
35.97 |
0.899 |
0.497 |
1.81 |
0.5 |
40 |
230 |
1.784 |
0.006 |
| DNase 5.9.12 108A8 |
7/20/12 |
52.38 |
1.31 |
0.771 |
1.7 |
0.33 |
40 |
230 |
4.008 |
0.019 |
| DNase 5.9.12 105A8 |
7/20/12 |
67.92 |
1.698 |
1.08 |
1.57 |
0.21 |
40 |
230 |
8.011 |
0.017 |
| DNase 5.9.12 106A8 |
7/20/12 |
39.89 |
0.997 |
0.642 |
1.55 |
0.24 |
40 |
230 |
4.195 |
0.017 |
| DNase 5.9.12 106A7 |
7/20/12 |
73.27 |
1.832 |
1.189 |
1.54 |
0.2 |
40 |
230 |
9.182 |
0.035 |
| DNase 5.9.12 105A6 |
7/20/12 |
44.44 |
1.111 |
0.681 |
1.63 |
0.14 |
40 |
230 |
8.045 |
0.009 |
| DNase 5.9.12 106A6 |
7/20/12 |
43.86 |
1.096 |
0.694 |
1.58 |
0.24 |
40 |
230 |
4.624 |
0.007 |
| DNase 5.16.12 108A7 |
7/20/12 |
56.64 |
1.416 |
0.738 |
1.92 |
1.12 |
40 |
230 |
1.263 |
0.082 |
| DNase 5.16.12 108A7 |
7/20/12 |
128.38 |
3.209 |
1.636 |
1.96 |
1.55 |
40 |
230 |
2.076 |
0.034 |
| DNase 5.16.12 107B6 |
7/20/12 |
72.91 |
1.823 |
0.976 |
1.87 |
0.74 |
40 |
230 |
2.448 |
0.013 |
| DNase 5.16.12 106A6 |
7/20/12 |
125.41 |
3.135 |
1.564 |
2 |
1.72 |
40 |
230 |
1.818 |
0.015 |
| DNase 5.16.12 107B8 |
7/20/12 |
128.95 |
3.224 |
1.587 |
2.03 |
1.69 |
40 |
230 |
1.913 |
0.047 |
| DNase 5.16.12 108A8 |
7/20/12 |
74.09 |
1.852 |
1.033 |
1.79 |
0.71 |
40 |
230 |
2.605 |
0 |
| DNase 5.16.12 106A7 |
7/20/12 |
137.74 |
3.444 |
1.799 |
1.91 |
0.89 |
40 |
230 |
3.883 |
0.04 |
| DNase 5.16.12 106A8 |
7/20/12 |
116.49 |
2.912 |
1.478 |
1.97 |
1.78 |
40 |
230 |
1.636 |
0.045 |
| DNase 5.16.12 107B7 |
7/20/12 |
131.02 |
3.275 |
1.649 |
1.99 |
1.61 |
40 |
230 |
2.033 |
0.052 |
| O.lurida 5.12 2200 D1-3 |
7/20/12 |
140.73 |
3.518 |
1.77 |
1.99 |
1.56 |
40 |
230 |
2.25 |
0.093 |
| O.lurida 5.6.12 1600 D1 |
7/20/12 |
61.55 |
1.539 |
0.926 |
1.66 |
0.14 |
40 |
230 |
11.13 |
0.03 |
| O.lurida 5.6 400 D1 |
7/20/12 |
115.68 |
2.892 |
1.459 |
1.98 |
1.32 |
40 |
230 |
2.191 |
0.035 |
| O.lurida 5.9.12 1000 D1-3 |
7/20/12 |
154.09 |
3.852 |
1.926 |
2 |
1.59 |
40 |
230 |
2.42 |
0.044 |
| O.lurida 5.14.12 400 D1-3 |
7/20/12 |
127.04 |
3.176 |
1.589 |
2 |
1.6 |
40 |
230 |
1.986 |
0.039 |
| O.lurida 5.5.12 400 D1 |
7/20/12 |
127.66 |
3.192 |
1.627 |
1.96 |
1.47 |
40 |
230 |
2.176 |
0.04 |
| O.lurida 5.9.12 2200 D1-3 |
7/20/12 |
133.24 |
3.331 |
1.671 |
1.99 |
1.69 |
40 |
230 |
1.971 |
0.043 |
| O.lurida 5.12.12 1000 D1-3 |
7/20/12 |
151.63 |
3.791 |
1.932 |
1.96 |
1.62 |
40 |
230 |
2.335 |
0.043 |
| O.lurida 5.6.12 1000 D1 |
7/20/12 |
139.19 |
3.48 |
1.734 |
2.01 |
1.68 |
40 |
230 |
2.067 |
0.019 |
| O.lurida 5.6.12 2200 D1 |
7/20/12 |
134.96 |
3.374 |
1.7 |
1.98 |
1.68 |
40 |
230 |
2.013 |
0.045 |
| O.lurida 5.4.12 1600 D1 |
7/20/12 |
148.18 |
3.704 |
1.946 |
1.9 |
1.44 |
40 |
230 |
2.575 |
0.037 |
July 11th
Extracted RNA from gonad tissue that was isolated from frozen body on July 10th using TriReagent. RNA pellets were resuspended in 500ul of DEPC treated water and quantified using a nanodrop (see below).
| Sample ID |
Date |
ng/ul |
Vol mixed |
| Male 106A-3 |
7/11/12 |
216.4 |
4.62 |
| Male 106A-9 |
7/11/12 |
212.65 |
4.70 |
| Male 106A-23 |
7/11/12 |
621.41 |
1.61 |
| Male 106A-20 |
7/11/12 |
182.72 |
5.47 |
| Male 106A-17 |
7/11/12 |
164.6 |
6.08 |
| Male 108A-6 |
7/11/12 |
178.91 |
5.59 |
| Male 108A-20 |
7/11/12 |
186.76 |
5.35 |
| Male 108A-19 |
7/11/12 |
296.65 |
3.37 |
| Male 108A-5 |
7/11/12 |
219.46 |
4.56 |
| Male 108A-7 |
7/11/12 |
228.29 |
4.38 |
| Female 106A-11 |
7/11/12 |
270.42 |
3.70 |
| Female 106A-7 |
7/11/12 |
231.41 |
4.32 |
| Female 106A-21 |
7/11/12 |
93.71 |
10.67 |
| Female 106A-10 |
7/11/12 |
148.88 |
6.72 |
| Female 106A-6 |
7/11/12 |
347.53 |
2.88 |
| Female 108A-26 |
7/11/12 |
208.56 |
4.79 |
| Female 108A-8 |
7/11/12 |
203.32 |
4.92 |
| Female 108A-21 |
7/11/12 |
289.53 |
3.45 |
| Female 108A-23 |
7/11/12 |
177.2 |
5.64 |
| Female 108A-4 |
7/11/12 |
122.71 |
8.15 |
1ug of each sample was mixed for sequencing. Gender and treatments were kept separate for a total of four mixed samples. Each mixture contains ~5ug of total RNA in a volume of ~20ul.
| Sample ID |
Date |
ng/ul |
| Male 106a Mix |
7/11/12 |
230.45 |
| Male 108a Mix |
7/11/12 |
218.08 |
| Female 106a Mix |
7/11/12 |
183.32 |
| Female 106a Mix |
7/11/12 |
191.78 |
July 10th
Dissected gonad and digestive gland tissue from frozen oly bodies. Tomorrow will extract RNA from gonads.
July 9th
Basement update: Connected Durafet pH probe to honeywell controller. Next step will be to figure out how to connect the honeywell to the computer and how to connect the solenoid valves (to the honeywell, labview, or somewhere else?)
Oly update: Met with Carolyn, Steven, and Sam to discuss progress and future plans for oly genomics. Have whole body samples of oly adults, 4 male and 4 female from 400 and 2200ppm CO2 treatments. Need to dissect out pieces of gonad and DG. Will extract RNA from gonad and send for sequencing (Illumina HiSeq, paired end, 50bp reads).
Also have larvae samples from "several days" (need to find samples to identify exact sampling days) of the 11 day experiment. Larvae were treated with 400, 1000, 1600, or 2200ppm CO2 seawater. Can start extracting RNA for future qPCR assays but need to create the backbone from the gonads first (from samples described above).
Developed qPCR primers with Selina and Miranda (capstone students) to test on oly larvae from Muk. Developed 5 primer sets including ef1a as potential housekeeping gene. Sequences were identified using NGS data from oly larvae. They will be coming back on monday once reagents arrive to start RNA extractions and make cDNA.
Normalizing qPCR data with "zero" values.
Having samples in your qPCR dataset below the detectable limit of the assay (ie Ct >40) can impact the statistical analysis by disrupting the normal distribution of the data. This data, however, is still important and should be included in the statistical analysis. While there are nonparametric tests to get around datasets like this, these tend to lack in statistical power. Below is a method to transform your "zero" data so that it becomes normally distributed and appropriate for parametric analysis.
1st. Check the raw "relative" expression data first by plotting every point on a histogram as seen below:

Notice how the distribution is shifted to the left due to the abundance of "zero" values.
2nd. Now determine the appropriate transformation to achieve normalcy. Unfortunately in this case, each treatment group only has 7 datapoints which is not enough to see the true distribution of the data. To obtain enough datapoints, I will need to combine data from all treatments to have enough datapoints to see the distribution. To do this, transform the data so that it is centered around mean "0". Essentially what we are seeing above a dataset with two separate means. To determine the appropriate transformation procedure, we must first generate a dataset in which all of the datapoints are centered around the same mean. To do this, calculate the individual means and standard deviations for each individual treatment group. For each datapoint, subtract the mean from the group and divide by the standard deviation. The data should now be transformed to a single mean of zero and a standard deviation of one. Test this by adding all of the values from a treatment group together, this should equal zero.
Now plot the histogram again:

Note at the distribution is still shifted to the left, but that's ok. We now have a dataset that is large enough to test different transformation to achieve normalcy.
3rd. Transform the data. Because qPCR data is normalized to a housekeeping gene, the expression values are actually proportions and should be transformed by taking the natural log (ln) of the data. Additionally, because the distribution is shifted, there needs to be some sort of adjustment to center the distrubtion, this can be done simply by adding "1" to the relative expression data prior to taking its natural log. Taking the natural log of one plus the relative expression value for each individual datapoint will results in the following histogram:

Check out that curve!!
this indicates that the following transformation ln(relative expression value +1), when applied to the data, will result in a normal distribution even when zeros are present.
Now, go back to the original "relative expression data," forgetting all of that "center around mean zero" business (remember that was just to test different transormations and is not useful for the actually statistical analysis), and apply the ln(relative expression value +1) transformation and run some stats!
April 9, 2012
For the past three days I've been running qPCR assays on the juvenile manila clam gill tissue from the FHL experiment.
All qPCR master mixes were made as follows (with the appropriate primers of course!)
MasterMix: 1010uL
Fwd Primer: 50.5uL
Rev Primer: 50.5uL
Water: 707uL
Plate map for all of the assays is the same and can found here.
Note on naming: Names correspond to treatment tank ID and sampling date
101A# = Ambient treatment plus replicate tank number
102A# = Elevated treatment plus replicate tank number
1/24/12 = Week 1
2/1/2012 = Week 2
2/9/2012 = Week 3
so....101A7 1/24/12 would be and ambient treatment from replicate tank 7 sampled on week 1.
Links to raw data are linked to the assays below:
Calmodulin
Elongation factor 2
hsp90
Perlucin-6
Cathepsin
GPX3
Elongation factor alpha
Analysis Note: Two samples consistently displayed delayed amplification curves corresponding to wells E1,E4,G4,andG10 on the plate map. These samples were removed prior to miner analysis as they are most likely technical outliers.
PCR miner was used to calculate efficiencies and raw expression values. All expression data was normalized to elongation factor alpha expression values.
Ran two-way anova analysis on time and treatment for all assays....no significant differences were detected in any of the assays.
Results!
Blue=ambient
Red=elevated


Still need to run stats to see if there's anything interesting hidden in all of this data!
April 2, 2012
First qPCR assays I would like to run on my "real" samples are:
Perlucin
Ef1 alpha
Calmodulin
GPX3
Ef2
Cathepsin
April 1, 2012
Ran qPCR assays on R.philippinarm gill and mantle tissue to test new primers. Summary of results is as follows:
Perlucin:
Low expression in gill and mantle (Ct~39). Consistent with what was seen in larvae. Allows for potential induction?
Melt curve looks good.
GPX3:
Higher in gill compared to mantle but expressed at low levels in both (Ct ~38)
Melt curve looks good
Beta Actin
Good expression (Ct in low to mid 20's). Higher in gill compared to mantle.
Bad Melt curve!
Ef1 alpha
Good expression (Ct in low to mid 20's). Higher in gill compared to mantle.
Great melt curve
Better normalizer assuming treatment has no impact.
f0 ATP
No expression in gill or mantle.
EF2
Good expression (Ct in low to mid 20's). Higher in gill compared to mantle.
Great melt curve
f1 ATP
Good expression (mid 20's). Similar between gill and mantle.
Poor melt curve
hsp70
Good expression (mid 20's)
Questionable melt curve....isoforms?
NADH
Good expression (mid 20's)
Questionable melt curve
Crumbs
Good expression in both tissues (mid 30's)
Great melt curve
Calreticulin
Good expression (mid to late 20's)
Questionable melt curve
Prefolding
Good expression (late 20's)
Questionable melt curve
Calmodulin
Good expression (late 20's). higher in gill compared to mantle
Good melt curve
hsp90
good expression (mid 20's)
good melt curve
Cathepsin
Low expression in both gill and mantle (late 30's)
Good melt curve.
Results Summary:
1. Assays that are good to move forward with are Perlucin, GPX3, EF1 alpha, EF2, Crumbs, Calmodulin, hsp90, and Cathepsin.
2. Could try out f0 ATPase assay using "acidified" tissue to see if there's any detectable expression.
3. Could also adjust Tm to clean up some melting curves but at this point I think I have enough assays to work with and will only do this if I need more options.
March 16, 2012
Because most of the assays that I designed from Ruphibase contigs did not amplify, there is a possiblity that these genes are only expressed, or at least expressed at detectable levels when exposed to higher CO2 conditions. I am going to re run the assays that showed no amplification using a small amount of pooled cDNA that Sam prepared from my experimental samples (ie clams exposed to 1000ppm CO2 seawater)
Used the same mastermix ratio as listed below.
Again, nothing amplified.
One the plus side, I forgot to test the Serum Lectin assay that I designed awhile ago to the available genbank sequence and it looks good! just nothing designed to Ruphibase looks great. Will to back to the drawing boards to see what's going on with primer designs etc.
March 15, 2012
Testing R.philippinarum qPCR primers on gill and mantle tissue.
Resuspened all primes in RNase free water to a stock concentration of 100uM. Diluted 1:10 to make working stocks of 10uM.
Pooled identical cDNA samples from March 9, 2012 to make 3 gill and 3 mantle cDNA samples. Pooled equal amounts of gill and mantle to make a working stock of cDNA, diluted 1:5 with RNase free water. Will run pooled gill and pooled mantle cDNA in triplicate.I'm not sure which tissue (if any) these genes will be expressed in so by testing both gill and mantle at the early stages of assay validation I will have a better idea of what to expect later on.
Set up Sso Fast qPCR mastermix
Sso Fast qPCR Mix: 10uL
Forward primers: 0.5uL
Reverse primers: 0.5uL
Water: 7uL
Add 18uL of master mix to each well
Add 2uL of cDNA as template
Raw qPCR data and plate map can be found in the qPCR data file.
March 9, 2012
Extracted RNA from juvenile clam gill and mantle tissue.
This tissue came from the same group of clams that were used in the FHL experiment during Jan/Feb or this year. These were not subjected to any kind of treatment other then sitting in the basement at UW for a week until I could get around to sampling them.
The purpose of these extractions is to have RNA from clam gill and mantle of the same age as used in the experiment to test the primers once they come in.
Set up RT reactions
Added sterile water to 1ug RNA to bring to 9ul. Added 1ul Oligo-dt. Incubate
Ran RT reactions in triplicate for each sample
| RT Rxn |
1x |
15x |
| 5x MMLV Buffer |
5 |
75 |
| dNTPs |
5 |
75 |
| MMLV |
1 |
15 |
| Water |
4 |
60 |
March 8, 2012
Ordered primers for R.philippinarum juvenile clam qPCR assays. (Check primer stock list for sequences).
Primers were designed based on Ruphibase contigs. Some of the sequences (ie. beta actin) are different from previously reported genbank submissions. Will test primers designed to each sequence and assess expression pattern before proceeding with full assays.
February 29, 2012
Some summary stats for manila larvae libraries.
1000ppm:
17,411 of the 23,944 contigs in Ruphi base were represented in the 1000ppm library (>10 reads)
Average Coverage = 44.9
Average Length of Consensus = 197.76
Average number of reads = 861.54
400ppm:
18,333 of the 23,944 contigs in Ruphi base were represented in the 400ppm library
Average Coverage = 97.04
FHL Heat Shock Summary
| Tank |
Temp |
2/11 |
2/12 |
2/13 |
2/14 |
2/15 |
2/16 |
2/17 |
| 101A1 |
38 |
0 |
0 |
0 |
1 |
0 |
2 |
|
| 101A2 |
38 |
0 |
0 |
0 |
0 |
0 |
0 |
|
| 101A3 |
39 |
0 |
0 |
2 |
2 |
2 |
1 |
|
| 101A4 |
39 |
0 |
0 |
2 |
3 |
2 |
- |
- |
| 101A5 |
40 |
0 |
1 |
4 |
2 |
- |
- |
- |
| 101A6 |
40 |
0 |
0 |
4 |
2 |
1 |
1 |
- |
| 102A1 |
38 |
0 |
0 |
0 |
0 |
0 |
2 |
|
| 102A2 |
38 |
0 |
0 |
0 |
0 |
0 |
2 |
|
| 102A3 |
39 |
0 |
0 |
2 |
4 |
1 |
- |
- |
| 102A4 |
39 |
0 |
0 |
2 |
5 |
- |
- |
- |
| 102A5 |
40 |
0 |
1 |
6 |
- |
- |
- |
- |
| 102A6 |
40 |
0 |
2 |
5 |
- |
- |
- |
- |
Manila OA Workflow: Combining with Ruphi annotations for GO enrichment analysis
1.Download all contigs from ruphibase by selecting "ID" and "Sequence" from their query menu and clicking "search." By not filling in any of the spaces above, the download will automatically begin.
Ruphi fasta file

2.Upload sequence to CLC.
3. Run a reference assembly with 400ppm and 1000ppm Manila OA Illumina Hiseq libraries using the ruphibase contigs as the backbone. Make sure unmapped reads are saved as a separate file.


4. Run a de novo assembly using the unmapped reads from the de novo assembly in step 3. This should, in theory, provide you with a list of contigs not present in ruphibase.


5. Open the new file generated from the de novo assembly, select all of the lines in the file and click on "open consensus" to save the consensus sequences from the de novo assembly as a separate file.

6. Export the consensus sequence file as a .fasta.
Consensus sequences from de novo assembly of unmapped reads
7. Export the ruphibase .fasta file from CLC (same file as step 1).
8. Open both the fasta file from ruphibase and the fasta file from the consensus sequences of the de novo assembly of unmapped reads (fastas from step 6 and 7)
9. Copy and paste the two .fasta files together to make a single fasta file. Upload this new .fasta file to CLC. This is now a combined sequnce file that contains all of the ruphibase contigs plus all of the contigs generated from the de novo assembly of the unmapped reads.
Combined Ruphi and Manila fasta file
Combined Ruphi and Manila txt file
RNAseq analysis
10. Using the uploaded file from step 9 as a backbone, run RNAseq analysis for both the 400ppm and 1000ppm Manila OA Illumina Hiseq libraries.


Annotate consensus contigs from step 6
11. Upload the .fasta file exported from step 6 to the SAFS Inquiry Portal for annotation. Click on NCBI then Blastall. Upload the .fasta file, select blastx from the dropdown menu, and swissprot from the protein database. Change both short descriptions and alignments go "1" and change output to "tabular"


12. When the blastx is complete (this can take awhile), download the .txt file
13. Upload the.txt Blastx file from step 8 to Galaxy.
14. Join the uploaded table containing blastx output with swiss prot identifiers using (these are not provided and must be downloaded from the swissprot database or obtained from steven).

TABLE JOINING
Upload the following tables to Galaxy
A. Annotations from BlastX
NOTE: Need to separate column using "|" as delimiter so that SPID is isolated
B. Uniprot swissprot titles
C. Associates uni swissprot
D. GO to GOslim
Joined tables in order listed above
Joined A&B based on SPID column
Join new table with table C based on SPID column
Join new table with Table D with GO ID column
15. Download the newly combined table which now contains Blastx information (ie. E-values) as well as swissprot identifiers such as species and gene name and the associated GO terms.
16. Sort the entire into two categories. One category contains all contigs more likely to be clam sequence, the second category contains all contigs most likely not clam contigs. This was done by looking at the species ID and keeping all species from worms and higher as potential clam genes, and all plants, algae, virus, bacteria, fungi, protist etc. as not clam genes.
Sorted file can be found here
17. Create a separate file that contains only the contig identfiers and the associated go terms for the "clam" genes and upload this to galaxy as a .txt tabular file.
18. Following this how to video, concatenate all of the go terms for a contig ID into a single cell.
19. Download the file and open in excel. Change all "GO:" into three hash lines "///" this is the code that CLC will use to identify the following number as a GO term and save as .csv file.
For more information on formatting annotation files for CLC click on this link.
Note: Make sure the column headings appear exactly as they do in this video or CLC will not identify this file as an annotation file.
20. Download IDs and GO terms from ruphibase.
Ruphi GO IDs

21. Open in excel. Combine all GO terms into a single cell sing the following command "=A1&B1&C1...etc..."so that all cells containing a GO term are included.
22. Paste all of the ruphi IDs and their associtaed GO terms into the .CSV file generated in step 19. You now have a complete list of all GO terms corresponding to all contigs used in the RNAseq analyis.
Complete list of Ruphi and Manila GO annotations formatted for CLC Annotation
23. Upload the annotation file to CLC. The how two video is in the second half of the video from step 18.
Running an Experiment and HyperG analysis in CLC
24. Create an experiment in CLC using the RNAseq files generated in step 10.
25. Using the newly generated experimental file, run statistical analysis on proportions to obtain p-values.

26. Annotate the experimental file using the uploaded .csv file from step 23.

27. Sort the experimental file based on fold change so that all contigs >2fold and <-2fold are kept. Accomplish this by making sure the "must satisfy at lease one parameter" option is selected.
28. "Select all" and open as a sub experiment.....no need to save this yet.
29. Sort the data again based on p-vale so that all remaining lines have a p-value <0.05.
30. Now select all lines and save this as a sub experiment ( it will actually be a subexperiment subexperiment).
31. Run hyper G analysis using the original experimental file and the new subexperiment file from step 30 (See figure from step 26).
Hyper G File
32. Congrats! you now have a list of enriched GO terms that you can upload to REViGO or do whatever!

February 15, 2012
Yesterday I started analysis of the manila OA data but using a combined backbone of ruphibase and manila OA contigs.
First I did a reference assemble of the manila OA reads to ruphibase and kept all reads that did not align.
Next I did a de novo assembly of the unmapped reads to assemble a list of contigs presumably not represented in ruphibase
I then exported .fasta files for both ruphibase and the contigs from the de novo assembly of unmapped reads and joined them together (copy and paste).
Next I uploaded the joined file into CLC and used this combined list of contigs as my backbone for RNAseq
Total number of contigs in ruphibase alone = 32,606
Number of reads for manila OA that map to ruphibase = 27,414
Number of reads that do no map to ruphibase =173,329,257
Total number of contigs from de novo of unmapped reads = 14,135
Total number of reads from de novo that map = 33,473,330
Total number of contigs in combined RuphiManilaOA = 46,740
Parameters from de novo assembly of unmapped reads:
Minimum contig length = 200
Limit = 8
Cost = 2
Summary statistics from RNAseq analaysis of Manila OA contigs to the combined RuphiOA backbone
Parameters:
minimum number of reads = 10
Max mismatch = 2
Total number of contigs with fold change > 2 and p-value < .05 = 3,087
1000ppm
mapped reads=32,507,593
unmapped reads=35,183,627
400ppm
mapped reads = 80,996,394
unmapped reads = 94,728,618
....46.6% of all reads incorporated in RNAseq analysis!
February 10, 2012
Working on GO enrichment analysis from Manila clam RNAseq analysis using the combined De novo assembly from our Illumina Hiseq libraries and the Ruphi database.
Some summary statistics:
Total number of significantly enriched GO processes: 10
Number of genes associated with those processes: 562
February 6, 2012
Reran de novo on manila clam Illumina data. Combined illumina data and ruphibase in de novo assembly.
= 30,053 contigs
Original number of contigs from Ruphibase = 32,606
hm.....I seem to be losing contigs AFTER assembly Ruphibase with Illumina compared to just Ruphibase. There are 1,183 contigs in Ruphibase that are < 200pb. These would be lost due to setting a minimum contig length to 200pb for my de novo assembly.
If other contigs from Ruphi are not present in my illumina library then those would also be lost becuase of my minimum number of reads = 10 setting...
Ran RNAseq analysis with 400ppm and 1000ppm data using the combined Illumina/Ruphi consensus sequences
= 8,483 contigs significantly regulated (Fold>2, P-value<.05)
Still Testing O2 probes.
Set up six replicate jars with 5 clams/jar
waited 5min after insterting probe to allow them to equilibrate before recording first (time 0) measurement. Recorded O2 every 10min for one hour.
| Time |
Jar 1 |
Jar 2 |
Jar 3 |
Jar 4 |
Jar 5 |
Jar 6 |
| 0 |
9.4 |
9.3 |
9.7 |
9.4 |
9.7 |
9.7 |
| 10 |
8.6 |
9.1 |
9.2 |
9.3 |
9.3 |
9.4 |
| 20 |
7.7 |
8.8 |
8.7 |
8.7 |
9.1 |
9.2 |
| 30 |
7.1 |
8.6 |
8.5 |
8.5 |
8.7 |
8.7 |
| 40 |
6.7 |
8.3 |
7.9 |
8.1 |
8.4 |
8.8 |
| 50 |
6.4 |
8 |
7.7 |
7.8 |
8.1 |
8.5 |
| 60 |
6.2 |
7.8 |
7.5 |
7.7 |
7.8 |
8.4 |
Testing O2 probes from Kristian:
Probe Model: PinPoint II from American Marine Inc.
Probes are extremely sensitive to movement. It takes ~5min for probes to settle and calibrate. Takes another ~5min once reading starts for probes to settle down. Once this is accomplished the probes read within 0.3 units of each other....close enough? Touching the probe caused O2 readings to jump. Considering that the probes will have to be swirled to ensure even mixing, this is a consern.
Starting O2: Determined by measuring the jars without animals in them and swirling probe = 10.1ish
O2 after 20min: 9.3 and 9.1....difference could easily be due to different sized clams in each jar.
Note: Be careful not to bump clams. Pull probe as high as possible while keeping metal "dot" submerged.
Looks like probes do detect changes in O2 when 5 clams are placed in the jars....
January 31, 2012
Juvenile Clam HS at FHL
2 white, 2 purple, 1 yellow dead
Final Tally: All yellow (40) dead, 2 purple (39) alive, 6 white (38) alive.
Result: 40 is the new lethal temp (up from 39)
FISH546
Repeating the de novo assembly. Change parameter for "minimum contig length" from 100 as previously run to 200.
Result: 48,222 contigs with an average length of 539 with 149,896,928 reads mapping out of 387,720,843 (39%). Still a fairly high percentage mapping compared to previous data sets and much more then I original thought after doubling the minimum contig length.
Will proceed with RNA-seq, annotation, GO enrichment etc. with this second denovo aka "de novo 200" and compare to "de novo 100"
January 30, 2012
Clam HS FHL
1 white dead
FISH546
RNAseq notes: 6,020 contigs out of 134,810 are significantly regulated (Fold Change > 2, P-value <.05)
22 unique to 400ppm
0 unique to 2000ppm...interesting.
January 29, 2012
3 yellow, 2 purple dead
FISH546
De novo assembly of Oly Illumina HI-seq reads
Results:
Out of 387,720,843 total reads, 181,293,112 mapped to 134,810 contigs! Granted, there are not as many genes in the clam genome as I have contigs but it's still pretty exciting that 47% of the reads were mapped!
Exported consensus sequences and saved as .fasta. Uploaded to inquiry and used blastx to swissprot to annotate.
Started RNAseq analysis for the 400 and 2000ppm libraries.
January 28, 2012
1 yellow dead
January 27, 2012
1 yellow dead
January 26, 2012
1 purple and 1 yellow dead
January 25, 2012
Clam LT Trial
1 dead yellow (40)
1 dead purple (39)
Olympia Oyster Larvae
Illumina Hi-seq data from the Olympia oyster larval experiment arrived today
2000ppm
192,340,255 total reads
400ppm
196,054,564 total reads
Good news: Librarys are pretty even pre trimming!
Started quality trimming:
FISH546
Trying to replicate Steven's results using the hard clam data. Only difference between analysis (besides user) is that I performed the de novo, RNAseq, etc.. independently.
920 differentially expressed genes (2fold, P<.05) no E-value limit. Removed duplicate Contig/SPIDs
13 unique in Barns
5 uniquq in Mash
344 remain after keeping e-values <0.009
313 after deleting duplicate SPIDs
Uploaded SPIDs as genelist to DAVID
For background gene list, keep all genes with e-values <0.009.
2019 remain after dups removed.
Downloaded the "Gene_Ontology" "GOTERM_BP_FAT" File from DAVID
Open file in Excel and separate "Term" column by "~" to isolate just the GO ID. Copy and paste GO IDs and associated P-values to REViGO (Only terms P < 0.05)
WOW!
Not similar to Steven's results but really interesting considering the experimental objective...
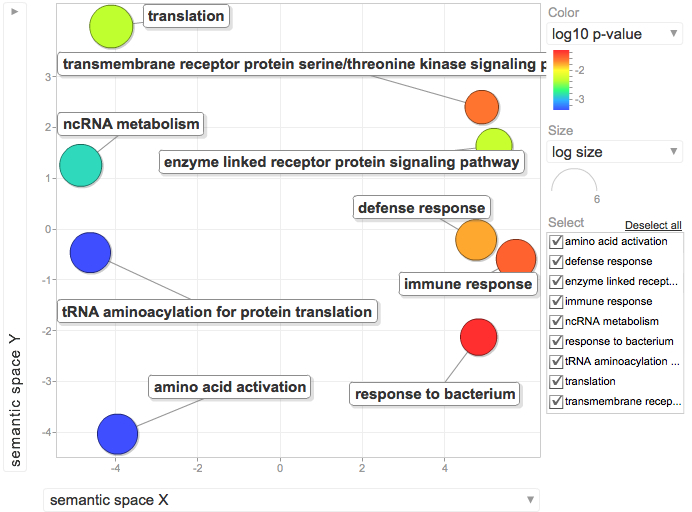
Isolate SPIDs from enriched GO terms presented above
61 unique genes from GO enrichment....seems low.
Upload SPID list to Galaxy and merge with RNAseq master file to identify gene names and regulation pattern.
January 24, 2012
Juvenile clam OA exp
Drove up to FHL with Carolyn to sample clams, oysters, and geoducks for her feeding experiment. I will piggy back on the clam experiment and take genomic samples every week for three weeks before exposing them to LT thermal stress.
Experimental overview
pCO2 treatments: 400ppm and 1000ppm
8 reps/treatment
8 clams per rep
n=64 total clams per treatment
Today I dissected one juvenile clam from each replicate tank (total n=8/treatment). Isolated gill, mantle, and the rest of the body in separate tubes and froze in LN2 for future RNA extractions.
Emma took water samples and processed them for TA today. Not sure how many.
Will update with other details tomorrow when I have carolyn's notebook
Need info on:
Start Date
Treatment temp
Flow rate
Chemistry sampling (spec pH and TA)
LT trial:
Started another trial experiment to confirm lethal temp for new clams. Previous trials identified the LT at 39 degrees C. Will test 38, 39, and 40. Emma will be at FHL all week to check mortalities for me...thanks Emma!
Notes:
n clams=8/temp
10min pre incubation at designated temperature
After 10min, moved clams to second beaker and incubated 1hr.
After 1hr, moved clams to ambient 13 degree C water
Color Code:
White = 38
Purple = 39
Yellow = 40
Below is a copy/paste from Carolyn's email regarding system/experimental specs
"We are targeting 400 uatm (pH 8.03) and 1000 uatm CO2 (pH 7.67) at 13C for the 2 treatments. 1.9L/hr is flow rate and jars are 3L suing drip emitters. Seawater is stripped of CO2 using membrane contactors under vacuum. A Honeywell controller connected to a Durafet pH probe are used to set the pH as a proxy for desired CO2 level. CO2 is mixed with CO2-free air using gas proportionators (is this rigth Emma) and solenoid valves into a venturi injector. Emma can correct all of my errors. Also what she is doing is in her paper.
Feeding, I forget...sorry...Emma we need you :-)
There are 20 ducks, 10 manila, 10 gigas and 4 lurida in each jar.
Attached is most of the starting data. Once Emma drops off my notebook, I'll add in the rest of the data.
cheers,
C
ps I collected the animals on jan 9 and took to FHL on the 10th. manila clams were fedex'd on the 10th to FHL to arrive the 11th. Feb 14 was when we measured the animals and placed into the system and CO2 was turned on on the 16th. Ambient was 11C. You will need to add a BIG thank you to Ro for helping set up the experiment as he helped make bivalve pillow bags (so did Robyn) and he also helped Emma and I weigh, measure, and enter data. Emma is taking all pics of morts and did so at start and is running the entire system, with the help of Moose O'Donnell and Matt?? (not sure of his last name) and this is all being done in Emily Carrington's lab....did I forget anyone?"
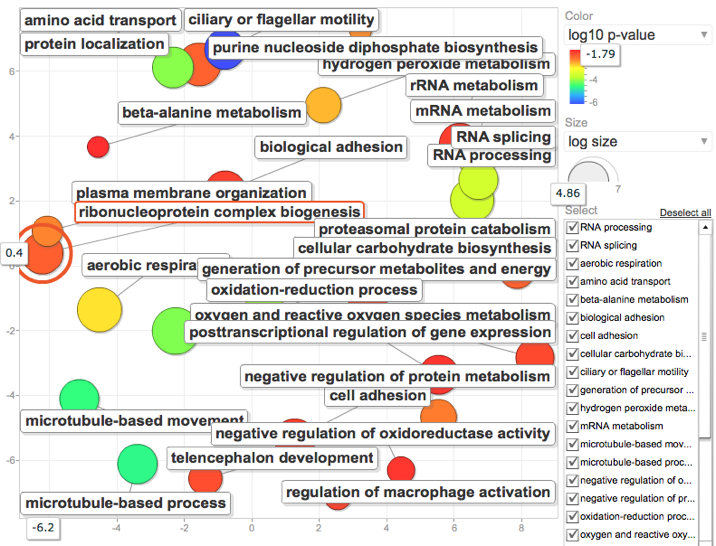
January 16, 2012
Modified "significantly regulated" genes to be those with E-value <.001 Fold Change >2.0 and P value < 0.05
REViGO results
January 12, 2012
FISH546
Tweaked my parameters a little to see how this would affect the GO enrichment analysis
Specifically: Instead of using 1e-5 as my E-value cutoff I tried using .001. From this I generated my "background" or reference list of annotated genes to do my GO enrichment analysis from. Generated a new page of all SPIDs that fid the E-value .001 cutoff.
I then generated a list of genes I considered to be "significantly" regulated using a 2Fold cutuff in expression and Pvalue of 0.1. Yes 0.1...Since I'm dealing with a non model and only a fraction of my genes map to the de novo and only a fraction of those can be annotated, I'm already starting with a reduced library and want to give my self the best shot at finding something interesting by using a loose parameter that is within the realm of acceptability. Dr. Conquest also convinced me in last quarters class that 0.1 is better anyway. Once the data was sorted by the designated E value, P value, and Fold enrichment, I generated a second list of those SPIDs to use as my gene list in the DAVID analysis.
Following the same steps as described below, I generated a list of enriched GO processes and visualized with REViGO
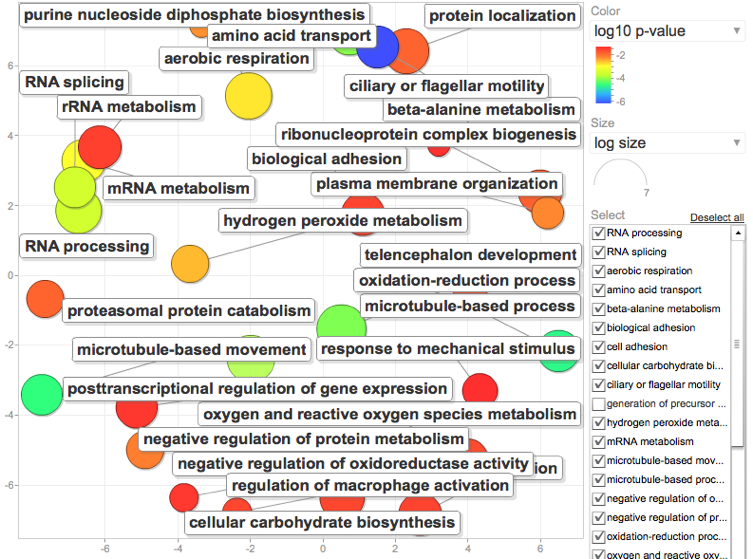
Yuck. Super cluttered but goes to show you what a difference changing the E value from 1e-5 to .001 can do. Since this seems to generate a lot more information, I now want to go back and try the same keeping E.001 but change the P-value to .05.
January 10, 2012
FISH546
Ran CLC experiment with RNAseq files created January 9, 2012.
Upon completion of experiment, performed Baggerly's statistitcal analysis on proportions.
Paramaters for "experiment" and subsequent statistical analysis are found in the screen shot below...
ANNOTATING CONSENSUS SEQUENCES FROM DE NOVO
Exported consensus sequenses as .fasta file
Open SAFS inquiry portal
---> NCBI
---> BLASTALL
---> Select BLASTX from dropdown menu
---> Upload the .fasta file containing your consensus sequences
---> Select "Swissprot" database from protein database dropdown menu
---> Scroll to bottom and change both "short descriptions" and "how many alignments" to "1"
---> From "alignment view option" select "tabular" form the dropdown menu
--->START BLASTALL
Downloaded tabular file from blastall result
TABLE JOINING
Upload the following tables to Galaxy
1. RNAseq experiment with stats
NOTE: remove spaces from "consensus from contig #" so that it will match the annotation file from the BLASTX
2. Annotations from BlastX
NOTE: Need to separate column using "|" as delimiter so that SPID is isolated
3. Uniprot swissprot titles
4. Associates uni swissprot
5. GO to GOslim
Joined tables in order listed above
Joined 1&2 based on "consensus from contig" column
Joined with 3 based on SPID column
Joined with 4 based on SPID column
Joined with 5 based on GO ID column
Here's the unfiltered data after all that table joining...
ENRICHED GO ANALYSIS
--->Sorted table based on E-vale and removed all annotations with e-values < 1e-5
--->Removed all duplicate SPIDs and uploaded the SPIDs as the "background" list in DAVID
--->continued sorting by fold change and removed all contigs <2 fold differentially expressed between libraries
--->Sorted again based on p-value and removed all contigs wiht p-values <0.1
--->Uploaded remaining SPIDs to DAVID as the "gene list"
--->Select "Gene Ontology" form menu
--->Select "Chart" next to "GOfat" and download the associated table.
--->Separate the GO ID from the GO annotation in the chart downloaded from DAVID
--->Copy the GO ID and the associated P-value (only those with P-values<0.1)
--->Paste into REViGO screen and run REViGO visualization
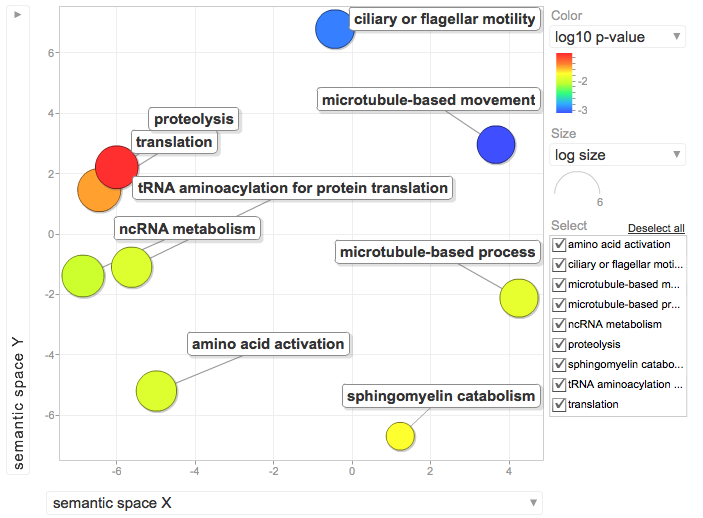
January 9, 2012
FISH 546
Ran De novo assembly of MX and BX hard clam data.
Results: 8,842 lines
Exported consensus
Started RNAseq analyis. Started two RNAseq jobs. one for MX and one for BX. Both use consenesus contigs from de novo assemble described above.
January 5, 2012
Dropped of water samples at NOAA for DIC/TA analysis. Cynthia thought it would take roughly 3 weeks before I would get the data back. Sample information provided to PMEL can be found in the chart below.
| Sample ID |
Sample Date |
Salinity (ppt) |
DIC (umol/kg) |
TA (umol/kg) |
Spectrophotometric pH (all measured at 25C) |
Sampling Temp. (C) |
Notes |
| 2000ppm |
12/15/11 |
33 |
7.31 |
17.4 |
100 ul saturated HgCl2 |
||
| 750ppm |
12/15/11 |
33 |
7.64 |
17.4 |
100 ul saturated HgCl2 |
||
| Ambient |
12/15/11 |
33 |
7.79 |
17.4 |
100 ul saturated HgCl2 |
||
| 2000ppm |
12/17/11 |
33 |
7.32 |
17.4 |
100 ul saturated HgCl2 |
||
| 750ppm |
12/17/11 |
33 |
7.67 |
17.4 |
100 ul saturated HgCl2 |
||
| Ambient |
12/17/11 |
33 |
7.77 |
17.4 |
100 ul saturated HgCl2 |
January 4, 2012
Pooling total RNA from Oly OA experiment for NGS sample prep.
Typically, at least 200ng of mRNA is needed to make a library. Assuming 1% recover of mRNA from total RNA quantity, a minimum of 20ug of total RNA is needed. To be conservative, I'm aiming for 40ug of total RNA.
Pool:
400A: 15.85ul
400B: 13.41ul
400C: 19.41ul
2000A: 11.81ul
2000B: 11.09ul
2000C: 14:43ul
Spec pooled samples using nanodrop
| Sample ID |
User ID |
Date |
Time |
ng/ul |
A260 |
A280 |
260/280 |
260/230 |
Constant |
Cursor Pos. |
Cursor abs. |
340 raw |
| 400 |
Default |
1/4/12 |
10:44 AM |
822.78 |
20.569 |
9.589 |
2.15 |
2.09 |
40 |
230 |
9.863 |
0.872 |
| 2000 |
Default |
1/4/12 |
10:45 AM |
1062.93 |
26.573 |
12.461 |
2.13 |
2.18 |
40 |
230 |
12.205 |
0.699 |
400 total volume after spec = 45ul = 37ug total RNA
2000 total volume after spec = 35ul = 37ug total RNA
lookes good! Gave pooled samples to Sam to drop off at the UW HTGU and put the remaining total run samples into the "Dave's Clam OA larvae" box on the bottom shelf of the -80.
January 3, 2012
Talked with Steven and Carolyn and both agree that days 1-3 of the ambient(400) and the 2000 treatment should be pooled to make NGS libraries. Sam is out today so I will do the pooling tomorrow before he takes them to the UW HTGU downtown.
January 2, 2012
Back in the lab for a quick round of RNA extractions from the Oly OA experiment (See below).
Extracted all nine samples from the experiment (days1-3 from ambient, 750, and 2000ppm) using tri reagent.
Added 300ul Trireagent, homogenized, added remaining 700 and followed the rest of the standard protocol.
Samples were resuspended in 100ul sterile water and quantified using the nanodrop.
| Sample ID |
User ID |
Date |
Time |
ng/ul |
A260 |
A280 |
260/280 |
260/230 |
Constant |
Cursor Pos. |
Cursor abs. |
340 raw |
| 400 A |
Default |
1/2/12 |
12:27 PM |
841.24 |
21.031 |
9.715 |
2.16 |
2.16 |
40 |
230 |
9.734 |
0.771 |
| 400 B |
Default |
1/2/12 |
12:28 PM |
994.01 |
24.85 |
11.407 |
2.18 |
2.19 |
40 |
230 |
11.344 |
1.089 |
| 400 C |
Default |
1/2/12 |
12:28 PM |
686.75 |
17.169 |
8.008 |
2.14 |
2.1 |
40 |
230 |
8.16 |
0.718 |
| 750 A |
Default |
1/2/12 |
12:29 PM |
1383.8 |
34.595 |
16.38 |
2.11 |
2.25 |
40 |
230 |
15.402 |
0.905 |
| 750 B |
Default |
1/2/12 |
12:29 PM |
976.77 |
24.419 |
11.768 |
2.08 |
2.25 |
40 |
230 |
10.833 |
0.568 |
| 750 C |
Default |
1/2/12 |
12:30 PM |
743.2 |
18.58 |
9.004 |
2.06 |
2.2 |
40 |
230 |
8.443 |
0.584 |
| 2000 A |
Default |
1/2/12 |
12:30 PM |
1128.56 |
28.214 |
13.082 |
2.16 |
2.19 |
40 |
230 |
12.884 |
0.763 |
| 2000 B |
Default |
1/2/12 |
12:31 PM |
1202.5 |
30.062 |
14.038 |
2.14 |
2.19 |
40 |
230 |
13.701 |
0.832 |
| 2000 C |
Default |
1/2/12 |
12:31 PM |
924.15 |
23.104 |
10.844 |
2.13 |
2.24 |
40 |
230 |
10.325 |
0.364 |
December 17, 2011
Last day of Oly experiment and everything is still bubbling.
Took speck pH samples of remaining larval chambers (only one per treatment at this stage)
Took samples for water chemistry (DIC/TA).
Took samples for mortality counts as described previously (12/15/2011) and froze remaining larvae in LN2 and stored at -80 deg C.
Ambient: Jar C
750: Jar C
2000: Jar B
Summary:
pH was consistent between chambers within each treatment and across all sampling days.
No difference in mortality between treatments and no major mortalities for the duration of the experiment.
December 16, 2011
All jars still bubbling!!
Temp is holding at a comfortable 17.4 degrees C
Took samples for mortality for all remaining jars (2/treatment) as described previously.
Sampled entire jar for transcriptome analysis.
Ambient: Jar B
750ppm: Jar A
2000ppm: Jar A
December 15, 2011
Sampling Oly larvae
Started sampling at 3pm = Full 24 hours of larvae being exposed to treatment water = larvae are ~24-36 hours post spawn.
Spec pH samples were taken from all larval nine larval chambers.
Chambers sampled for 24 hour NGS timepoint:
Ambient "A"
750ppm "B"
2000 "C"
Also took water samples for DIC/TA from the same jars that were sampled for NGS. Water chemistry samples were taken BEFORE all other sampling.
Two replicates of 3 x 30ul were taken from all larval chambers for mortality counts.
The remaining jars were given ~33% water change with water that had been equilibrating over night with the appropriate gas mix in the treatment boxes.
December 14, 2011
Drove to Taylor Shellfish hatchery in Quilcene to pick up ~1million 12hour old Oly veliger larvae.
Initial counts in 50ml of sterile seawater = ~215larvae/10ul = 21,500 larvae/mL x 50ml = 1,075,000 total larvae
Added 2.5ml from the 50mL stock to each of the 4.5L treatment "chambers" = 53,750 total larvae = ~12larvae/ml
Each treatment chamber has it's own airstone with a steady stream of SMALL bubbles from the appropriate designer gas or ambient air source.
Treatments are:
Ambient air from the air lines in the basement
750ppm CO2 designer gas
2000ppm CO2 designer gas
Bubbling began at 9am. Could not start bubbling yesterday because gas was limited and we did not know if we would have larvae until this morning. Larvae went into treatment chamber around 3pm so the water had been equilibrating for ~6 hours. Sammi took spec pH of treatment water before we added the larvae
Sammi and Emma made fresh dye for the spec pH and did the dye corrections.
December 13, 2011
Prepared experimental system for Oly experiment tomorrow.
3 sweater boxes were outfitted with a gas line that came in from either a designer gas tank or ambient air source. The gas line was then split into 4 lines inside the sweater boxes. One line for each of the three oly larval chambers and another line for an "empty" control chamber.
Filter sea water to .22uM to remove ciliates and other nasty bits. This water will be used for all larval treatments.
November 30, 2011
Identification of unique sequence reads from OA illumina libraries
- Ran a reference assembly in CLC of both 400 and 1000ppm libraries against 454/Gonad backbone. Saved list of unmapped reads
- De novo assembly of unmapped reads
- Blastx of de novo consensus contigs to swissprot in SAFS portal. Raw output can be found here.
- Merged Blastx tabular file with swissport titles/descriptions and GO/GO_Slim terms. galaxy output file can be found here.
Result:
198 unique sequences (E value <.001) characterized to GO_Slim
17 involved in stress response
Some genes hit multiple contigs
Nevember 28, 2011
Kegg pathway analysis
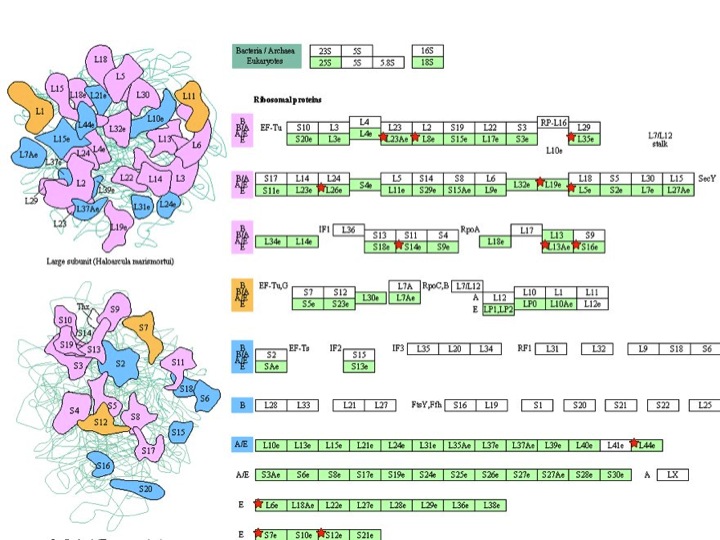
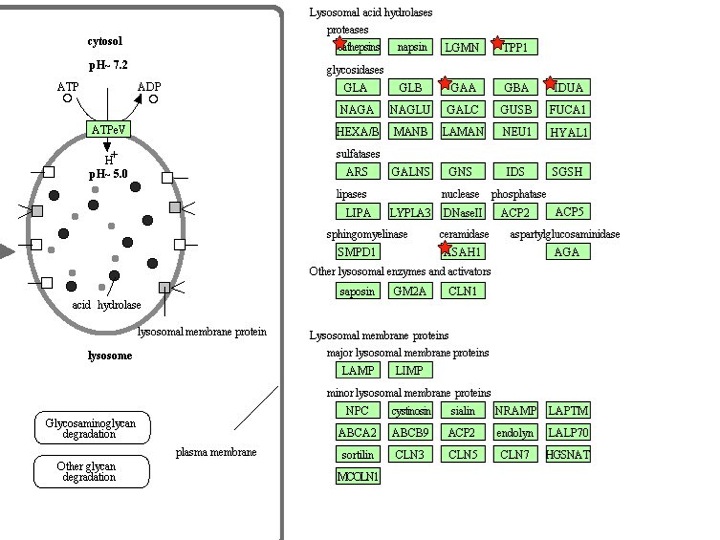
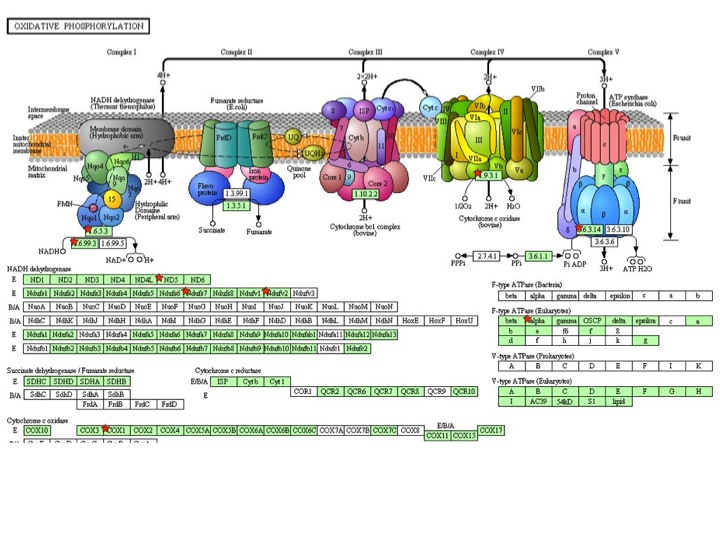
November 15, 2011
Re-analyzing OA/454/Gonad de novo and rnaseq data
Checking for duplicate annotations in the de novo assembly annotations running RNAseq with modified consensus file.
What I'm doing:
In Galaxy...
- Ran "statistics" "count" command to determine if there were "overrepresented" swissprot IDs in my de novo assembly
Answer = Yes several SPID accession numbers are represented by 10 or more contigs....some by more than 1000 contigs.
-Sort the annotation file in excel SPID and e-value. Removing dups will delete all contigs with the highest e-vale to a particular ID leaving just the the contig with the lowest e-vale score.
-Save as tabular and upload to galaxy.
-Upload .fa file of de novo contig sequences from CLC into galaxy.
-Convert fasta file to tabular in Galaxy
-Join sequence file with the annotation file where duplicate SPIDs were removed.
Some statistics so far...
Total number of contigs from de novo of OA, Gonad, and 454 data = 153,192
Total number of blastall hits of de novo contigs = ~170,000
Total number of blastall hits with dups removed = 66,921 = final number of contigs used in de novo.
November 3, 2011
I've been playing around with the OA Illumina data and I think I'm starting to get somewhere.
I've spent a lot of time trying to filter through RNAseq data in which I used ONLY my OA data in a de novo assembly and then used the consensus from that to perform RNAseq analysis from the 1000ppm and 400ppm treatment
The other analysis was combining my OA Illumina data with previously published 454 data and Illumina data from Rp gonads to do a de novo assembly (this took forever and generated an enormous amount of data....possible drawback?). In any event, I used the consensus sequences from that de novo to perform RNAseq using my OA Illumina data. The hope being that I would have more, larger contigs to deal with when it came time for annotating.
I have now managed to do some preliminary GO term enrichment analysis from both sets of analysis and the results are surprising.
Quick summary of parameters
DAVID Gene List:
all SPIDS that were 2 fold or more enriched in RNAseq analysis, had a p-value less than or equal to .05, and had an e-value less than or equal to 0.001.
DAVID Reference:
all SPIDs that had an e-value less than or equal too 0.001 (ie I considered them properly "annotated")
For REViGO visualization, I uploaded all enriched GO terms for Biological Processes that had and FDR of 0.01 or lower.
And....?
My OA Illumina ONLY analysis had Translation as the ONLY enriched GO term!
The OA/454/Gonad analysis is summarized in the figure below:
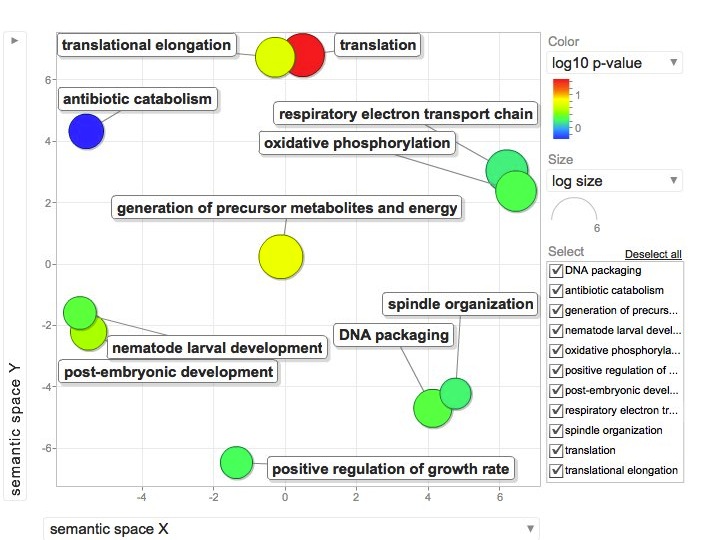
October 27, 2011
Percent survival summary from second pilot experiment to identify lethal HS treatment for manila clams (see 10/18/2011 for details)
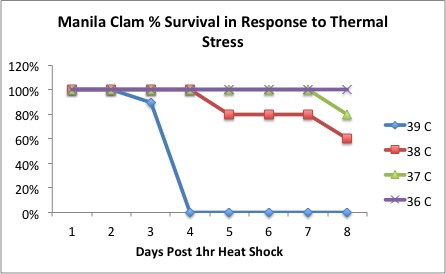
Colors indicate temperature of 1hr HS treatment.
Lethal temperature for this experiment appears to be 39 degrees C for 1hr followed by recovery at 16 degrees C.
Note: None of the clams were HS at 36 in pilot 1 and then again at 39 in pilot2 (this study) died during this experiment.
October 25, 2011
Fed clams/oysters in the afternoon....see spreadsheet.
Found two dead clams in the dark blue (38 degree) bag.
October 22, 2011
Fed clams/oysters in the morning....see spreadsheet.
Found 2 dead clams in the dark blue (38 degree) bag!
October 21, 2011
Fed Clams/oysters in the afternoon....see spreadsheet.
Found 6 dead clams in Brown (39 degree) bag. There are no more live 39 degree HS clams.
October 20, 2011
Fed Clams and oysters in the am...see spreadsheet
1 Dead clam in Brown (39 degree) bag!!
October 19, 2011
Fed Clams and oysters...see spreadsheet.
Nothing was dead from HS experiment after 24hours recovery.
October 18, 2011
Starting second pilot HS trial with clams
n=10 clams/treatment
Set up two 2L beakers in the water bath. One will be used as a "preheat" beaker to bring clams up to temp and the other as a 1hr "HS" beaker.
Clams were preheated for 10min before being transferred to HS beaker for 1hr and then returned to 16 degrees
Note: Transferred all clams from previous trial to new bag w/ two zip tip ties.
| Temp: |
36 |
37 |
38 |
39 |
39 SLT36 |
| Color Code: |
Red |
Light Blue |
Dark Blue |
Brown |
Purple |
Fed Clams as oysters as usual...see spreadsheet.
October 17, 2011
Fed Clams and Oysters at 3:30pm. Check spreadsheet.
Nothing was dead from HS trial.
This marks the end of the one week mortality period for the heat shock trial.
Results summary:
None of the oysters died. Most likely due to changes in HS waterbath temp upon submersion of oysters. Will need to preheat oysters before HS treatment for next trial.
All clams at 42 degrees C died DURING their HS treatment. This temp is way too high.
All clams at 39 degrees C died four days after HS treatment (2 on day 3, and 5 on the fourth day).
Will start another HS pilot tomorrow with HS temps of 36, 37, 38, and 39 degrees C. Will also HS clams from previous pilot that were HS at 36 for fun to see if there might be an impact of SLT.
October 16, 2011
Fed Clams and Oysters 6:00pm. Check the spreadsheet.
Nothing was dead from HS trial.
October 15, 2011
Fed Clams and Oysters 6:30am. Check the spreadsheet.
Nothing was dead from HS trial.
October 14, 2011
Fed Clams and oysters 9:30am. Check the spreadsheet.
Found two dead clams in the 39 C heat shock treatment!
Fed Clams and oysters 4:30pm. Check the spreadsheet.
The remaining 3 clams in the 39 C bag were dead.
Emptied and cleaned all alkalinity bottles. They are currently sitting in the hood drying.
October 12, 2011
Fed clams and oysters as usual.
No mortality was seen in any of the heat shocked animals.
October 11, 2011
Fed and check clams/oysters from October 10, 2011 heat shock experiment at 4:30pm. There were no mortalities.
Some preliminary RNAseq data...
Below is a volcano plot of RPKM values for 1000ppm (Y axis) and 400ppm (X axis) from the RNAseq of the OA data ONLY. This is just my own data and was not combined with the 454 or Gonad data...I'm still working on that.
NOTE: Duplicates have not been removed, Non significant have not been removed, No groupings have been performed, this is just an initial observation of what the RNAseq expression data looks like.
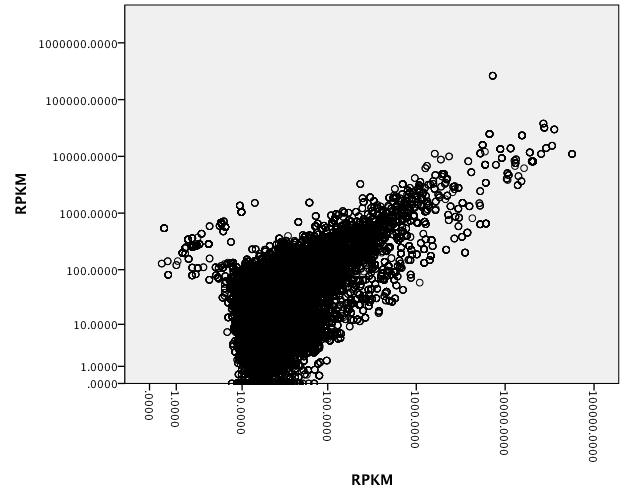
Looks like there might be an interesting cluster to look at in the 1000ppm as well as some genes unique to 400ppm.
Starting a DAVID analysis of OA ONLY data.
Submitted SPID to DAVID that fit the following criteria:
1. Over 2 fold change in expression (+/-)
2. P-value < .05
3. E-value < .001
N=1,715 SPID's submitted to DAVID
--> Downloaded enriched BP from DAVID output and uploaded to REVIGO with associated DAVID p-values
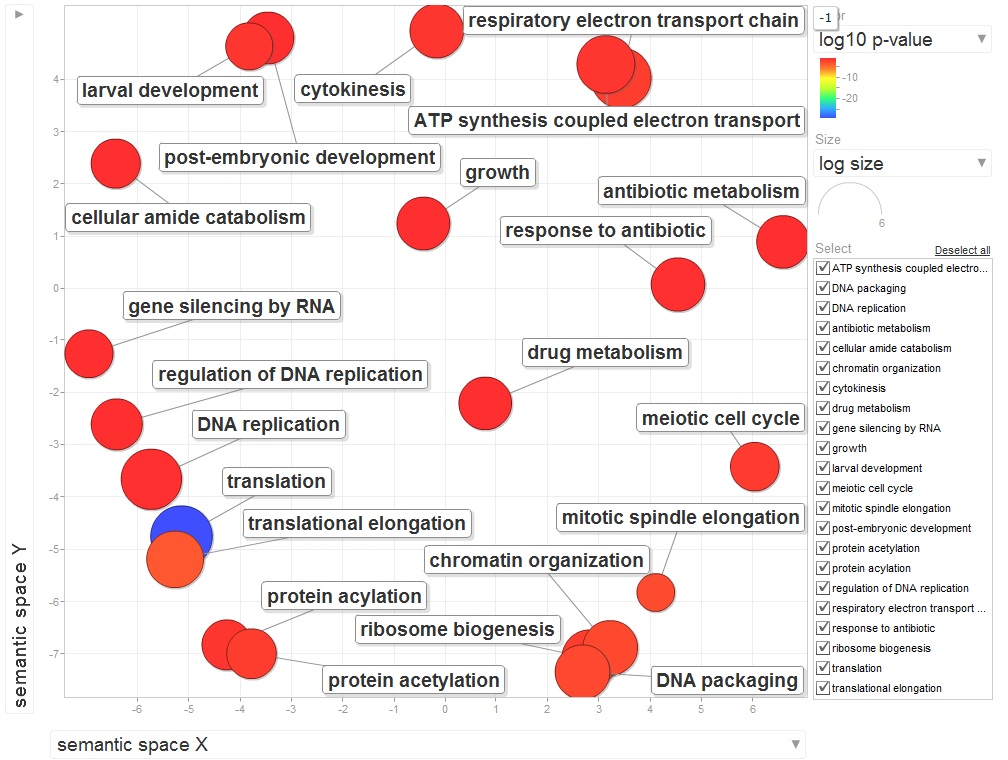
Below is the pie cart for BP of RNAseq data with the same criteria as above...
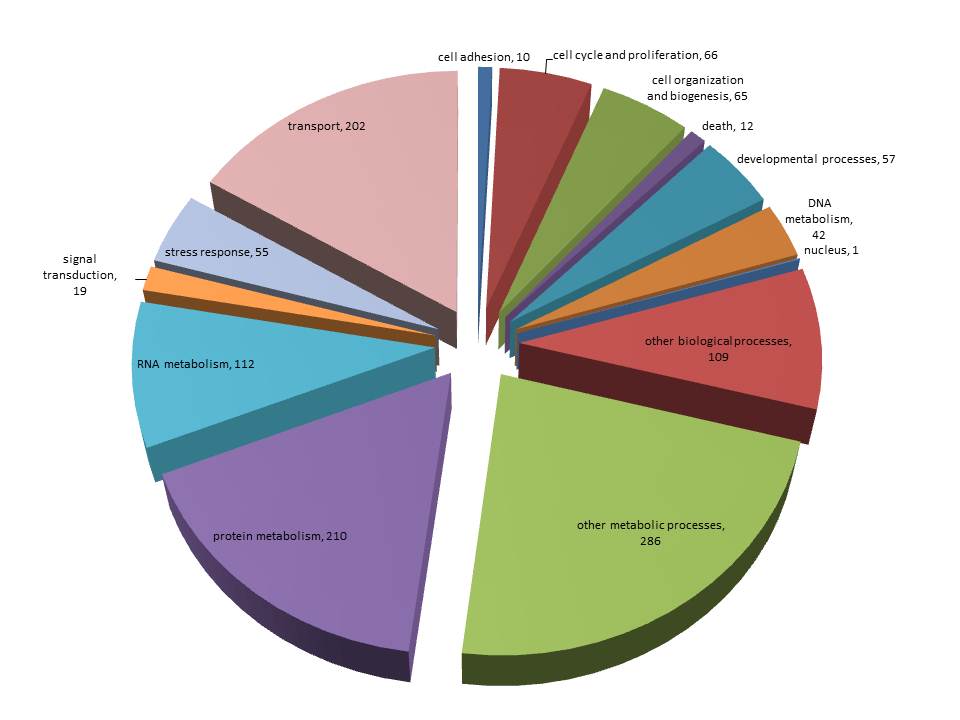
GO Slim Pies
Up in 400ppm 2 Fold N=909 Up in 1000ppm 2 Fold N=33
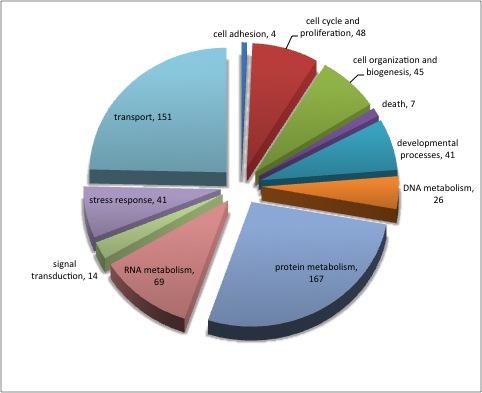
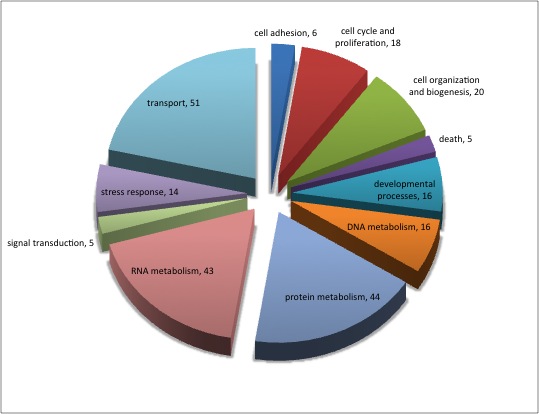
October 10, 2011
Started RNAseq on 400ppm and 1000ppm samples to OA 454 Gonad consensus, OA 454 consenses, and OA only consensus.
starting heat shock exp. with oysters and clams.
General protocol:
Heat shocking temperatures: 30, 33, 36, 39, 42, 45 degrees C
10 clams/bag
Heat shock 1hr and return to tank at 16 degrees C
Clam color code:
Brown: 30 C
Dark Blue: 33 C
Light Blue: 36 C
Purple: 39 C
Green: 42 C
45 C
October 7, 2011
BlastX is done!
Time for some extreme table joining to figure out what I have....
Preliminary results for Clam OA NGS data.
Below is a pie chart that represents a summary of the identified biological processes from my clam OA illumina data. This data is NOT RNAseq data, wrather it is a summary the biological processes identified from the raw data. No information is available regarding changes in expression in these data between treatments. Duplicates have not been removed. A fairly liberal E-value cut off .001 was used for annoatation.
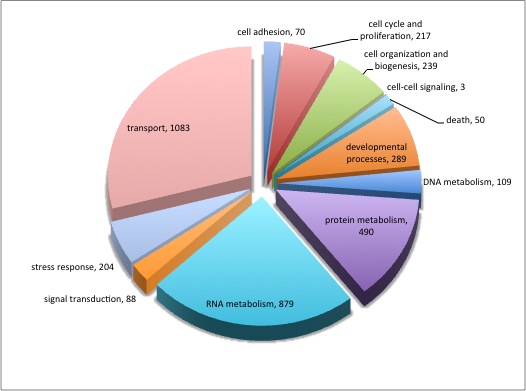
Results from Reference assemblies of OA data back to OA consensus sequences and OA data to the combined de novo of OA/454/Gonad consensus sequences.
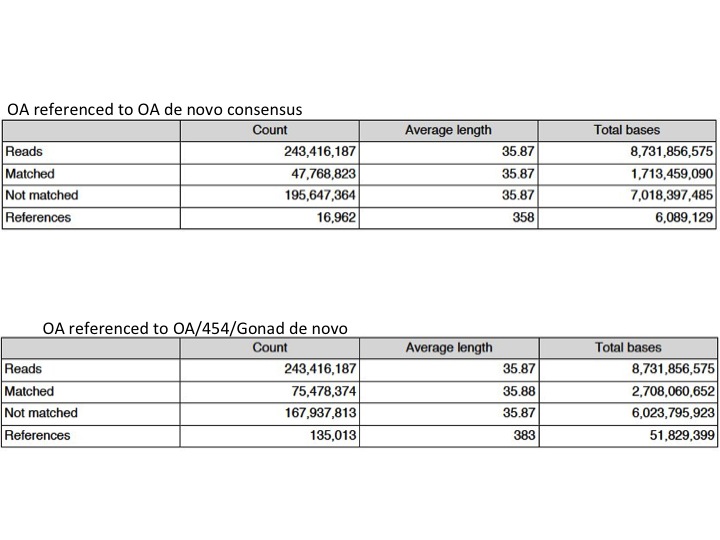
Note: Gonad paper was published today!
October 6, 2011
Started BlastX of OA Illumina data consensus sequences in portal...
Started BlaxtX of 454 adult gill and mantle data sequences in portal...
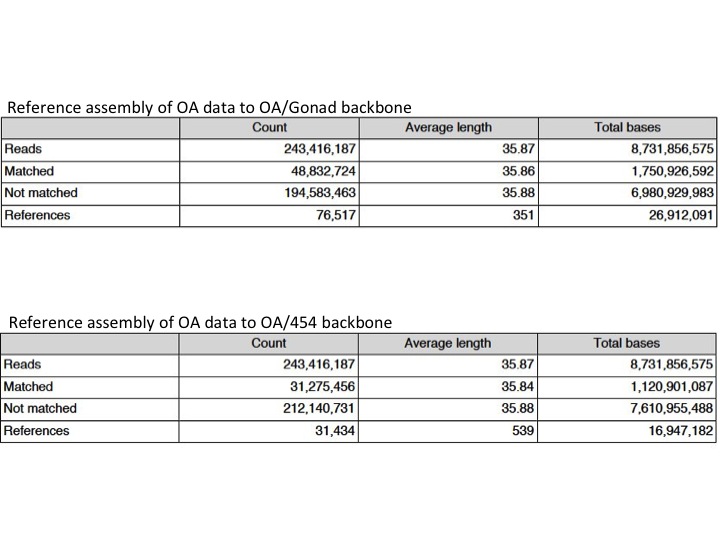
October 4, 2011
Some de novoing results...
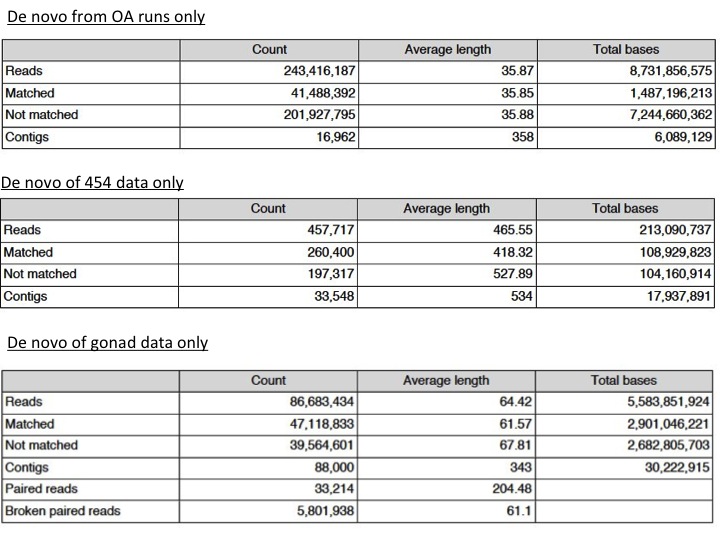
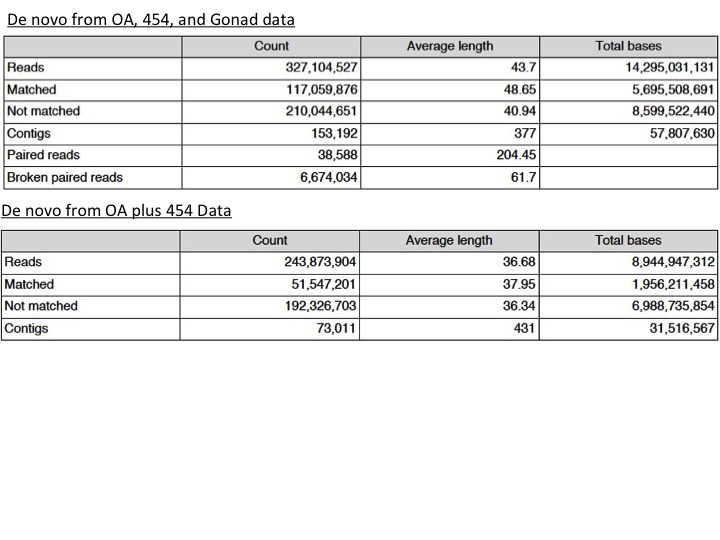
Currently working on reference assemblies of OA data back to de novo consensus sequences from the OA+454 de novo, OA+gonad de novo, and OA+454+gonad de novo before drawing conclusions...results will probably not come back until tomorrow.
October 3, 2011
Started Running the following assemblies:
1. De novo of all illumina gonad sequences
2. Denovo of OA illumina, gonad illumina, and 454 (so bascially all NGS data available for manila clams)
3. Backbone assembly using consensus contigs from 454 as backbone and mapping OA illumina data onto that
Other things to try
1. Using gonad illumina data as backbone and assembling OA illumina data onto that (need to wait for de novo of gonad data to finish first!)
Summary of my illumina data de novo 9/28/1022
Total number of contigs = 16,962
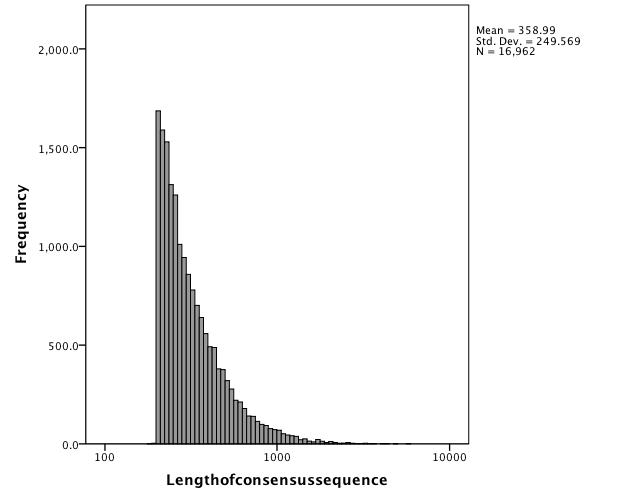
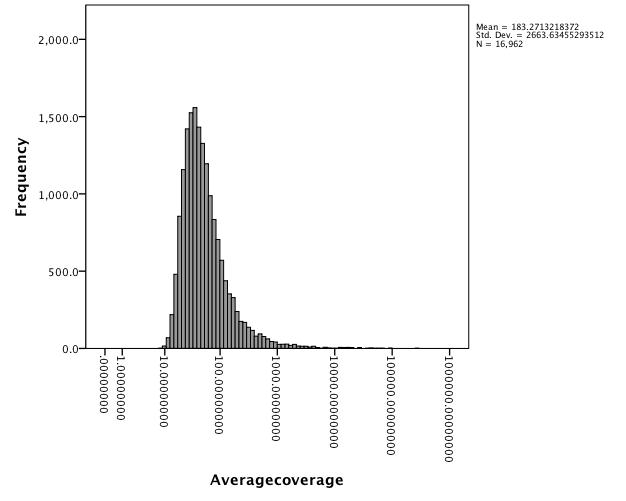
Converted illumina .sra files downloaded on 9/28/11 to .fastq files using the following terminal code:
purplepelican:sratoolkit.2.1.6-mac32 srlab$ ./fastq-dump -A SRR281065 --split-spot /Volumes/bass/Dave/Gonads/SRR281065/SRR281065.sra -O /Volumes/bass/Dave/Gonads
Translation of code:
(location of sra toolkit) (./(name of toolkit)) (-A=accession) (name of file) (split spot command for paired end reads) (location of .sra file) (-O = output) (Desired output file destination)
For more information visit guide on NCBI webiste
Converted .sra --> .fastq files were then imported onto CLC server and trimmed.
Note: Steven converted the 454 data using sff-dump (for 454) instead of fastq (for illumina) and uploaded to CLC. See his notebook for details.
September 28, 2011
OA Clam NGS data is here!!
Steven beat me to the punch of doing the trimming on the reads but you can see his full report and a summary of #reads etc.. here.
Started de novo assembly with the following parameters using the trimmed files from the 1000ppm and 400ppm data combined:
Add conflict annotations = No
Conflict resolution = Vote
Create Contigs = Yes
Create list of un-mapped reads = No
Create Report = No
Match mode = random
Minimum contig length = 200
Limit = 8
Mismatch cost = 2
Alignment = ungapped
Global alignment = No
Color space alignment = Yes
Color error cost = 3
Downloaded SRA files from two other Manila Clam Transcriptome studies. Once files are downloaded and converted, will use these to do other de novo assembly to, hopefully, get better/longer contigs/annotations.
454 data from DG and Gill Tissue of //R.phillipinarum// was downloaded from this study.
Clam gonad NGS data downloadad from this study
Note: This appears to be unpublished data
Directions for converting SRA files can be found here.
Note: purple pelican requires the 32 bit version of sra toolkit.
September 27, 2011
Emma took spec pH samples from experimental jars in the morning BEFORE their morning feeding.
Summary of spec pH results:
pH in ALL oyster jars dropped below 7.0 (all were closer to pH 6.8).
pH in clams jars appears to be holding. Jars with 5 clams held a pH consistent with control jars. Jars with 10 clams appears to decrease pH slightly but no where near as much as oysters.
Afternoon: Spec pH and Alkalinity samples were taken from a subset of jars in both beer bottles (for us and forestry) and "PMEL" bottles (for us). We will process one set of beer bottles and all PMEL bottles to compare the two systems directly. Beer bottles will also be sent of forestry to assess the quality of data we get back form them by comparing with our own readings.
Conclusions ?: It may be impossible to do proper experiments with oysters in static jars since they appear to have dramatic effects on pH. However, it is unclear if it is the presence of the oysters that is is dropping the pH or the act of feeding the oysters. To determine which is the cause, I only fed REP 1 jars for both clams and oysters around 7pm before going home. REP 2 jars have not received a meal since having their water changed this afternoon. So in addition to animal density and pCO2 differences, we will also be comparing feeding vs no feeding tomorrow.
September 26, 2011
Starting "new" notebook since last one became too large to edit.
Pumped water from garbage cans back into OA holding.
Pumped water directly from truck into garbage cans. Truck water is from Muk and should have a higher pH. Added 4 airstones to one of the garbage cans and started bubbling pure CO2 around 1pm.
2000ppm CO2 gas and CO2 free gas was bubbled into garbage cans full of filtered sea water starting saturday morning september 24th. As of Monday morning, September, 26th, pH of seawater has not changed. Will meet with OA crew about how to proceed.
Catching up on notebooking:
Click here for a link regarding clam and oyster feeding for juvenile trials...
September 13, 2011
Fed clams and oysters at 4:00pm. spreadsheet
Worked up qPCR data a bit more. Have not done statistics yet. Concerned that actin may be influenced by OA. See paper. Will need to test this and if actin changes with treatments will need to normalize to RNA for now...hopefully NGS will dig up some valid housekeeping genes.
September 12, 2011
FINALLY finished processing images of clam larvae from OA experiment for size analysis. Excel sheet is here.
Graphically summary of size analysis +/- SE
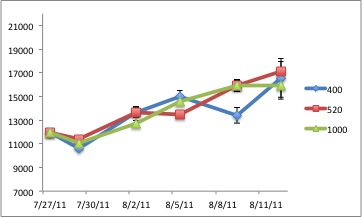
Submitted qPCR data to pcrminer for analysis.
September 11, 2011
Worked more on measure clam larvae using ImageJ
Set up qPCR for actin, GPx, and Thioredoxin
September 9, 2011
Clam OA seed experiment
Emma and I drove to Ballard to pick up algae and juvenile clams for the preliminary HS/OA trial. Oyster's were put at 18C to acclimate for 2 weeks (until we get back from PCSGA).
Clams (and oysters) will be fed twice daily at a concentration of 60,000 cells/ml
At the moment, we are going to try draining the round tank that they are being held in into another reservoir and then add back a known volume with algae. Once algae is cleared, the water that was pumped into the reservoir will be pumped back into the round tank....this should reduce the amount of algae we burn through as well as minimize seawater waste.
September 7, 2011
Extracted RNA from OA clams for NGS using tri reagent. Extracted samples consisted of whole jars of larvae (~30,000).
Samples were resuspended in 90ul of water.
| Sample ID |
User ID |
Date |
Time |
ng/ul |
A260 |
A280 |
260/280 |
260/230 |
Constant |
Cursor Pos. |
Cursor abs. |
340 raw |
| 1C3 |
Default |
9/7/11 |
1:25 PM |
1533.97 |
38.349 |
19.014 |
2.02 |
1.17 |
40 |
230 |
32.847 |
3.625 |
| 1C4 |
Default |
9/7/11 |
1:26 PM |
783.22 |
19.58 |
9.288 |
2.11 |
1.92 |
40 |
230 |
10.212 |
0.475 |
| 4C1 |
Default |
9/7/11 |
1:26 PM |
913.96 |
22.849 |
11.638 |
1.96 |
1.02 |
40 |
230 |
22.505 |
3.874 |
| 4C3 |
Default |
9/7/11 |
1:27 PM |
791.61 |
19.79 |
9.536 |
2.08 |
1.48 |
40 |
230 |
13.385 |
1.403 |
Pooled equal quantities (20ug) of 1C3/1C4 and 4C1/4C3. Need 100ng mRNA at the VERY least. Assuming 1% recovery of mRNA from total RNA that means at the very least I should send 10ug. To be very conservative I'm shooting for a total RNA value of 40ug RNA/treatment. This should yield 400ng mRNA
1C3: 13ul (1000ppm)
1C4: 25.5ul (1000ppm)
4C1: 22ul (400ppm)
4C3: 25ul (400ppm)
Spec samples again to determine final concentration of pooled samples to send for sequencing.
| Sample ID |
User ID |
Date |
Time |
ng/ul |
A260 |
A280 |
260/280 |
260/230 |
Constant |
Cursor Pos. |
Cursor abs. |
340 raw |
| 400ppm |
Default |
9/7/11 |
4:01 PM |
848.93 |
21.223 |
10.514 |
2.02 |
1.21 |
40 |
230 |
17.471 |
2.128 |
| 1000ppm |
Default |
9/7/11 |
4:02 PM |
1099.54 |
27.489 |
13.433 |
2.05 |
1.42 |
40 |
230 |
19.414 |
1.385 |
August 25, 2011
The primers arrived!!
Set up qPCR assays for ALL primer pairs. Ran all samples in duplicate. Used PCR miner to calculate PCR efficiency. Normalized to beta-actin.
August 23, 2011
DNase treated RNA samples from August 22nd, 2011
Final volume of samples = 50ul
Set up RT reaction as follows
| Sample ID |
User ID |
Date |
Time |
ng/ul |
.5ug |
| Day 0 DNase |
Default |
8/23/11 |
11:42 AM |
216.99 |
2.304253652 |
| 1C1 7/29 DNase |
Default |
8/23/11 |
11:42 AM |
34.53 |
14.48016218 |
| 1C4 8/5 DNase |
Default |
8/23/11 |
11:43 AM |
18.48 |
27.05627706 |
| 4C3 7/29 DNase |
Default |
8/23/11 |
11:43 AM |
34.05 |
14.68428781 |
| 4C2 8/5 DNase |
Default |
8/23/11 |
11:44 AM |
12.78 |
39.12363067 |
| buffer |
5 |
||||
| dntp |
5 |
||||
| RT |
1 |
||||
| water |
0 |
August 22, 2011
Extracted RNA from clam larvae sampled on 7/29 and 8/5 using TriReagent. Only exctracted one sample from each date of the 400ppm and 1000ppm treatment as a preliminary test to see if A) I can get enough RNA to do qPCR, and B) if the qPCR assays actually work.
Notes: Spun samples at 1500 x g for 1min at 4C to collect larvae at bottom of tube before removing sea water and adding TriReagent.
August 19, 2011
Jar pH for Clam OA experiment Trial1
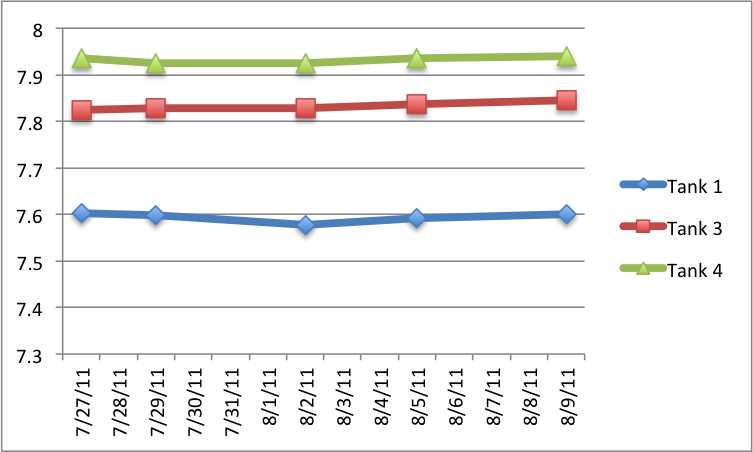
Clam OA trail1 percent survival by jar
Numbers represent percent survival by individual jars of the initial total count.
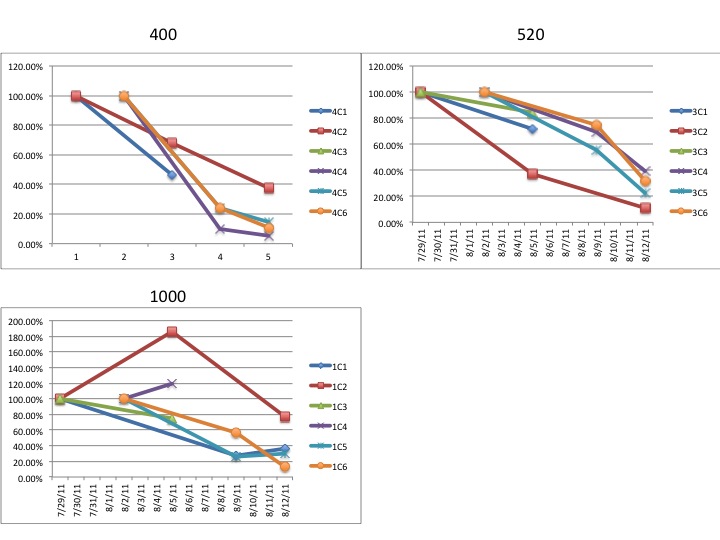
Below is another way of looking at changing densities.
To generate these graphs I subtracted the total larval counts for each jar from the previous sampling date to get an overall change in larval abundance. Initial thought is that it looks kind of messy but maybe that's just the data and not the presentation format.
Since jars were sampled on different dates along the way, what I would hope to see are lines that overlap when sampled on the same day or lines that are parallel (such as 4c1 and 4c6 in the 400 treatment, 1C3 and 1C6 in the 1000 treatment, or 3C3, 3C4, 3C5, and 3C6...possibly 3C1 as well...in the 520 treatment.)
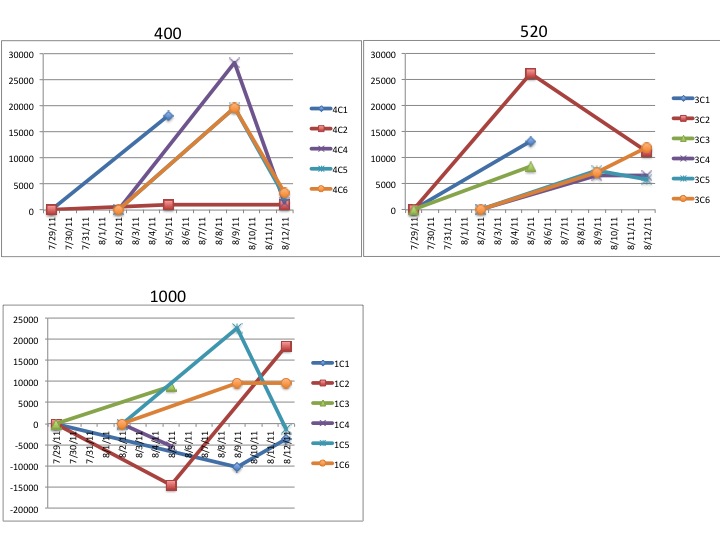
Next, I took the numbers generated above and expressed them as a percent change compared to the previously recorded total values. My thought was that this should allow for a more direct comparison between jars and eliminate the variability of initial densities or differences mortalities between jars.
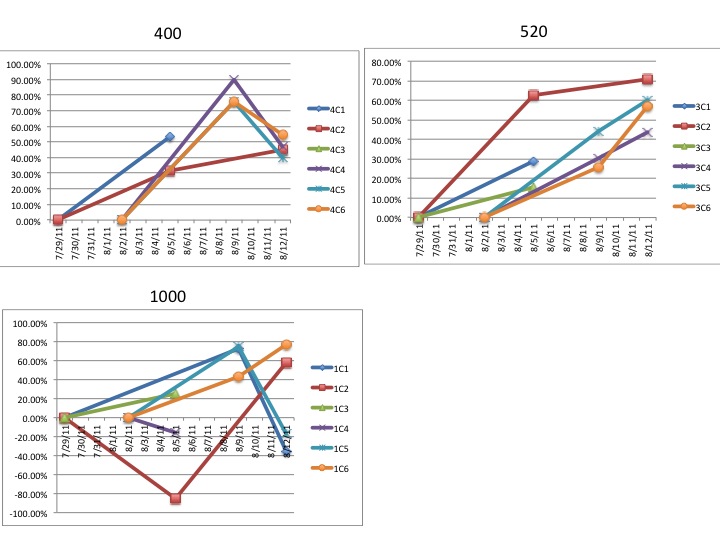
August 18, 2011
Entered mortality data from Clam OA trial into excel.
Below is a graph of survivorship for the three treatments.
To create the graph I first averaged the total counts and total live counts for the individual jar replicates to come up with a single number for each jar.
I then averaged the total counts and total jar counts for each jar from each treatment to give me a single value for each treatment on each sampling day.
I then calculated the percent survival by dividing the total live/total counts for each treatment.
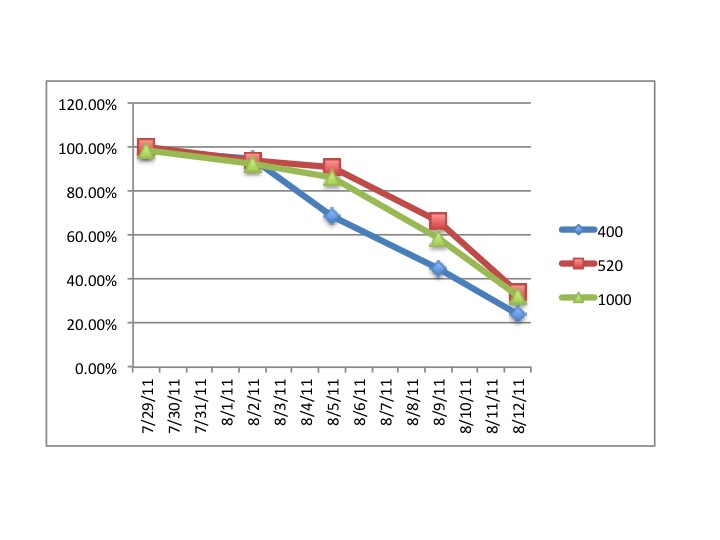
Below is are "density" graphs for each jar from each treatment.
To generate these numbers I divided the total counts for each jar and divided by the total volume for each aliquot to come up with a density/ul and then multiplied by 4500 (the ul that each jar was resuspended in to sample).
Note: These are the TOTAL densities and includes by live and dead larvae.
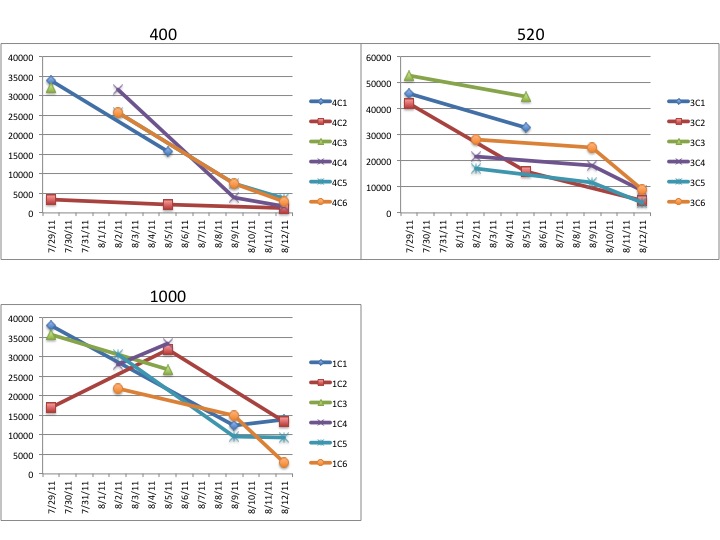
July 29, 2011
Clam OA sampling
Took genomics samples (~1500) larvae, 2 wells of 3x 25ul aliquots for counts (~50/well) from 1C1, 1C3, 1C4, 3C1, 3C3, 3C4, 4C1, 4C3, and 4C4
Spec pH was done on jars 1C1, 3C1, and 4C1.
July 28, 2011
Picked up algae from nate
2 species...Iso and ?
Algae was taken to NOAA where it was split, counted, and hooked up to feeders.
(need to contact Sarah for more detailed feeding protocol)
July 27, 2011
1st day of clam OA experiment.
Manilla clam larvae arrived today from Hawaii. Were shipped priority overnight.
Clams were spawned fertilized July 21st, 2011
Total estimated larvae shipped = 1 million, 5 day old larvae
Larvae were rinsed from mesh into 250ml seawater pCO2 = 400ppm.
Total estimated recovered larvae based on counts = 875,000
Density of larvae in 250ml = 3,500/ml
Aliquot 14ml to each jar (two 7ml aliquots were distributed) = 48,600 larvae/jar.... or ~45,000 as a ballpark estimate.
3 samples of 5000 larvae each were taken for genomics.
-samples were left in seawater and snap frozen in LN2
3 samples of 5000 larvae each were taken for genetics.
-samples were left in seawater and snap frozen in LN2
July 22, 2011
Exciting find of the day...
MyD88!
Awhile ago when I first started playing with DAVID, my initial observations were just by scrolling though the data and it looked like the NFkB/Toll receptor pathway might be something of interest. In particular was the identification of MyD88.
Upon further analysis of enriched GO terms and their associated genes, these initial observations appear to be confirmed! In addition, the annotated contrig from the RNAseq data contains part of the MyD88 death domain....check it out!

MyD88 sequence alignments are to human, mouse, and tongue sole.
Other players that appear in this pathway and were also identified by DAVID are NFkB p105, TRAF3, Tradd...
July 19, 2011
Generating figures for enriched GO terms using DAVID outputs in REViGO
In DAVID
-Imported swissprot IDs for BARNS values with 2 fold or higher over MASH, P <0.05, and E-values <0.01
-Converted list of swissport IDs to DAVID
-Selected "gene ontology" from list of annotation summary results (directions can be found here)
-Selected and saved .txt files for individual GO_Fat terms.
Note: Also ran Bonferroni and Fold change under "options"
In REViGO
-open .txt in excel and isolate GO ID's using "text to columns" function under data tab. Isolate GO ID by designating "~" as the delimiter.
- Copy and paste GO terms and p-values from DAVID into REViGO
looks something like this...
%
GO ID p Value
GO:00134 0.00821
etc.. etc..
-Run REViGO
- Selected "log10 pvalue" so that size of circle illustrates significance (larger is better)
- Displayed all terms and rearranged to so they do not overlap
-Also displayed interactive report and moved circles so they fit into one field of view.
Summary of output for all GO categories:
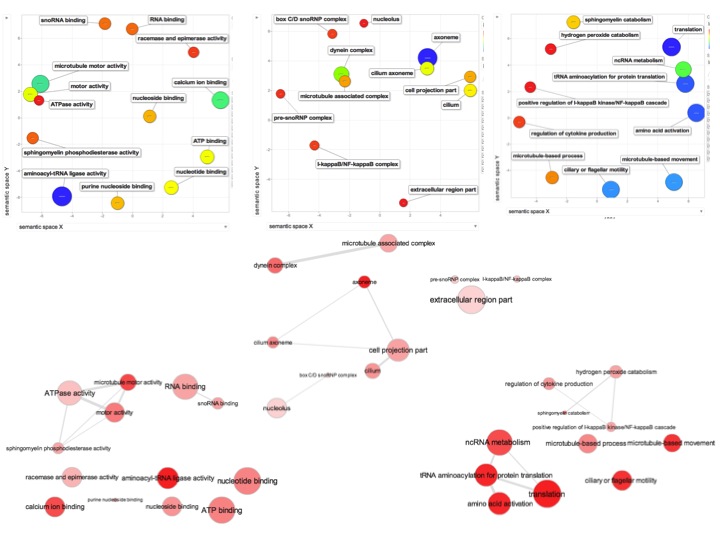
And here's a remake of the biological process pie chart in Excel instead of SPSS so that it's actually legible.
-Duplicate GO terms were removed as well as all "other etc." GO terms.
- Includes all contigs with an E-value<0.01
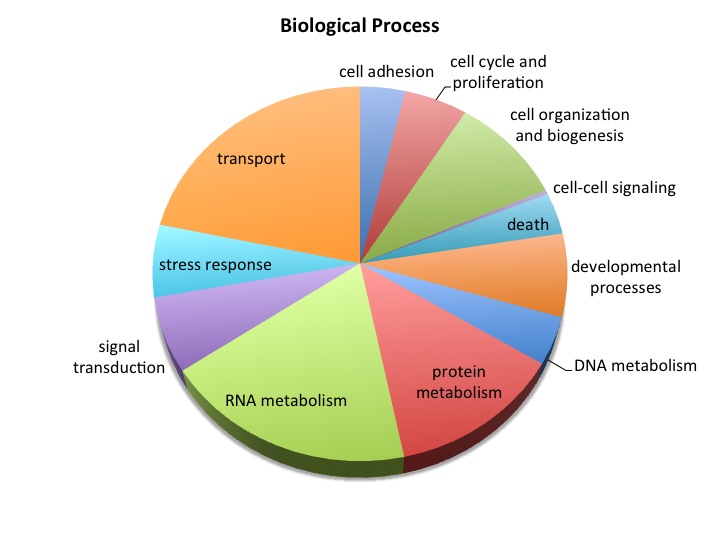
July 12, 2011
Back to the basics.
Working on wrapping up summary of basic NGS results....# reads, coverage, etc. for basic transcriptome characterization.
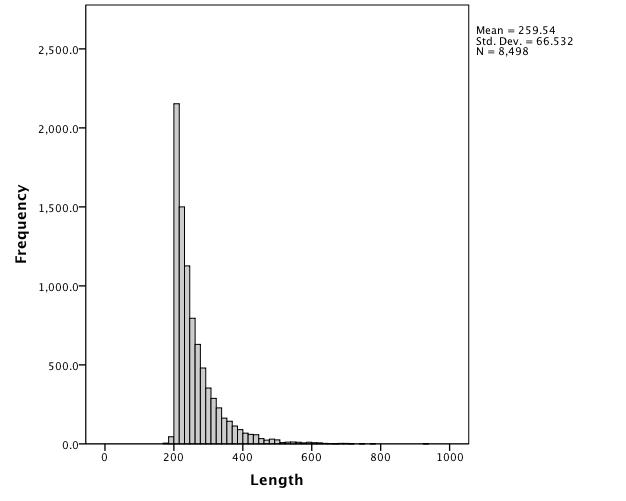
July 8, 2011
Working my way thought cytoscape
Managed to upload a test file and complete the PiNGO tutorial to identify unannotated candidate genes associated with you biological process of interest
Output looks something like this...
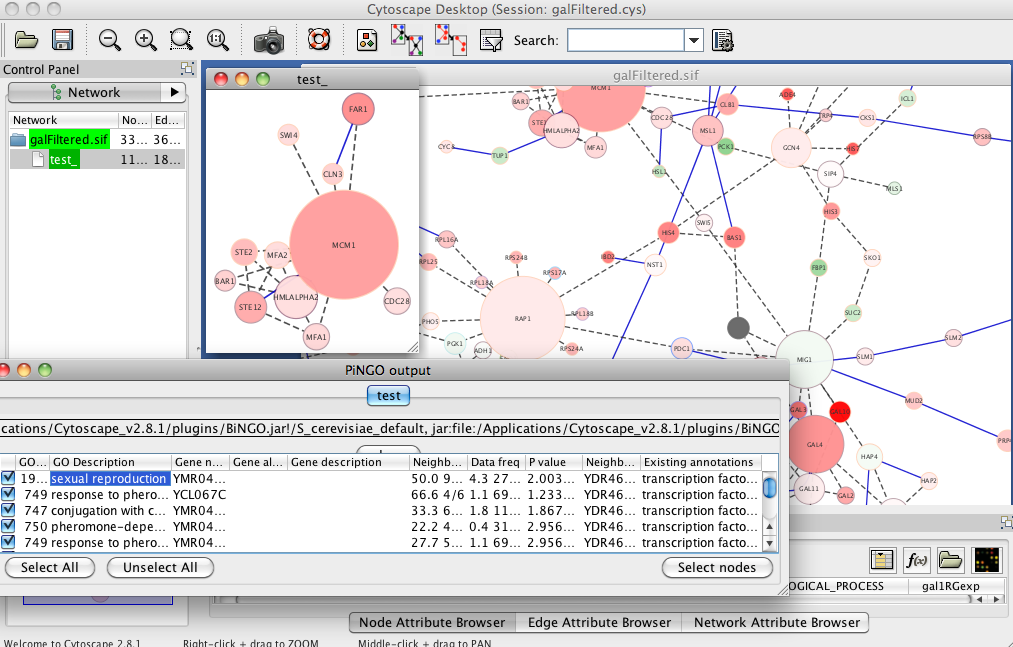
Now if I can just get my RNAseq data to upload to cytoscape...
July 6, 2011
More RNAseq
Playing around with REViGO, a GO ontology visualization tool.
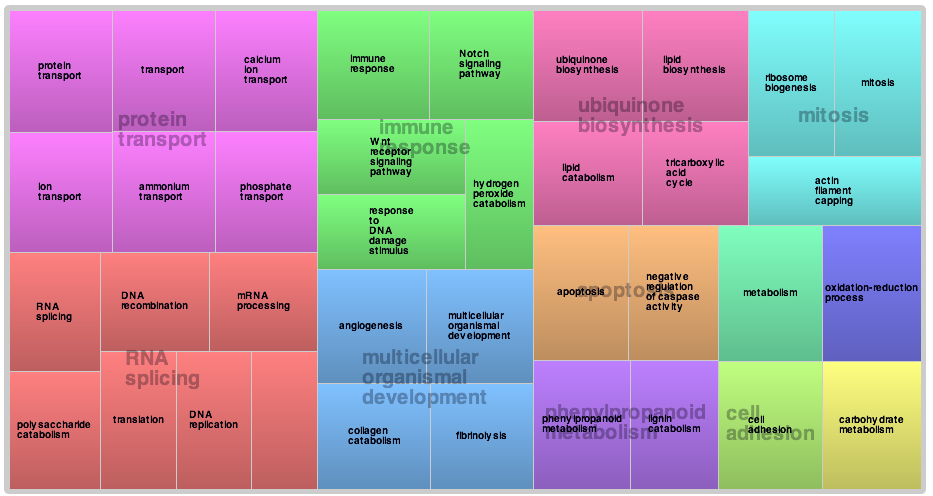
Also playing around with Bio4j but havent had much luck. Cant get past GO frequencies to construct visualization
Both appear to have a limit for maximum number of entries. For REViGO I could only submit >2fold changes in Barnstable.
July 5, 2011
Playing around with DAVID Bioinformatic Database
Submitted list of SP ID genes significantly "annotated" (e<.01) and differentially regulated by 2 fold or more to database.
Ran "Functional Annotation Clustering" with high stringency and received an ouput of 29 different gene clusters. 94 submissions were not clustered.
.txt summary of output can be found here.
Green boxes designate shared pathways. In online output, you can scroll over individual boxes to see which pathways they are associated with.
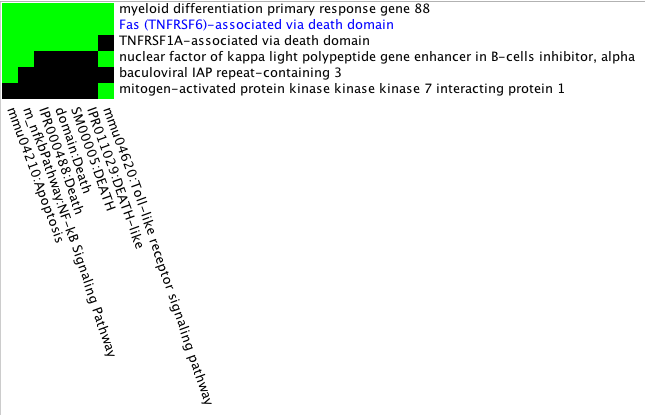
You can also click on the individual pathway which directs you to a graphical representation of the pathway. The positions of genes submitted in my list are highlighted by red stars.
Ex: NfKb pathway. Could also have done Toll-like receptor signaling among others.
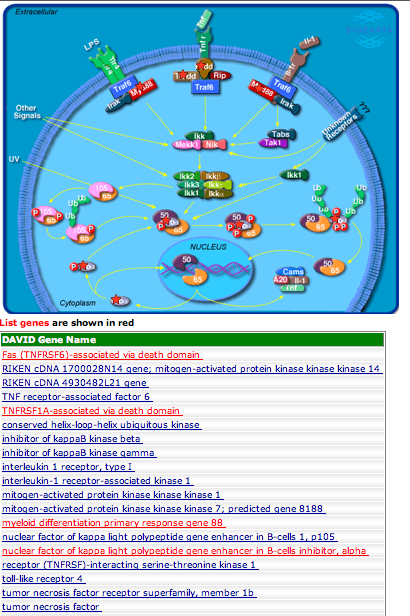
Wanted to identify other members of the above pathway that are not transcriptionally regulated.
Submitted new list of SPID that contain all significantly annotated genes. Could not include other identifiers because the addition of un annotated or genes not significant exceeds the 2000 gene limit of DAVID.
Found a few more!
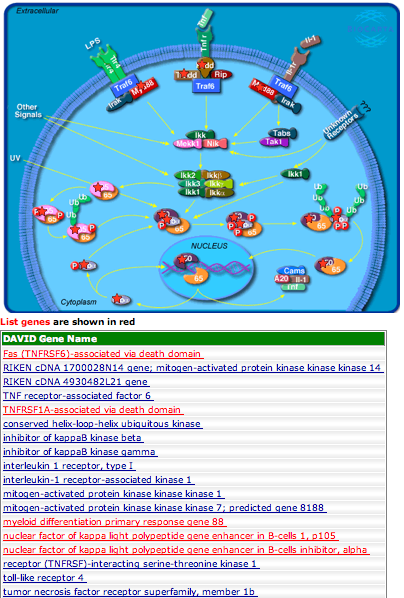
June 17, 2011
More RNAseq analysis
Compiled all piecharts and scatterplots into single ppt. doc that can be found here.
Two quick observations:
1. ~50% of the contigs are unannotated
2. There appears to be a lot more happening in the barnstable clams, however, it's hard to say for sure since so many of the contigs are not annotated.
Need to go through what some of the more interesting GO terms are and see what the individual gene are all about.
June 16, 2011
Finished plumbing gas lines for designer gas system in the basement.
Only thing still left in limbo is installing the freshly cleaned filters, filling resevoir with water for bubbling, and removing jars from freshwater soak. Nothing will really happen with these loose ends until I receive confirmation that we have larvae on the way since the filters should be stored dried, I have no way of storing bubbled water and that would be a waste of gas, and there's no harm in soaking the jars longer.
Clam RNAseq analysis (more piecharts and scatterplots)!
Not sure the best way to keep track of this type of data analysis so I'll try just listing off what I do and linking every file I make along the way.
Note: All files were generated independent of what Steven has done so the Contig#'s and completely different!
1. Ran RNAseq experiment with Barnstable as 1st variable and Mashpee as second variable. Assuming this translates as Barnstable vs. Mashpee
2. Combined RNAseq experiment file with the following 3 GO files in Galaxy to generate Go annotation file.
3. Removed duplicate Contig/Go_slim terms here.
4. Removed all non significant contigs here.
5. Next I divided the dataset according to GO Category and made separate file that contained significant contigs only.
Cell Function
Cell Function Significant Contigs only
Cell Process
Cell Process Significant Contigs only
Cell Component
Cell Component Significant Contigs only
All files contain column that further divides contigs into the following categories:
Not Annotated (E-value >0.01)
Not Significant (P>0.05)
Significant
2 Fold Change (+ or -) (2<x<4)
4 Fold Change (+ or -) (x>4)
For clarification, designations are listed in ascending order of specificity. In otherwords, everything not designated as "not annotated" is annotated, everything"not significant" is significant, things considered significant are not 2 or 4 fold, all 2 or 4 fold changes are significant.
5. Generated data files with increased stringency based on GO category.
Cell Function Significant and Annotated
Cell Function Significant, Annotated, and 2 Fold or Higher
Cell Process Significant and Annotated
Cell Process Significant, Annotated, and 2 Fold or Higher
Cell Component Significant and Annotated
Cell Component Significant, Annotated, and 2 Fold or Higher
In order to generate pie charts by GO_Slim term I had to generate files in which all contigs that were not considered annotated has "not annotated" in place of their GO_slim term.
Cell Function with not annotated replacement
Cell Process with not annotated replacement
Cell Component with not annotated replacement
6. Now going to generate logs of pie charts and scatter plots to try and tease out some patterns from the data.
June 15, 2011
Building designer gas system in the basement
Rumor has it that the conditions are prime for abalone spawning at Muk which means I need to crank construction of the system into hight gear.
Everything is finished except the following:
I tried filling a bin with seawater to prep it for bubbling but when i turned the pump on the water came out smelling like sulfur. I have since rinsed the filters in bortex and they are drying in the basement. I will get that system set up tomorrow morning once the filters have dried. The bins are ready to go, just need to plum in the gas lines which is a few simple cuts of some tubing and we should be all set. Jars are still soaking, I will leave those until tomorrow afternoon at the earliest. If no larvae I'll continue to let them soak.
Waiting for Elene and Brent to replace some part on the other regulator for the gas tanks.
June 14, 2011
OA system update:
I spent the morning driving around town tracking down totes to use for some designer gas experiments. I ended up purchasing 6 of the following 63L totes from "The Container Store" in bellevue.
After messing around in the basement for awhile, I managed to fit 6 of the 4.5L pretzel beakers into one of these totes. 4.5L jars are the same as those used at the NOAA facility. Six of these jars is the maximum that can fit the length of the totes, but there is still ~1in of space in the height, so it is possible to fit a larger jar but this would require a bit of searching around.
From an experimental design standpoint, we would need to set up two totes minimum for each pCO2 treatment. This would provide a total of 54L for each treatment. If we pack 2,000 larvae/liter that would give us 12,000 larvae/jar and 108,000 total larvae/ treatment.
June 13, 2011
More M.merc qPCR graphs
Because the relative expression values for graphs generated on June 10, 2011 look very suspicious (everything is down in Vt and too many values are identical to Actin....just doesnt seem right), I have gone back and used the generic equation to calculate relative expression values and normalized to Actin.
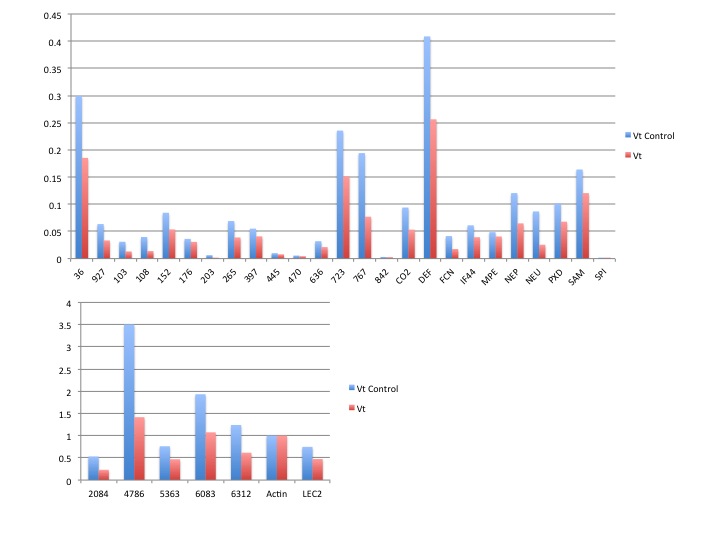
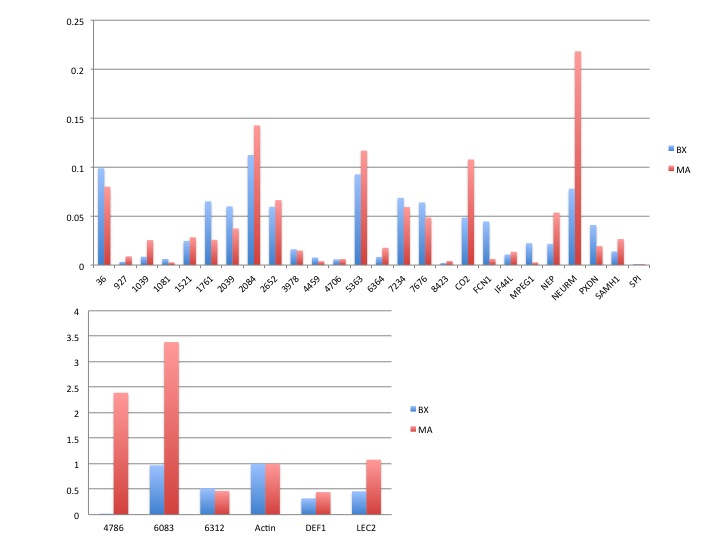
Note: I had to break the assays into multiple graphs because the scale of some dwarfed the others...
June 10, 2011
Results from M.merc qPCR primer test June 9, 2011
Relative expression values were calculated using deltaCq method in CFX manager software followed by normalization to Actin.
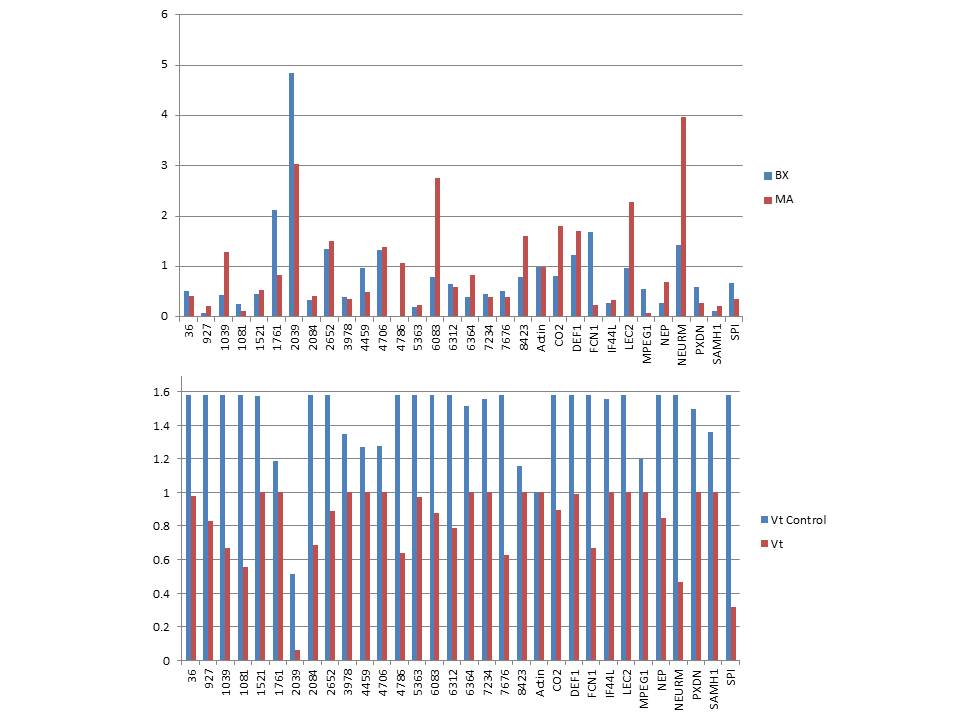
June 9, 2011
Testing primers for M.merc that appear to work based initial screening done by both Sam and me ( June 3, 2011).
Pooled equal volumes of cDNA to create the following 4 pools of cDNA templates.
BX (contains all samples from June and August)
MA (contains all samples from June and August)
Vt control (contains all control samples from Vt exposure exp)
Vt (contains all samples from challenge group of Vt exposure exp)
qPCR data file and plate map can be found here, here, and here.
1st link = full plate
2nd link = 2nd plate with remaining primers
3rd link = actin and serine protease inhibitor because I forgot to add them on the 2nd plate.
June 3, 2011
Testing primers from M.merc/QPX analysis
Used 2ul pooled template cDNA from May 26, 2011
Plate map: Names correspond to primer pair used.
| 1 |
2 |
3 |
4 |
|
| A |
MPEG |
MPEG |
NERM |
NERM |
| B |
AMPN |
AMPN |
DEF1 |
DEF1 |
| C |
LEC2 |
LEC2 |
SAMH1 |
SAMH1 |
| D |
NEP |
NEP |
FCN-1 |
FCN-1 |
| E |
APLY |
APLY |
PXDN |
PXDN |
| F |
OXLA |
OXLA |
NTC |
NTC |
| G |
IF44L |
IF44L |
NTC |
NTC |
| H |
CO2 |
CO2 |
NTC |
NTC |
Overall the test looks really good
Primers that did not amplify:
AMPN
Primers with multiple/fat melting curve peaks:
APLY
OXLA
SAMH1? (is probably ok)
Ct was <30 ("high expression")
DEF1
LEC2
Ct was 30-35
MPEG
NEP
PXDN
CO2
Ct was >35
NERM
SAMH1
FCN-1
IF44L
May 26, 2011
Primers designed on May 12, 2011 were reconstituted at 100uM and filed in the primer stocks log Box#9
Made cDNA from DNased M.merc RNA for the QPX project for future use to test genes identified from NGS analysis.
RT Rxn was carried out in a 96 well plate to make future qPCR template loading easier.
Plate map of cDNA is as follows.
| 5 |
6 |
7 |
8 |
9 |
|
| A |
BX 1-3 |
MA 1-3 |
BX 1-1 |
MA 1-1 |
BX 3-2 |
| B |
BX 1-4 |
MA 1-5 |
BX 1-2 |
MA 1-4 |
MA 1-4 |
| C |
BX 2-2 |
MA 2-4 |
BX 2-1 |
MA 2-1 |
BX 4-1 |
| D |
BX 2-3 |
MA 2-5 |
BX 2-2 |
MA 2-2 |
BX 4-2 |
| E |
BX 3-2 |
MA 3-3 |
BX 3-2 |
MA 3-1 |
MA 4-1 |
| F |
BX 3-3 |
MA 3-4 |
BX 3-3 |
MA 3-2 |
MA 4-2 |
| G |
BX 4-1 |
MA 4-3 |
BX 4-1 |
MA 4-1 |
NTC |
| H |
BX 4-2 |
MA 4-4 |
BX 4-2 |
MA 4-2 |
NTC |
| 6/24/10 |
9/2/10 |
||||
Notes: A9 & B9 were pooled and diluted 1:2 to be used as template from primer testing
C9, D9, E9, & F9 will be pooled and used to make the standard curve.
My first pie chart...
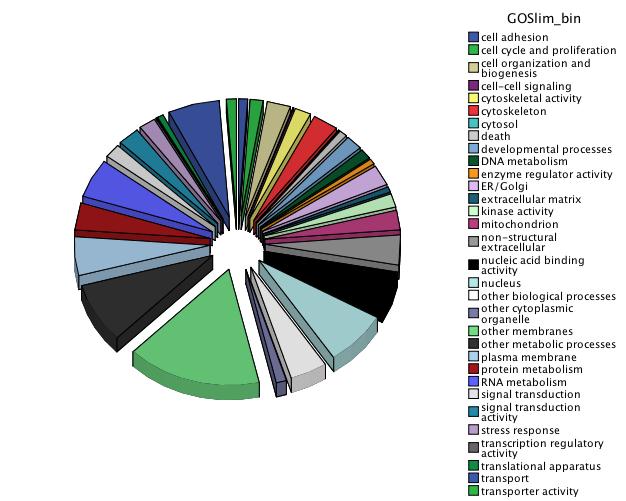
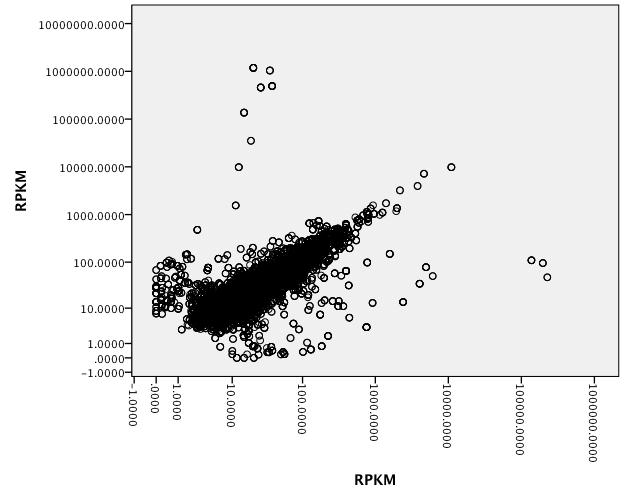
May 18, 2011
DNased hard RNA samples from March, 17 2011 (these are the same samples used to make the libraries)
Note:
Not enough of MA 1-2 or BX 3-1 samples remained after pooling for library so I extracted RNA from MA 1-4 and BX 3-3 to replace.
May 17, 2011
DNased hard clam RNA samples extracted on May 13, 2011
| Sample ID |
User ID |
Date |
Time |
ng/ul |
A260 |
A280 |
260/280 |
260/230 |
Constant |
Cursor Pos. |
Cursor abs. |
340 raw |
| DNased CA 1 |
Default |
5/17/2011 |
2:19 PM |
148.6 |
3.715 |
1.872 |
1.98 |
1.59 |
40 |
230 |
2.332 |
-0.021 |
| DNased CA 2 |
Default |
5/17/2011 |
2:20 PM |
203.35 |
5.084 |
2.583 |
1.97 |
1.64 |
40 |
230 |
3.094 |
0.016 |
| DNased CA 3 |
Default |
5/17/2011 |
2:20 PM |
150.92 |
3.773 |
1.902 |
1.98 |
1.62 |
40 |
230 |
2.326 |
-0.005 |
| DNased CA 4 |
Default |
5/17/2011 |
2:21 PM |
170.06 |
4.252 |
2.138 |
1.99 |
1.42 |
40 |
230 |
2.999 |
-0.009 |
| DNased CA 5 |
Default |
5/17/2011 |
2:21 PM |
168.13 |
4.203 |
2.111 |
1.99 |
1.63 |
40 |
230 |
2.58 |
-0.004 |
| DNased CA 6 |
Default |
5/17/2011 |
2:22 PM |
173.49 |
4.337 |
2.215 |
1.96 |
1.45 |
40 |
230 |
3.001 |
-0.019 |
| DNased CA 7 |
Default |
5/17/2011 |
2:22 PM |
147.72 |
3.693 |
1.888 |
1.96 |
1.51 |
40 |
230 |
2.441 |
-0.001 |
| DNased CA 8 |
Default |
5/17/2011 |
2:23 PM |
113.92 |
2.848 |
1.491 |
1.91 |
1.16 |
40 |
230 |
2.453 |
-0.025 |
| DNased MA 1 |
Default |
5/17/2011 |
2:23 PM |
143.83 |
3.596 |
1.808 |
1.99 |
1.59 |
40 |
230 |
2.261 |
-0.003 |
| DNased MA 2 |
Default |
5/17/2011 |
2:24 PM |
154.62 |
3.865 |
1.93 |
2 |
1.67 |
40 |
230 |
2.319 |
-0.009 |
| DNased MA 3 |
Default |
5/17/2011 |
2:24 PM |
64.12 |
1.603 |
0.846 |
1.89 |
0.92 |
40 |
230 |
1.739 |
0.108 |
| DNased MA 4 |
Default |
5/17/2011 |
2:25 PM |
153.87 |
3.847 |
1.954 |
1.97 |
1.26 |
40 |
230 |
3.063 |
-0.017 |
| DNased MA 5 |
Default |
5/17/2011 |
2:25 PM |
156.09 |
3.902 |
1.99 |
1.96 |
1.47 |
40 |
230 |
2.648 |
-0.007 |
| DNased MA 6 |
Default |
5/17/2011 |
2:25 PM |
110.01 |
2.75 |
1.437 |
1.91 |
1.06 |
40 |
230 |
2.598 |
0.26 |
| DNased MA 7 |
Default |
5/17/2011 |
2:26 PM |
152.52 |
3.813 |
1.929 |
1.98 |
1.57 |
40 |
230 |
2.432 |
-0.015 |
| DNased MA 8 |
Default |
5/17/2011 |
2:26 PM |
178.88 |
4.472 |
2.324 |
1.92 |
1.05 |
40 |
230 |
4.256 |
-0.017 |
| DNased MAX 1 |
Default |
5/17/2011 |
2:27 PM |
146.63 |
3.666 |
1.893 |
1.94 |
1.53 |
40 |
230 |
2.398 |
0.001 |
| DNased MAX 2 |
Default |
5/17/2011 |
2:27 PM |
168.77 |
4.219 |
2.154 |
1.96 |
1.68 |
40 |
230 |
2.513 |
0.013 |
| DNased MAX 3 |
Default |
5/17/2011 |
2:28 PM |
188.57 |
4.714 |
2.28 |
2.07 |
1.73 |
40 |
230 |
2.733 |
-0.001 |
| DNased MAX 4 |
Default |
5/17/2011 |
2:28 PM |
173.86 |
4.346 |
2.141 |
2.03 |
1.67 |
40 |
230 |
2.601 |
-0.007 |
| DNased MAX 5 |
Default |
5/17/2011 |
2:29 PM |
160.75 |
4.019 |
2.045 |
1.97 |
1.59 |
40 |
230 |
2.52 |
0.003 |
| DNased MAX 6 |
Default |
5/17/2011 |
2:29 PM |
149.21 |
3.73 |
1.893 |
1.97 |
1.32 |
40 |
230 |
2.828 |
0.043 |
| DNased MAX 7 |
Default |
5/17/2011 |
2:30 PM |
157.32 |
3.933 |
1.963 |
2 |
1.62 |
40 |
230 |
2.423 |
-0.002 |
| DNased MAX 8 |
Default |
5/17/2011 |
2:30 PM |
206.76 |
5.169 |
2.594 |
1.99 |
1.55 |
40 |
230 |
3.339 |
-0.003 |
May 13, 2011
Exctracted RNA from hard clam gill tissue Rec'd from NewJersey 6/24/2010
| Sample ID |
User ID |
Date |
Time |
ng/ul |
A260 |
A280 |
260/280 |
260/230 |
Constant |
Cursor Pos. |
Cursor abs. |
340 raw |
| CA 1 |
Default |
5/13/11 |
2:00 PM |
744.68 |
18.617 |
9.619 |
1.94 |
2.09 |
40 |
230 |
8.899 |
-0.008 |
| CA 2 |
Default |
5/13/11 |
2:01 PM |
1279.75 |
31.994 |
16.205 |
1.97 |
1.93 |
40 |
230 |
16.584 |
0.217 |
| CA 3 |
Default |
5/13/11 |
2:01 PM |
1494.8 |
37.37 |
18.918 |
1.98 |
2.12 |
40 |
230 |
17.614 |
0.05 |
| CA 4 |
Default |
5/13/11 |
2:02 PM |
708.33 |
17.708 |
9.026 |
1.96 |
1.79 |
40 |
230 |
9.88 |
0.055 |
| CA 5 |
Default |
5/13/11 |
2:02 PM |
872.5 |
21.812 |
11.188 |
1.95 |
2.05 |
40 |
230 |
10.657 |
0.049 |
| CA 6 |
Default |
5/13/11 |
2:03 PM |
909.03 |
22.726 |
11.609 |
1.96 |
1.77 |
40 |
230 |
12.821 |
0.027 |
| CA 7 |
Default |
5/13/11 |
2:03 PM |
1015.16 |
25.379 |
12.887 |
1.97 |
1.99 |
40 |
230 |
12.773 |
0.207 |
| CA 8 |
Default |
5/13/11 |
2:04 PM |
1935.36 |
48.384 |
24.691 |
1.96 |
1.65 |
40 |
230 |
29.263 |
0.293 |
| MA 1 |
Default |
5/13/11 |
2:04 PM |
1073.21 |
26.83 |
13.57 |
1.98 |
2.04 |
40 |
230 |
13.154 |
0.106 |
| MA 2 |
Default |
5/13/11 |
2:05 PM |
1216.03 |
30.401 |
15.245 |
1.99 |
2.12 |
40 |
230 |
14.343 |
0.125 |
| MA 3 |
Default |
5/13/11 |
2:05 PM |
131.84 |
3.296 |
1.811 |
1.82 |
1.31 |
40 |
230 |
2.526 |
0.264 |
| MA 4 |
Default |
5/13/11 |
2:06 PM |
563.15 |
14.079 |
7.283 |
1.93 |
1.54 |
40 |
230 |
9.149 |
0.062 |
| MA 5 |
Default |
5/13/11 |
2:06 PM |
589.22 |
14.73 |
7.606 |
1.94 |
1.84 |
40 |
230 |
8.011 |
0.043 |
| MA 6 |
Default |
5/13/11 |
2:07 PM |
230.71 |
5.768 |
3.176 |
1.82 |
1.36 |
40 |
230 |
4.245 |
0.691 |
| MA 7 |
Default |
5/13/11 |
2:07 PM |
636.32 |
15.908 |
8.202 |
1.94 |
2.04 |
40 |
230 |
7.807 |
0.049 |
| MA 8 |
Default |
5/13/11 |
2:08 PM |
808.22 |
20.206 |
10.4 |
1.94 |
1.13 |
40 |
230 |
17.907 |
0.081 |
| MAX 1 |
Default |
5/13/11 |
2:08 PM |
1532.95 |
38.324 |
19.456 |
1.97 |
2.03 |
40 |
230 |
18.851 |
0.224 |
| MAX 2 |
Default |
5/13/11 |
2:09 PM |
1608.46 |
40.212 |
20.41 |
1.97 |
2.12 |
40 |
230 |
18.98 |
0.246 |
| MAX 3 |
Default |
5/13/11 |
2:09 PM |
925.59 |
23.14 |
11.818 |
1.96 |
2.07 |
40 |
230 |
11.158 |
0.083 |
| MAX 4 |
Default |
5/13/11 |
2:09 PM |
881.42 |
22.035 |
11.394 |
1.93 |
2.1 |
40 |
230 |
10.479 |
0.131 |
| MAX 5 |
Default |
5/13/11 |
2:10 PM |
1096.15 |
27.404 |
14.031 |
1.95 |
1.94 |
40 |
230 |
14.148 |
0.244 |
| MAX 6 |
Default |
5/13/11 |
2:10 PM |
799.57 |
19.989 |
10.229 |
1.95 |
1.59 |
40 |
230 |
12.602 |
0.453 |
| MAX 7 |
Default |
5/13/11 |
2:11 PM |
894.79 |
22.37 |
11.442 |
1.96 |
2.15 |
40 |
230 |
10.392 |
0.198 |
| MAX 8 |
Default |
5/13/11 |
2:11 PM |
703.41 |
17.585 |
9.037 |
1.95 |
1.72 |
40 |
230 |
10.253 |
0.139 |
May 12, 2011
Ordered qPCR primers for the following hard clam genes.
SRID = 1315-1340
SRID for primers by Steven/Sam = 1233-1312
Note: I sorted back through them to eliminate ones that Steven had already identified as well as ones I didnt think would be quite as interesting anymore.
Final list
| FeatureID |
Fold Change (original values) |
evalue |
ID3 |
| ConsensusfromContig5346 |
120.76 |
2.00E-10 |
AMPN_BOVIN Aminopeptidase N OS=Bos taurus GN=ANPEP PE=2 SV=4 |
| ConsensusfromContig8045 |
6.967 |
4.00E-05 |
NEURM_APLCA Neuromacin-like protein OS=Aplysia californica PE=3 SV=1 |
| ConsensusfromContig5822 |
3.821 |
5.00E-16 |
IF44L_MOUSE Interferon-induced protein 44-like OS=Mus musculus GN=IFI44L PE=2 SV=2 |
| ConsensusfromContig6406 |
2.528 |
5.00E-04 |
NEP_PONAB Neprilysin OS=Pongo abelii GN=MME PE=2 SV=2 |
| ConsensusfromContig7255 |
2.218 |
1.00E-08 |
APLY_APLKU Aplysianin-A OS=Aplysia kurodai PE=1 SV=1 |
| ConsensusfromContig2773 |
2.074 |
5.00E-04 |
OXLA_DEMVE L-amino-acid oxidase OS=Demansia vestigiata PE=2 SV=1 |
| ConsensusfromContig4978 |
1.901 |
6.00E-20 |
TECR_BOVIN Trans-2,3-enoyl-CoA reductase OS=Bos taurus GN=TECR PE=2 SV=1 |
| ConsensusfromContig1643 |
1.592 |
4.00E-13 |
SAMH1_DANRE SAM domain and HD domain-containing protein 1 OS=Danio rerio GN=samhd1 PE=2 SV=2 |
| ConsensusfromContig4820 |
1.542 |
3.00E-04 |
DEF1_CRAVI Defensin-1 OS=Crassostrea virginica PE=1 SV=1 |
| ConsensusfromContig1178 |
1.51 |
6.00E-07 |
LEC2_SISCA C-type lectin isoform 2 OS=Sistrurus catenatus edwardsii PE=2 SV=1 |
| ConsensusfromContig3464 |
1.478 |
3.00E-04 |
CO2_HUMAN Complement C2 OS=Homo sapiens GN=C2 PE=1 SV=2 |
| ConsensusfromContig1063 |
-61.814 |
1.00E-05 |
MPEG1_BOVIN Macrophage-expressed gene 1 protein OS=Bos taurus GN=MPEG1 PE=2 SV=2 |
| ConsensusfromContig5239 |
-4.851 |
4.00E-08 |
FCN1_RAT Ficolin-1 OS=Rattus norvegicus GN=Fcn1 PE=2 SV=2 |
| ConsensusfromContig4755 |
-3.101 |
4.00E-09 |
PXDN_CAEEL Peroxidasin homolog OS=Caenorhabditis elegans GN=pxn-1 PE=1 SV=1 |
May 11, 2011
I spent the morning scrolling through the endless lines from the hard clam RNAseq excel sheet for qPCR candidates. Here are the results from my first pass through the data.
| FeatureID |
Fold Change (original values) |
evalue |
ID3 |
| ConsensusfromContig5346 |
120.76 |
2.00E-10 |
AMPN_BOVIN Aminopeptidase N OS=Bos taurus GN=ANPEP PE=2 SV=4 |
| ConsensusfromContig8045 |
6.967 |
4.00E-05 |
NEURM_APLCA Neuromacin-like protein OS=Aplysia californica PE=3 SV=1 |
| ConsensusfromContig7486 |
6.218 |
1.00E-09 |
CYTA_MOUSE Cystatin-A OS=Mus musculus GN=Csta PE=2 SV=1 |
| ConsensusfromContig7364 |
4.779 |
1.00E-06 |
COL12_CHICK Collectin-12 OS=Gallus gallus GN=COLEC12 PE=2 SV=1 |
| ConsensusfromContig5822 |
3.821 |
5.00E-16 |
IF44L_MOUSE Interferon-induced protein 44-like OS=Mus musculus GN=IFI44L PE=2 SV=2 |
| ConsensusfromContig4839 |
2.973 |
4.00E-11 |
LECH_CHICK Hepatic lectin OS=Gallus gallus PE=1 SV=1 |
| ConsensusfromContig4446 |
2.679 |
3.00E-20 |
DHSO_BOMMO Sorbitol dehydrogenase OS=Bombyx mori GN=SDH PE=2 SV=1 |
| ConsensusfromContig6406 |
2.528 |
5.00E-04 |
NEP_PONAB Neprilysin OS=Pongo abelii GN=MME PE=2 SV=2 |
| ConsensusfromContig983 |
2.366 |
1.00E-09 |
RN213_HUMAN RING finger protein 213 OS=Homo sapiens GN=RNF213 PE=1 SV=2 |
| ConsensusfromContig8423 |
2.342 |
2.00E-15 |
IAP_GVCP Apoptosis inhibitor IAP OS=Cydia pomonella granulosis virus GN=IAP PE=4 SV=1 |
| ConsensusfromContig6649 |
2.275 |
3.00E-04 |
COX2_HUMAN Cytochrome c oxidase subunit 2 OS=Homo sapiens GN=MT-CO2 PE=1 SV=1 |
| ConsensusfromContig6038 |
2.263 |
6.00E-15 |
CATL1_CHICK Cathepsin L1 (Fragments) OS=Gallus gallus GN=CTSL1 PE=1 SV=1 |
| ConsensusfromContig7255 |
2.218 |
1.00E-08 |
APLY_APLKU Aplysianin-A OS=Aplysia kurodai PE=1 SV=1 |
| ConsensusfromContig6312 |
2.209 |
2.00E-25 |
CATB_BOVIN Cathepsin B OS=Bos taurus GN=CTSB PE=1 SV=5 |
| ConsensusfromContig2773 |
2.074 |
5.00E-04 |
OXLA_DEMVE L-amino-acid oxidase OS=Demansia vestigiata PE=2 SV=1 |
| ConsensusfromContig7192 |
1.989 |
1.00E-41 |
PCKG_DROME Phosphoenolpyruvate carboxykinase [GTP] OS=Drosophila melanogaster GN=Pepck PE=2 SV=2 |
| ConsensusfromContig4978 |
1.901 |
6.00E-20 |
TECR_BOVIN Trans-2,3-enoyl-CoA reductase OS=Bos taurus GN=TECR PE=2 SV=1 |
| ConsensusfromContig5245 |
1.769 |
1.00E-08 |
MANA_MYTED Mannan endo-1,4-beta-mannosidase OS=Mytilus edulis PE=1 SV=1 |
| ConsensusfromContig3453 |
1.673 |
3.00E-07 |
DBNL_MOUSE Drebrin-like protein OS=Mus musculus GN=Dbnl PE=1 SV=2 |
| ConsensusfromContig1643 |
1.592 |
4.00E-13 |
SAMH1_DANRE SAM domain and HD domain-containing protein 1 OS=Danio rerio GN=samhd1 PE=2 SV=2 |
| ConsensusfromContig4820 |
1.542 |
3.00E-04 |
DEF1_CRAVI Defensin-1 OS=Crassostrea virginica PE=1 SV=1 |
| ConsensusfromContig1178 |
1.51 |
6.00E-07 |
LEC2_SISCA C-type lectin isoform 2 OS=Sistrurus catenatus edwardsii PE=2 SV=1 |
| ConsensusfromContig4480 |
1.496 |
2.00E-08 |
IAP1_DROME Apoptosis 1 inhibitor OS=Drosophila melanogaster GN=th PE=1 SV=2 |
| ConsensusfromContig3464 |
1.478 |
3.00E-04 |
CO2_HUMAN Complement C2 OS=Homo sapiens GN=C2 PE=1 SV=2 |
| ConsensusfromContig1063 |
-61.814 |
1.00E-05 |
MPEG1_BOVIN Macrophage-expressed gene 1 protein OS=Bos taurus GN=MPEG1 PE=2 SV=2 |
| ConsensusfromContig2830 |
-38.266 |
8.00E-07 |
IAP1_DROME Apoptosis 1 inhibitor OS=Drosophila melanogaster GN=th PE=1 SV=2 |
| ConsensusfromContig1092 |
-18.054 |
2.00E-07 |
LOXE3_MOUSE Epidermis-type lipoxygenase 3 OS=Mus musculus GN=Aloxe3 PE=2 SV=1 |
| ConsensusfromContig1081 |
-12.622 |
5.00E-09 |
IAP2_DROME Apoptosis 2 inhibitor OS=Drosophila melanogaster GN=Iap2 PE=2 SV=3 |
| ConsensusfromContig4706 |
-7.954 |
3.00E-31 |
TRAF3_HUMAN TNF receptor-associated factor 3 OS=Homo sapiens GN=TRAF3 PE=1 SV=2 |
| ConsensusfromContig5239 |
-4.851 |
4.00E-08 |
FCN1_RAT Ficolin-1 OS=Rattus norvegicus GN=Fcn1 PE=2 SV=2 |
| ConsensusfromContig137 |
-3.306 |
2.00E-12 |
PGRP_BOMMO Peptidoglycan recognition protein OS=Bombyx mori PE=1 SV=1 |
| ConsensusfromContig731 |
-3.264 |
3.00E-04 |
PXDN_CAEBR Peroxidasin homolog OS=Caenorhabditis briggsae GN=pxn-1 PE=3 SV=1 |
| ConsensusfromContig4755 |
-3.101 |
4.00E-09 |
PXDN_CAEEL Peroxidasin homolog OS=Caenorhabditis elegans GN=pxn-1 PE=1 SV=1 |
| ConsensusfromContig4065 |
-2.223 |
3.00E-28 |
CALX_CANFA Calnexin OS=Canis familiaris GN=CANX PE=1 SV=3 |
| ConsensusfromContig7234 |
-2.104 |
2.00E-35 |
SODC_CHICK Superoxide dismutase [Cu-Zn] OS=Gallus gallus GN=SOD1 PE=1 SV=3 |
May 10, 2011
Trying to construct a discussion for the C.gigas hsp70 situation and figure out the best way to explain what sequences are available, how to differentiate between hsc and hsp70 and what other people have already done...In doing so I've constructed a few alignments from the Kawabe2011 paper which are confusion.
Here they are!


Notes:
The Kawabe sequences are the qPCR primer sequences
AJ318882 is the hsp70 sequence from boutet
AB5449340 is the hsp70 sequence used to make the primers from the paper
AJ3035315 is the hsc71 sequence from boutet
What's confusing?
The hsc primer sequences align better with hsp from boutet, although i would be surprise if they are specific.
Their hsp primers appear to fall in the 5'UTR of their published sequence
May 5, 2011
hsp70 qPCR amplicon sequence analysis
Recap:
There are discrepancies in the literature regarding the true hsp70 sequence as well as what distinguishes hsp70 from hsc70. How that directly impacts what I"m doing is that I need definitive proof that what I'm measure via qPCR is indeed a single hsp70 sequence given the available data in genbank.
What did I do?
- Cloned the PCR products from the two sets of qPCR primers that I designed for hsp70. Each primer pair was designed using different sequences available in genbank.
-Sequenced 5 clones for each PCR product as well as directly sequencing the PCR products generated from genomic DNA.
Sequence analysis summary:
1. The product generated from the hsp70 1194 and 1195 primers only amplify the hsp70 corresponding to accession# AB122063. Good news that they are specific, however, this is no considered (at least from my reading) to be the accepted hsp70 sequence for C.gigas.
2. The product generated from the hsp70 RLID 1202 and 1203 primers appear to be specific to the hsp70 sequence corresponding to accession number AJ318882. However, this conclusion is essentially based on a 3bp mismatch between AJ318882 and AJ3035315 (hsc70), which also happens to be the densest accumulation of SNPS that can distinguish the two. Whether this sufficient enough to claim that we are measuring hsp70 only and not detecting any hsc70 transcript is unclear, but this is the most conclusive evidence we can generate to make this argument.

Note: I realize that this image is only showing clone#1 but all clones were identical in this region.
3. PCR of genomic DNA using hsp70 primers 1202 and 1203 generated two products. The smaller (expected size) product blasted to AJ318882 while the large band failed to blast to anything in genbank.
May 4, 2011
Finishing our second attempt at making RAD libraries for M.merc. and quantification of V.tubiashii from May 2, 2011.
RAD library prep Day 2
Picking up from where we left off last night (blunt repair rxn was put at -20)
1. Purify blunt repair rxn using MiniElute rxn. clean-up kit.
- add 300ul buffer PB to sample
- apply entire sample to MiniElute column
- spin 10,000xg for 1min. discard flow through
- add 750ul buffer PE to column
- spin 10,000xg for 1min. discard flow through.
- spin empty column 10,000xg 1min to remove residual buffer
- Transfer column to new tube and apply 42ul buffer EB to column and incubate 1min at RT.
- Spin 10,000xg for 1min. KEEP flow through and discard column.
2. Add A overhang
- Make A overhand mastermix (for 1rxn: 5ul NEB2, 1ul dATP, 3ul Klenow)
Note: we only have one samples for A overhang components were added directly to the sample.
- Incubate at 37 decrees C for 1hr
3. Purify A overhang rxn using MiniElute rxn. clean-up kit.
- add 300ul buffer PB to sample
- apply entire sample to MiniElute column
- spin 10,000xg for 1min. discard flow through
- add 750ul buffer PE to column
- spin 10,000xg for 1min. discard flow through.
- spin empty column 10,000xg 1min to remove residual buffer
- Transfer column to new tube and apply 44ul buffer EB to column and incubate 1min at RT.
- Spin 10,000xg for 1min. KEEP flow through and discard column.
4. Ligate P2 Adaptors
- Make P2 adaptor master mix (for 1rxn: 5ul NEB2, 1ul P2 Adaptor, 0.5ul rATP, 0.5ul T4 DNA Ligase)
Note: again, we only have one sample so components were added directly to sample.
- Incubate at RT for 1hr.
5. Purify P2 adaptor rxn using MiniElute rxn. clean-up kit.
- add 300ul buffer PB to sample
- apply entire sample to MiniElute column
- spin 10,000xg for 1min. discard flow through
- add 750ul buffer PE to column
- spin 10,000xg for 1min. discard flow through.
- spin empty column 10,000xg 1min to remove residual buffer
- Transfer column to new tube and apply 50ul buffer EB to column and incubate 1min at RT.
- Spin 10,000xg for 1min. KEEP flow through and discard column.
6. Test PCR
-Default protocol calls for 1ul of template in the test PCR. Last time we tried this we ended up increasing to 5ul and we still did not acquire enough template. This time I will set up two test PCR rxns. one with 1ul of template and the other with 5ul of template.
1ul Template Test PCR
12.5ul Phusion PCR mix
10.5ul Sterile Water
1ul RAD Primer mix
1ul Template
5ul Template Test PCR
12.5ul Phusion PCR mix
6.5ul Sterile Water
1ul RAD Primer mix
5ul Template
Rxn conditions
1. 98 for 30s
2. 98 for 10s
3. 65 for 30s
4.72 for 30s
5. goto 2 15x
6. 72 for 5min
7. hold 4 degrees
It worked! The 5ul rxn was much brighter than the 1ul and the fact that you can easily see the library template is very encouraging. Will move forward with full PCR rxn uping our template to 6ul for an extra boost (hopefully).
Large RAD PCR rxn.
50ul Phusion PCR mix
22ul Sterile Water
4ul RAD primer mix
24ul Template
Rxn conditions were the same as the test PCR above.
On another note... Using Elenes V.tubiashii qPCR protocol to quantify the CFUs from the clam experiment on May 2, 2011
Set up MasterMix for ssoFast Evagreen qPCR mix.
| Master Mix |
1x |
40 |
| 2x Sso Fast EvaGreen |
10 |
400 |
| F Primer |
0.5 |
20 |
| R Primer |
0.5 |
20 |
| Temp. |
2ul |
|
| Water |
7 |
280 |
May 3, 2011
Starting new RAD library prep for M.merc with a few changes.
Notes: last time we tried this we failed to generate enough RAD library template to send for sequencing even though we followed the given protocol exactly. Reasons for this are speculative at best, so we are going to make a few conservative changes in a last ditch effort to to make gobs and gobs for RAD library fragments.
Changes:
1. gDNA from M.merc was precipitated to further clean the samples and remove the NaOH that they were resuspended in according to the DNAzol. Not sure if NaOH alters the downstream reaction chemistries but it's not worth risking. gDNA was resuspended in Qiagen buffer EB.
2. Will perform two Sbf1 digests containing 1ug gDNA for each sample and combine during the rxn. clean up step thus doubling the amount of digested material used from the adaptor ligation on.
3. Pool entire samples from the adaptor ligation for sonication. After pooling, samples will be divided into 120ul aliquots for sonication and then recombined by spinning through a single MiniElute column.
Lets get started!
1. Transferred 1ug of gDNA to a new tube and brought to 40ul. (made two 1ug aliquots for each sample which is a total of 16 rxns)
| Sample |
Conc. ng/ul |
ul for 1.0ug |
ul water for 40ul total |
| MA1 |
45.6 |
21.93 |
18.07 |
| MA2 |
116.2 |
8.61 |
31.39 |
| MA3 |
81.1 |
12.33 |
27.67 |
| MA4 |
105.3 |
9.50 |
30.50 |
| MAX2 |
140.1 |
7.14 |
32.86 |
| MAX3 |
68.7 |
14.56 |
25.44 |
| MAX9 |
241.4 |
4.14 |
35.86 |
| MAX11 |
228.9 |
4.37 |
35.63 |
2. Make SbfI mastermix with RNaseA
| 5/4/11 |
+ 10% pipetting error |
|||||||
| Number of Individuals: |
16 |
Concentration |
||||||
| Solution |
Stock |
Final |
1x (ml) |
Master Mix |
||||
| NEB4 |
10x |
1x |
5 |
88 |
||||
| H2O |
NA |
NA |
4 |
70.4 |
||||
| Sbf I - HF |
20 units/ml |
20 units |
1 |
17.6 |
||||
| RNAse A* |
0.1 |
1.76 |
||||||
| 1) Add 10ul to each individual (40ul) sample for a total reaction volume of 50 ul |
||||||||
| 2) Incubate at 37 C according to methods |
||||||||
|
||||||||
2. Heat kill RNase by incubating samples at 65 degrees C for 20min.
3. Clean up reactions using MiniElute rxn. clean up protocol.
Note: duplicate samples were pooled to make 8 different 100ul samples which were then processed as follows.
- add 300ul buffer PB to sample
- apply entire sample to MiniElute column
- spin 10,000xg for 1min. discard flow through
- add 750ul buffer PE to column
- spin 10,000xg for 1min. discard flow through.
- spin empty column 10,000xg 1min to remove residual buffer
- Transfer column to new tube and apply 47ul buffer EB to column and incubate 1min at RT.
- Spin 10,000xg for 1min. KEEP flow through and discard column.
4. P1 RAD adaptor Ligation
- Add 4ul of P1 RAD Adaptor to each sample (use a different adaptor for each sample)
- Add 3ul NEB Buffer 2 to each sample.
-Make P1 Ligation mastermix as follows:
| 5/4/11 |
+ 10% for pipetting error |
||||||
| Number of Individuals: |
8 |
||||||
| Solution |
1x (ul) |
Master Mix |
|||||
| H2O |
3.9 |
34.32 |
|||||
| NEB 2 |
2 |
17.6 |
|||||
| rATP |
0.6 |
5.28 |
|||||
| T4 DNA ligase |
0.5 |
4.4 |
|||||
| 1) Add 7ul to each individual for a total volume of 60ml |
|||||||
| 2) Incubate at Room Temperature for 1hr |
|||||||
Adaptor Information
Note: Obtained adaptor information for the excel sheet that was available in dropbox at the time. Sequences were determined based on plate location, so assuming there is not a more updated information sheet, these should be correct.
| Sample |
Plate well |
Barcode sequence |
Top oligo sequence |
Bottom oligo sequence |
| MA1 |
B01 |
ACTCTT |
ACACTCTTTCCCTACACGACGCTCTTCCGATCTACTCTTTGC*A |
/5Phos/AAGAGTAGATCGGAAGAGCGTCGTGTAGGGAAAGAGTGT |
| MA2 |
B02 |
ACTGGC |
ACACTCTTTCCCTACACGACGCTCTTCCGATCTACTGGCTGC*A |
/5Phos/GCCAGTAGATCGGAAGAGCGTCGTGTAGGGAAAGAGTGT |
| MA3 |
B03 |
AGCCAT |
ACACTCTTTCCCTACACGACGCTCTTCCGATCTAGCCATTGC*A |
/5Phos/ATGGCTAGATCGGAAGAGCGTCGTGTAGGGAAAGAGTGT |
| MA4 |
B04 |
AGCGCA |
ACACTCTTTCCCTACACGACGCTCTTCCGATCTAGCGCATGC*A |
/5Phos/TGCGCTAGATCGGAAGAGCGTCGTGTAGGGAAAGAGTGT |
| MAX2 |
B05 |
AGGGTC |
ACACTCTTTCCCTACACGACGCTCTTCCGATCTAGGGTCTGC*A |
/5Phos/GACCCTAGATCGGAAGAGCGTCGTGTAGGGAAAGAGTGT |
| MAX3 |
B06 |
AGGTGT |
ACACTCTTTCCCTACACGACGCTCTTCCGATCTAGGTGTTGC*A |
/5Phos/ACACCTAGATCGGAAGAGCGTCGTGTAGGGAAAGAGTGT |
| MAX9 |
B07 |
AGTAGG |
ACACTCTTTCCCTACACGACGCTCTTCCGATCTAGTAGGTGC*A |
/5Phos/CCTACTAGATCGGAAGAGCGTCGTGTAGGGAAAGAGTGT |
| MAX11 |
B08 |
AGTTAA |
ACACTCTTTCCCTACACGACGCTCTTCCGATCTAGTTAATGC*A |
/5Phos/TTAACTAGATCGGAAGAGCGTCGTGTAGGGAAAGAGTGT |
5. Heat kill enzyme by incubating at 65 degrees C for 10min.
Note: At this point I had to run to class and Caroline took over proceeded to pool the samples, shear them in the Bioruptor Sonicator, Purified with MiniElute, Gel purify, and begin the Blunt end repair. See Carolines notebook for details!
After the 1hr incubation for the blunt end repair, I moved the rxn to the -20 and will resume the procedure tomorrow.
May 2, 2011
Clam/Vt experiment
Clams were put in seawater on Friday April 29, 2011 3:30pm and were allowed to acclimate to 10 degrees for ~2.5 days. No mortalities occurred during this time.
Clams were separated into four buckets (BX N=10/bucket, MA N=11/bucket). 2L of 10 degree seawater was added to each bucket to just cover the clams.
April 28, 2011
qPCR test using 18s and hsp70 C.gigas primers and OA larvae cDNA from April 27, 2011
| Master Mix |
1x |
10 |
| 2x Sso Fast EvaGreen |
10 |
100 |
| F Primer |
0.5 |
5 |
| R Primer |
0.5 |
5 |
| Temp. |
2ul |
|
| Water |
7 |
70 |
April 27, 2011
More RADing and testing and RNA extractions from OA larvae.
C.gigas larval RNA extraction from OA samples.
Notes: The last time I tried extracting RNA from these samples there was essentially no yield. So what's different this time? I'm going to try extracting another sample from that same sampling date except try using the MRC protocol for low tissue quantities. In addition, I am going to try extracting RNA from the termination samples on April, 18, 2011 since the entire jar was samples instead of a small aliquot. Hopefully this will give me enough RNA to do qPCR, although there was a LOT of algae that came along with the larvae, so I'm not sure if I will actually be extracting gigas RNA or if it is just all going to be algae.
Followed standard TriReagent Protocol
Notes: added 8ul of polyacryl carrier to each homogenate, vortexed, and then proceeded with the 5min RT incubation etc. etc.
Results:
Notes: Samples 4B1, 5B1, and 6B1 were the termination samples (ie whoe jar) taking on April, 18, 2011. 4B2, 5B2, and 6B2 were taken on April 15, 2011.
| Sample ID |
User ID |
Date |
Time |
ng/ul |
A260 |
A280 |
260/280 |
260/230 |
Constant |
Cursor Pos. |
Cursor abs. |
340 raw |
| 4B1 |
Default |
4/27/11 |
11:52 AM |
36.87 |
0.922 |
0.428 |
2.15 |
0.47 |
40 |
230 |
1.976 |
0.029 |
| 5B1 |
Default |
4/27/11 |
11:53 AM |
27 |
0.675 |
0.296 |
2.28 |
0.25 |
40 |
230 |
2.685 |
0.016 |
| 6B1 |
Default |
4/27/11 |
11:53 AM |
56.43 |
1.411 |
0.667 |
2.11 |
0.74 |
40 |
230 |
1.914 |
0.049 |
| 4B2 |
Default |
4/27/11 |
11:54 AM |
11.47 |
0.287 |
0.157 |
1.82 |
0.2 |
40 |
230 |
1.405 |
0.076 |
| 5B2 |
Default |
4/27/11 |
11:54 AM |
5.72 |
0.143 |
0.076 |
1.89 |
0.23 |
40 |
230 |
0.636 |
0.024 |
| 6B2 |
Default |
4/27/11 |
11:55 AM |
26.08 |
0.652 |
0.309 |
2.11 |
0.16 |
40 |
230 |
4.06 |
0.057 |
I'm curious about how much of the RNA that I isolated is algae vs gigas...in other words is it useful? I took samples 4B1 5B1 and 6B1 and proceeded with ant RT reaction for subsequent qPCR. I'll just try amplifying 18s and hsp70 for fun to see if I get anything...
Hard Clam RAD Libraries
Caroline set up the test PCR last night.
-Ran PCR on 1% agarose gel to check amplifiation
Results:
Cant see anything
After talking with members of the Seeb lab, the DNA quantities that we are dealing with are so low that it might be impossible to see them on a standard agarose gel. They suggest running our PCR samples on one of their EGels...they are much smaller/thinner then what we can pour so any DNA present whould stand out more easily.
-Ran a 1% EGel
Results: See Carolines Notebook.
Troubleshooting:
One possible cause for our PCR failure is that the concentration of our fragment libraries is too low. I still have the set of individual barcode ligations frozen away in the -20. We are going to try fragmenting TWICE as much DNA as recommended by the protocol to see if that yields better results. This means going back to the pooling step followed by sonication etc etc.
April 26, 2011
RAD protocol continued.
-Gel Purification
1. Ran sample from April 25, 2011 on a 1% agarose gel with both an NEB 1KB ladder (N3231) and an EGel 1kb ladder (was not sure which one would give me the best resolution at the 300-700bp range for subsequent size isolation.)
2. Cut our gel size fraction between 350-650bp.
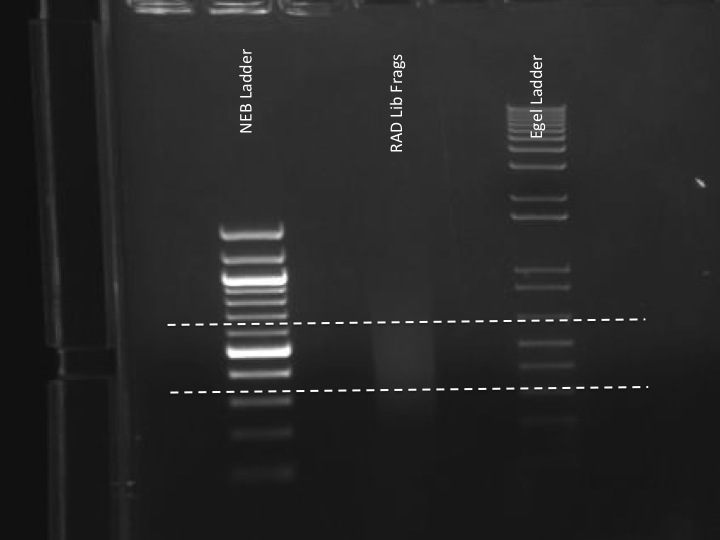
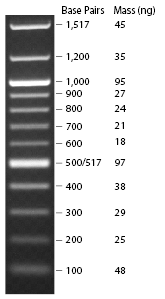 Band sizes for NEB 1KB ladder N3231
3. Use minielute gel purifiation protocolt to purify fragments.
-Gel weight = 400mg. added 1,200ul of Buffer QG and incubated at 50 degrees C for 10min to dissolve gel frag.
- Added 400ul isopropanol and spun through minielute column (800ul at at time until all was spun through)
- Added 500ul buffer QG to column and spun 1min 13K rpm
- Added 750ul buffer PE and spun 1min at 13K rpm
- Discard flow-though and spun again for 1min at 13K rpm
- Added 20ul Buffer EB directly to column. Incubated 1min at RT and spun 1min at 13K rpm.
April 25, 2011
Beginning RAD protocol for hard clam QPX samples.
Sbf-1 Digest:
Transfered 1ug DNA to a new tube and brought volume to 40ul with sterile water
| Sample ID |
avg. conc. |
ul for 1ug |
| MAX 1 |
177.06 |
5.65 |
| MAX 2 |
379.93 |
2.63 |
| MAX 3 |
190.33 |
5.25 |
| MAX 4 |
86.29 |
11.59 |
| MA 1 |
116.35 |
8.60 |
| MA 2 |
271.01 |
3.69 |
| MA 3 |
195.89 |
5.10 |
| MA 4 |
245.76 |
4.07 |
| FL3_1 |
353.73 |
2.83 |
| FL3_3 |
435.43 |
2.30 |
| FL3_4 |
152.68 |
6.55 |
| FL3_5 |
229.33 |
4.36 |
| 4/25/11 |
All reactions + 10% for pipetting error |
||||||
| Number of Individuals: |
12 |
||||||
| Solution |
1x (ml) |
Master Mix |
|||||
| NEB4 |
5 |
66 |
|||||
| H2O |
4 |
52.8 |
|||||
| Sbf I - HF |
1 |
13.2 |
|||||
| RNAse A* |
0.1 |
1.32 |
|||||
| 1) Add 10ml to each individual |
|||||||
| 2) Incubate at 37 C according to methods |
|||||||
|
|||||||
- Heat Kill enzyme by incubating at 65 degrees C for 20min
- MiniElute Clean-up
1. Add 300ul Buffer PB to sample
2. Spin sample through MiniElute column for 1min at 13K rpm
3. Discard flow-through and add 750ul wash buffer PE to column.
4. Spin 1min at 13K rpm
5. Discard flow-through and spin again 1min 13K rpm to remove residual wash buffer.
6. Elute in 47ul buffer EB by applying directly to column. Incubate RT 1min followed by 1min sping at 13K rpm.
-RAD adapter Ligation
1. Add 4ul P1 RAD Adapter and 3ul NEB Buffer 2.
NOTE: Used RAD adapters A1-A12 on adapter plate for samples MA1-4, MAX 1-4, and FL3-1 - 3-5 in that order.
2. Add 7ul P1 Ligation Mastermix to each sample.
3. Incubate at RT for 1hr.
4. Heat kill enzyme by incubating at 65 degrees C for 10min.
-Pool Samples
-Pooled equal amounts (10ul) of each tagged sample for a total of 120ul.
-Stored remaining sample at -20 in "Hard Clam gDNA and RAD samples"
-Shear Pooled Samples
-Turn on water bath and sonicator at least 30min prior to use to give the water bath a chance to cool to 4 degrees C
- NOTE: Before turning on water batch make sure valve in rear of chiller is open to allow water to flow between sonicator bath and chiller bath.
- To shear: Run two cycles of 3x 30s sonication, 60s break followed by 1 cycle of 4x 30s sonication, 60s break. Remove samples and spin down between each cycle.
-Purify in minielute column.
NOTE: Stored samples o/n at -20
April 21, 2011
Requantifying gDNA isolated on April 17, 2011 using the nanodrop from the young lab. Apparently our nanodrop is currently not calibrated.
Quantification was done with the helpful hand of Caroline Storer aka C-dogg.
Only 4 samples were quantified because we are going to run a single multiplex of 12 samples to test our RAD protocol/technique. Each sample was measured 3 times.
| Sample ID |
Date |
Time |
ng/ul |
260/280 |
260/230 |
Constant |
Cursor Pos. |
Cursor abs. |
A340 |
| MAX 1 |
4/21/2011 |
12:46 PM |
177.33 |
1.91 |
1.55 |
50 |
230 |
2.289 |
0.306 |
| MAX 1 |
4/21/2011 |
12:47 PM |
176.45 |
1.91 |
1.59 |
50 |
230 |
2.225 |
0.279 |
| MAX 1 |
4/21/2011 |
12:47 PM |
177.41 |
1.92 |
1.57 |
50 |
230 |
2.263 |
0.291 |
| MAX 2 |
4/21/2011 |
12:48 PM |
381.26 |
1.86 |
1.31 |
50 |
230 |
5.805 |
0.894 |
| MAX 2 |
4/21/2011 |
12:48 PM |
381.08 |
1.85 |
1.33 |
50 |
230 |
5.741 |
0.83 |
| MAX 2 |
4/21/2011 |
12:49 PM |
377.46 |
1.86 |
1.35 |
50 |
230 |
5.582 |
0.738 |
| MAX 3 |
4/21/2011 |
12:49 PM |
190.69 |
1.94 |
1.66 |
50 |
230 |
2.298 |
0.267 |
| MAX 3 |
4/21/2011 |
12:50 PM |
190.37 |
1.95 |
1.66 |
50 |
230 |
2.293 |
0.272 |
| MAX 3 |
4/21/2011 |
12:50 PM |
189.94 |
1.94 |
1.69 |
50 |
230 |
2.246 |
0.261 |
| MAX 4 |
4/21/2011 |
12:51 PM |
84.07 |
2.02 |
2.06 |
50 |
230 |
0.818 |
0.115 |
| MAX 4 |
4/21/2011 |
12:52 PM |
86.29 |
1.99 |
2.15 |
50 |
230 |
0.804 |
0.09 |
| MAX 4 |
4/21/2011 |
12:52 PM |
88.5 |
1.96 |
2.02 |
50 |
230 |
0.876 |
0.12 |
| MA 1 |
4/21/2011 |
12:53 PM |
116.07 |
1.96 |
1.85 |
50 |
230 |
1.253 |
0.132 |
| MA 1 |
4/21/2011 |
12:54 PM |
117.24 |
1.96 |
1.9 |
50 |
230 |
1.232 |
0.126 |
| MA 1 |
4/21/2011 |
12:54 PM |
115.73 |
1.96 |
1.96 |
50 |
230 |
1.183 |
0.117 |
| MA 2 |
4/21/2011 |
12:55 PM |
271.78 |
1.91 |
1.58 |
50 |
230 |
3.44 |
0.366 |
| MA 2 |
4/21/2011 |
12:55 PM |
270.29 |
1.92 |
1.65 |
50 |
230 |
3.285 |
0.316 |
| MA 2 |
4/21/2011 |
12:56 PM |
270.97 |
1.91 |
1.65 |
50 |
230 |
3.275 |
0.339 |
| MA 3 |
4/21/2011 |
12:57 PM |
195.02 |
1.96 |
1.82 |
50 |
230 |
2.149 |
0.179 |
| MA 3 |
4/21/2011 |
12:57 PM |
196.34 |
1.94 |
1.81 |
50 |
230 |
2.17 |
0.218 |
| MA 3 |
4/21/2011 |
12:58 PM |
195.74 |
1.95 |
1.78 |
50 |
230 |
2.198 |
0.197 |
| MA 3 |
4/21/2011 |
12:58 PM |
196.46 |
1.94 |
1.81 |
50 |
230 |
2.169 |
0.214 |
| MA 4 |
4/21/2011 |
12:59 PM |
244.85 |
1.91 |
1.56 |
50 |
230 |
3.147 |
0.271 |
| MA 4 |
4/21/2011 |
1:00 PM |
245.96 |
1.91 |
1.54 |
50 |
230 |
3.198 |
0.293 |
| MA 4 |
4/21/2011 |
1:00 PM |
246.46 |
1.9 |
1.52 |
50 |
230 |
3.242 |
0.312 |
| FL3_1 |
4/21/2011 |
1:01 PM |
352.73 |
1.96 |
0.95 |
50 |
230 |
7.432 |
0.328 |
| FL3_1 |
4/21/2011 |
1:02 PM |
353.31 |
1.96 |
0.94 |
50 |
230 |
7.492 |
0.345 |
| FL3_1 |
4/21/2011 |
1:03 PM |
355.15 |
1.96 |
0.94 |
50 |
230 |
7.539 |
0.336 |
| FL3_3 |
4/21/2011 |
1:03 PM |
438.34 |
1.93 |
1.16 |
50 |
230 |
7.533 |
0.509 |
| FL3_3 |
4/21/2011 |
1:04 PM |
429.53 |
1.93 |
1.17 |
50 |
230 |
7.318 |
-0.703 |
| FL3_3 |
4/21/2011 |
1:05 PM |
430.49 |
1.94 |
1.16 |
50 |
230 |
7.396 |
0.472 |
| FL3_3 |
4/21/2011 |
1:06 PM |
443.37 |
1.92 |
1.11 |
50 |
230 |
7.967 |
0.592 |
| FL3_4 |
4/21/2011 |
1:07 PM |
152.88 |
1.86 |
0.87 |
50 |
230 |
3.497 |
0.445 |
| FL3_4 |
4/21/2011 |
1:08 PM |
156.95 |
1.87 |
0.88 |
50 |
230 |
3.562 |
0.363 |
| FL3_4 |
4/21/2011 |
1:08 PM |
148.22 |
1.9 |
0.98 |
50 |
230 |
3.015 |
0.261 |
| FL3_5 |
4/21/2011 |
1:09 PM |
228.81 |
2.02 |
0.42 |
50 |
230 |
10.813 |
0.203 |
| FL3_5 |
4/21/2011 |
1:10 PM |
228.31 |
2.03 |
0.42 |
50 |
230 |
10.81 |
0.187 |
| FL3_5 |
4/21/2011 |
1:10 PM |
230.88 |
2.02 |
0.43 |
50 |
230 |
10.863 |
0.224 |
Transfered Cgigas larvae from the OA sampling on April 18, 2011 from RNAlater to 800ul TriReagent as recommened by the MRC protocol for small tissue samples
April 19, 2011
Quantification of gDNA from April 17, 2011 extractions using nanodrop.
| Sample ID |
User ID |
Date |
Time |
ng/ul |
A260 |
A280 |
260/280 |
260/230 |
Constant |
Cursor Pos. |
Cursor abs. |
340 raw |
| MA 1 |
Default |
4/19/11 |
9:33 AM |
99.37 |
1.987 |
1.072 |
1.85 |
2.28 |
50 |
230 |
0.871 |
0.082 |
| MA 2 |
Default |
4/19/11 |
9:34 AM |
234.86 |
4.697 |
2.585 |
1.82 |
1.73 |
50 |
230 |
2.722 |
0.297 |
| MA 3 |
Default |
4/19/11 |
9:34 AM |
171.63 |
3.433 |
1.85 |
1.85 |
1.92 |
50 |
230 |
1.783 |
0.168 |
| MA 4 |
Default |
4/19/11 |
9:35 AM |
211.83 |
4.237 |
2.311 |
1.83 |
1.59 |
50 |
230 |
2.659 |
0.287 |
| MA 5 |
Default |
4/19/11 |
9:35 AM |
153.87 |
3.077 |
1.66 |
1.85 |
1.8 |
50 |
230 |
1.711 |
0.186 |
| MA 6 |
Default |
4/19/11 |
9:36 AM |
77.49 |
1.55 |
0.838 |
1.85 |
2.74 |
50 |
230 |
0.565 |
0.067 |
| MA 7 |
Default |
4/19/11 |
9:36 AM |
135.88 |
2.718 |
1.472 |
1.85 |
1.98 |
50 |
230 |
1.376 |
0.138 |
| MA 8 |
Default |
4/19/11 |
9:37 AM |
90.8 |
1.816 |
0.958 |
1.89 |
2.08 |
50 |
230 |
0.873 |
0.136 |
| MA 9 |
Default |
4/19/11 |
9:37 AM |
236.73 |
4.735 |
2.674 |
1.77 |
1.11 |
50 |
230 |
4.247 |
1.117 |
| MA 10 |
Default |
4/19/11 |
9:39 AM |
83.9 |
1.678 |
0.907 |
1.85 |
1.88 |
50 |
230 |
0.89 |
0.115 |
| MA 11 |
Default |
4/19/11 |
9:39 AM |
100.34 |
2.007 |
1.086 |
1.85 |
1.71 |
50 |
230 |
1.175 |
0.166 |
| MA 12 |
Default |
4/19/11 |
9:40 AM |
92.97 |
1.859 |
0.979 |
1.9 |
2.23 |
50 |
230 |
0.833 |
0.102 |
| MA 13 |
Default |
4/19/11 |
9:40 AM |
272.73 |
5.455 |
2.957 |
1.84 |
1.61 |
50 |
230 |
3.393 |
0.338 |
| MA 14 |
Default |
4/19/11 |
9:41 AM |
226.01 |
4.52 |
2.434 |
1.86 |
1.77 |
50 |
230 |
2.56 |
0.267 |
| MA 15 |
Default |
4/19/11 |
9:41 AM |
112.11 |
2.242 |
1.178 |
1.9 |
2.61 |
50 |
230 |
0.859 |
0.041 |
| MAX 1 |
Default |
4/19/11 |
9:43 AM |
167.04 |
3.341 |
1.842 |
1.81 |
1.48 |
50 |
230 |
2.254 |
0.309 |
| MAX 2 |
Default |
4/19/11 |
9:43 AM |
324.42 |
6.488 |
3.612 |
1.8 |
1.38 |
50 |
230 |
4.718 |
0.668 |
| MAX 3 |
Default |
4/19/11 |
9:44 AM |
172.88 |
3.458 |
1.879 |
1.84 |
1.73 |
50 |
230 |
1.999 |
0.248 |
| MAX 4 |
Default |
4/19/11 |
9:44 AM |
79.51 |
1.59 |
0.835 |
1.9 |
2.49 |
50 |
230 |
0.64 |
0.085 |
| MAX 5 |
Default |
4/19/11 |
9:45 AM |
182.09 |
3.642 |
1.993 |
1.83 |
1.5 |
50 |
230 |
2.436 |
0.294 |
| MAX 6 |
Default |
4/19/11 |
9:45 AM |
127.69 |
2.554 |
1.382 |
1.85 |
1.97 |
50 |
230 |
1.295 |
0.146 |
| MAX 7 |
Default |
4/19/11 |
9:46 AM |
103.07 |
2.061 |
1.111 |
1.86 |
2.42 |
50 |
230 |
0.852 |
0.06 |
| MAX 8 |
Default |
4/19/11 |
9:50 AM |
267.78 |
5.356 |
2.976 |
1.8 |
1.38 |
50 |
230 |
3.872 |
0.591 |
| MAX 9 |
Default |
4/19/11 |
9:47 AM |
335.44 |
6.709 |
3.721 |
1.8 |
1.39 |
50 |
230 |
4.834 |
0.61 |
| MAX 10 |
Default |
4/19/11 |
9:48 AM |
176.74 |
3.535 |
1.913 |
1.85 |
1.77 |
50 |
230 |
1.996 |
0.174 |
| MAX 11 |
Default |
4/19/11 |
9:48 AM |
359.04 |
7.181 |
3.999 |
1.8 |
1.41 |
50 |
230 |
5.089 |
0.669 |
| MAX 12 |
Default |
4/19/11 |
9:48 AM |
241.85 |
4.837 |
2.698 |
1.79 |
1.22 |
50 |
230 |
3.975 |
0.837 |
| MAX 13 |
Default |
4/19/11 |
9:49 AM |
189.57 |
3.791 |
2.088 |
1.82 |
1.38 |
50 |
230 |
2.755 |
0.271 |
| MAX 14 |
Default |
4/19/11 |
9:49 AM |
121.67 |
2.433 |
1.307 |
1.86 |
1.76 |
50 |
230 |
1.385 |
0.179 |
| MAX 15 |
Default |
4/19/11 |
9:50 AM |
355.28 |
7.106 |
3.994 |
1.78 |
1.26 |
50 |
230 |
5.65 |
0.892 |
April 18, 2011
Termination of C.gigas larval OA experiment from April 11, 2011.
Sampling notes:
Adjusted live/dead count sampling volumes to 3x 33ul aliquots to account for decreased larval densities.
All remaining larve were isolated using a 40micron cell strainer and preserved in RNAlater for subsequent RNA isolation.
April 17, 2011
Today I finished the DNAzol extractions that I started yesterday...almost. They are currently re-suspending at 4 degrees.
Spun PK digests 10,000xg for 10min. Transfered supt. to new tube.
Note: tissue was not "dissolved" and still looked like gill tissue, only it was much clearer than what I started with yesterday.
Added 250ul of 100% EtOH and incubated at RT for 3min.
Spun down gDNA at 5,000xg for 5min
Discard supt.
Wash 2x 1ml 75% EtOH with 2min spin at 1,000xg between washes
Resuspended in 200ul 8mM NaOH pH8. pH was adjusted by adding 100ul of .1M HEPES/1ml 8mM NaOH.
April 16, 2011
DNAzol extractions of QPX clam samples for RAD sequencing.
Extrating MA (Mashpee) 1-15 and MAX (Barnstable) 1-15 rec'd Nov. 2009 from Rutgers.
Started gDNA extractions.
Added 500ul DNAzol to ~30mg pieces of Mm gill tissue + 2.7ul 18.3mg/ml Proteinase K (100ug/ml final conc.)
Inucbated o/n at RT with inversion.
April 15, 2011
More sampling at NOAA and testing New genomics sampling technique.
New sampling technique: I found these "cell strainer" baskets in the Friedman lab that brent said I would try out. Basically they are 40micron mesh basket screens that are made to fit in a 6 well tissue culture plate. The idea for sampling is to filter the larvae into the basket and then submerge the strainer in a 6 well plate containing RNA later. Once back to the lab, the strainer can be removed from well containing RNA later and transferred to a well containing 1ml of TriReagent. A pipet can then be used to apply the TriReagent to the strainer effectively lysing the cells and washing them off of the straining. TriReagent homogenate can then me transferred to a centrifuge tube and the rest of the TriReagent protocol can be carrie out as normal.
Sampling notes:
Took two replicates of 3 x 50ul aliquots of larvae from 50ml falcon tube for live/dead counts.
Took 5ml from 50ml falcon tube for genomics sample.
Extracted 4B3, 5B3, and 6B3 to test new sampling method.
Results:
Basically nothing. 4B3 shows some promise but something still isnt working right. First I want to see the final counts from emma so I can estimate the number of larvae I extracted.
| Sample ID |
User ID |
Date |
Time |
ng/ul |
A260 |
A280 |
260/280 |
260/230 |
Constant |
Cursor Pos. |
Cursor abs. |
340 raw |
| 4B3 |
Default |
4/15/11 |
2:56 PM |
2.5 |
0.062 |
0.019 |
3.35 |
1.55 |
40 |
230 |
0.04 |
-0.007 |
| 5B3 |
Default |
4/15/11 |
2:57 PM |
18.01 |
0.45 |
0.29 |
1.55 |
2.52 |
40 |
230 |
0.179 |
0.017 |
| 6B3 |
Default |
4/15/11 |
2:58 PM |
4.29 |
0.107 |
0.028 |
3.84 |
0.1 |
40 |
230 |
1.036 |
0.001 |
April 14, 2011
RNA extractions to test samples from April 12, 2011
Samples were thawed and spun at 4 degrees for 2min to pellet the larvae.
Followed standard TriReagent protocol for RNA extraction
Results:
Nothing. Nanodrop read ~5ng/ul which is within range of normal bacground readings. In addition, absorbance ratios are way off.
Ideas: Could have lost a lot of larvae that stuck to the filter when we tried to remove the saltwater. Freezing samples in saltwater could have negative effects on RNA quality. Just didnt have enough larvae.
| Sample ID |
User ID |
Date |
Time |
ng/ul |
A260 |
A280 |
260/280 |
260/230 |
Constant |
Cursor Pos. |
Cursor abs. |
340 raw |
| 4B1 |
Default |
4/14/11 |
10:08 AM |
6.06 |
0.152 |
0.104 |
1.46 |
0.36 |
40 |
230 |
0.422 |
-0.006 |
| 5B1 |
Default |
4/14/11 |
10:09 AM |
5.5 |
0.137 |
0.102 |
1.34 |
0.38 |
40 |
230 |
0.358 |
-0.015 |
| 6B1 |
Default |
4/14/11 |
10:09 AM |
6.56 |
0.164 |
0.11 |
1.5 |
0.21 |
40 |
230 |
0.787 |
-0.002 |
April 12, 2011
Today we (Sam, Emma, and myself) spent the morning at NOAA taking samples of C.gigas larvae for an OA experiment.
Experimental Notes:
3 Different pCO2 treatments: 380, 540, and 1000
3 replicate jars/ treatment
Eggs were fertilized on April 11, 2011 around 12:00 noon and collected at 2:30pm. Larvae went into the NOAA system around 5:30 pm and sat static until the following morning.
Sampling began around 9am on April 12, 2011. Once complete, larval concentrations were adjusted based on counts and jars were hooked up to the system for the first time around 2:00pm.
Sampling Notes:
Larval jars were filtered and condensed into 50ml falcon tubes as described by the diagram from April 7, 2011.
Two replicates of three 30ul aliquots were taken from the 50ml falcon tube for live/dead counts.
750ul of larvae were sampled for genomics by filtering as much seawater away as possible and snap freezing in LN2. After filtering, the final volume of seawater and larvae was ~200ul.
April 7, 2011
Today I spent the day over at NOAA to see how they were sampling their geoduck larvae. Below is a diagram I made as a visual aid to the whole process.
Notes:
The entire process was carried out on the first jar as a test to see what aliquot volume would yield ~50 larvae. At a starting concentration of 1 larvae/ml, ~30ul was taken/aliquot.
A total of two replicates was taken from each jar for counting.
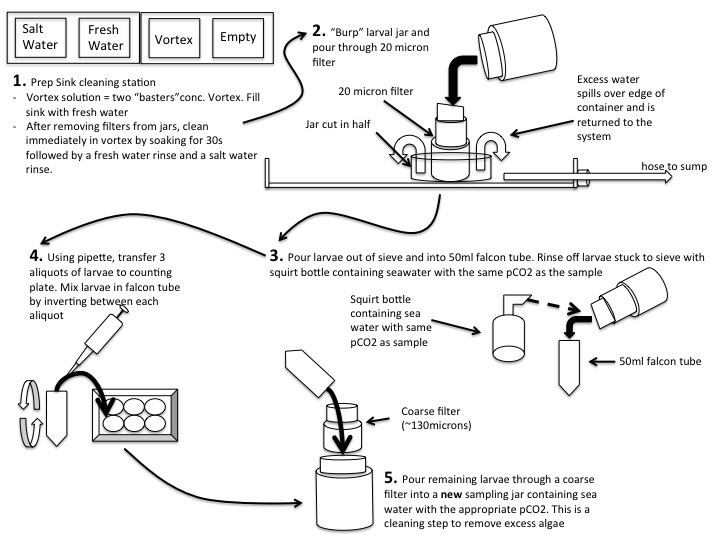
April 4, 2011
Use Qiagen DNeasy miniprep kits to isolate plasmid from cultures started on April 1, 2011.
Resuspended plasmid DNA in 50ul sterile water.
| Sample ID |
User ID |
Date |
Time |
ng/ul |
A260 |
A280 |
260/280 |
260/230 |
Constant |
Cursor Pos. |
Cursor abs. |
340 raw |
| hps70OldPrimers Clone 1 |
Default |
4/4/11 |
1:00 PM |
350.42 |
7.008 |
3.725 |
1.88 |
2.27 |
50 |
230 |
3.089 |
0.023 |
| hsp70OldPrimers Clone 2 |
Default |
4/4/11 |
1:01 PM |
285.92 |
5.718 |
3.038 |
1.88 |
2.28 |
50 |
230 |
2.507 |
0.016 |
| hsp70OldPrimers Clone 3 |
Default |
4/4/11 |
1:01 PM |
332.78 |
6.656 |
3.537 |
1.88 |
2.24 |
50 |
230 |
2.966 |
-0.006 |
| hsp70OldPrimers Clone 4 |
Default |
4/4/11 |
1:02 PM |
361.23 |
7.225 |
3.82 |
1.89 |
2.31 |
50 |
230 |
3.124 |
-0.015 |
| hsp70OldPrimers Clone 5 |
Default |
4/4/11 |
1:02 PM |
214.82 |
4.296 |
2.266 |
1.9 |
2.26 |
50 |
230 |
1.902 |
0.028 |
| hsp70NewPrimers Clone 1 |
Default |
4/4/11 |
1:03 PM |
325.87 |
6.517 |
3.459 |
1.88 |
2.3 |
50 |
230 |
2.838 |
0.019 |
| hsp70NewPrimers Clone 2 |
Default |
4/4/11 |
1:03 PM |
292.58 |
5.852 |
3.085 |
1.9 |
2.34 |
50 |
230 |
2.505 |
-0.025 |
| hsp70NewPrimers Clone 3 |
Default |
4/4/11 |
1:04 PM |
333.7 |
6.674 |
3.535 |
1.89 |
2.18 |
50 |
230 |
3.068 |
0.032 |
| hsp70NewPrimers Clone 4 |
Default |
4/4/11 |
1:04 PM |
250.44 |
5.009 |
2.7 |
1.86 |
1.81 |
50 |
230 |
2.773 |
0.359 |
| hsp70NewPrimers Clone 5 |
Default |
4/4/11 |
1:05 PM |
307.85 |
6.157 |
3.261 |
1.89 |
2.16 |
50 |
230 |
2.844 |
0.095 |
April 2, 2011
Made glycerol stocks from 5ml o/n cultures started on April 1, 2011 and transferred the remaining cultures to 4 degrees until I have a chance to do minipreps.
April 1, 2011
Cloning hsp70 amplicons for sequencing.
O/N plates grew extremely well and I have tons of colonies to choose from.
Picked colonies into 20ul sterile water. Used 2ul of colony/water mixture as PCR template
PCR:
MasterMix: 12.5ul
M13 F Primer (10uM): 0.5ul
M13 R Primer (10uM): 0.5ul
Water: 9.5ul
Template: 2ul
Ran same cycling conditions as March 31, 2011 except only ran 30 cycles instead of 40.
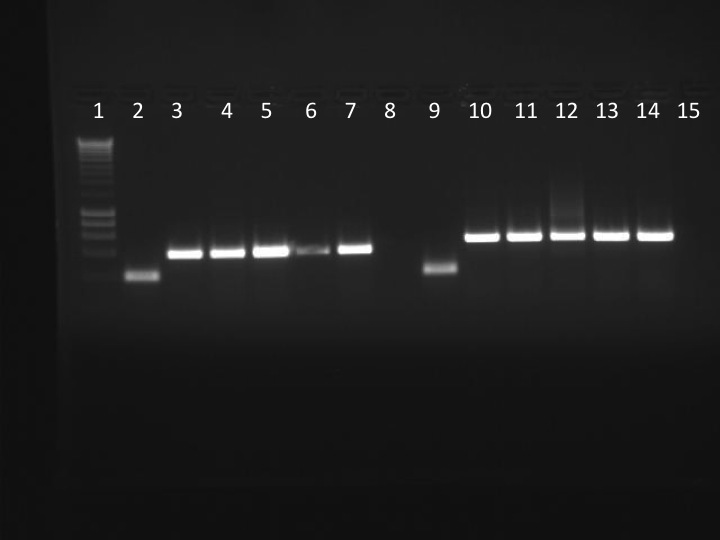
Gel Loading and Naming:
1-N = "Old" hsp70 primers - clone #
2-N = "New hsp70 primers - clone #
Lane 1: Ladder
Lane 2: Positive control
Lane 3: 1-1
Lane 4: 1-2
Lane 5: 1-3
Lane 6 1-4
Lane 7: 1-5
Lane 8: Negative control
Lane 9: Positive control
Lane 10: 2-1
Lane 11: 2-2
Lane 12: 2-3
Lane 13: 2-4
Lane 14: 2-5
Lane 15: Negative control
Results: All clones are positive for the appropriate insert of the appropriate size. Started 5ml o/n cultures to make glycerol stocks and extract plasmid DNA for sequencing.
Started 5ml o/n cultures in LB + Kan for subsequent plasmid isolation.
March 31, 2011
hsp70 PCR with "old" and "new" primers for subsequent cloning and sequencing to verify qPCR amplicon.
PCR mix
2x MasterMix: 2ul
F Primer (10uM): 0.5ul
R Primer (10uM): 0.5ul
Water: 9.5ul
cDNA template: 2ul
Cycling conditions:
1. 95 for 10min
2. 95 for 15sec
3. 55 for 30sec
4. 72 for 30sec
5. Goto 2 39x
6. 72 for 10min
7. 4 forever
(these conditions mimic those used for qPCR minus the 72deg for 10min final extension.)
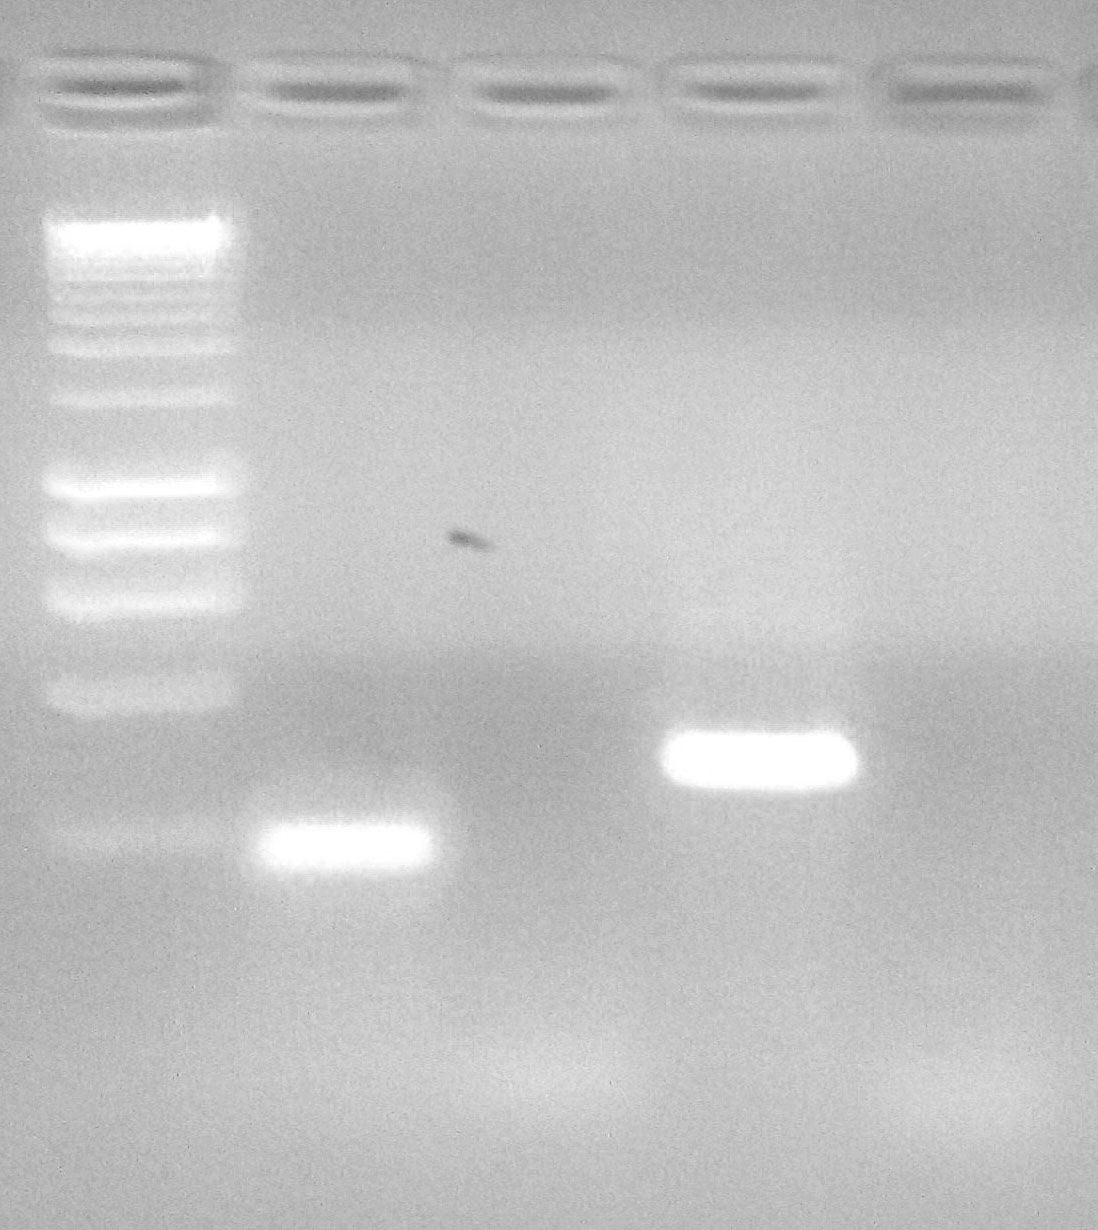
Lane 1: Ladder
Lane 2: "Old" hsp70 primer pair
Lane 3: - control for "old" primer pair
Lane 4: "New" hsp70 primer pair
Lane 5: - control for "new" primer pair
Results:
PCR looks good. Cut out the bands and extracted using millipore spin columns (5000xg for 10min) for cloning.
Cloning:
Followed standard cloning protocol for Invitrogen Topo TA cloning with Top10 competent cells.
Used 4ul of purified PCR product in ligation reaction.
March 18, 2011
hsp70 qPCR using primers to the Boutet et al. sequence for hsp70
Testing "new" hsp70 qPCR primers for a) functionality and b) ability to detect genomic carryover.
The "new" hsp70 primers refer to primers 1202 & 1203 in the primer database designed on March, 16, 2011
Ran a qPCR containing RNA samples to test for detectability of DNA carryover and a cDNA sample as a positive control.
Everything looks great! Unable to detect DNA carry over and signal for cDNA is strong with a good looking melting curve.
For Raw data click here (link coming soon....)
Since the test went well, I'm going to go ahead and run the complete set of CuVt cDNA.
Used same mastermix volumes as January 21, 2011 except used primers 1202 & 1203 from above.
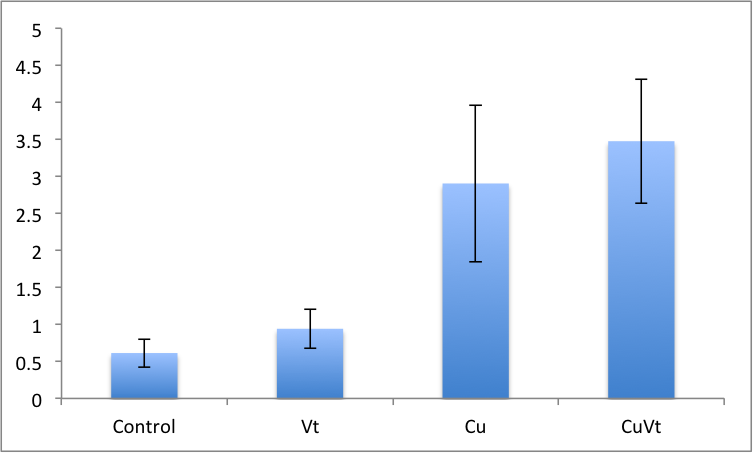
Note: removed one outlier from CuVt...expression was "48." There was also an outlier in the protein data. Need to check if they are the same sample...
March 17, 2011
Extracted RNA from more gill tissues from the hard clam/QPX project using TriReagent. Extracted samples and total RNA concentrations can be found in the table below.
Samples correspond to the Scudders lane samples received from MBL on 9/2/10
MA - Mashpee
BX - Barnstable
Two samples were extracted from each individual plot of a total of 8 samples/strain.
RNA was resuspended in 50ul water.
| Sample ID |
User ID |
Date |
Time |
ng/ul |
A260 |
A280 |
260/280 |
260/230 |
Constant |
Cursor Pos. |
Cursor abs. |
340 raw |
| MA 1-1 |
Default |
3/17/11 |
12:11 PM |
404.84 |
10.121 |
5.651 |
1.79 |
2.24 |
40 |
230 |
4.509 |
0.084 |
| MA 1-2 |
Default |
3/17/11 |
12:12 PM |
157.85 |
3.946 |
2.267 |
1.74 |
2.3 |
40 |
230 |
1.714 |
0.059 |
| MA 2-1 |
Default |
3/17/11 |
12:13 PM |
1073.06 |
26.827 |
14.176 |
1.89 |
2.33 |
40 |
230 |
11.498 |
0.125 |
| MA 2-2 |
Default |
3/17/11 |
12:13 PM |
919.03 |
22.976 |
11.984 |
1.92 |
2.3 |
40 |
230 |
9.99 |
0.244 |
| MA 3-1 |
Default |
3/17/11 |
12:14 PM |
1247.29 |
31.182 |
16.226 |
1.92 |
2.16 |
40 |
230 |
14.405 |
0.236 |
| MA 3-2 |
Default |
3/17/11 |
12:14 PM |
364.35 |
9.109 |
4.993 |
1.82 |
2.14 |
40 |
230 |
4.263 |
0.093 |
| MA 4-1 |
Default |
3/17/11 |
12:15 PM |
430.05 |
10.751 |
5.985 |
1.8 |
2.24 |
40 |
230 |
4.8 |
0.103 |
| MA 4-2 |
Default |
3/17/11 |
12:15 PM |
403.81 |
10.095 |
5.653 |
1.79 |
2.34 |
40 |
230 |
4.313 |
0.077 |
| BX 1-1 |
Default |
3/17/11 |
12:16 PM |
676.93 |
16.923 |
8.92 |
1.9 |
2.14 |
40 |
230 |
7.896 |
0.323 |
| BX 1-2 |
Default |
3/17/11 |
12:16 PM |
565.74 |
14.144 |
7.626 |
1.85 |
2.18 |
40 |
230 |
6.492 |
0.224 |
| BX 2-1 |
Default |
3/17/11 |
12:17 PM |
278.76 |
6.969 |
3.924 |
1.78 |
2.29 |
40 |
230 |
3.038 |
0.044 |
| BX 2-2 |
Default |
3/17/11 |
12:18 PM |
612.32 |
15.308 |
8.202 |
1.87 |
2.32 |
40 |
230 |
6.612 |
0.157 |
| BX 3-1 |
Default |
3/17/11 |
12:18 PM |
126.41 |
3.16 |
1.858 |
1.7 |
0.51 |
40 |
230 |
6.189 |
1.179 |
| BX 3-2 |
Default |
3/17/11 |
12:19 PM |
459.08 |
11.477 |
6.555 |
1.75 |
2.23 |
40 |
230 |
5.138 |
0.124 |
| BX 4-1 |
Default |
3/17/11 |
12:19 PM |
298.19 |
7.455 |
4.17 |
1.79 |
2.26 |
40 |
230 |
3.292 |
0.061 |
| BX 4-2 |
Default |
3/17/11 |
12:20 PM |
1028.29 |
25.707 |
13.519 |
1.9 |
2.29 |
40 |
230 |
11.232 |
0.227 |
Found out from Sam that the place we use to make our SOLiD libraries uses the same Poly-A isolation kit. New plan is to pool equal amounts of total RNA from all 8 samples and send total RNA pools.
Volumes of RNA used to pool can be found in the following table. Pooled samples were DNased treated (30ug total RNA = 3x scaled DNase rxn).
| Sample ID |
ng/ul |
ul RNA |
| MA 1-1 |
404.84 |
9.26 |
| MA 1-2 |
157.85 |
23.76 |
| MA 2-1 |
1073.06 |
3.49 |
| MA 2-2 |
919.03 |
4.08 |
| MA 3-1 |
1247.29 |
3.01 |
| MA 3-2 |
364.35 |
10.29 |
| MA 4-1 |
430.05 |
8.72 |
| MA 4-2 |
403.81 |
9.29 |
| BX 1-1 |
676.93 |
5.54 |
| BX 1-2 |
565.74 |
6.63 |
| BX 2-1 |
278.76 |
13.45 |
| BX 2-2 |
612.32 |
6.12 |
| BX 3-1 |
126.41 |
29.67 |
| BX 3-2 |
459.08 |
8.17 |
| BX 4-1 |
298.19 |
12.58 |
| BX 4-2 |
1028.29 |
3.65 |
Final nanodrop specs for pooled DNased sampels are as follows:
| Sample ID |
User ID |
Date |
Time |
ng/ul |
A260 |
A280 |
260/280 |
260/230 |
Constant |
Cursor Pos. |
Cursor abs. |
340 raw |
| MA pool |
Default |
3/17/11 |
2:19 PM |
140.49 |
3.512 |
1.786 |
1.97 |
1.89 |
40 |
230 |
1.855 |
0.02 |
| BX pool |
Default |
3/17/11 |
2:20 PM |
138.63 |
3.466 |
1.8 |
1.93 |
1.36 |
40 |
230 |
2.541 |
0.143 |
Pooling Lisa's abalone samples for SOLiD libraries
Trying to expedite getting the SOLiD libraries made, I went ahead and pooled lisa/Sam's abalone samples because Sam has been home sick and will be unable to deal with this until next week.
After much deliberation with Sam, I ended up pooling the following quantities of totalRNA samples that have NOT been DNased. Pooling of these samples exhausted the majority of the remaining totalRNA stock, however I found ~30-50ul of DNased RNA for each sample that can be used to synthesize cDNA or whatever.
| Accession # |
who am I? |
Sample Type |
RNA Extracted |
[RNA] (ug/ul) |
uL RNA needed for 5.0ug |
| 08:4-03 |
SC |
Termination |
4/2/09 |
0.40838 |
12.98 |
| 08:4-04 |
SC |
Termination |
4/2/09 |
0.66677 |
7.95 |
| 08:4-05 |
SC |
Termination |
4/2/09 |
0.90708 |
5.84 |
| 08:4-06 |
SC |
Termination |
6/3/09 |
0.24997 |
21.2 |
| 08:4-13 |
SC |
Termination |
6/4/09 |
0.28052 |
18.89 |
| 08:4-10 |
SC |
Termination |
6/4/09 |
18.47 |
|
| 91.27 |
|||||
| 08:3-11 |
SE |
Termination |
3/27/09 |
0.34282 |
15.46 |
| 08:3-12 |
SE |
Termination |
3/27/09 |
0.28841 |
18.38 |
| 08:3-13 |
SE |
Termination |
3/27/09 |
0.22005 |
24.09 |
| 08:3-19 |
SE |
Termination |
3/27/09 |
0.32172 |
16.47 |
| 08:3-21 |
SE |
Termination |
3/27/09 |
0.39619 |
13.38 |
| 08:3-24 |
SE |
Termination |
3/31/09 |
0.23793 |
22.28 |
| 110.05 |
NOTE: The only change made from Sam's original pooling was exchanging sample 08:4-18 for samples 08:4-10 because there was not enough RNA to pool 5ug of 08:4-18 from the remaining stock.
Final nanodrop specs for pooled abalone total RNA:
| Sample ID |
User ID |
Date |
Time |
ng/ul |
A260 |
A280 |
260/280 |
260/230 |
Constant |
Cursor Pos. |
Cursor abs. |
340 raw |
| SC total RNA pool |
Default |
3/17/11 |
3:39 PM |
305.42 |
7.635 |
3.884 |
1.97 |
1.94 |
40 |
230 |
3.93 |
0.405 |
| SE total RNA pool |
Default |
3/17/11 |
3:40 PM |
256.12 |
6.403 |
3.119 |
2.05 |
2.16 |
40 |
230 |
2.971 |
0.159 |
March 16, 2011
Designing new hsp70 primers to Boutet et al. 2003 sequence.
Notes:
Why am I doing this? The other primers I designed were to an unpublished hsp70 sequence in genebank that does not align well with the Boutet sequence. May not be measuing the gene that everyone calls hsp70 in C.gigas
Design Features:
Aligned sequences for AJ305315 coding sequence and cDNA (hsc70) and AJ318882(hsp70)
Note: hsp70 has no introns but sequence is extremely similar to hsc70 cDNA
1. Forward primer spans intron/exon boundary for hsc but to the hsp sequence. It is theoretically impossible to design to inton/exon boundary to hsp70 because it does not have exons.
2. The most 3' nucleotide of the forward primer is a mismatch with the hsc sequenc.
3. There are 3 basepair mismatches in the reverse primer to the hsc sequence. This represents one of the highest concentrations of basepair mismatches between the hsc and hsp sequences.
February 10, 2011
New Cgigas hsp70 primer test and Cgigas Cu/Vt hsp70 qPCR data
For hsp70 normalization and graph visit the google doc
Testing new hsp70 C.gigas primers for detection of DNA carryover.
Used 4ng of RNA as template in a qPCR rxn. This is equivalent to the amount of RNA carried through the RT-qPCR process in which DNA carryover would be detected. These primers were designed to span Intron/Exon boundaries so there should be no genomic amplification.
I used RNA from the Cgigas Cu/Vt experiment in which I have previously detected significant amounts of DNA carryover using 18s primers.
Ran a standard 25ul qPCR rxn in 96 well plates
Results:
RawData
Success!
Absolutely no amplification of genomic DNA!
qPCR amplification plot:

Not the most interesting graph but still exciting!
Step 2:
Rerun cDNA from Cgigas Cu/Vt experiment using new hsp70 primers.
Used same reaction condition as January 21, 2011
Results:
Raw Data


Melt curve looks a little fat...not sure what to make of that right now...
January 27, 2011
Ran qPCR for Cgigas 18s on cDNA samples from January 20, 2011.
qPCR conditions were repeated from January 21, 2011 experiments.
For raw 18s qPCR data click here
Results and Analysis:
1. Raw 18s data looks more consistent compared to ef1a, however there are still a few samples that appear to be "induced" from the Cu treatment.
18s "expression" data

hsp70 "expression" data

2. Relative expression values were caluclated using the following formula: 1/(1+enzymatic efficiency)^Ct where the enzymatic efficiency was calculated from the standard curve generated by serially diluting a cDNA stock. hsp70 values were then divided by 18s to normalize the expression data. Check out my graph!

January 26, 2011
Testing new qPCR housekeeping gene primers.
I will be running a dilution curve in duplicate for each of the 5 primer pairs using cDNA from the Cu/Vt challenge experiment.
Master Mix:
| Reagents |
1X |
17X |
| Immomix |
12.50 |
212.50 |
| Syto13 |
1.00 |
17.00 |
| F Primer (10uM) |
1.25 |
21.25 |
| R Primer (10uM) |
1.25 |
21.25 |
| Water |
8.00 |
136.00 |
Note: master mix volumes are the same for all 5 primer pairs.
Results:
Everything looks pretty good. All standard curves are nice and linear and melting curves show single products except for the 28S assay, which, oddly enough, was the only assay that we did not design and came directly from a previously published study. With some tweaking of Tm, the 28s assay might be alright, but for now I will just go with 18s.

January 24, 2011
Designed new housekeeping primers for C.gigas (with Sam's help)
Primers Ordered:
18s
28s
ARP
Actin
GADPH
January 21, 2011
qPCR analysis of ef1a, hsp70, metallothionine, and copper oxidase from cDNA samples made on January 20, 2011.
qPCR mastermix
| Reagents |
1xMix |
82xMix |
| Immomix |
12.5 |
1025 |
| Syto13 |
1 |
82 |
| F Primer (10uM) |
1.25 |
102.5 |
| R Primer (10uM) |
1.25 |
102.5 |
| Water |
8 |
656 |
For a copy of the plate map click here.
Results:
ef1a, hsp70, metallothionine, copper oxidase
1. hsp70 and ef1a dilution curves and melting curves look good
hsp70 ef1a


2. The metallothionine and copper oxidase melting curves look awful which probably explains why the dilution curves and efficiencies are not optimal. This data is unusable and assays for these genes need to be redesigned.
CopperOxidase Melt Curve

Metallothionine melt curve

Sam's naming scheme
CuVt-E = Copper and Vibrio
CuVt-C = Copper only
Vt-C = No treatment
Vt-E = Vibrio only
January 20, 2011
DNase and reverse transcription of C.gigas Cu/Vt RNA.
Reverse Transcription:
Mixed the following amounts of RNA and Water to make 1ug RNA in 9ul of water.
| Sample ID |
ng/ul |
ul RNA |
ul water |
| BBC Vt-C 1 |
157.26 |
6.36 |
2.64 |
| BBC Vt-C 2 |
174.31 |
5.74 |
3.26 |
| BBC Vt-C 3 |
172.09 |
5.81 |
3.19 |
| BBC Vt-C 4 |
175.17 |
5.71 |
3.29 |
| BBC Vt-C 5 |
157.86 |
6.33 |
2.67 |
| BBC Vt-C 6 |
166.85 |
5.99 |
3.01 |
| BBC Vt-C 7 |
173.25 |
5.77 |
3.23 |
| BBC Vt-E 1 |
157.34 |
6.36 |
2.64 |
| BBC Vt-E 2 |
150.43 |
6.65 |
2.35 |
| BBC Vt-E 3 |
172 |
5.81 |
3.19 |
| BBC Vt-E 4 |
164.33 |
6.09 |
2.91 |
| BBC Vt-E 5 |
155.94 |
6.41 |
2.59 |
| BBC Vt-E 6 |
176.26 |
5.67 |
3.33 |
| BBC Vt-E 7 |
175.04 |
5.71 |
3.29 |
| BBC Vt-E 8 |
171.14 |
5.84 |
3.16 |
| BBC CuVt-C 1 |
216.32 |
4.62 |
4.38 |
| BBC CuVt-C 2 |
152.54 |
6.56 |
2.44 |
| BBC CuVt-C 3 |
191.14 |
5.23 |
3.77 |
| BBC CuVt-C 4 |
158.52 |
6.31 |
2.69 |
| BBC CuVt-C 5 |
177.49 |
5.63 |
3.37 |
| BBC CuVt-C 6 |
156.51 |
6.39 |
2.61 |
| BBC CuVt-C 7 |
167.94 |
5.95 |
3.05 |
| BBC CuVt-C 8 |
156.93 |
6.37 |
2.63 |
| BBC CuVt-E 1 |
197.47 |
5.06 |
3.94 |
| BBC CuVt-E 2 |
151.45 |
6.60 |
2.40 |
| BBC CuVt-E 3 |
146.55 |
6.82 |
2.18 |
| BBC CuVt-E 5 |
155.74 |
6.42 |
2.58 |
| BBC CuVt-E 6 |
151.38 |
6.61 |
2.39 |
| BBC CuVt-E 7 |
154.16 |
6.49 |
2.51 |
| BBC CuVt-E 8 |
163.46 |
6.12 |
2.88 |
Added 1ul Oligo DT and preannealed at 70degreesC for 5min. Placed samples on Ice immediately.
Combined the following reagents in a master mix and added 15ul of mix to each sample.
| RT Rxn |
1x |
33x |
| 5x MMLV Buffer |
5 |
165 |
| dNTPs |
5 |
165 |
| MMLV |
1 |
33 |
| Water |
4 |
132 |
Incubated at 42 degrees for 1hr.
DNase treatment of Cgigas RNA from Cu/Vt experiment:
Follow manufacturer's recommended protocol.
Combined the following volumes of RNA and water for a total of 10ug of nucleic acid/rxn
| Sample ID |
ng/ul |
ul RNA |
ul Water |
| BBC Vt-C 1 |
690.14 |
14.49 |
30.51 |
| BBC Vt-C 2 |
1034.58 |
9.67 |
35.33 |
| BBC Vt-C 3 |
364.38 |
27.44 |
17.56 |
| BBC Vt-C 4 |
393.19 |
25.43 |
19.57 |
| BBC Vt-C 5 |
747.36 |
13.38 |
31.62 |
| BBC Vt-C 6 |
724.79 |
13.80 |
31.20 |
| BBC Vt-C 7 |
859.95 |
11.63 |
33.37 |
| BBC CuVt-E 1 |
1241.48 |
8.05 |
36.95 |
| BBC CuVt-E 2 |
710.51 |
14.07 |
30.93 |
| BBC CuVt-E 3 |
556.61 |
17.97 |
27.03 |
| BBC CuVt-E 5 |
685.71 |
14.58 |
30.42 |
| BBC CuVt-E 6 |
886.43 |
11.28 |
33.72 |
| BBC CuVt-E 7 |
681.74 |
14.67 |
30.33 |
| BBC CuVt-E 8 |
935.94 |
10.68 |
34.32 |
| BBC Vt-E 1 |
835.09 |
11.97 |
33.03 |
| BBC Vt-E 2 |
715.66 |
13.97 |
31.03 |
| BBC Vt-E 3 |
926.94 |
10.79 |
34.21 |
| BBC Vt-E 4 |
839.53 |
11.91 |
33.09 |
| BBC Vt-E 5 |
644.07 |
15.53 |
29.47 |
| BBC Vt-E 6 |
980.71 |
10.20 |
34.80 |
| BBC Vt-E 7 |
944.86 |
10.58 |
34.42 |
| BBC Vt-E 8 |
402.64 |
24.84 |
20.16 |
| BBC CuVt-C 1 |
654.15 |
15.29 |
29.71 |
| BBC CuVt-C 2 |
638.36 |
15.67 |
29.33 |
| BBC CuVt-C 2 |
641.84 |
15.58 |
29.42 |
| BBC CuVt-C 3 |
794.99 |
12.58 |
32.42 |
| BBC CuVt-C 4 |
668.69 |
14.95 |
30.05 |
| BBC CuVt-C 5 |
812.48 |
12.31 |
32.69 |
| BBC CuVt-C 6 |
797.99 |
12.53 |
32.47 |
| BBC CuVt-C 7 |
775.26 |
12.90 |
32.10 |
| BBC CuVt-C 8 |
1066.56 |
9.38 |
35.62 |
| BBC CuVt-C 8 |
1066.3 |
9.38 |
35.62 |
| BBC CuVt-C 8 |
801.9 |
12.47 |
32.53 |
January 19, 2011
RNA extraction of BBC Vt-E RNA from C.gigas CuVt experiment.
BBC Vt-E = Big Beef Creek oysters challenged with Vt only.
RNA was extracted using 1ml TriReagent following manufacturer's recommended protocol.
RNA was resuspended in ~250ul of water and stored at -80.
| Sample ID |
User ID |
Date |
Time |
ng/ul |
A260 |
A280 |
260/280 |
260/230 |
Constant |
Cursor Pos. |
Cursor abs. |
340 raw |
| BBC Vt-E 1 |
Default |
1/19/11 |
2:58 PM |
835.09 |
20.877 |
10.589 |
1.97 |
1.87 |
40 |
230 |
11.17 |
0.637 |
| BBC Vt-E 2 |
Default |
1/19/11 |
3:00 PM |
715.66 |
17.892 |
9.122 |
1.96 |
1.57 |
40 |
230 |
11.392 |
0.806 |
| BBC Vt-E 3 |
Default |
1/19/11 |
3:02 PM |
926.94 |
23.173 |
11.603 |
2 |
1.59 |
40 |
230 |
14.582 |
0.866 |
| BBC Vt-E 4 |
Default |
1/19/11 |
3:04 PM |
839.53 |
20.988 |
10.573 |
1.99 |
1.74 |
40 |
230 |
12.035 |
0.749 |
| BBC Vt-E 5 |
Default |
1/19/11 |
3:04 PM |
644.07 |
16.102 |
8.341 |
1.93 |
2.24 |
40 |
230 |
7.18 |
0.219 |
| BBC Vt-E 6 |
Default |
1/19/11 |
3:05 PM |
980.71 |
24.518 |
12.396 |
1.98 |
1.81 |
40 |
230 |
13.554 |
0.886 |
| BBC Vt-E 7 |
Default |
1/19/11 |
3:07 PM |
944.86 |
23.622 |
11.903 |
1.98 |
1.5 |
40 |
230 |
15.74 |
1.118 |
| BBC Vt-E 8 |
Default |
1/19/11 |
3:08 PM |
402.64 |
10.066 |
5.413 |
1.86 |
2.01 |
40 |
230 |
5.011 |
0.317 |
January 18, 2010
RNA extraction of BBC CuVt-C RNA from C.gigas CuVt experiment.
BBC CuVt-C = Big Beef Creek oysters challenged with Cu only.
RNA was extracted using 1ml TriReagent following manufacturer's recommended protocol.
RNA was resuspended in ~250ul of water and stored at -80.
| Sample ID |
User ID |
Date |
Time |
ng/ul |
A260 |
A280 |
260/280 |
260/230 |
Constant |
Cursor Pos. |
Cursor abs. |
340 raw |
| BBC CuVt-C 1 |
Default |
1/18/11 |
2:08 PM |
654.15 |
16.354 |
8.125 |
2.01 |
1.13 |
40 |
230 |
14.485 |
1.054 |
| BBC CuVt-C 2 |
Default |
1/18/11 |
2:09 PM |
641.84 |
16.046 |
7.959 |
2.02 |
1.45 |
40 |
230 |
11.097 |
0.778 |
| BBC CuVt-C 3 |
Default |
1/18/11 |
2:10 PM |
794.99 |
19.875 |
9.481 |
2.1 |
1.94 |
40 |
230 |
10.268 |
0.532 |
| BBC CuVt-C 4 |
Default |
1/18/11 |
2:11 PM |
668.69 |
16.717 |
8.397 |
1.99 |
1.87 |
40 |
230 |
8.938 |
0.601 |
| BBC CuVt-C 5 |
Default |
1/18/11 |
2:11 PM |
812.48 |
20.312 |
10.107 |
2.01 |
2.14 |
40 |
230 |
9.492 |
0.375 |
| BBC CuVt-C 6 |
Default |
1/18/11 |
2:12 PM |
797.99 |
19.95 |
9.956 |
2 |
1.91 |
40 |
230 |
10.468 |
0.511 |
| BBC CuVt-C 7 |
Default |
1/18/11 |
2:12 PM |
775.26 |
19.382 |
9.859 |
1.97 |
1.97 |
40 |
230 |
9.826 |
0.505 |
| BBC CuVt-C 8 |
Default |
1/18/11 |
2:15 PM |
801.9 |
20.047 |
9.851 |
2.04 |
1.49 |
40 |
230 |
13.442 |
0.778 |
January 14, 2011
RNA extraction of BBC Vt-C and BBC CuVt-E RNA from C.gigas CuVt experiment.
BBC Vt-C = Big Beef Creek control oysters. Received no treatment.
BBC CuVt-E = Big Beef Creed oysters challenged with Cu and Vt.
RNA was extracted using 1ml TriReagent following manufacturer's recommended protocol.
RNA was resuspended in ~250ul of water and stored at -80.
| Sample ID |
User ID |
Date |
Time |
ng/ul |
A260 |
A280 |
260/280 |
260/230 |
Constant |
Cursor Pos. |
Cursor abs. |
340 raw |
| BBC Vt-C 1 |
Default |
1/14/11 |
5:20 PM |
690.14 |
17.254 |
8.676 |
1.99 |
1.72 |
40 |
230 |
10.055 |
0.753 |
| BBC Vt-C 2 |
Default |
1/14/11 |
5:21 PM |
1034.58 |
25.865 |
12.733 |
2.03 |
1.69 |
40 |
230 |
15.341 |
0.972 |
| BBC Vt-C 3 |
Default |
1/14/11 |
5:21 PM |
364.38 |
9.11 |
4.769 |
1.91 |
2.2 |
40 |
230 |
4.134 |
0.24 |
| BBC Vt-C 4 |
Default |
1/14/11 |
5:22 PM |
393.19 |
9.83 |
5.146 |
1.91 |
2.04 |
40 |
230 |
4.817 |
0.325 |
| BBC Vt-C 5 |
Default |
1/14/11 |
5:22 PM |
747.36 |
18.684 |
9.283 |
2.01 |
2.05 |
40 |
230 |
9.118 |
0.52 |
| BBC Vt-C 6 |
Default |
1/14/11 |
5:23 PM |
724.79 |
18.12 |
9.078 |
2 |
2.04 |
40 |
230 |
8.892 |
0.539 |
| BBC Vt-C 7 |
Default |
1/14/11 |
5:23 PM |
859.95 |
21.499 |
10.677 |
2.01 |
1.43 |
40 |
230 |
15.078 |
1.152 |
| BBC CuVt-E 1 |
Default |
1/14/11 |
5:24 PM |
1241.48 |
31.037 |
15.306 |
2.03 |
1.96 |
40 |
230 |
15.852 |
0.769 |
| BBC CuVt-E 2 |
Default |
1/14/11 |
5:24 PM |
710.51 |
17.763 |
9.009 |
1.97 |
2.18 |
40 |
230 |
8.155 |
0.362 |
| BBC CuVt-E 3 |
Default |
1/14/11 |
5:25 PM |
556.61 |
13.915 |
7.071 |
1.97 |
1.85 |
40 |
230 |
7.514 |
0.492 |
| BBC CuVt-E 5 |
Default |
1/14/11 |
5:25 PM |
685.71 |
17.143 |
8.687 |
1.97 |
2.26 |
40 |
230 |
7.585 |
0.373 |
| BBC CuVt-E 6 |
Default |
1/14/11 |
5:26 PM |
886.43 |
22.161 |
11.035 |
2.01 |
1.8 |
40 |
230 |
12.301 |
0.911 |
| BBC CuVt-E 7 |
Default |
1/14/11 |
5:26 PM |
681.74 |
17.044 |
8.658 |
1.97 |
2.24 |
40 |
230 |
7.601 |
0.304 |
| BBC CuVt-E 8 |
Default |
1/14/11 |
5:28 PM |
935.94 |
23.399 |
11.442 |
2.04 |
1.67 |
40 |
230 |
14.048 |
0.935 |
January 12, 2011
qPCR assays for Actin, Serine Protease Inhibitor, and Big Defensin using cDNA from January 11, 2011
diluted cDNA 1:5 and loaded 1ul/rxn
Ran a standard curve of 0, 1:5, 1:25, 1:125, and 1:625 dilutions of pooled cDNA from each sample.
| Master Mix |
1x |
25x |
| Immunomix |
12.5 |
312.5 |
| Syto 13 |
1 |
25 |
| F Primer |
1.25 |
31.25 |
| R Primer |
1.25 |
31.25 |
| Water |
8 |
200 |
1. Serine Protease Inhibitor was not detectable in any of the samples.
2. Amplification of other genes as sporadic. Only Seawater, ATTC, and MA4 hemocytes expressed the Actin housekeeping gene.
3. Expression levels were not strong enough to generate a robust standard curve. The following equation was applied to calculate relative expression values.
=10^(-(0.3012*Ct)+11.434)
ATTC and Seawater Big Defensin expression values were then normalized to actin.The corresponding graph is below.

4. BigDef qPCR assay is also not optimized. See melting curve below for further explanation...

January 11, 2011
Reverse Transcribed DNased RNA from January 10, 2011
Used 1ug RNA/Rxn
| Sample ID |
ng/ul |
ul RNA |
ul Water |
| SEA 1 |
6.19 |
9.00 |
0.00 |
| SEA 2 |
121.78 |
8.21 |
0.79 |
| SEA 3 |
141.12 |
7.09 |
1.91 |
| ATTC 1 |
42.91 |
9.00 |
0.00 |
| ATTC 2 |
118.09 |
8.47 |
0.53 |
| ATTC 3 |
268.66 |
3.72 |
5.28 |
| S-1 1 |
25.77 |
9.00 |
0.00 |
| S-1 2 |
131.7 |
7.59 |
1.41 |
| S-1 3 |
135.44 |
7.38 |
1.62 |
| TD8-8 1 |
11.25 |
9.00 |
0.00 |
| TD8-8 2 |
128.26 |
7.80 |
1.20 |
| TD8-8 3 |
181.76 |
5.50 |
3.50 |
| BX-1 hemocyte |
24.36 |
9.00 |
0.00 |
| MA4 hemocyte |
73.64 |
9.00 |
0.00 |
| 1ul Oligo dT |
|||
| 1x |
16x |
||
| MMLV 5x MM |
5 |
80 |
|
| dNTP |
5 |
80 |
|
| RT |
1 |
16 |
|
| Water |
4 |
64 |
January 10, 2011
DNase treatment of QPX "tissue immersion" samples. Continued from December 15, 2010.
Treated ~8ug of RNA (unless I did not have that much, in which case I treated everything I had for that sample) with DNase to remove possible DNA contamination. This is in accordance with the recommended maximum of 10ug RNA/1ul DNase enzyme.
Followed manufacturers recommended protocol.
Results from Nanodrop
| Sample ID |
Date |
ng/ul |
A260 |
A280 |
260/280 |
260/230 |
| SEA 1 |
1/10/11 |
6.19 |
0.155 |
0.107 |
1.45 |
0.13 |
| SEA 2 |
1/10/11 |
121.78 |
3.044 |
1.536 |
1.98 |
1.55 |
| SEA 3 |
1/10/11 |
141.12 |
3.528 |
1.729 |
2.04 |
1.53 |
| ATTC 1 |
1/10/11 |
42.91 |
1.073 |
0.53 |
2.03 |
0.86 |
| ATTC 2 |
1/10/11 |
118.09 |
2.952 |
1.512 |
1.95 |
1.01 |
| ATTC 3 |
1/10/11 |
268.66 |
6.717 |
3.326 |
2.02 |
1.29 |
| S-1 1 |
1/10/11 |
25.77 |
0.644 |
0.385 |
1.67 |
0.37 |
| S-1 2 |
1/10/11 |
131.7 |
3.292 |
1.641 |
2.01 |
1.41 |
| S-1 3 |
1/10/11 |
135.44 |
3.386 |
1.668 |
2.03 |
1.42 |
| TD8-8 1 |
1/10/11 |
11.25 |
0.281 |
0.174 |
1.62 |
0.23 |
| TD8-8 2 |
1/10/11 |
128.26 |
3.207 |
1.619 |
1.98 |
1.38 |
| TD8-8 3 |
1/10/11 |
181.76 |
4.544 |
2.26 |
2.01 |
1.38 |
| BX-1 hemocyte |
1/10/11 |
24.36 |
0.609 |
0.367 |
1.66 |
0.3 |
| MA4 hemocyte |
1/10/11 |
73.64 |
1.841 |
0.983 |
1.87 |
0.74 |
Results:
Samples look pretty good. Samples #1 from all treatments have very low RNA yields which was to be expected since these represent extractions of QPX floating around in seawater while the other samples are RNA extracted from Hard Clam gill tissue.
January 7, 2011
Testing RNA from the class experiment (exposing C.gigas to Cu and Vt) for DNA contamination.
Loaded 16ng of RNA (equivalent to the amount RNA "contamination" carried through from the RT reaction to the qPCR)
Calculation: 2ugRNA/RT reaction. RT reaction diluted to 250ul. 2ugRNA/250ul = .008. 2ul of RT reaction (.008ugRNA/ul) loaded in qPCR = 16 total ng of total RNA in RT reaction.
Results:
CONTAMINATION!

What do to now?
There are bascially three options...
1. ReDNase the RNA samples. According to the class notes, the samples were previously DNAsed. Repeating this might compromise the integrity of the RNA samples.
2. Extract more RNA from extra tissue samples. This is the safest route to go, however, it is also the most time consuming and costly.
3. Drop the experiment altogether. Easiest solution but perhaps also most costly since we have already put in all of the time and effort to treat the oysters, collect the samples, and get the hsp70 protein data.
I'm leaning heavily towards option #2 but will have to talk with Steven about this before moving forward.
December 23, 2010
Todays the final push to produce some data before the holidays!
I'll be running some qPCR assays on the hard clam cDNA samples from yesterday. Because I'm short on plate space I will only be doing qPCR assays from a single sampling group; BX, MA, and FL.
Assays Run:
Actin: normalizing gene
Serine protease inhibitor: the assay that I've been playing with this quarter. Preliminary data from Steven suggests that I could have interesting results in the FL samples.
Click here for Actin qPCR data file.
Click here for SPI qPCR data file.
Actin Standard Curve

SPI Standard Curve

Results!

December 22, 2010
Today I will be DNasing and RTing all of the samples that I will be using for gene expression for the Hard Clam QPX project. Nothing too special to report, just the final RNA concentrations of the DNased samples...
| Master Mix |
1x |
50 |
| MMLV 5x Buffer |
5 |
250 |
| dNTP |
5 |
250 |
| RT |
1 |
50 |
| Water |
4 |
200 |
The Table below has the volumes of RNA and water used in the RT reaction to make 1ug total RNA/Rxn
| Sample ID |
ng/ul |
ul RNA |
ul H20 |
| CA 4 |
162.95 |
6.1 |
2.9 |
| CA 5 DNase |
173.65 |
5.8 |
3.2 |
| DNase CA 6 |
167.86 |
6.0 |
3.0 |
| DNase CA 7 |
172.86 |
5.8 |
3.2 |
| DNase CA 8 |
95.62 |
9.0 |
0.0 |
| DNase CA 9 |
159.47 |
6.3 |
2.7 |
| DNase CA 10 |
84.97 |
9.0 |
0.0 |
| DNase MA 4 |
151.54 |
6.6 |
2.4 |
| DNase MA 5 |
147.08 |
6.8 |
2.2 |
| DNase MA 6 |
221.32 |
4.5 |
4.5 |
| DNase MA 7 |
112.1 |
9.0 |
0.0 |
| DNase MA 8 |
106.57 |
9.0 |
0.0 |
| DNase MA 9 |
150.03 |
6.7 |
2.3 |
| DNase MA 10 |
158.45 |
6.3 |
2.7 |
| DNase BX 1-3 |
187.94 |
5.3 |
3.7 |
| DNase BX 1-4 |
157.42 |
6.4 |
2.6 |
| DNase BX 2-2 |
92.9 |
9.0 |
0.0 |
| DNase BX 2-3 |
155.63 |
6.4 |
2.6 |
| DNase BX 3-2 |
175.77 |
5.7 |
3.3 |
| DNase BX 3-3 |
168.07 |
5.9 |
3.1 |
| DNase BX 4-1 |
170.07 |
5.9 |
3.1 |
| DNase BX 4-2 |
138.08 |
7.2 |
1.8 |
| DNase MA 1-3 |
179.59 |
5.6 |
3.4 |
| DNase MA 1-5 |
138.11 |
7.2 |
1.8 |
| DNase MA 2-4 |
177.13 |
5.6 |
3.4 |
| DNase MA 2-5 |
163.88 |
6.1 |
2.9 |
| DNase MA 3-3 |
151.42 |
6.6 |
2.4 |
| DNase MA 3-4 |
165.03 |
6.1 |
2.9 |
| DNase MA 4-3 |
157.76 |
6.3 |
2.7 |
| DNase MA 4-4 |
123.83 |
8.1 |
0.9 |
| Max 4 DNase |
172.32 |
5.8 |
3.2 |
| Max 5 DNase |
73.09 |
9.0 |
0.0 |
| Max 6 DNase |
44.17 |
9.0 |
0.0 |
| Max 7 DNase |
47.22 |
9.0 |
0.0 |
| Max 8 DNase |
45.37 |
9.0 |
0.0 |
| Max 9 DNase |
111.74 |
9.0 |
0.0 |
| Max 10 DNase |
73.46 |
9.0 |
0.0 |
DNase Treatment
Useing Ambion's DNA-free Turbo kit...
Combined 5ul of 10x reaction buffer with the RNA and Water volumes in the table below. Added 1ul DNase enzyme and incubated at 37 degrees C for 30min. Added. 5.5ul inactivation reagent. Incubate RT 2min. Spin 10k 1.5min. Transfer supt to a new tube and spec.
Note: MAX and FL samples were previously DNased here and here.
| Sample ID |
User ID |
Date |
Time |
ng/ul |
A260 |
A280 |
260/280 |
260/230 |
Constant |
Cursor Pos. |
Cursor abs. |
340 raw |
| Dnase CA 4 |
Default |
12/22/10 |
12:14 PM |
162.95 |
4.074 |
2.08 |
1.96 |
1.43 |
40 |
230 |
2.847 |
0.035 |
| Dnase CA 5 |
Default |
12/22/10 |
12:15 PM |
173.65 |
4.341 |
2.24 |
1.94 |
1.56 |
40 |
230 |
2.779 |
-0.003 |
| DNase CA 6 |
Default |
12/22/10 |
12:16 PM |
167.86 |
4.197 |
2.142 |
1.96 |
1.43 |
40 |
230 |
2.939 |
0.024 |
| DNase CA 7 |
Default |
12/22/10 |
12:16 PM |
172.86 |
4.322 |
2.216 |
1.95 |
1.46 |
40 |
230 |
2.96 |
-0.01 |
| DNase CA 8 |
Default |
12/22/10 |
12:17 PM |
95.62 |
2.391 |
1.243 |
1.92 |
1.19 |
40 |
230 |
2.006 |
0.062 |
| DNase CA 9 |
Default |
12/22/10 |
12:17 PM |
159.47 |
3.987 |
2.04 |
1.95 |
1.4 |
40 |
230 |
2.85 |
-0.007 |
| DNase CA 10 |
Default |
12/22/10 |
12:18 PM |
84.97 |
2.124 |
1.101 |
1.93 |
1.45 |
40 |
230 |
1.468 |
0.001 |
| DNase MA 4 |
Default |
12/22/10 |
12:18 PM |
151.54 |
3.788 |
1.962 |
1.93 |
1.66 |
40 |
230 |
2.284 |
0.021 |
| DNase MA 5 |
Default |
12/22/10 |
12:19 PM |
147.08 |
3.677 |
1.948 |
1.89 |
1.85 |
40 |
230 |
1.988 |
-0.003 |
| DNase MA 6 |
Default |
12/22/10 |
12:19 PM |
221.32 |
5.533 |
2.867 |
1.93 |
1.88 |
40 |
230 |
2.938 |
0.026 |
| DNase MA 7 |
Default |
12/22/10 |
12:20 PM |
112.1 |
2.803 |
1.469 |
1.91 |
1.35 |
40 |
230 |
2.073 |
0.139 |
| DNase MA 8 |
Default |
12/22/10 |
12:20 PM |
106.57 |
2.664 |
1.394 |
1.91 |
1.51 |
40 |
230 |
1.761 |
0.029 |
| DNase MA 9 |
Default |
12/22/10 |
12:21 PM |
150.03 |
3.751 |
1.956 |
1.92 |
1.9 |
40 |
230 |
1.972 |
-0.007 |
| DNase MA 10 |
Default |
12/22/10 |
12:21 PM |
158.45 |
3.961 |
2.065 |
1.92 |
1.82 |
40 |
230 |
2.179 |
0.011 |
| DNase BX 1-3 |
Default |
12/22/10 |
12:22 PM |
187.94 |
4.698 |
2.481 |
1.89 |
1.89 |
40 |
230 |
2.482 |
-0.015 |
| DNase BX 1-4 |
Default |
12/22/10 |
12:23 PM |
157.42 |
3.936 |
1.999 |
1.97 |
1.83 |
40 |
230 |
2.151 |
-0.004 |
| DNase BX 2-2 |
Default |
12/22/10 |
12:23 PM |
92.9 |
2.322 |
1.202 |
1.93 |
1.62 |
40 |
230 |
1.431 |
-0.018 |
| DNase BX 2-3 |
Default |
12/22/10 |
12:24 PM |
155.63 |
3.891 |
2.01 |
1.94 |
1.85 |
40 |
230 |
2.104 |
-0.009 |
| DNase BX 3-2 |
Default |
12/22/10 |
12:24 PM |
175.77 |
4.394 |
2.363 |
1.86 |
1.85 |
40 |
230 |
2.37 |
-0.009 |
| DNase BX 3-3 |
Default |
12/22/10 |
12:25 PM |
168.07 |
4.202 |
2.227 |
1.89 |
1.87 |
40 |
230 |
2.249 |
-0.015 |
| DNase BX 4-1 |
Default |
12/22/10 |
12:25 PM |
170.07 |
4.252 |
2.262 |
1.88 |
1.42 |
40 |
230 |
2.989 |
0.258 |
| DNase BX 4-2 |
Default |
12/22/10 |
12:26 PM |
138.08 |
3.452 |
1.847 |
1.87 |
1.41 |
40 |
230 |
2.446 |
0.203 |
| DNase MA 1-3 |
Default |
12/22/10 |
12:26 PM |
179.59 |
4.49 |
2.306 |
1.95 |
1.85 |
40 |
230 |
2.431 |
-0.02 |
| DNase MA 1-5 |
Default |
12/22/10 |
12:27 PM |
138.11 |
3.453 |
1.818 |
1.9 |
1.84 |
40 |
230 |
1.873 |
-0.01 |
| DNase MA 2-4 |
Default |
12/22/10 |
12:27 PM |
177.13 |
4.428 |
2.27 |
1.95 |
1.75 |
40 |
230 |
2.526 |
-0.007 |
| DNase MA 2-5 |
Default |
12/22/10 |
12:28 PM |
163.88 |
4.097 |
2.089 |
1.96 |
1.79 |
40 |
230 |
2.294 |
0.001 |
| DNase MA 3-3 |
Default |
12/22/10 |
12:28 PM |
151.42 |
3.785 |
1.939 |
1.95 |
1.8 |
40 |
230 |
2.105 |
-0.009 |
| DNase MA 3-4 |
Default |
12/22/10 |
12:29 PM |
165.03 |
4.126 |
2.142 |
1.93 |
1.77 |
40 |
230 |
2.337 |
-0.012 |
| DNase MA 4-3 |
Default |
12/22/10 |
12:29 PM |
157.76 |
3.944 |
2.028 |
1.95 |
1.86 |
40 |
230 |
2.124 |
-0.017 |
| DNase MA 4-4 |
Default |
12/22/10 |
12:30 PM |
123.83 |
3.096 |
1.67 |
1.85 |
1.82 |
40 |
230 |
1.7 |
-0.015 |
The table below has the volumes of RNA used in the DNase treatment so as not to exceel 10ug of total RNA/Rxn. The reported concentration in this table is the previously reported concentration BEFORE DNase treatment.
| Sample ID |
ng/ul |
ul RNA |
ul water |
| BX1-3 |
403.66 |
24.77 |
20.23 |
| BX1-4 |
260.08 |
38.45 |
6.55 |
| BX2-2 |
137.09 |
45.00 |
0.00 |
| BX2-3 |
240.71 |
41.54 |
3.46 |
| BX3-2 |
279.37 |
35.79 |
9.21 |
| BX3-3 |
266.55 |
37.52 |
7.48 |
| BX4-1 |
329.88 |
30.31 |
14.69 |
| BX4-2 |
193.62 |
45.00 |
0.00 |
| MA1-3 |
335.15 |
29.84 |
15.16 |
| MA1-5 |
176.71 |
45.00 |
0.00 |
| MA2-4 |
452.18 |
22.12 |
22.88 |
| MA2-5 |
379.45 |
26.35 |
18.65 |
| MA3-3 |
213.62 |
45.00 |
0.00 |
| MA3-4 |
246.55 |
40.56 |
4.44 |
| MA4-3 |
230.18 |
43.44 |
1.56 |
| MA4-4 |
163.11 |
45.00 |
0.00 |
| CA 4 |
256 |
39.06 |
5.94 |
| CA 5 |
259 |
38.61 |
6.39 |
| CA 6 |
302 |
33.11 |
11.89 |
| CA 7 |
224 |
44.64 |
0.36 |
| CA 8 |
130 |
45.00 |
0.00 |
| CA 9 |
207 |
45.00 |
0.00 |
| MA 4 |
719 |
13.91 |
31.09 |
| MA 5 |
708 |
14.12 |
30.88 |
| MA 6 |
350 |
28.57 |
16.43 |
| MA 7 |
160 |
45.00 |
0.00 |
| MA 8 |
155 |
45.00 |
0.00 |
| MA 9 |
661 |
15.13 |
29.87 |
| MA 10 |
573 |
17.45 |
27.55 |
| 121 |
45.00 |
December 15, 2010
M. mercanaria QPX gill challenege experiment continued from October 26, 2010
RNA extractions using TriReagent
| Sample ID |
User ID |
Date |
Time |
ng/ul |
A260 |
A280 |
260/280 |
260/230 |
Constant |
Cursor Pos. |
Cursor abs. |
340 raw |
| SEA 1 |
Default |
12/16/10 |
12:16 PM |
30.15 |
0.754 |
0.477 |
1.58 |
0.25 |
40 |
230 |
3.034 |
0.029 |
| SEA 2 |
Default |
12/16/10 |
12:30 PM |
911.87 |
22.797 |
11.597 |
1.97 |
1.89 |
40 |
230 |
12.077 |
0.438 |
| SEA 3 |
Default |
12/16/10 |
12:18 PM |
785.72 |
19.643 |
9.88 |
1.99 |
1.82 |
40 |
230 |
10.81 |
0.019 |
| S-1 1 |
Default |
12/16/10 |
12:18 PM |
70.85 |
1.771 |
1.064 |
1.66 |
0.46 |
40 |
230 |
3.83 |
0.026 |
| S-1 2 |
Default |
12/16/10 |
12:19 PM |
583.63 |
14.591 |
7.497 |
1.95 |
1.76 |
40 |
230 |
8.275 |
0.298 |
| S1-3 |
Default |
12/16/10 |
12:31 PM |
788.28 |
19.707 |
9.925 |
1.99 |
1.7 |
40 |
230 |
11.615 |
0.16 |
| ATTC 1 |
Default |
12/16/10 |
12:25 PM |
133.97 |
3.349 |
1.704 |
1.97 |
1.25 |
40 |
230 |
2.672 |
-0.001 |
| ATTC 2 |
Default |
12/16/10 |
12:21 PM |
239.9 |
5.997 |
3.177 |
1.89 |
0.98 |
40 |
230 |
6.102 |
0.066 |
| ATTC 3 |
Default |
12/16/10 |
12:22 PM |
387.17 |
9.679 |
5.006 |
1.93 |
1.29 |
40 |
230 |
7.491 |
0.019 |
| TD8-81 1 |
Default |
12/16/10 |
12:25 PM |
31.73 |
0.793 |
0.5 |
1.59 |
0.31 |
40 |
230 |
2.523 |
-0.008 |
| TD8-81 2 |
Default |
12/16/10 |
12:26 PM |
596.38 |
14.91 |
7.74 |
1.93 |
1.62 |
40 |
230 |
9.216 |
0.367 |
| TD8-81 3 |
Default |
12/16/10 |
12:26 PM |
312.45 |
7.811 |
4.024 |
1.94 |
1.57 |
40 |
230 |
4.979 |
0.743 |
| BX1 Hemo |
Default |
12/16/10 |
12:27 PM |
57.36 |
1.434 |
0.847 |
1.69 |
0.32 |
40 |
230 |
4.508 |
0.781 |
| MA4 Hemo |
Default |
12/16/10 |
12:28 PM |
144.83 |
3.621 |
2.038 |
1.78 |
0.58 |
40 |
230 |
6.282 |
1.337 |
Naming Scheme:
SEA 1 = RNA from seawater only
SEA 2 = RNA from gill tissue incubated in seawater
SEA 3 = RNA from water that had the gill tissue
S-1 1 = RNA from QPX strain SP-1 in seawater only
S-1 2 = RNA from Gill tissue challenged with SP-1
S-1 3 = RNA from seawater of Gill tissue challenge with SP-1
ATTC 1 = RNA from QPX strain ATTC 1 in seawater only
ATTC 2 = RNA from Gill tissue Challenged with ATTC
ATTC 3 = RNA from seawater of Gill tissue challenge with ATTC
TD8-81 1 = RNA from QPX strain TD8-81 in seawater only
TD8-81 2 = RNA from Gill tissue Challenged with TD8-81
TD8-81 3 = RNA from seawater of Gill tissue challenged with TD8-81
BX1 = Plated hemocyte RNA from clam BX1
MA4 = Plated hemocyte RNA from clam MA4
December 14, 2010
Testing Serine Protease Inhibitor qPCR primers on FL samples from December 13, 2010
The SPI primers were ones that I had made in class and were previously tested on a single sample. Results were a little inconclusive. While I sa expression, it was very low and did not give me an indication of how the assay was working.
In this experiment I am going to run replicates of a dilution curve to look for amplification levels in FL samples, optimal cDNA dilutions, CV between replicates, and efficiency of assay (aka are the dilutions linear).
Dilutions = 0, 1:5, 1:10, 1:50, 1:100, 1:500
Plate Map/Results
| Well |
Fluor |
Content |
Sample |
C(t) |
| A01 |
FAM |
Unkn |
1 |
33.95 |
| A02 |
FAM |
Unkn |
.2 |
36.49 |
| A03 |
FAM |
Unkn |
.1 |
37.59 |
| A04 |
FAM |
Unkn |
.02 |
38.91 |
| A05 |
FAM |
Unkn |
.01 |
|
| A06 |
FAM |
Unkn |
.002 |
|
| A07 |
FAM |
Unkn |
NTC |
|
| A08 |
FAM |
Unkn |
Blank |
|
| A09 |
FAM |
Unkn |
Blank |
|
| A10 |
FAM |
Unkn |
Blank |
|
| A11 |
FAM |
Unkn |
Blank |
|
| A12 |
FAM |
Unkn |
Blank |
|
| B01 |
FAM |
Unkn |
1 |
33.80 |
| B02 |
FAM |
Unkn |
.2 |
36.83 |
| B03 |
FAM |
Unkn |
.1 |
38.09 |
| B04 |
FAM |
Unkn |
.02 |
39.27 |
| B05 |
FAM |
Unkn |
.01 |
|
| B06 |
FAM |
Unkn |
.002 |
|
| B07 |
FAM |
Unkn |
NTC |
|
| B08 |
FAM |
Unkn |
Blank |
|
| B09 |
FAM |
Unkn |
Blank |
|
| B10 |
FAM |
Unkn |
Blank |
|
| B11 |
FAM |
Unkn |
Blank |
|
| B12 |
FAM |
Unkn |
Blank |
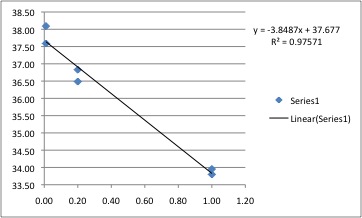
Conclusions:
1. Assay looks pretty good. R square of 0.97 is pretty tight although it would be nice if it was closer to .99 but the Ct values are getting pretty by the 1:10 dilution that this may not be possible for this set of concentrations.
2. SPI seems to be expressed in the samples, albeit at fairly low levels.
3. SPI was detected at 1:50 but was outside the linear range of the assay. 1:100 and 1:500 dilutions had no signal.
4. For future experiments I would run cDNA samples somewhere between their most concentrated form and a 1:5 dilution...maybe 1:2 is best to save on reagents.
December 13, 2010
WooHoo! back in the lab! and just shy under a month too!
RT reactions on FL samples DNAsed on November 17, 2010
Combined the following amounts of RNA with water to make 1ug RNA template in RT reactions
| Sample ID |
User ID |
Date |
Time |
ng/ul |
ul for 1ug |
ul H2O |
| DNase FL1-3 |
Default |
11/17/10 |
1:44 PM |
169.83 |
5.89 |
3.11 |
| DNase FL1-4 |
Default |
11/17/10 |
1:44 PM |
166.36 |
6.01 |
2.99 |
| DNase FL1-5 |
Default |
11/17/10 |
1:45 PM |
158.92 |
6.29 |
2.71 |
| DNase FL2-1 |
Default |
11/17/10 |
1:46 PM |
177.33 |
5.64 |
3.36 |
| DNase FL2-2 |
Default |
11/17/10 |
1:46 PM |
167.56 |
5.97 |
3.03 |
| DNase FL3-1 |
Default |
11/17/10 |
1:47 PM |
132.58 |
7.54 |
1.46 |
| DNase FL3-2 |
Default |
11/17/10 |
1:47 PM |
71.8 |
13.93 |
0.00 |
| DNase FL3-3 |
Default |
11/17/10 |
1:48 PM |
94.64 |
10.57 |
0.00 |
- Added 1ul OligoDT and Incubated at 70 degrees for 5min --ice immediately
Mastermix (10 samples)
5xM-MLV buffer: 50ul
dNTP: 50ul
M-MLV RT: 10ul
Water: 40ul
November 17, 2010
DNase treatment of FL samples from November 5 & 8
Combined the following volumes of RNA and Water based on concentration so as not to exceed 10ug RNA/45ul
| Sample ID |
ng/ul |
ul RNA |
ul Water |
| FL1-3 |
221.32 |
45 |
0 |
| FL2-1 |
627.65 |
16 |
29 |
| FL2-2 |
343.51 |
29 |
16 |
| FL3-1 |
170.1 |
45 |
0 |
| FL3-2 |
92.31 |
45 |
0 |
| FL3-3 |
123.07 |
45 |
0 |
| FL1-4 |
449.77 |
22 |
23 |
| FL1-5 |
384.65 |
26 |
19 |
Added 5ul of 10x DNase Turbo buffer and 1ul DNAse Turbo
Incubate 37 degrees C for 30min
Add 5.5ul Inactivation reagent
Spin 10,000xg for 1.5min
Transfer supt. to new tube and spec.
Results:
| Sample ID |
User ID |
Date |
Time |
ng/ul |
A260 |
A280 |
260/280 |
260/230 |
Constant |
Cursor Pos. |
Cursor abs. |
340 raw |
| DNase FL1-3 |
Default |
11/17/10 |
1:44 PM |
169.83 |
4.246 |
2.283 |
1.86 |
1.77 |
40 |
230 |
2.395 |
0.013 |
| DNase FL1-4 |
Default |
11/17/10 |
1:44 PM |
166.36 |
4.159 |
2.153 |
1.93 |
1.78 |
40 |
230 |
2.338 |
0.028 |
| DNase FL1-5 |
Default |
11/17/10 |
1:45 PM |
158.92 |
3.973 |
2.068 |
1.92 |
1.81 |
40 |
230 |
2.2 |
0.027 |
| DNase FL2-1 |
Default |
11/17/10 |
1:46 PM |
177.33 |
4.433 |
2.341 |
1.89 |
1.85 |
40 |
230 |
2.394 |
0.031 |
| DNase FL2-2 |
Default |
11/17/10 |
1:46 PM |
167.56 |
4.189 |
2.189 |
1.91 |
1.72 |
40 |
230 |
2.431 |
0.027 |
| DNase FL3-1 |
Default |
11/17/10 |
1:47 PM |
132.58 |
3.314 |
1.71 |
1.94 |
1.35 |
40 |
230 |
2.447 |
0.176 |
| DNase FL3-2 |
Default |
11/17/10 |
1:47 PM |
71.8 |
1.795 |
0.919 |
1.95 |
1.23 |
40 |
230 |
1.455 |
0.023 |
| DNase FL3-3 |
Default |
11/17/10 |
1:48 PM |
94.64 |
2.366 |
1.247 |
1.9 |
1.26 |
40 |
230 |
1.881 |
0.088 |
November 9, 2010
And here is the final installment of the hard clam/QPX RNA extractions using TriReagent...
| Sample ID |
User ID |
Date |
Time |
ng/ul |
A260 |
A280 |
260/280 |
260/230 |
Constant |
Cursor Pos. |
Cursor abs. |
340 raw |
| MA1-3 |
Default |
11/9/10 |
11:48 AM |
335.15 |
8.379 |
4.548 |
1.84 |
2.46 |
40 |
230 |
3.408 |
0.002 |
| MA1-5 |
Default |
11/9/10 |
11:49 AM |
176.71 |
4.418 |
2.608 |
1.69 |
2.57 |
40 |
230 |
1.722 |
0.014 |
| MA2-4 |
Default |
11/9/10 |
11:49 AM |
452.18 |
11.304 |
6.036 |
1.87 |
2.13 |
40 |
230 |
5.31 |
0.043 |
| MA2-5 |
Default |
11/9/10 |
11:50 AM |
379.45 |
9.486 |
5.077 |
1.87 |
2.4 |
40 |
230 |
3.952 |
-0.057 |
| MA3-3 |
Default |
11/9/10 |
11:50 AM |
213.62 |
5.341 |
2.96 |
1.8 |
2.48 |
40 |
230 |
2.154 |
0.027 |
| MA3-4 |
Default |
11/9/10 |
11:50 AM |
246.55 |
6.164 |
3.514 |
1.75 |
2.52 |
40 |
230 |
2.449 |
0.011 |
| MA4-3 |
Default |
11/9/10 |
11:51 AM |
230.18 |
5.754 |
3.172 |
1.81 |
2.51 |
40 |
230 |
2.29 |
0.013 |
| MA4-4 |
Default |
11/9/10 |
11:51 AM |
163.11 |
4.078 |
2.344 |
1.74 |
2.62 |
40 |
230 |
1.554 |
0.012 |
| BX1-3 |
Default |
11/9/10 |
11:52 AM |
403.66 |
10.092 |
5.618 |
1.8 |
2.3 |
40 |
230 |
4.395 |
0.017 |
| BX1-4 |
Default |
11/9/10 |
11:53 AM |
260.08 |
6.502 |
3.516 |
1.85 |
2.39 |
40 |
230 |
2.725 |
0.021 |
| BX2-3 |
Default |
11/9/10 |
11:53 AM |
240.71 |
6.018 |
3.428 |
1.76 |
2.43 |
40 |
230 |
2.477 |
0.016 |
| BX3-3 |
Default |
11/9/10 |
11:54 AM |
266.55 |
6.664 |
3.73 |
1.79 |
2.38 |
40 |
230 |
2.803 |
0.012 |
November 8, 2010
More hard clam/QPX RNA extractions using TriReagent:
| Sample ID |
User ID |
Date |
Time |
ng/ul |
A260 |
A280 |
260/280 |
260/230 |
Constant |
Cursor Pos. |
Cursor abs. |
340 raw |
| BX1-1 |
Default |
11/8/10 |
2:20 PM |
91.4 |
2.285 |
1.463 |
1.56 |
2.22 |
40 |
230 |
1.027 |
-0.007 |
| BX1-2 |
Default |
11/8/10 |
2:21 PM |
65.54 |
1.639 |
0.978 |
1.67 |
1.82 |
40 |
230 |
0.9 |
0.023 |
| BX2-1 |
Default |
11/8/10 |
2:21 PM |
94.22 |
2.355 |
1.406 |
1.68 |
1.89 |
40 |
230 |
1.247 |
0.022 |
| BX2-2 |
Default |
11/8/10 |
2:22 PM |
137.09 |
3.427 |
1.957 |
1.75 |
1.98 |
40 |
230 |
1.733 |
0.022 |
| BX3-1 |
Default |
11/8/10 |
2:22 PM |
46.78 |
1.17 |
0.714 |
1.64 |
1.72 |
40 |
230 |
0.678 |
0.065 |
| BX3-2 |
Default |
11/8/10 |
2:23 PM |
279.37 |
6.984 |
4.041 |
1.73 |
2.22 |
40 |
230 |
3.142 |
0.02 |
| BX4-1 |
Default |
11/8/10 |
2:24 PM |
329.88 |
8.247 |
4.541 |
1.82 |
1.53 |
40 |
230 |
5.373 |
0.672 |
| BX4-2 |
Default |
11/8/10 |
2:24 PM |
193.62 |
4.841 |
2.73 |
1.77 |
1.57 |
40 |
230 |
3.083 |
0.388 |
| FL1-4 |
Default |
11/8/10 |
2:25 PM |
449.77 |
11.244 |
6.223 |
1.81 |
2.18 |
40 |
230 |
5.157 |
0.049 |
| FL1-5 |
Default |
11/8/10 |
2:25 PM |
384.65 |
9.616 |
5.318 |
1.81 |
2.25 |
40 |
230 |
4.275 |
0.046 |
Some of the 260/280 ratios are still a bit low. I think this is because, again, there was not a lot of gill tissues left in the tube from before and in order to get a good quality extraction I need to have a bit more. I think I will extract more samples from BX site 1 and one more from BX site 3. I will also extract new samples for MA, but this time I will extract NEW samples and not the second half of the remaining tissue from the previous extraction.
November 5, 2010
FL hard clam gill RNA extractions take 2:
Overview: So the reason for this do-over is that the RNA extractions from October 29, 2010 did not yield the quality of RNA I need to proceed with qPCR. The reasoning in my mind was that it was either my fault for not doing the extractions as continuously as I should have, or the sample quality is low and the RNA is already degraded. To find out the answer, I will be extracting a subset of the samples from that round extractions again. FL was chosen because they are most likely to have an immune response (judging from previous data) from which I can then test my SPI primers.
RNA-later RNA extraction protocol was carried out to a tee!
| Sample ID |
User ID |
Date |
Time |
ng/ul |
A260 |
A280 |
260/280 |
260/230 |
Constant |
Cursor Pos. |
Cursor abs. |
340 raw |
| FL1-1 |
Default |
11/5/10 |
2:09 PM |
78.02 |
1.95 |
1.098 |
1.78 |
0.37 |
40 |
230 |
5.211 |
0.006 |
| FL1-2 |
Default |
11/5/10 |
2:09 PM |
55.51 |
1.388 |
0.792 |
1.75 |
1.46 |
40 |
230 |
0.949 |
-0.002 |
| FL1-3 |
Default |
11/5/10 |
2:10 PM |
221.32 |
5.533 |
3.022 |
1.83 |
2.12 |
40 |
230 |
2.611 |
0.01 |
| FL2-1 |
Default |
11/5/10 |
2:10 PM |
627.65 |
15.691 |
8.167 |
1.92 |
2.06 |
40 |
230 |
7.634 |
0.158 |
| FL2-2 |
Default |
11/5/10 |
2:11 PM |
343.51 |
8.588 |
4.513 |
1.9 |
1.97 |
40 |
230 |
4.37 |
0.048 |
| FL3-1 |
Default |
11/5/10 |
2:11 PM |
170.1 |
4.253 |
2.189 |
1.94 |
1.45 |
40 |
230 |
2.942 |
0.25 |
| FL3-2 |
Default |
11/5/10 |
2:12 PM |
92.31 |
2.308 |
1.243 |
1.86 |
1.39 |
40 |
230 |
1.659 |
0.019 |
| FL3-3 |
Default |
11/5/10 |
2:12 PM |
123.07 |
3.077 |
1.609 |
1.91 |
1.52 |
40 |
230 |
2.024 |
0.17 |
RNA looks much much MUCH better! However, I think that both of my ideas for why the last round was so bad are both right/wrong. From these results, samples 1-1 and 1-2 are both moderate in that they have very low concentrations (they were also resuspended in 30ul of water instead of 75ul like the others) and their ratios are lower than other samples. These samples also had the smallest amount of tissue left in the tube!
Conclusion:
1. I should have extracted the other samples in smaller batches and to completion instead of breaking for classes, teaching, and other extractions.
2. I was not accustomed to working with gill tissue and it looks like you need more tissue than I thought and small amounts of tissue dont provide a robust amount of RNA.
3. I think I will pick two more FL samples from site one to replace 1-1 and 1-2.
Note to self: the following 3 entries are place holders with bullet points of what happened and need to be more completely written up...
November 1, 2010
I need to generate some cDNA from the hard clam samples so I can test my primers during Physiology lab tomorrow.
Promega Turbo DNA-free protocol:
1. Combine: 25ul RNA, 25ul sterile water, 5ul 10x Turbo DNase buffer, 1ul Turbo DNase
2. Incubate 37 degrees C 30min
3. Add 1ul Turbo DNase (rigorous protocol)
4. Incubate 37 degrees C 30min
5. Add 5.5ul DNase inactivation reagent.
6. Flick with finger to mix and incubate at RT for 2min
7. Spin 10,000g for 1.5min.
8. Move supt. to new tube.
9. Spec 2ul on nanodrop
| Sample ID |
User ID |
Date |
Time |
ng/ul |
A260 |
A280 |
260/280 |
260/230 |
Constant |
Cursor Pos. |
Cursor abs. |
340 raw |
| Max 4 DNase |
Default |
11/1/10 |
1:00 PM |
172.32 |
4.308 |
2.244 |
1.92 |
1.65 |
40 |
230 |
2.618 |
0.02 |
| Max 5 DNase |
Default |
11/1/10 |
1:00 PM |
73.09 |
1.827 |
0.997 |
1.83 |
1.22 |
40 |
230 |
1.499 |
-0.002 |
| Max 6 DNase |
Default |
11/1/10 |
1:01 PM |
44.17 |
1.104 |
0.618 |
1.79 |
1.02 |
40 |
230 |
1.087 |
-0.026 |
| Max 7 DNase |
Default |
11/1/10 |
1:01 PM |
47.22 |
1.181 |
0.673 |
1.75 |
0.79 |
40 |
230 |
1.489 |
0.065 |
| Max 8 DNase |
Default |
11/1/10 |
1:02 PM |
45.37 |
1.134 |
0.624 |
1.82 |
1.08 |
40 |
230 |
1.048 |
-0.012 |
| Max 9 DNase |
Default |
11/1/10 |
1:02 PM |
111.74 |
2.793 |
1.462 |
1.91 |
1.54 |
40 |
230 |
1.81 |
0.011 |
| Max 10 DNase |
Default |
11/1/10 |
1:03 PM |
73.46 |
1.837 |
0.977 |
1.88 |
1.28 |
40 |
230 |
1.437 |
0.056 |
RT Rxn. (MAX 4 only)
Note: only using one sample so I will have cDNA to use in class tomorrow. I will do a larger RT reaction later on all of the samples at the same time to control for master mix biases.
1. 5uL of DNase RNA (~1ug) was combined with 1uL oligo dT and 4uL nuclease free water in a 0.5ml PCR tube.
2. Sample was spun to collect contents at the bottom of the tube and then incubated at 70 degrees Celsius for 5min.
3. Sample was spun down again and kept on ice.
3. 5uL of M-MLV 5x reaction buffer, 5uL dNTPs, 1uL M-MLV RT (the reverse transcriptase), and 4uL of nuclease free water was added to the sample.
4. Sample was spun again and then placed in the thermocycler (42 degreesC for 60min followed by 70 degreesC for 3min).
5. Samples were spun down and stored on ice.
October 29, 2010
Spun down and resuspended RNA extractions from _DATE
Results: Not good
| Sample ID |
User ID |
Date |
Time |
ng/ul |
A260 |
A280 |
260/280 |
260/230 |
Constant |
Cursor Pos. |
Cursor abs. |
340 raw |
| FL1-1 |
Default |
10/29/10 |
10:39 AM |
76.81 |
1.92 |
1.132 |
1.7 |
1.34 |
40 |
230 |
1.434 |
0.033 |
| FL1-2 |
Default |
10/29/10 |
10:40 AM |
31.61 |
0.79 |
0.48 |
1.65 |
1.17 |
40 |
230 |
0.674 |
0.014 |
| FL1-3 |
Default |
10/29/10 |
10:40 AM |
27.08 |
0.677 |
0.413 |
1.64 |
1.11 |
40 |
230 |
0.612 |
0.01 |
| FL12-1 |
Default |
10/29/10 |
10:41 AM |
51.74 |
1.294 |
0.775 |
1.67 |
1.42 |
40 |
230 |
0.911 |
0.05 |
| FL12-2 |
Default |
10/29/10 |
10:42 AM |
105.67 |
2.642 |
1.55 |
1.7 |
1.42 |
40 |
230 |
1.865 |
0.049 |
| FL13-1 |
Default |
10/29/10 |
10:43 AM |
237.51 |
5.938 |
3.27 |
1.82 |
1.33 |
40 |
230 |
4.47 |
0.488 |
| FL3-2 |
Default |
10/29/10 |
10:44 AM |
53.29 |
1.332 |
0.771 |
1.73 |
0.94 |
40 |
230 |
1.421 |
0.252 |
| FL3-3 |
Default |
10/29/10 |
10:44 AM |
34.66 |
0.867 |
0.525 |
1.65 |
0.69 |
40 |
230 |
1.261 |
0.179 |
| MA1-1 |
Default |
10/29/10 |
10:45 AM |
174.19 |
4.355 |
2.482 |
1.75 |
2.02 |
40 |
230 |
2.154 |
0.035 |
| MA1-2 |
Default |
10/29/10 |
10:45 AM |
25.15 |
0.629 |
0.389 |
1.61 |
1.15 |
40 |
230 |
0.545 |
0.025 |
| MA2-1 |
Default |
10/29/10 |
10:46 AM |
18.45 |
0.461 |
0.272 |
1.69 |
0.8 |
40 |
230 |
0.575 |
0.019 |
| MA2-2 |
Default |
10/29/10 |
10:46 AM |
7.99 |
0.2 |
0.107 |
1.87 |
0.52 |
40 |
230 |
0.385 |
0.006 |
| MA3-1 |
Default |
10/29/10 |
10:47 AM |
385.04 |
9.626 |
5.358 |
1.8 |
2.11 |
40 |
230 |
4.555 |
0.082 |
| MA3-2 |
Default |
10/29/10 |
10:47 AM |
399.03 |
9.976 |
5.589 |
1.79 |
2.08 |
40 |
230 |
4.793 |
0.089 |
| MA4-1 |
Default |
10/29/10 |
10:48 AM |
22.27 |
0.557 |
0.333 |
1.67 |
1.07 |
40 |
230 |
0.52 |
0.014 |
| MA4-2 |
Default |
10/29/10 |
10:48 AM |
12.95 |
0.324 |
0.193 |
1.67 |
0.84 |
40 |
230 |
0.387 |
-0.004 |
| BX1-1 |
Default |
10/29/10 |
10:49 AM |
33.71 |
0.843 |
0.511 |
1.65 |
1.23 |
40 |
230 |
0.687 |
0.017 |
| BX1-2 |
Default |
10/29/10 |
10:49 AM |
25.28 |
0.632 |
0.375 |
1.69 |
1.15 |
40 |
230 |
0.551 |
0.004 |
| BX2-1 |
Default |
10/29/10 |
10:50 AM |
68.16 |
1.704 |
0.963 |
1.77 |
1.47 |
40 |
230 |
1.156 |
0.036 |
| BX2-2 |
Default |
10/29/10 |
10:50 AM |
78.96 |
1.974 |
1.192 |
1.66 |
1.62 |
40 |
230 |
1.219 |
0.152 |
| BX3-1 |
Default |
10/29/10 |
10:51 AM |
16.89 |
0.422 |
0.24 |
1.76 |
0.92 |
40 |
230 |
0.46 |
0.016 |
| BX3-2 |
Default |
10/29/10 |
10:51 AM |
167.42 |
4.186 |
2.721 |
1.54 |
1.35 |
40 |
230 |
3.109 |
0.544 |
| BX4-1 |
Default |
10/29/10 |
10:52 AM |
431.15 |
10.779 |
5.966 |
1.81 |
1.6 |
40 |
230 |
6.727 |
0.648 |
| BX4-2 |
Default |
10/29/10 |
10:52 AM |
199.28 |
4.982 |
2.807 |
1.77 |
1.67 |
40 |
230 |
2.977 |
0.264 |
For whatever reason, the RNA quality of these samples is very poor. Yield is low and 260/280 ratios are nowhere near the 1.8-2.0 range that I feel comfortable using as clean non-degraded RNA. Fortunately, I still have the second half of the tissue that I saved in RNA-later. The plan is to try extracting one sample set at a time (ie. FL only). One of my worries is that I was trying to extract too many samples at a time with too many other obligations and the protocol was not carried out as fluidly as necessary. The other option is that these samples were received in May (i think) and they were kept in the fridge until I extracted them so the RNA might not be properly preserved and/or they were not properly preserved to begin with.
October 27, 2010
Purification of hard clam hemocytes for RNA isolation
The purpose of this experiment is to isolate a large enough population of hemocytes for RNA extraction to make libraries.
-bled 6 individuals from each site (2-3ml total blood).
-immediately added 3ml seawater w/ pen/strep
-incubated o/n at 12 degrees
-washed 3x seawater w/ pen/strep
-added 3ml seawater w/ pen/strep and looked at the results:
Fig1. MA4 blood plated on polylysine plates at the 17hours. 20X magnification.

Fig2. MA4 hemocytes plated on polylysine plates at 17hours. 40x magnification.
Fig2. BFX1 blood plated on polylysine plates at 17 hours. 20X magnification
October 26, 2010
QPX M. mercenaria Gill tissue challenge
This is a Preliminary experiment to dissect gill tissue and then challenge it with QPX in a test tube and see if we can get any meaningful transcript data out of ti.
We are using three different strains of QPX, S-1, ATTC, and TD8-81, plus a control using just seawater w/o QPX.
Gill tissue from clam BFX 9 was used in all treatments.
Three treatments for each strain
1. QPX in seawater
2. Gill tissue exposed to QPX in seawater.
3. QPX in the presence of gill tissue (After challlenge is complete, Isolate QPX from the supernatent of treatment 2.)
Incubate 24hrs at 37 degrees Celsius.
Spin treatments 1 and 3 at 14k for 10 min to pellet QPX
Add 1ml of TriReagent to treatments 1 and 3, and 5ooml TriReagent to treatment 2 (easier to homogenize later).
Store at -80.
October 15,2010
More TriReagent RNA extractions of M. mercenaria gills from QPX samples (AUGUST/SEPTEMBER...)
Also measured of concentration for RNA samples purified on September 24, 2010
Note: These samples were stored as pellets in 75% ETOH at -80degrees. I spun the pellets down for 5min 12K and resuspended in 50uL DEPC treated water.
October 8, 2010
RNA extractions from pinto abalone larvae. Contiuned from OA treatment October 1, 2010
-For this extraction I am just going to see what kind of yield (both amount and quality) or RNA I can get from pinto abalone larvae. Since I've never done this before and have no idea how much RNA yield to expect, I will be extracting RNA from three different amounts of larvae.
Sample 1: 380pCO2 A
Sample 2: pooled 380pCO2 B&C
Sample 3: pooled 840pCO2 A,B,&C
All samples were taken form september 28, 2010. An individual sample should contain ~50 larvae, so the RNA extraction samples should contain 50, 100, and 150 larvae respectively.
Followed protocol for RNA extraction using TriReagent
Note: homogenized in 200uL before adding additional 800ul of trireagent.
Note: Larvae were stored in RNAlater and float to the top. I tried spinning for 10s at 14k and the larvae only moved partially down the solution. In the future I recommend NOT spinning and leaving the larvae collected at the surface while pipetting the RNAlater out from the bottom.
| Results! |
||||||||||||
| Sample ID |
User ID |
Date |
Time |
ng/ul |
A260 |
A280 |
260/280 |
260/230 |
Constant |
Cursor Pos. |
Cursor abs. |
340 raw |
| AbLarv 1 |
Default |
10/8/10 |
1:18 PM |
8.27 |
0.207 |
0.129 |
1.6 |
0.16 |
40 |
230 |
1.297 |
0.012 |
| AbLarv 2 |
Default |
10/8/10 |
1:19 PM |
21 |
0.525 |
0.348 |
1.51 |
0.14 |
40 |
230 |
3.777 |
0.009 |
| AbLarv 3 |
Default |
10/8/10 |
1:20 PM |
59.71 |
1.493 |
0.922 |
1.62 |
0.5 |
40 |
230 |
2.991 |
0.004 |
-I definitely got RNA, however it is not as clean as I would have hoped. My thought is that I was being a little bit too greedy when I was removing the upper phase after adding chloroform and may have sucked up some debris. I was not expecting this much RNA and wanted every last drop of that upper phase. I'm hoping that by doing this again and not coming as close to the interphase will help clean it up. I can also perform an additional EtOH wash to make sure.
-RNA concentrations are not as linear as expected considering the extractions should represent 50,100, and 150 larvae....in particular the "150" larvae sample is pretty high. This might be because these larvae came from a different treatment group or the jar contained a higher concentration of larvae. I have asked Liza for her larval counts from the samples that we took in parallel to these to get a better estimation of larval quantity.
October 5, 2010
Hard Clam QPX continued...
We will be doing RNA extractions during the Envirophys lab today, so instead of using some random tissue, I will be using some of the gill tissue from the QPX study....why not right?
Today I just prepared the samples by cutting the gill tissue in half as before, and storing it at -80 until next weeks lab to do the RNA extractions.
October 4, 2010
Abalone Antibiotic Challenge:
Note: This experiment is along the same lines as the differential centrifugation experiment with Percoll gradients in that we are trying to selectively isolate pure strains of rickettsia. In this case, we are going to try and utilize the differential antibiotic resistance properties of the three strains.
Approach:
4 treatments x 4reps per treatment.
Treatment 1: inject w/ saline solution (2% NaCl)
Treatment 2: inject w/ clarithromycin (previous resistance shown for "new" strain)
Treatment 3: inject w/ Rifampacin
Treatment 4: inject w/ Erythromycin
Animals:
~100 juvenal red abalone were "incubated" for several months (need to refer back to wetlab notebook for exact time) with 5 adult red abolone known to be infected with all three strains of rickettsia .
- 8 individuals were selected on (refer to histo notes for date) for histo sampling (head, foot, DG, PE). Body weight, shell weight, and shell length were also taken.
- All 8 individuals were positive for the new strain of rickettsia which is what we're most interested in, however, prevalence of the other two strains was varied.
- Refer to Histo notes 10:24-(1-8)
Antibiotic preparation:
Note: Stock concentrations were calculated based on the assumption that we will be injecting abalone with 50ul of solution. Antibiotics are not soluble in water, so a 10x solubilization solution is required. 1:10 dilutions were made by diluting 1ml 10x solution in 9ml 2%saline solutions. 7 aliquots were made (one for each day of the week) and frozen at -20.
| Antibiotic |
Dose |
Stock |
10x |
Solubilize |
| Clarithromycin |
20mg/kg |
5.2mg/ml |
52mg/ml |
EtOH |
| Rifampacin |
2mg/kg |
0.52mg/ml |
5.2mg/ml |
MeOH |
| Erythromycin |
15mg/kg |
3.9mg/ml |
39mg/ml |
MeOH |
- Concentration of stock solutions were calculated from average body weight taken from the 8 pre-sampled individuals:
| # |
TW |
SW |
BW |
| 1 |
15.1 |
4.6 |
10.5 |
| 2 |
14.3 |
4.1 |
10.2 |
| 3 |
16.65 |
4.09 |
12.56 |
| 4 |
20.67 |
5.18 |
15.49 |
| 5 |
13.7 |
6.5 |
7.2 |
| 6 |
20.3 |
5.2 |
15.1 |
| 7 |
15.89 |
3.8 |
12.09 |
| 8 |
28.99 |
8.0 |
20.99 |
Injections:
50ul injections will be preformed daily for 14 days.
This entry is a little bitter sweet because I was hoping to begin injections today but I cannot find clarithromycin. I know we had some when I last looked for it, but since then the fridge has been cleaned so I am assuming that it is sitting somewhere, very well organized, in a place I would never find it.
--ordered 100mg of clarithromycin
October 1, 2010
OA-Pinto abalone
The fine people at our Mukilteo station succeeded at spawning some pinto abalone and we were able to get a fairly generous number of larvae.
Approach x2:
1. Two OA treatments. 380ppm and 840ppm, 6 reps for each system.
2. Two care protocols for each treatment. Water changes everyday, water changes every other day. 3 reps for each system
-Abalone were spawned on 9/23/10 and were put in the OA systems on 9/27/10. Systems started out on a low flow rate to acclimate the larvae to new water and OA conditions.
- First day of sampling began on 9/28/10 and was terminated on 10/1/10
Treatment Breakdown:
380A-C: 380pCO2, H2O Change everyday
380D-F: 380pCO2, H2O Changed everyother day
840A-C: 840pCO2, H2O Change everyday
840D-F: 840pCO2, H2O Change everyday
What are we sampling?
50ml/jar for live/dead analysis
50ml/jar for RNA extraction
(concentration of larvae in the jars is ~1larvae/ml...so in theory, each tube should have 50 larvae)
Sampling Technique:
-Dunk filter up and down to dislodge any larvae that might be stuck to the 100micron screen.
-Use "plunger" to form homogenous mixture of larvae in the jar.
-Submerge 50ml falcon tube to collect sample.
-Samples were kept in cooler with icepacks for transport back to SAFS labs (samples were not "kept on ice" per se, just in a cool environment)
RNA preservation:
-On Days 1&2 of sampling, I had collected larvae in 50ml falcon tubes, brought them back to SAFS, spun them down for 1min, 1000rpm in a swing bucket rotor, sucked off the water, added RNAlater, and transferred to screw cap tube.
-Days 3&4 of sampling, I prefilled screw cap tubes with 1ml RNAlater and took these with me to NMFS. I still took samples using 50ml falcon tubes, except this time I immediately filtered the larvae through a submerged 100 micron filter and pipetted them out directly into the RNA later. I have yet to test the RNA from the two sampling methods but this one is much MUCH easier and I think that the sooner you can get the larvae into RNAlater the better.
-All RNAlater samples are currently being stored at 4 degrees. I hope to do some extractions within the next week, but if not they will be moved to -80degrees.
Sampling results:
-Larvae were beginning to settle by day 3 of sampling thus resulting in lower and lower concentrations of swimming larvae in our samples.
-On the last day of sampling we sampled as usual, but left the jars unhooked from the system for ~3hrs to allow any setting or dead larvae to sink to the bottom. This, hopefully, gave us a pure sample of swimming larvae higher up in the water column. Larvae were then siphoned and pooled from all 6 jars/treatment onto a 100 micron screen and preserved in RNA later. Once my RNA extraction protocol is worked out, this sample should hopefully serve as an RNA pool from a very late time point that can be used to generate a cDNA library.
September 24, 2010
Hard Clam QPX
Note: Sam has already generated some preliminary data on this project.
-Samples 1-3 from CA, MA, and MAX have already been extracted.
- I am going to continue w/ extractions and do a total of 10 samples of gill tissue from each site.
- To get started, I am only going to process a small number of samples since I will also be figuring out where everything is in the lab etc...
- I'll start by extracting RNA from gill tissue samples CA 4-9
RNA extraction using TriReagent:
1. Cut gill tissue in 1/2. Used one half for RNA extraction and placed the other half back at -80 degrees as a backup.
2. Add 300uL TriReagent
3. Homogenize with sterile blue pestle.
5. Incubate at RT for 5min
4. cf for 15', 12,000xg @ 4 degrees.
5. Transfer aqueus phase to new tube
6. Precipitate by adding 500ul Isopropanol
7. Incubate at RT 5min
8. Cf 12,000xg for 8min @ 4 degrees
9. Remove isopropanol and wash with 75% EtOH
10. Spin 5min 12,000xg @ 4 degrees
11. Remove EtOH and add 1ml fresh EtOH
Note: I saw a nice big white pellet so I am going to stop here and store the RNA as a pellet until the remaining samples have caught up to this point before going ahead and solubilizing the RNA for cDNA synthesis.
12. Store at -80 in EtOH as a pellet.
September 2, 2010
Exp: Rickettsia isolation by differential centrifugation:
-I am going to try using a Percoll solution to separate Rickettsia strains based on cell size.
-Why use Percoll? From articles I found using similar methods, Percoll seemed to be the easiest to use in that it forms a self forming gradient upon centrifugation and is also reported to maintain cell viability. This is important if the cell isolation is successful because we would then be able to inject healthy abalone with pure strains of live Rickettsia w/o having to culture the pathogen.
Trial 1:
*Made homogenization buffer: 0.33M Tris-Cl, 0.25M Sucrose
1. Dissect post esophagus from a single infected red abalone.
2. Homogenize in 3ml homogenization buffer w/ a Dounce homogenizer
3. Spin homogenate at 210xg (~1000rpm) for 10' to pellet cell debris
4. Remove supt. and layer it onto 27ml of 30% Percoll
30% Percoll = 9ml Percoll solution, 1ml 1.5M NaCl, 17ml H2O
5. Spin 25,000xg for 1hr
6. Take 1ml fractions and stain w/ hemastain kit.
Look
Results:
1. Differential centrifugation resulted in 4 distinct visual layers.
~5ml upper layer of clear liquid
~5ml middle layer opaque liquid
~1ml disctinct debris layer that was located ~10ml down the gradient...presumably the leading edge of the homogenate
~ remaining clear liquid
2. Cells only appeared in the 1ml "debris" layer
3. Difficult to distinguish rickettsia from everything else.
Future Exp: Repeat as before but spin Percoll gradient for 2hrs. Isolate "debris" layer, and spin again for 2-3hrs in a 40% percoll gradient.