Links to python notebooks:
Mesodesma donacium:http://nbviewer.ipython.org/url/eagle.fish.washington.edu/scaphapoda/Grace/nb/M.%20donacium%20Simplified%20Notebook.ipynb
Template version:
http://nbviewer.ipython.org/url/eagle.fish.washington.edu/scaphapoda/Grace/nb/M.%20donacium%20Simplified%20Notebook-Templateversion.ipynb
Egrep of vitellogenin and vitellin included:
http://nbviewer.ipython.org/url/eagle.fish.washington.edu/scaphapoda/Grace/Transcriptomes/mdonacium/M.%20donacium%20Simplified%20Notebook_v.ipynb
Mercenaria mercenaria (Hard Clam): (Still need to find source of transcriptome)
http://nbviewer.ipython.org/url/eagle.fish.washington.edu/scaphapoda/Grace/nb/M.%20mercenaria%20Simplified%20Notebook.ipynb
Template version:
http://nbviewer.ipython.org/url/eagle.fish.washington.edu/scaphapoda/Grace/nb/M.%20mercenaria%20Simplified%20Notebook-Templateversion.ipynb
Egrep of vitellogenin and vitellin included:
http://nbviewer.ipython.org/url/eagle.fish.washington.edu/scaphapoda/Grace/Transcriptomes/mercenaria/M.%20mercenaria%20Simplified%20Notebook_v.ipynb
Ruditapes philippinarum (Manila Clam):
http://nbviewer.ipython.org/url/eagle.fish.washington.edu/scaphapoda/Grace/Transcriptomes/rphilippinarum/R.%20philippinarum%20Blast%20%20(1).ipynb
Template version:
http://nbviewer.ipython.org/url/eagle.fish.washington.edu/scaphapoda/Grace/Transcriptomes/rphilippinarum/R.%20philippinarum%20Blast_%20Template%20Version.ipynb
Egrep of vitellogenin and vitellin included:
http://nbviewer.ipython.org/url/eagle.fish.washington.edu/scaphapoda/Grace/Transcriptomes/rphilippinarum/R.%20philippinarum%20Blast_v.ipynb
Wednesday, March 11, 2015
Today I finished up staging the male geoduck histology slides.mG##_s#_#x
m --> male
G## --> geoduck individual identifying number: this number correlates to the tissue samples in the histology cassettes marked with the same number AND with the hemolymph and tissue samples marked with the same number in the -80˚ freezer boxes labeled "Geoduck Tissue Samples"
s# --> stage of reproductive development
#x --> magnification of microscope that picture was taken at
Link to "Male Staging Pictures" folder -->
Male Staging Pictures/ - Mar 11 2015 05:10:24 PM
Spreadsheet with information on MALE geoduck histology slide staging criteria.
Link to spreadsheet -->
MaleStagingSpreadsheet.xlsx 40KB Mar 11 2015 05:06:04 PM
Link to public google doc spreadsheet --> Male Staging
Monday, March 9, 2015
I have been figuring how to stage the histology slides the entire time since I last posted. I have now uploaded the FEMALE geoduck histology slide pictures into my scaphapoda directory and each geoduck histology slide has three representative pictures: one each at 4x, 10x, and 40x. Each picture is labeled in the following general format:fG##_s#_#x
f --> female
G## --> geoduck individual identifying number: this number correlates to the tissue samples in the histology cassettes marked with the same number AND with the hemolymph and tissue samples marked with the same number in the -80˚ freezer boxes labeled "Geoduck Tissue Samples"
s# --> stage of reproductive development
#x --> magnification of microscope that picture was taken at
Link to "Female Staging Pictures" folder-->
Female Staging Pictures/ - Mar 09 2015 03:47:44 PM
I also created a spreadsheet with the information on the FEMALE geoduck histology slide staging criteria.
Link to spreadsheet (Excel)-->
FemaleStagingSpreadsheet.xlsx 44KB Mar 20 2015 05:35:15 PM
Link to public google doc spreadsheet -->Female Staging
Monday, January 26, 2015
I looked at histology slides again today trying to figure out a good way to compare oocyte sizes that would allow me to use some form of data analysis. What I was doing on January 12th was hard for me to understand how I would go about doing any kind of data analysis.So what I did today, which I'm not sure will work but is just something I'm trying out, is that I measured the size of 15 randomly-selected follicles in Geo-24 (female) and in each of those follicles, I measure the 5 largest oocytes. I then averaged the 5 oocyte measurements so that each follicle had one averaged oocyte size associated with it. Below is the graph of the follicle size versus the oocyte averaged size.
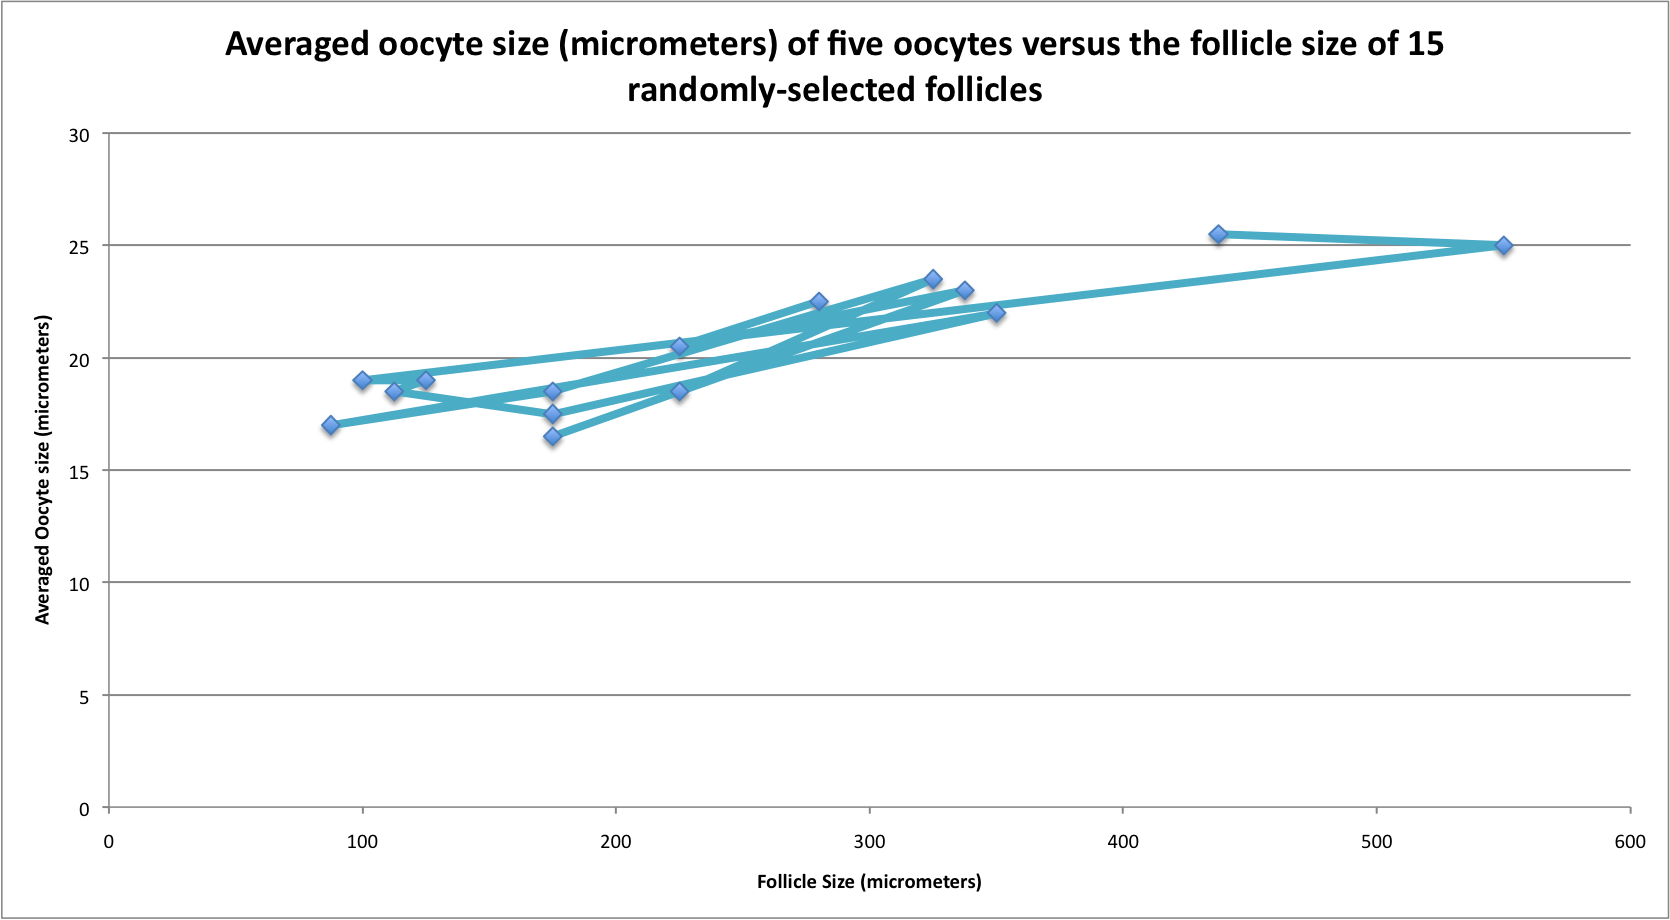
This graph is kind of hard to look at and I'm not really sure what to do from here or with this information, but I will be consulting Brent/Steven as soon as I see them next.
Friday, January 16, 2015
Geoduck dissections (possibly the last batch)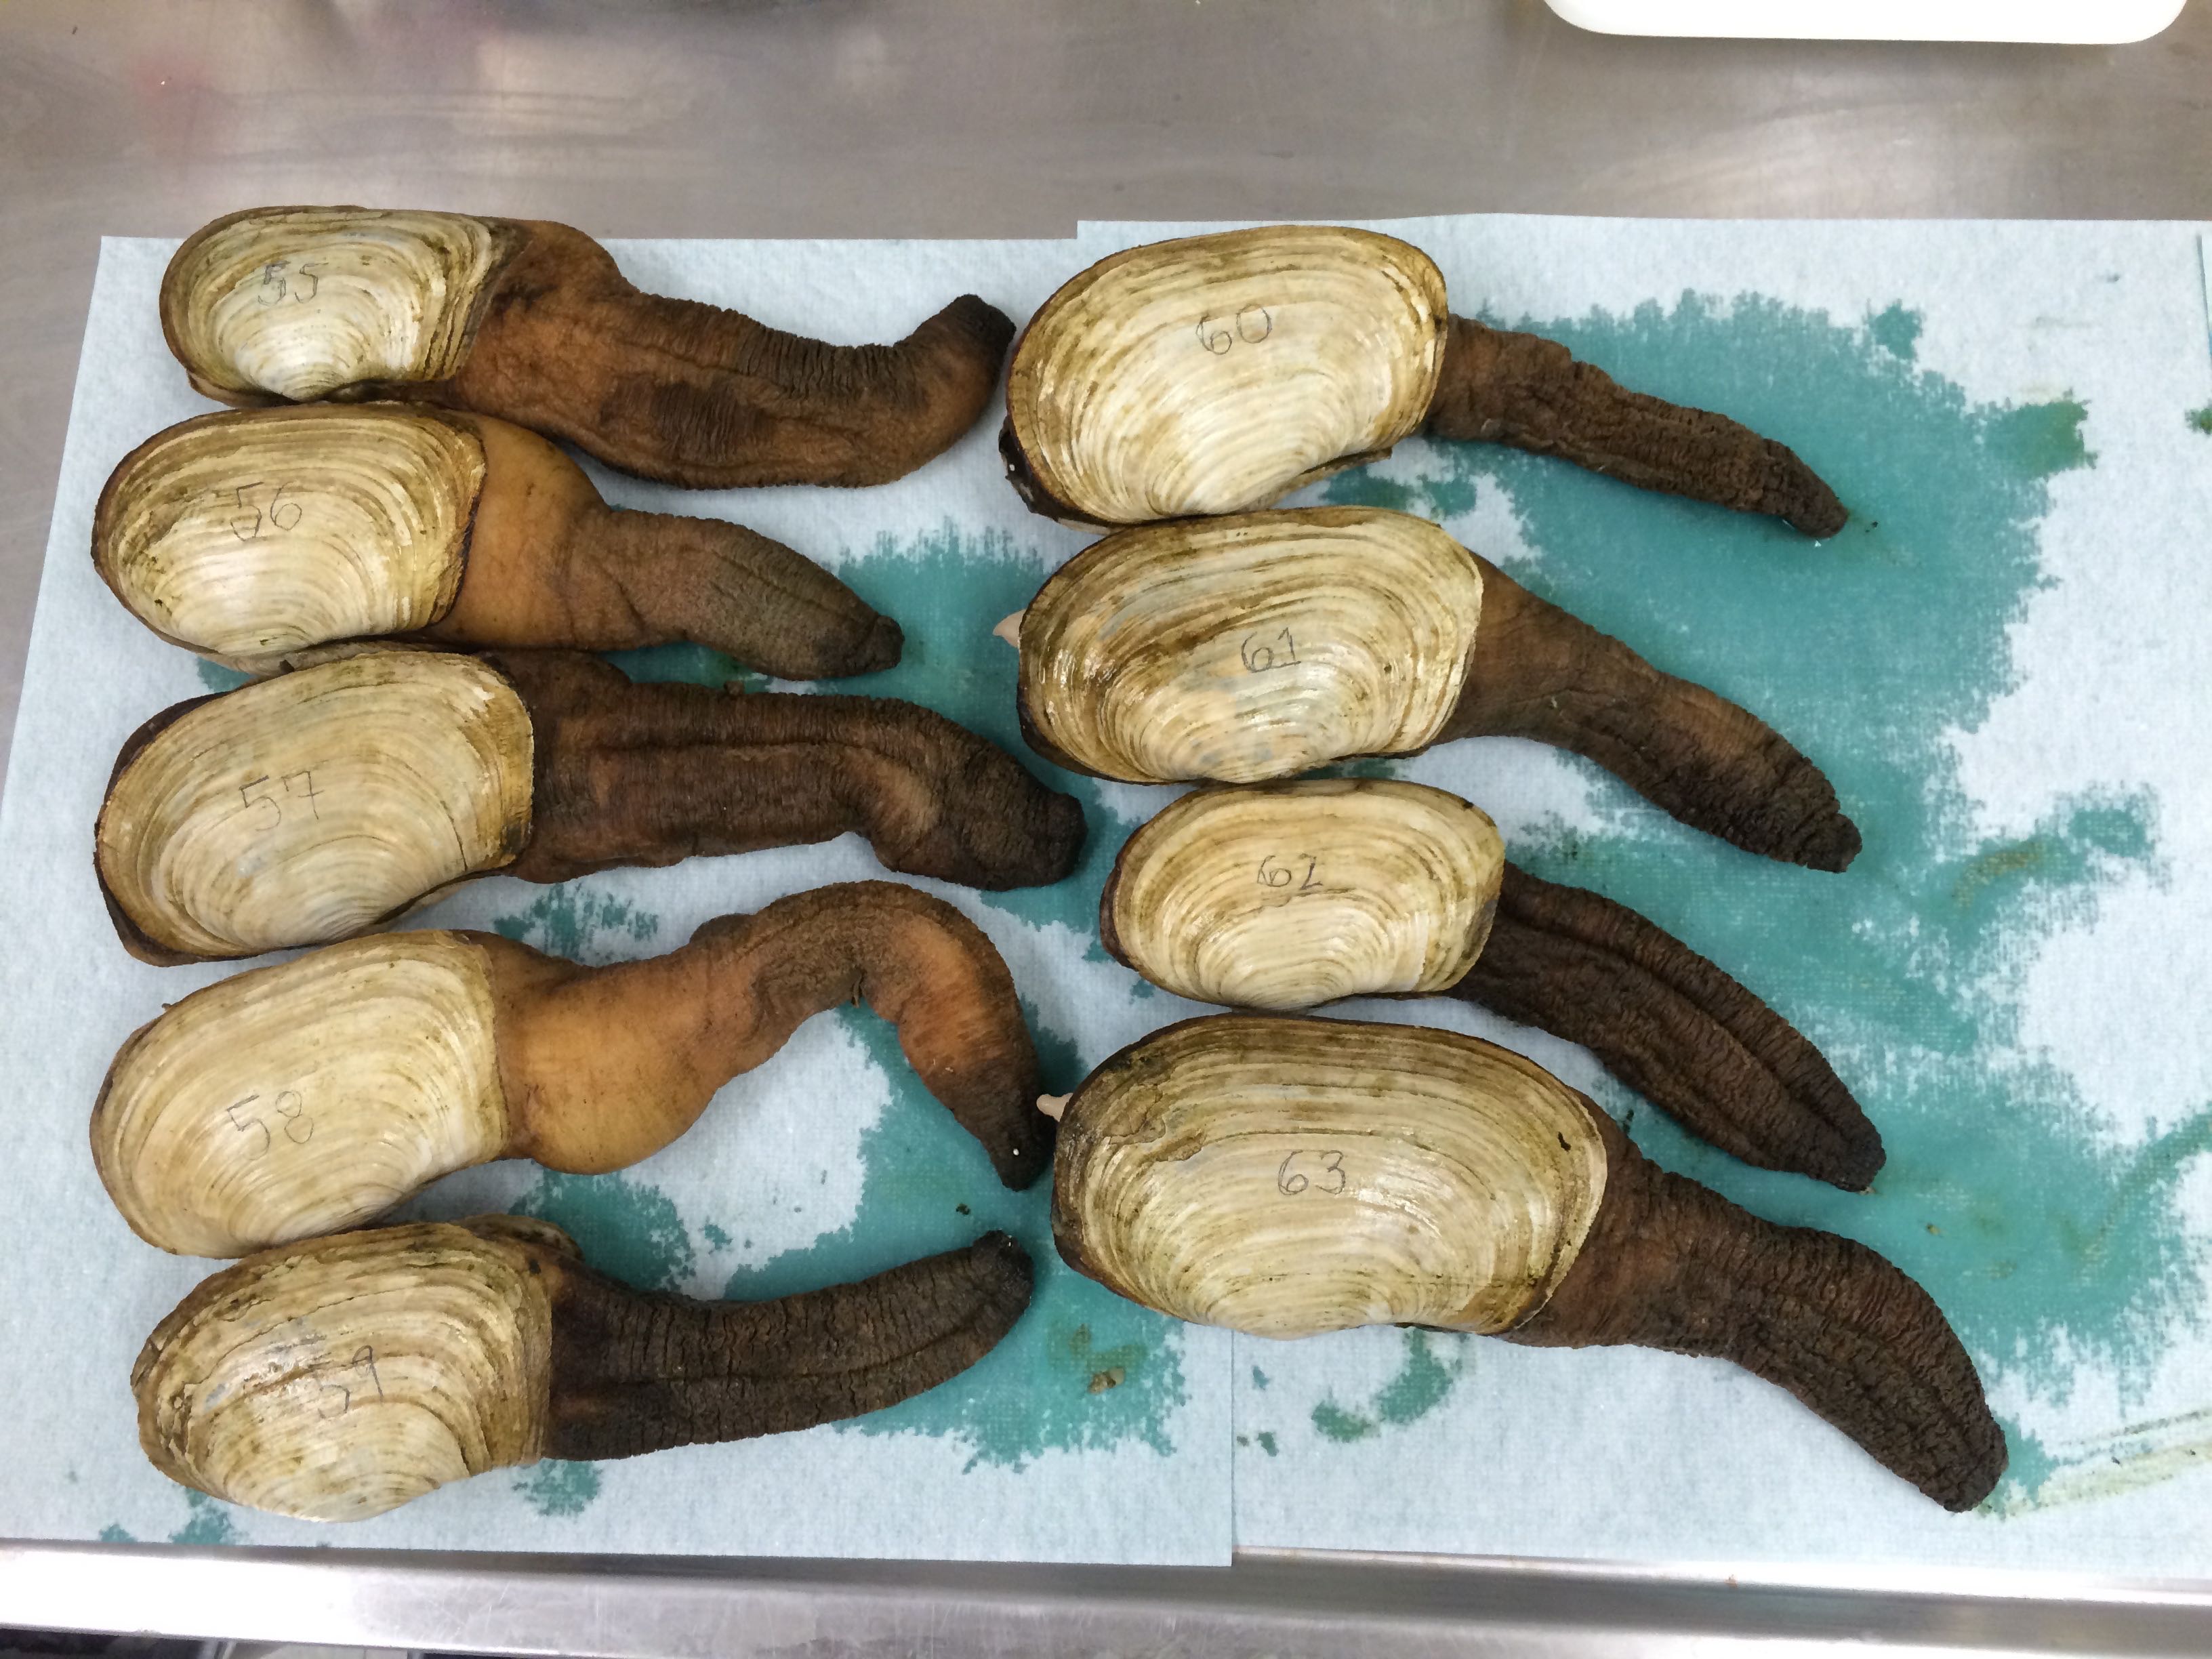
Geo-55 through Geo-63 (I forgot to take a picture of Geo-64 through Geo-70)
They were all similar in size. Since there were 16 to dissect and I'm used to doing 8 per week, I did two sets of dissections separated into two groups of 8 so that there wouldn't be some geoducks sitting out for much longer than the others.
| Label |
Weight (g) |
Length |
Notes |
| Geo-55 |
1002.5 |
143 |
gonads less creamy than previous experiences |
| Geo-56 |
1138.6 |
140 |
|
| Geo-57 |
1271.3 |
154 |
|
| Geo-58 |
1158.5 |
141 |
gonads less creamy |
| Geo-59 |
793.1 |
141 |
|
| Geo-60 |
1175.2 |
162 |
|
| Geo-61 |
1073.6 |
164 |
|
| Geo-62 |
629.2 |
135 |
|
| Geo-63 |
1337.2 |
174 |
|
| Geo-64 |
1379.6 |
146 |
|
| Geo-65 |
1148.5 |
137 |
|
| Geo-66 |
1218.0 |
160 |
gonads less creamy |
| Geo-67 |
961.5 |
131 |
|
| Geo-68 |
1138.9 |
155 |
|
| Geo-69 |
859.7 |
115 |
|
| Geo-70 |
1222.5 |
138 |
smelly, black liquid |
Wednesday, January 14, 2015
Today I drove to Quilcene, WA to Taylor Shelffish Hatchery and got 16 geoducks for dissections on Friday.Monday, January 12, 2015
Today I started measuring oocyte cell size. I'm trying to figure out what will be the most accurate. Today I tried measuring the sizes of the five largest oocytes in 10 randomly selected follicles of Geo-24 Histology slide. The graph below shows what the average oocyte cell sizes are for the ten follicles. I think I will have to keep playing around with this data collection until I figure out a good number of follicles and/or oocytes to measure.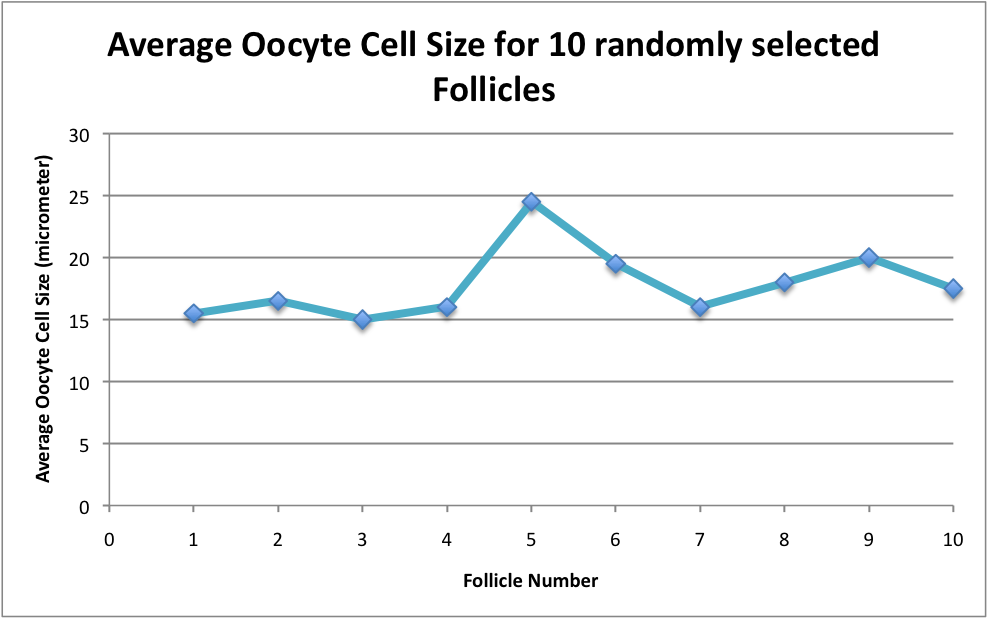
Friday, January 9, 2015
Today I organized some pictures that I had previously taken of the histology slides.I then calibrated the reticle using a hemocytometer.
(r.u. = reticle unit) (um = micrometers)
@ 4x
10 r.u. =0.25 mm -->
1 r.u. = 25 um
@ 10x
25 um/r.u. * (4x/10x) =
1 r.u. = 10um
@ 40x
25 um/r.u. * (4x/40x) =
1 r.u. = 2.5 um
Hemocytometer information:
http://www.hemocytometer.org/2013/04/11/hemocytometer-square-size/
Calibrating a reticle calculations:
http://www.austincc.edu/biocr/1406/labm/ex4/prelab_4_1.htm
I will now start the process of measuring the oocytes and acini of the histology slides to compare the changes more quantitatively.
Saturday, January 3, 2015
Switched Tissue FIX with Tissue STABILIZER.NOTE: New type of PAXgene Tissue FIX and Tissue STABILIZER bottles. Each bottle can only hold one cassette at a time. The bottle is separated into two chambers. One side is the Tissue FIX, the other is the Tissue STABILIZER. I made a mistake and didn't realize that the two chambers contained the two different solutions. I thought that they just decided to make it so that each bottle could only hold two cassettes each, and so only half of the samples for this day were fixed.
Friday, January 2, 2015
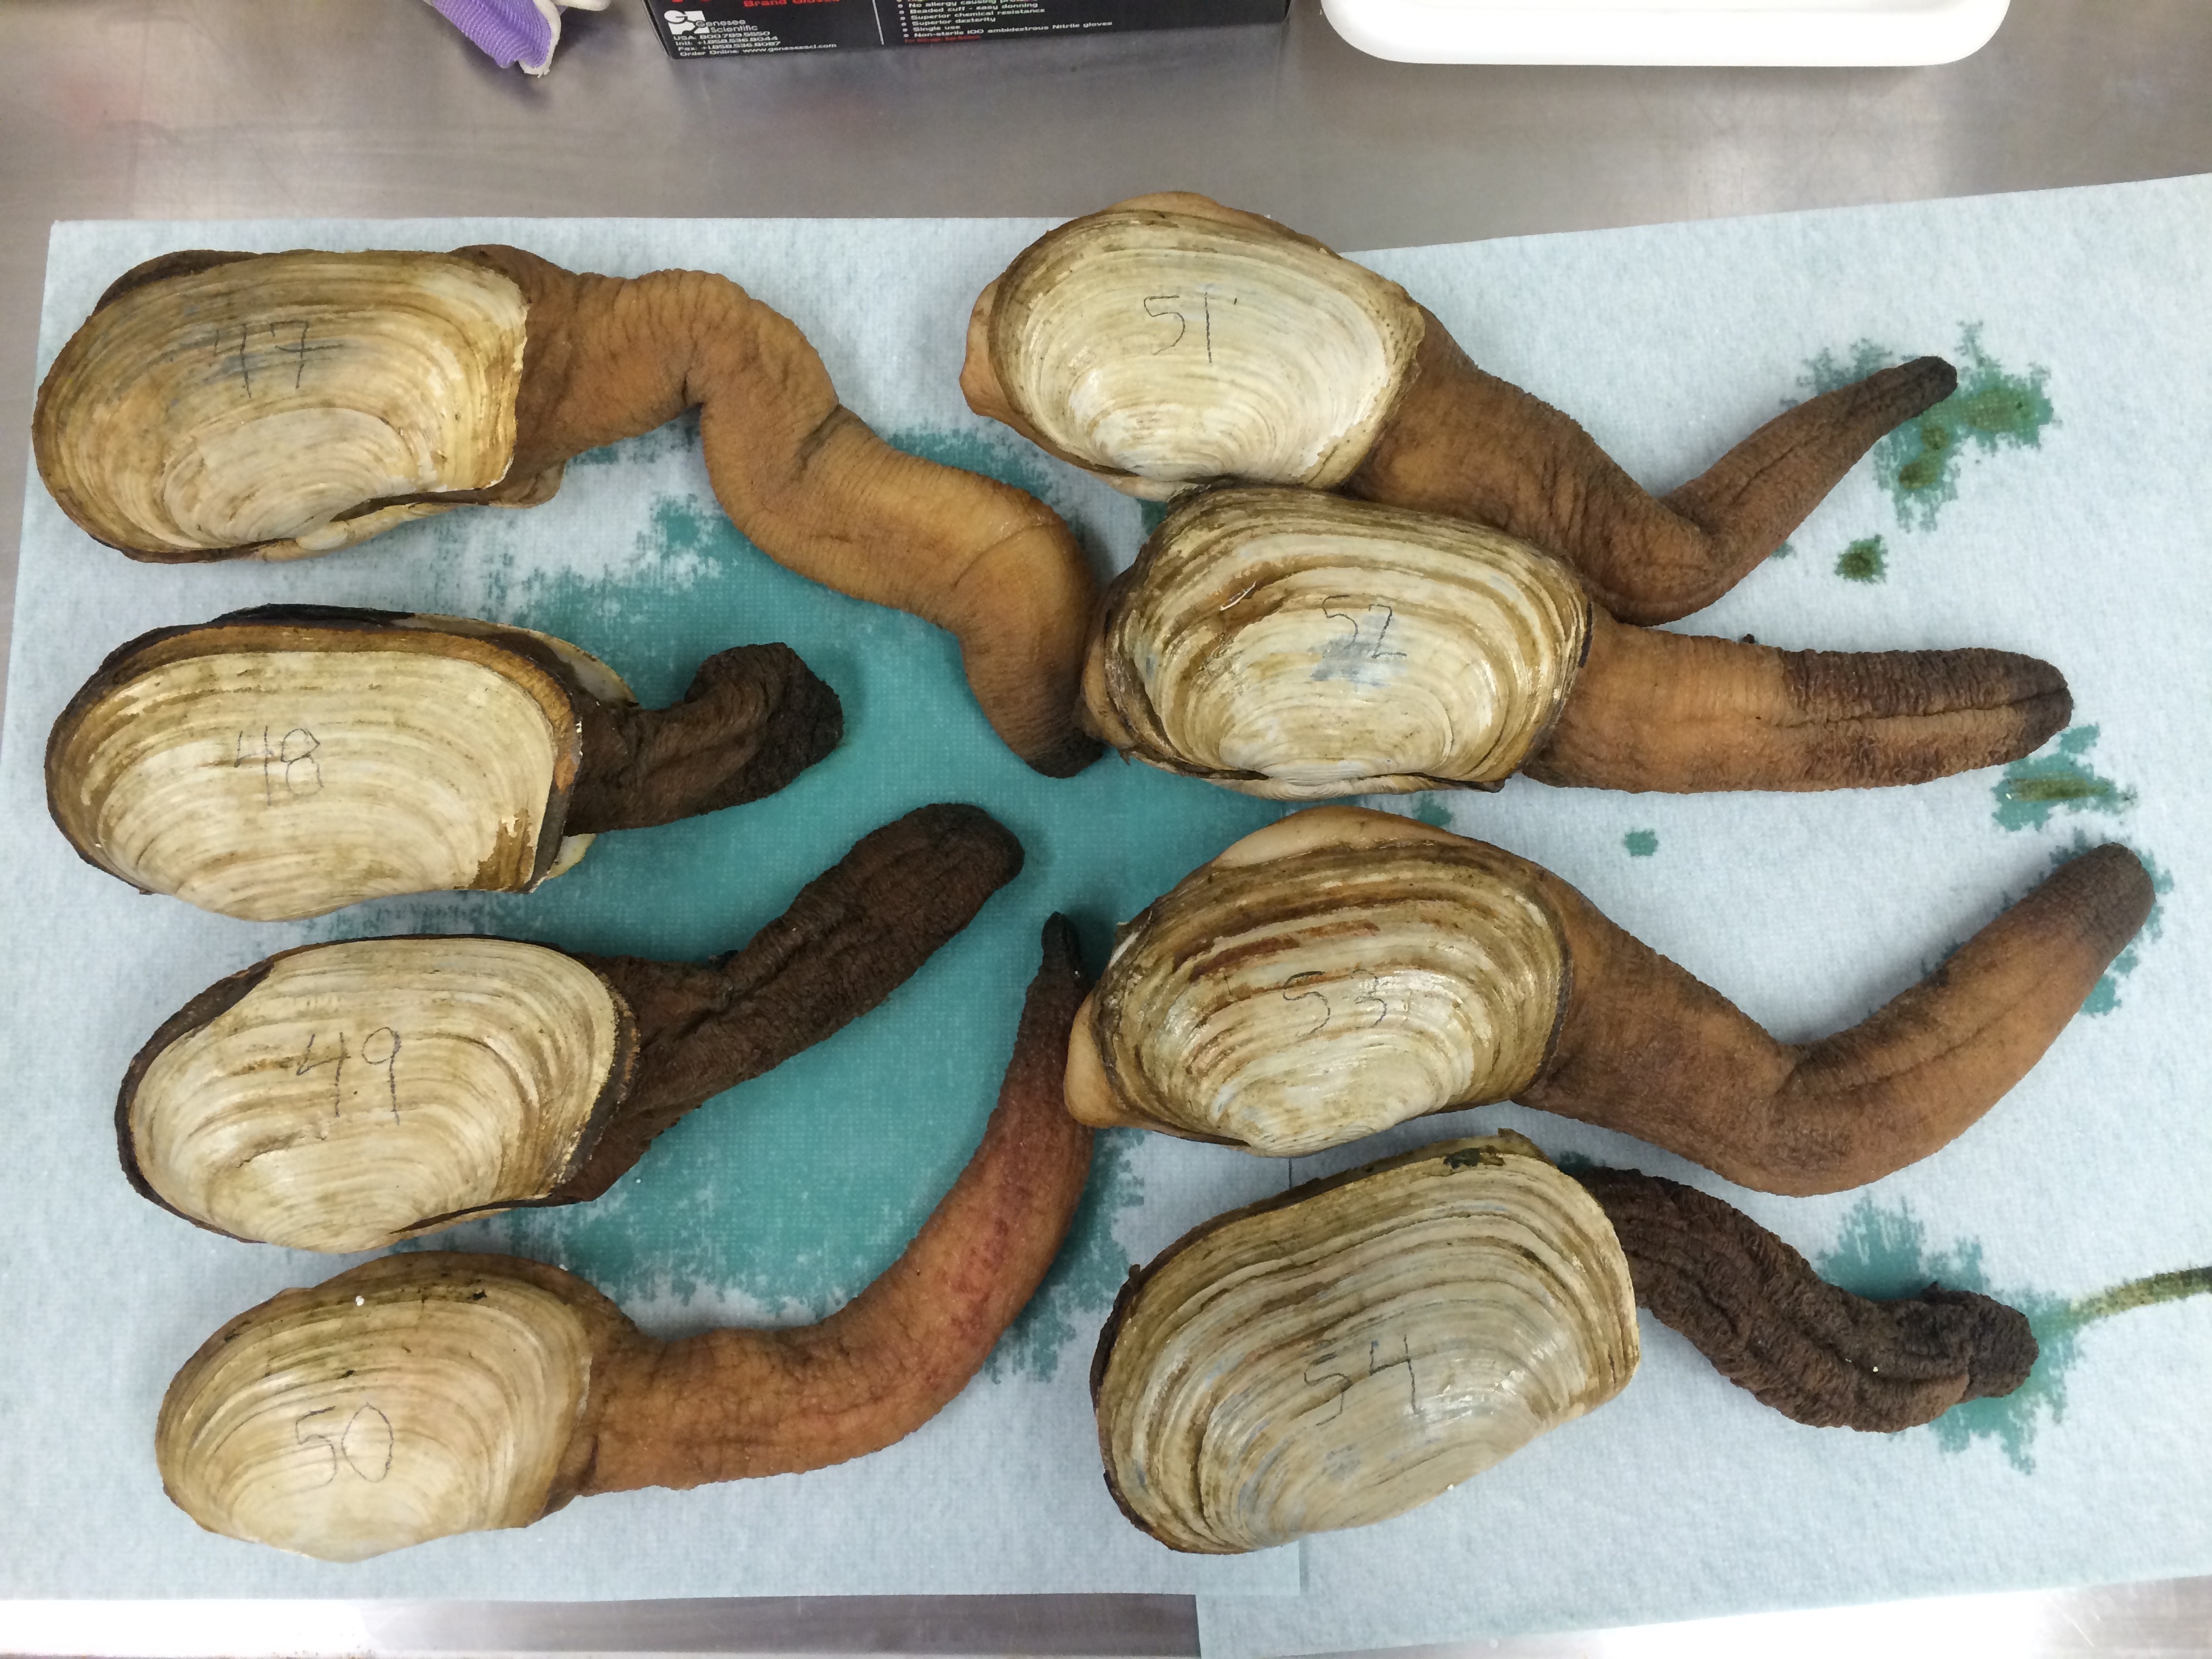
| Label |
Weight (g) |
Length |
Hemolymph? |
Notes |
| Geo-47 |
1509.4 |
171 |
yes |
|
| Geo-48 |
1231.1 |
177 |
yes |
|
| Geo-49 |
1215.6 |
164 |
yes |
|
| Geo-50 |
830.2 |
143 |
yes |
|
| Geo-51 |
1144.6 |
146 |
yes |
|
| Geo-52 |
1474.5 |
160 |
yes |
|
| Geo-53 |
1511.3 |
155 |
yes - took two samples... one probably isn't hemolymph |
|
| Geo-54 |
1330.0 |
173 |
yes |
Friday, December 19, 2014
Switched tissues to STABILIZER.Looked at histology slides more.
NOTE: New type of PAXgene Tissue FIX and Tissue STABILIZER bottles. Each bottle can only hold one cassette at a time. The bottle is separated into two chambers. One side is the Tissue FIX, the other is the Tissue STABILIZER. I made a mistake and didn't realize that the two chambers contained the two different solutions. I thought that they just decided to make it so that each bottle could only hold two cassettes each, and so only half of the samples for this day were fixed.
Thursday, December 18, 2014
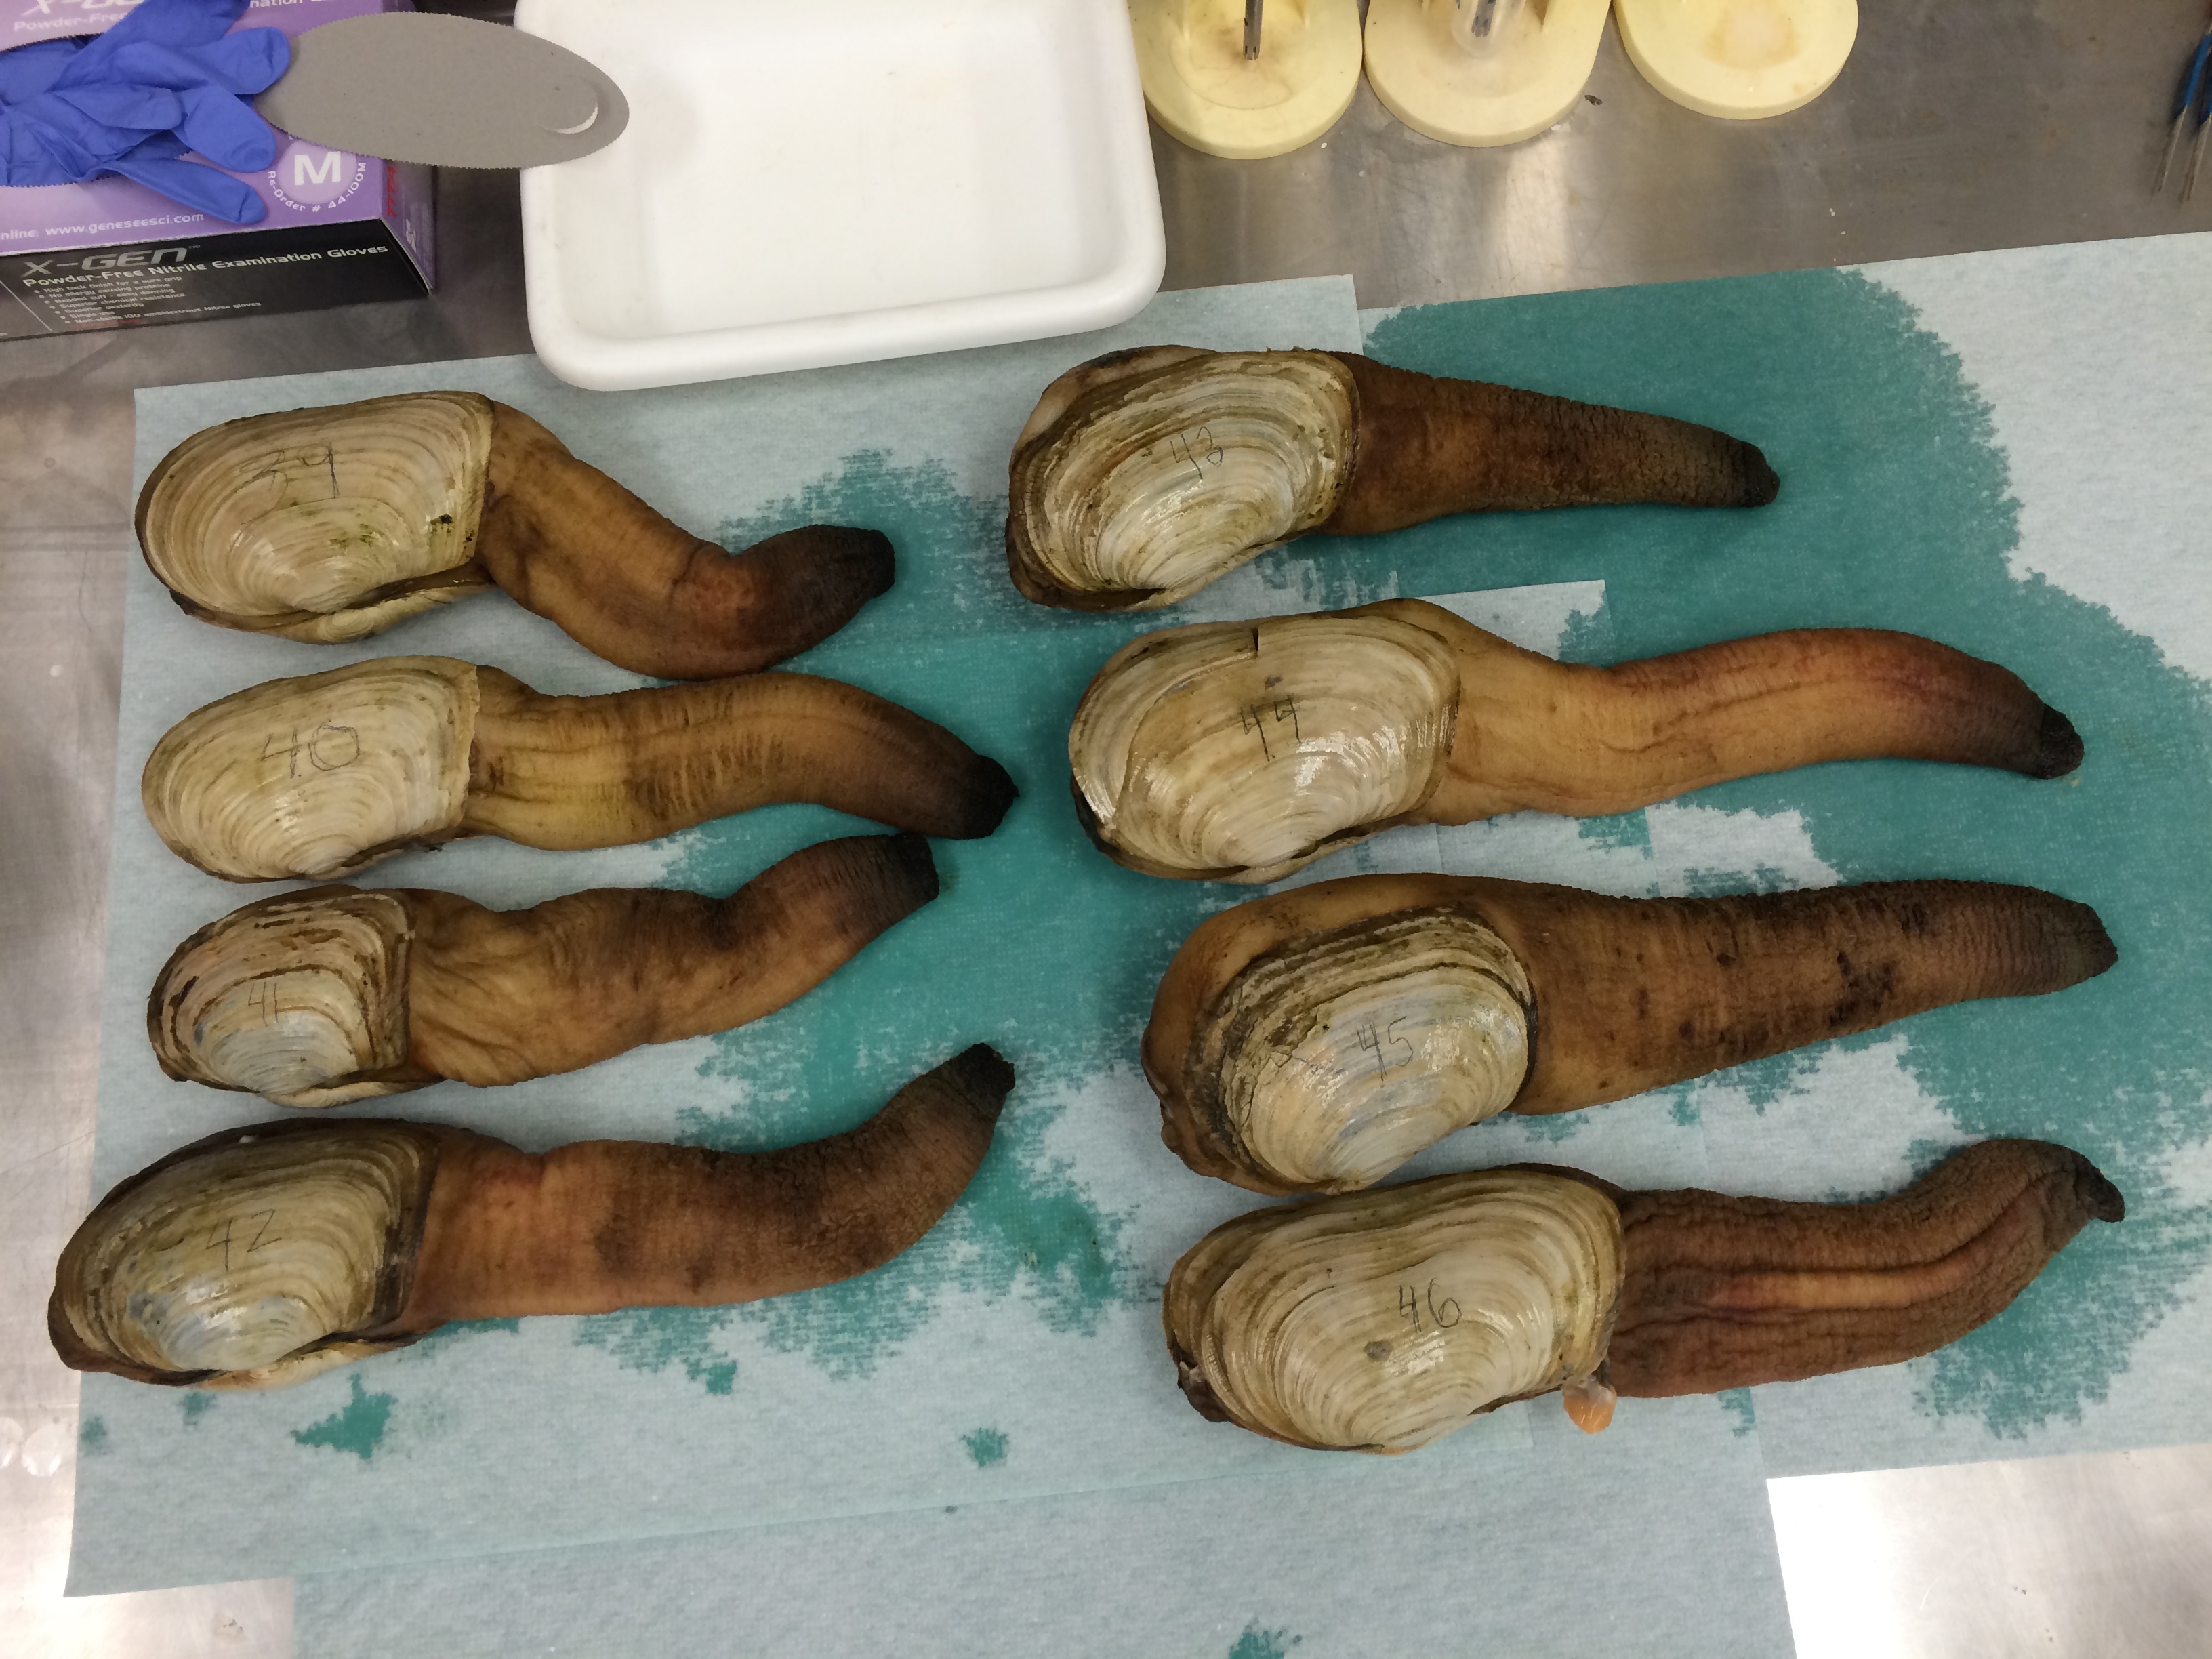
| Label |
Weight (g) |
Length |
Hemolymph? |
Notes |
| Geo-39 |
714.3 |
135 |
yes- reddish brown, maybe not hemolymph |
geoduck: smaller siphon comparatively |
| Geo-40 |
523.3 |
127 |
yes - clear |
siphon limp |
| Geo-41 |
601.2 |
106 |
yes |
|
| Geo-42 |
910.9 |
127 |
yes - brownish yellow |
|
| Geo-43 |
872.2 |
138 |
yes |
|
| Geo-44 |
989.8 |
140 |
yes- yellowish |
|
| Geo-45 |
1058.7 |
124 |
probably not- black liquid |
crushed shell |
| Geo-46 |
699.1 |
152 |
yes |
shell damage - internal tissues are on outside |
NOTE: New type of PAXgene Tissue FIX and Tissue STABILIZER bottles. Each bottle can only hold one cassette at a time. The bottle is separated into two chambers. One side is the Tissue FIX, the other is the Tissue STABILIZER. I made a mistake and didn't realize that the two chambers contained the two different solutions. I thought that they just decided to make it so that each bottle could only hold two cassettes each, and so only half of the samples for this day were fixed.
Friday, December 12, 2014
Switched out PAXgene Tissue FIX with PAXgene Tissue STABILIZER.Also looked at histology slides and am in the process of organizing them into categories. Will post later.
Thursday, December 11, 2014
Only six geoducks were delivered today. Not sure of the reason.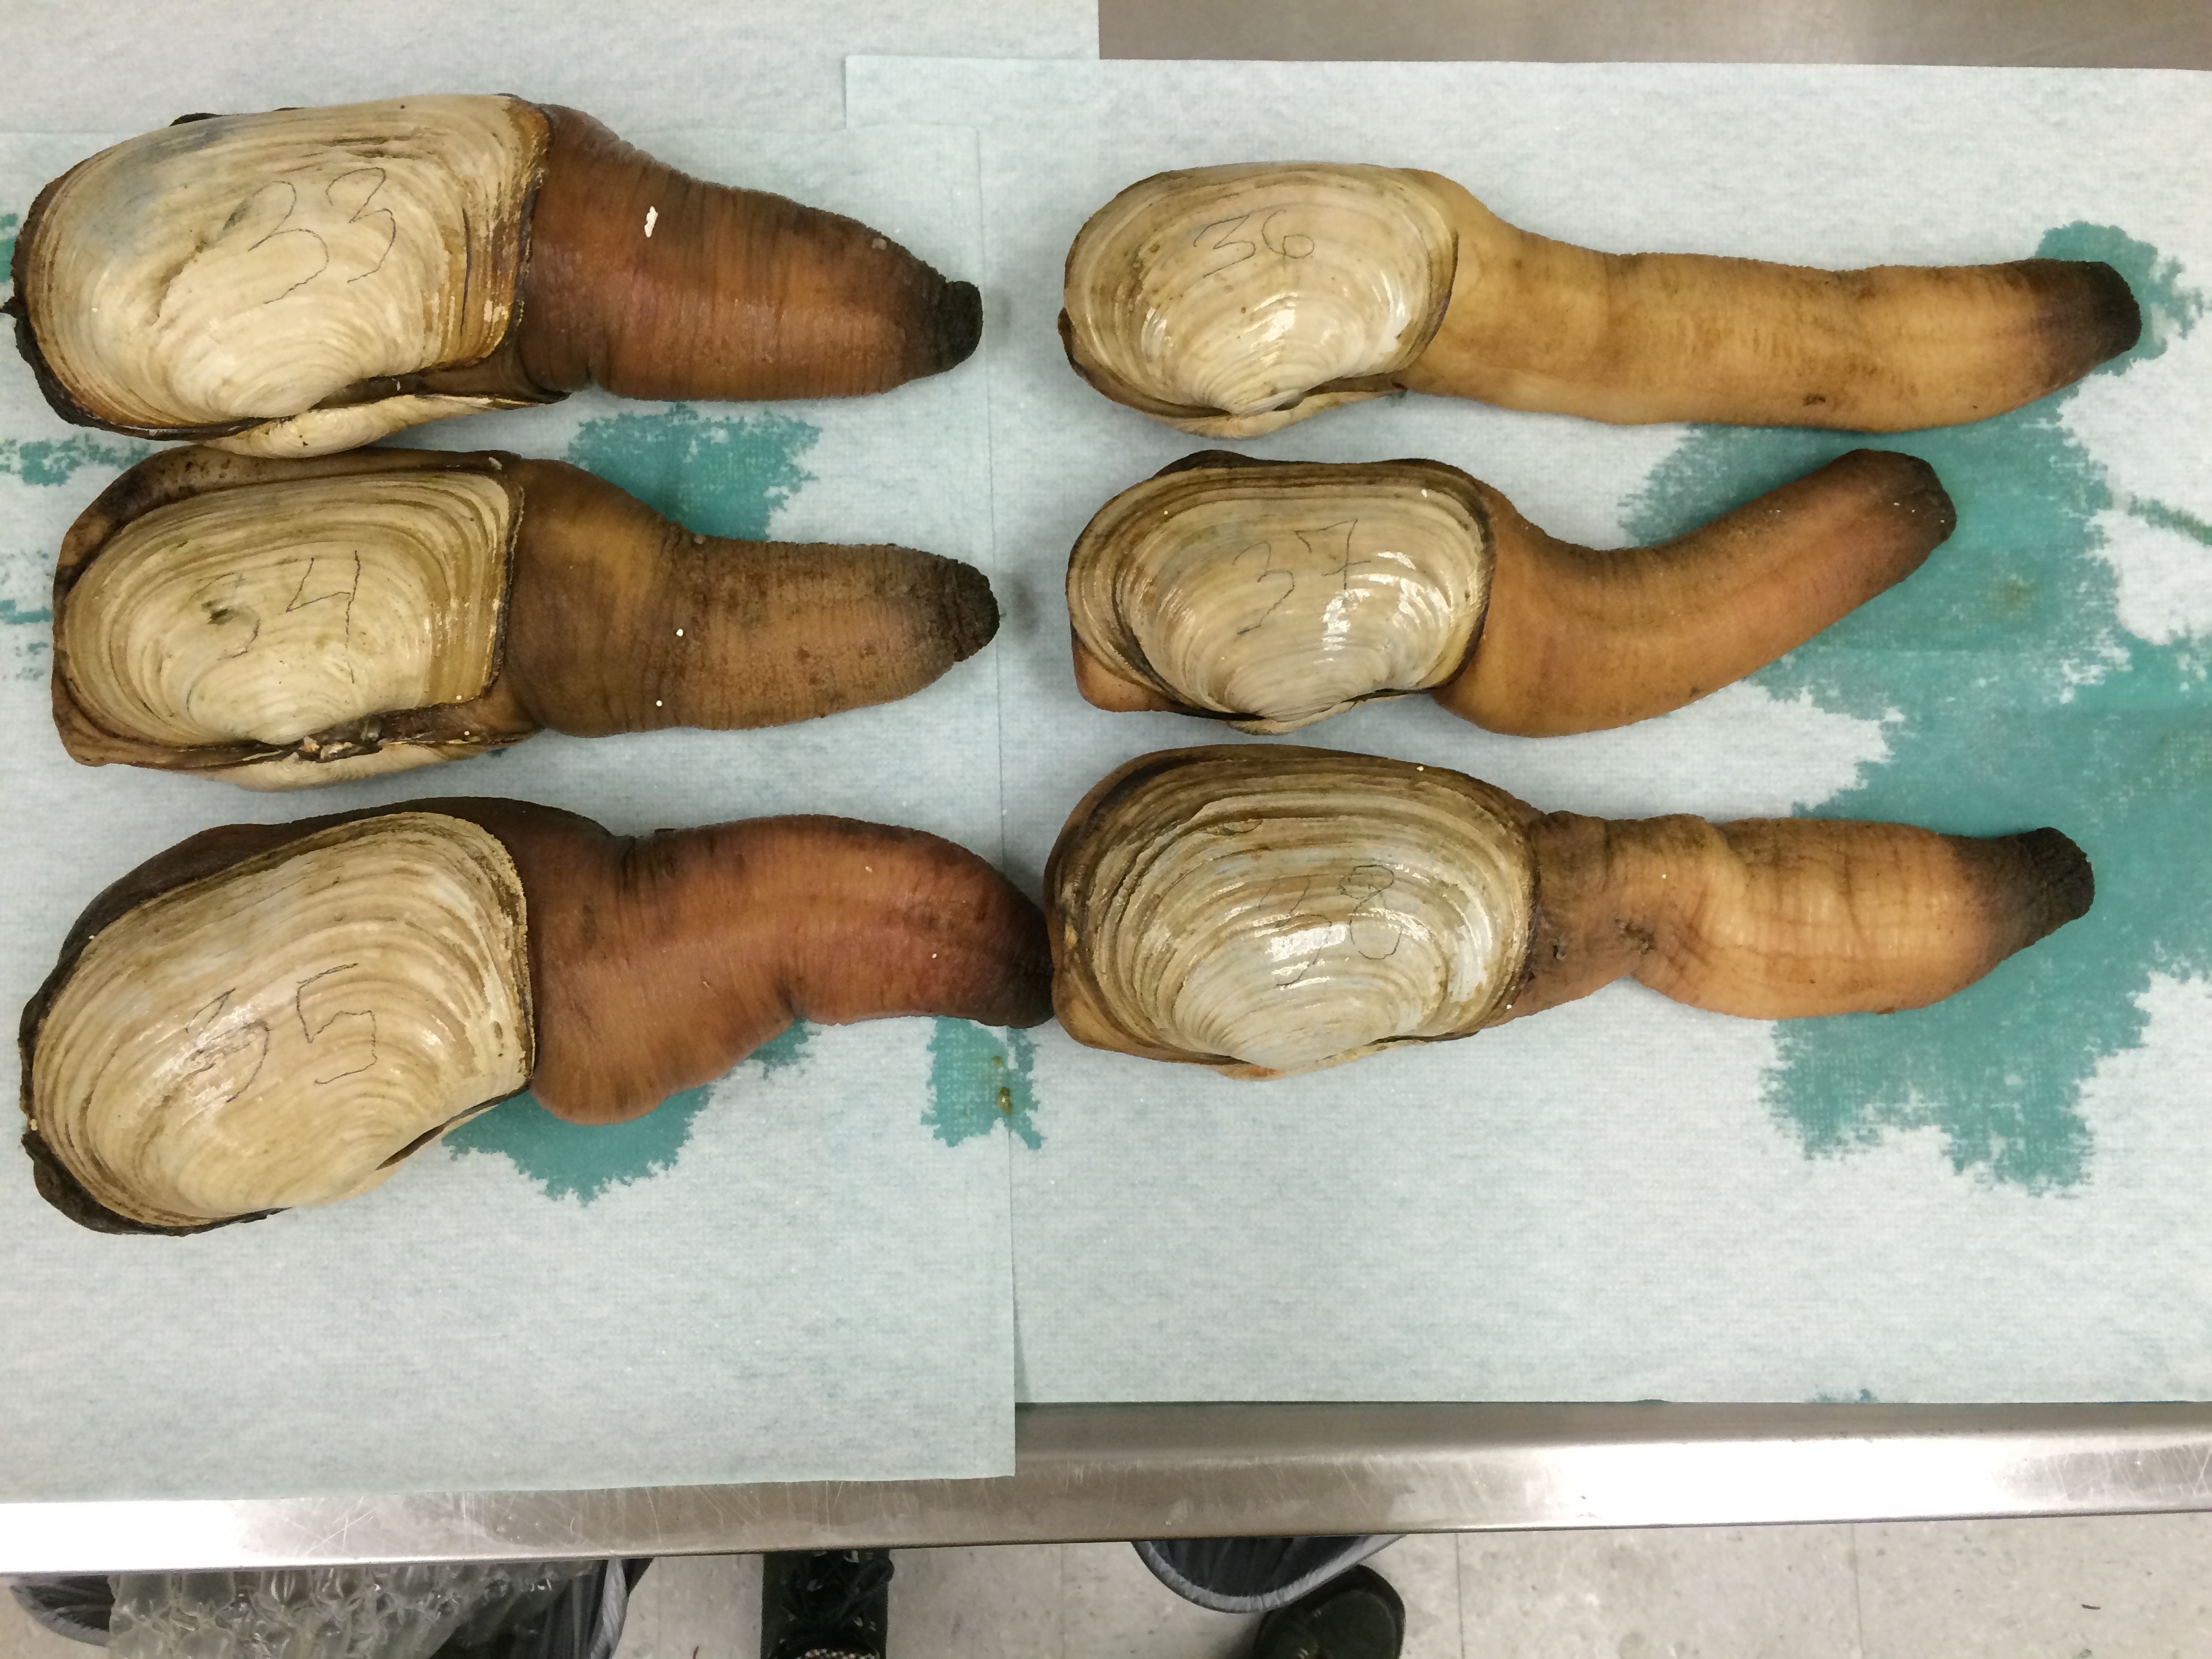
| Label |
Weight (g) |
Length |
Hemolymph? |
Notes |
| Geo-33 |
1643.1 |
178 |
yes |
|
| Geo-34 |
1219.9 |
149 |
no |
pretty sure it bled out... most likely not hemolymph that was extracted |
| Geo-35 |
1589.1 |
158 |
yes |
|
| Geo-36 |
895.4 |
128 |
yes |
small shell, very long siphon, brittle |
| Geo-37 |
909.0 |
136 |
no |
fairly confident that i didn't extract hemolymph |
| Geo-38 |
1182.1 |
144 |
yes |
Friday, December 5, 2014
Today I have been reading more about Geoducks and other research performed on them. Analysis of frozen Geoduck gonad tissue samples will begin soon.Thursday, December 4, 2014
Today I came in and switched out the PAXgene Tissue FIX solution with the PAXgene Tissue STABILIZER solution and placed the samples in the refrigerator.Wednesday, December 3, 2014
Today I dissected 8 more Geoducks. We did it today instead of Friday because Molly was only able to pick them up on Tuesday. These particular geoducks were taken out of the water on Monday, December 1, 2014 at 4pm.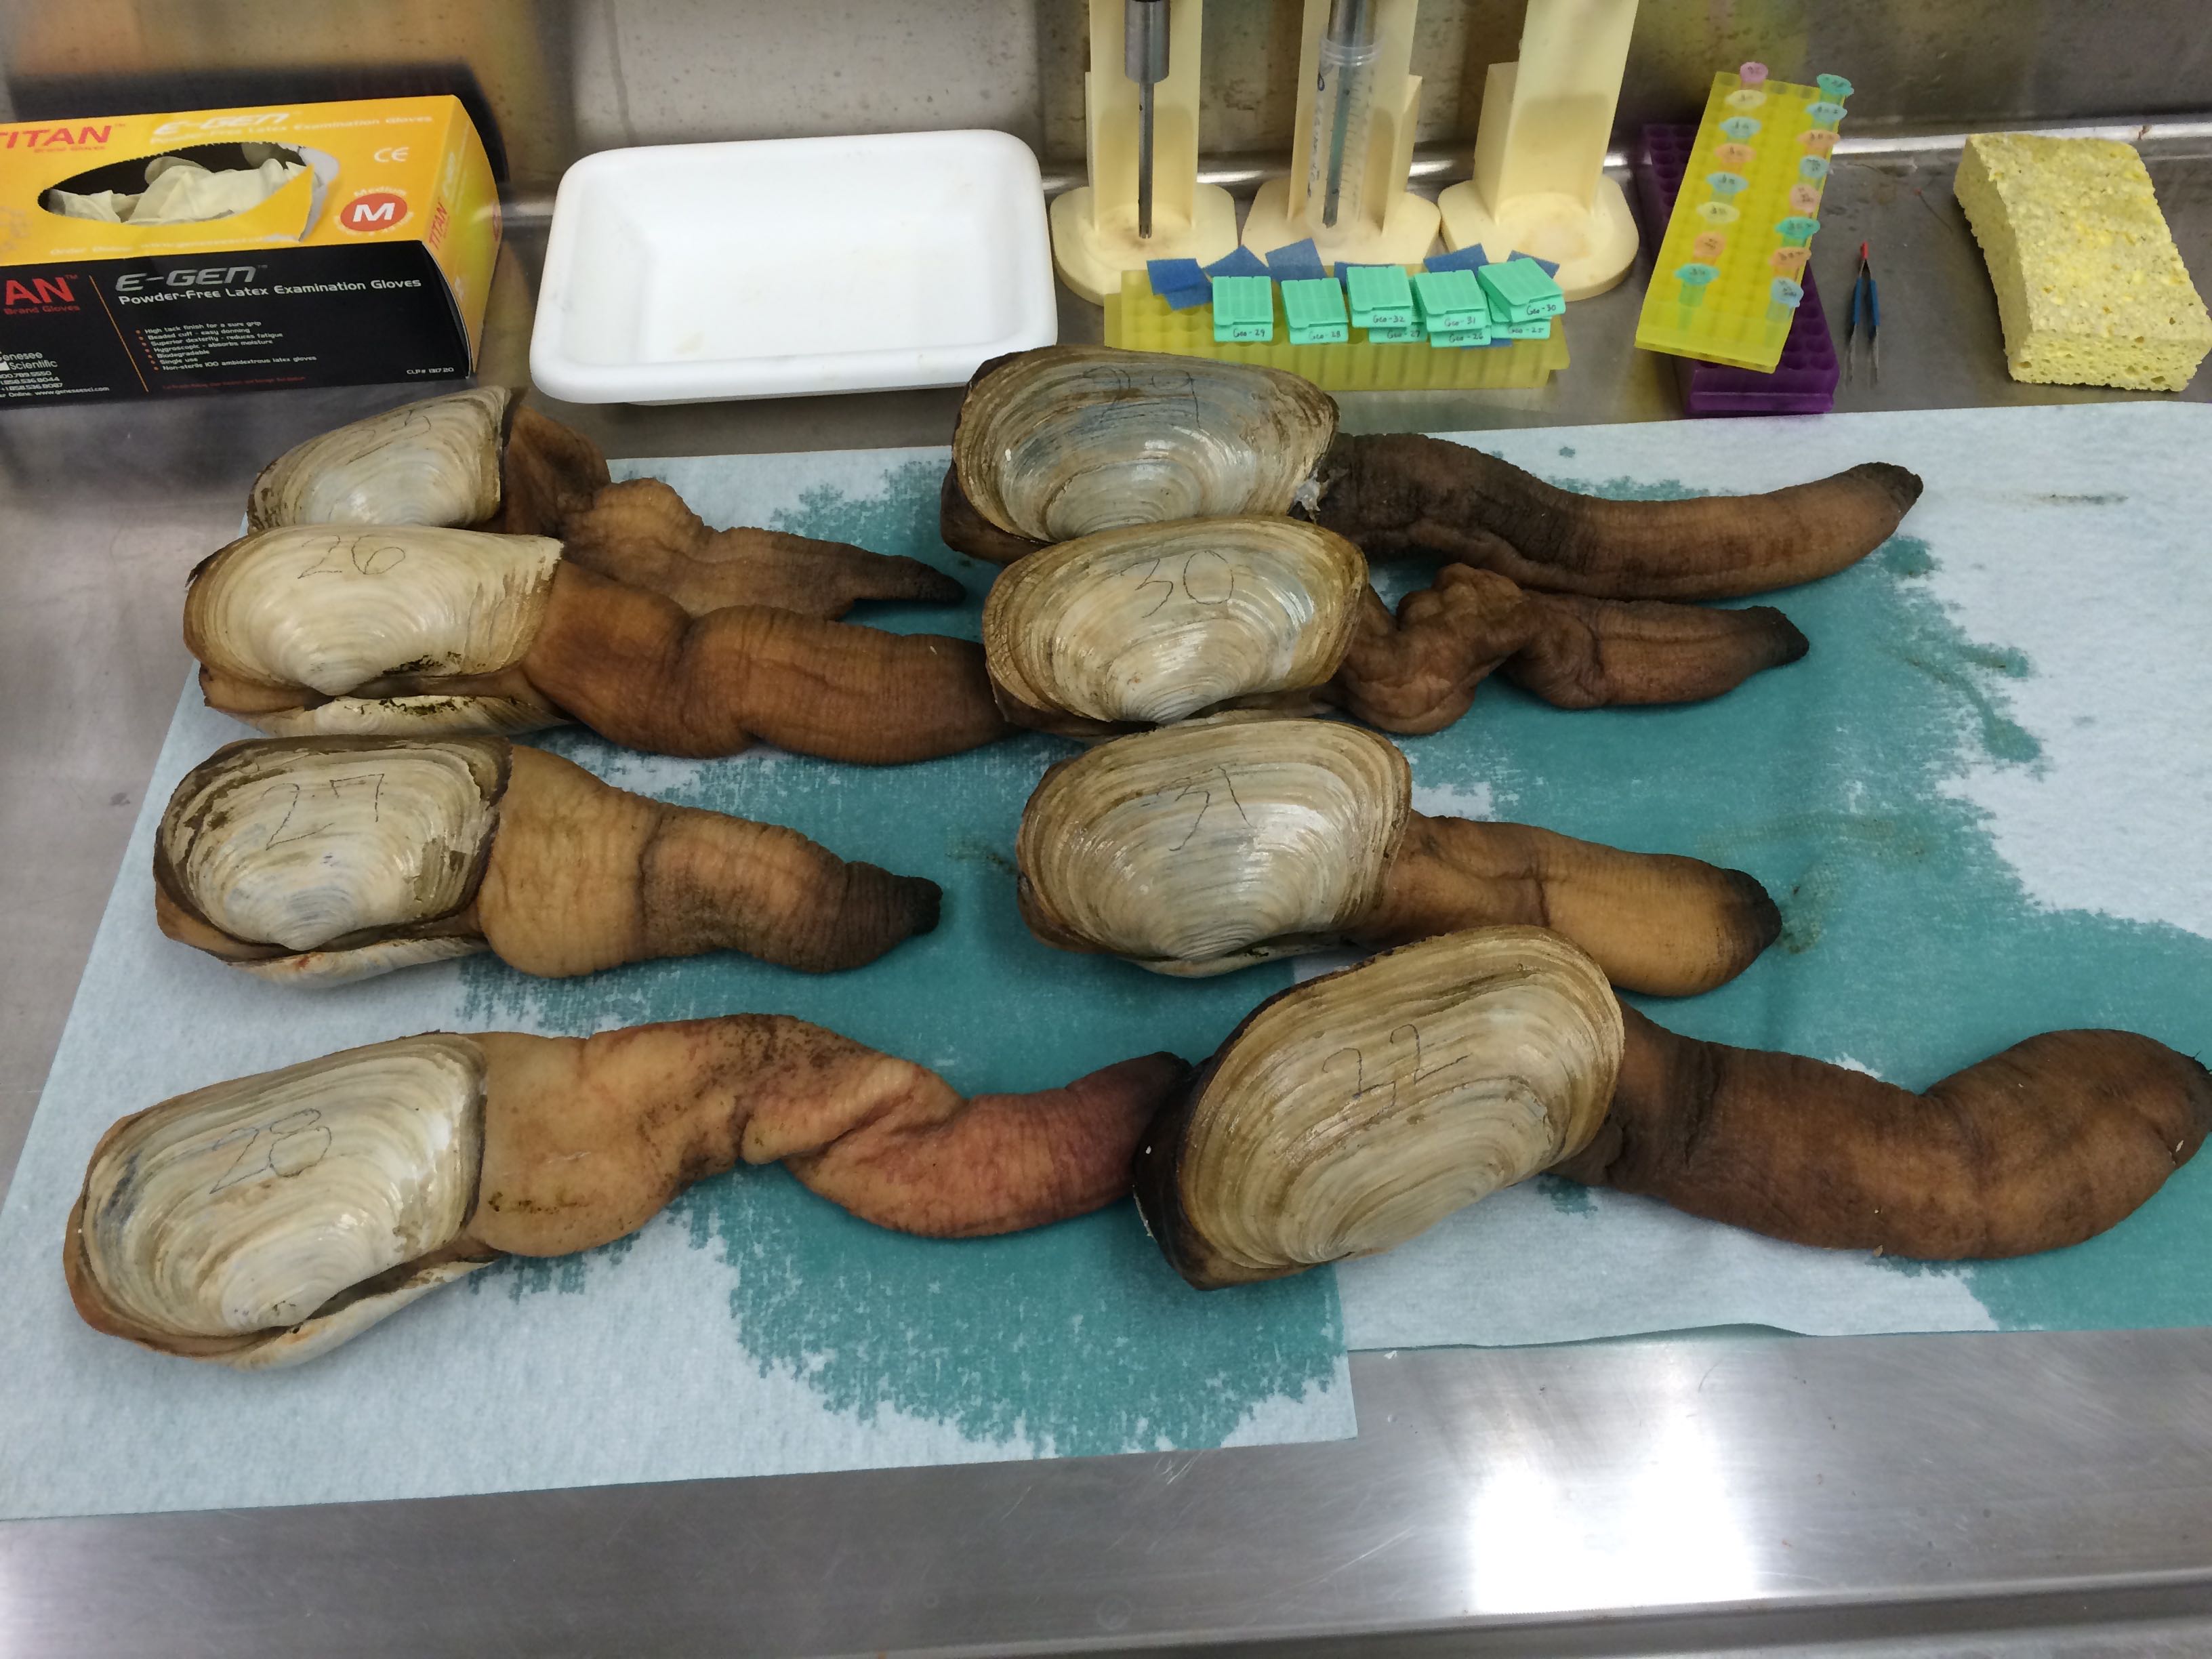 |
| Geo-25 through Geo-32. Some of them were really smelly this week. |
Brent worked on trying to figure out how best to extract hemolymph while making sure that hemolymph was actually what was being sampled, rather than seawater, which they are quite full of. Also, the extraction should take place as quickly as possible because Brent and I both suspect that they essentially "bleed out" if the extraction process takes too long, resulting in either not sampling any hemolymph, or not getting very much.
All the gonad tissue sampling went well.
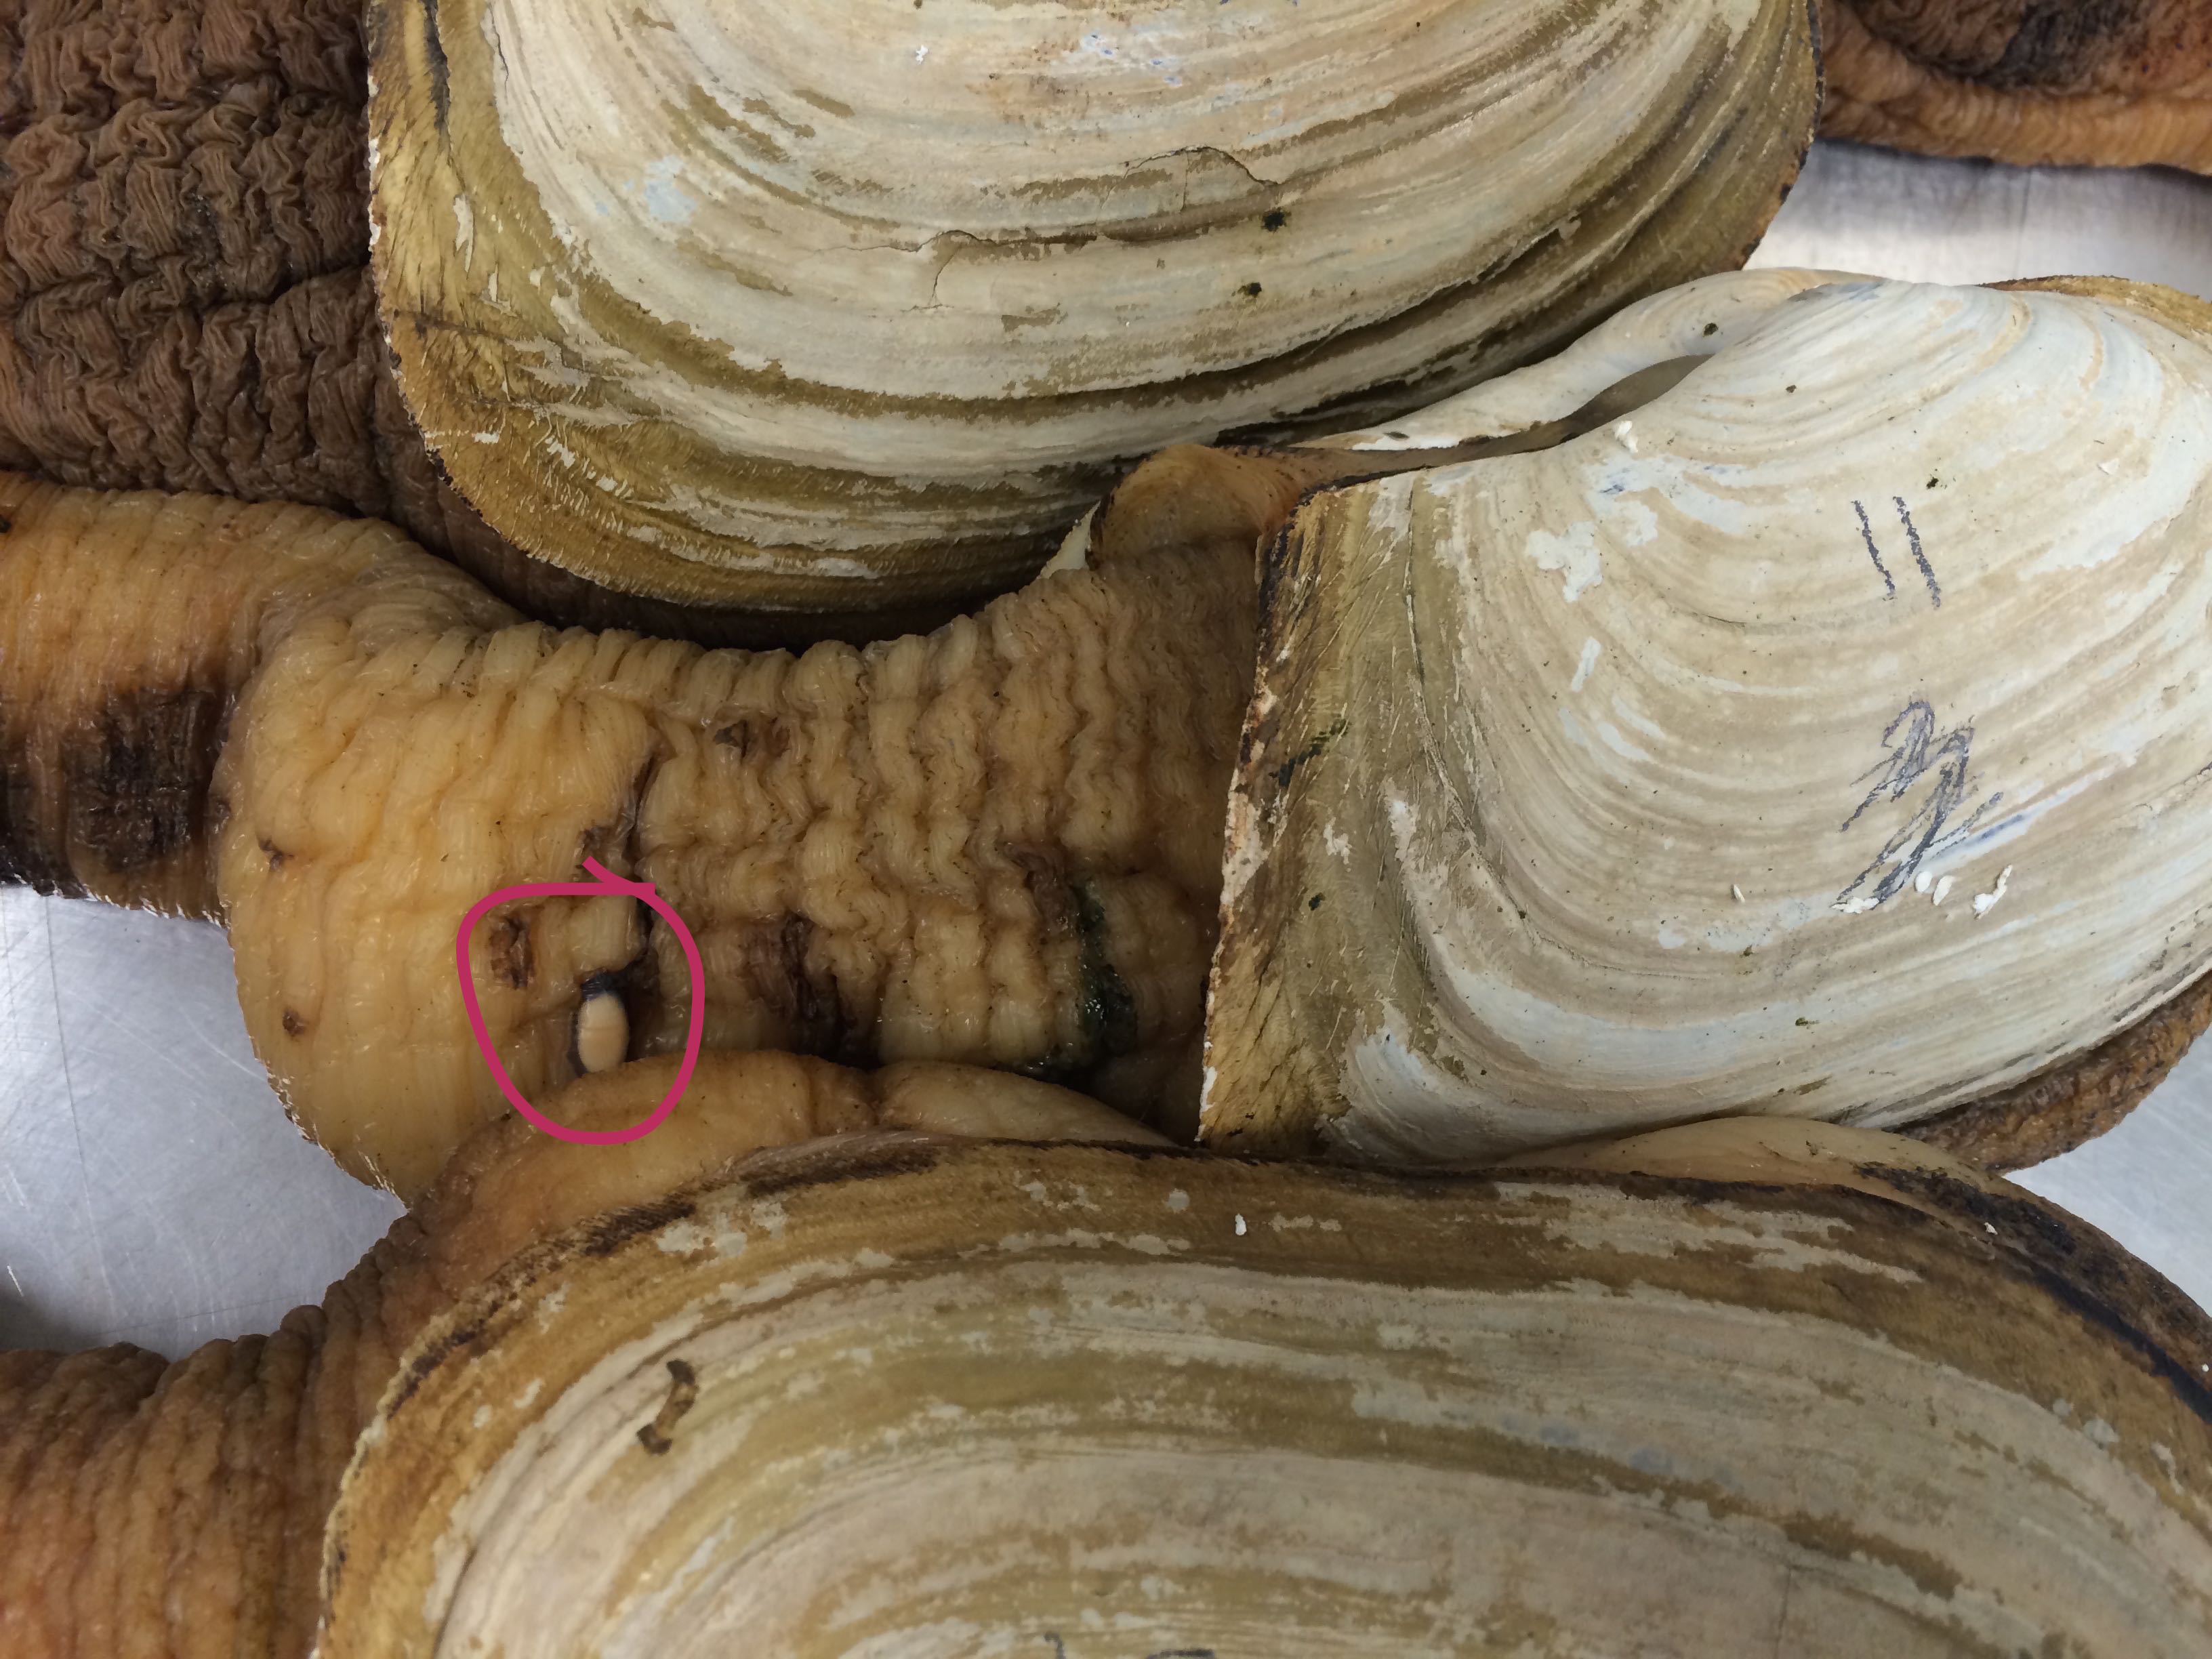
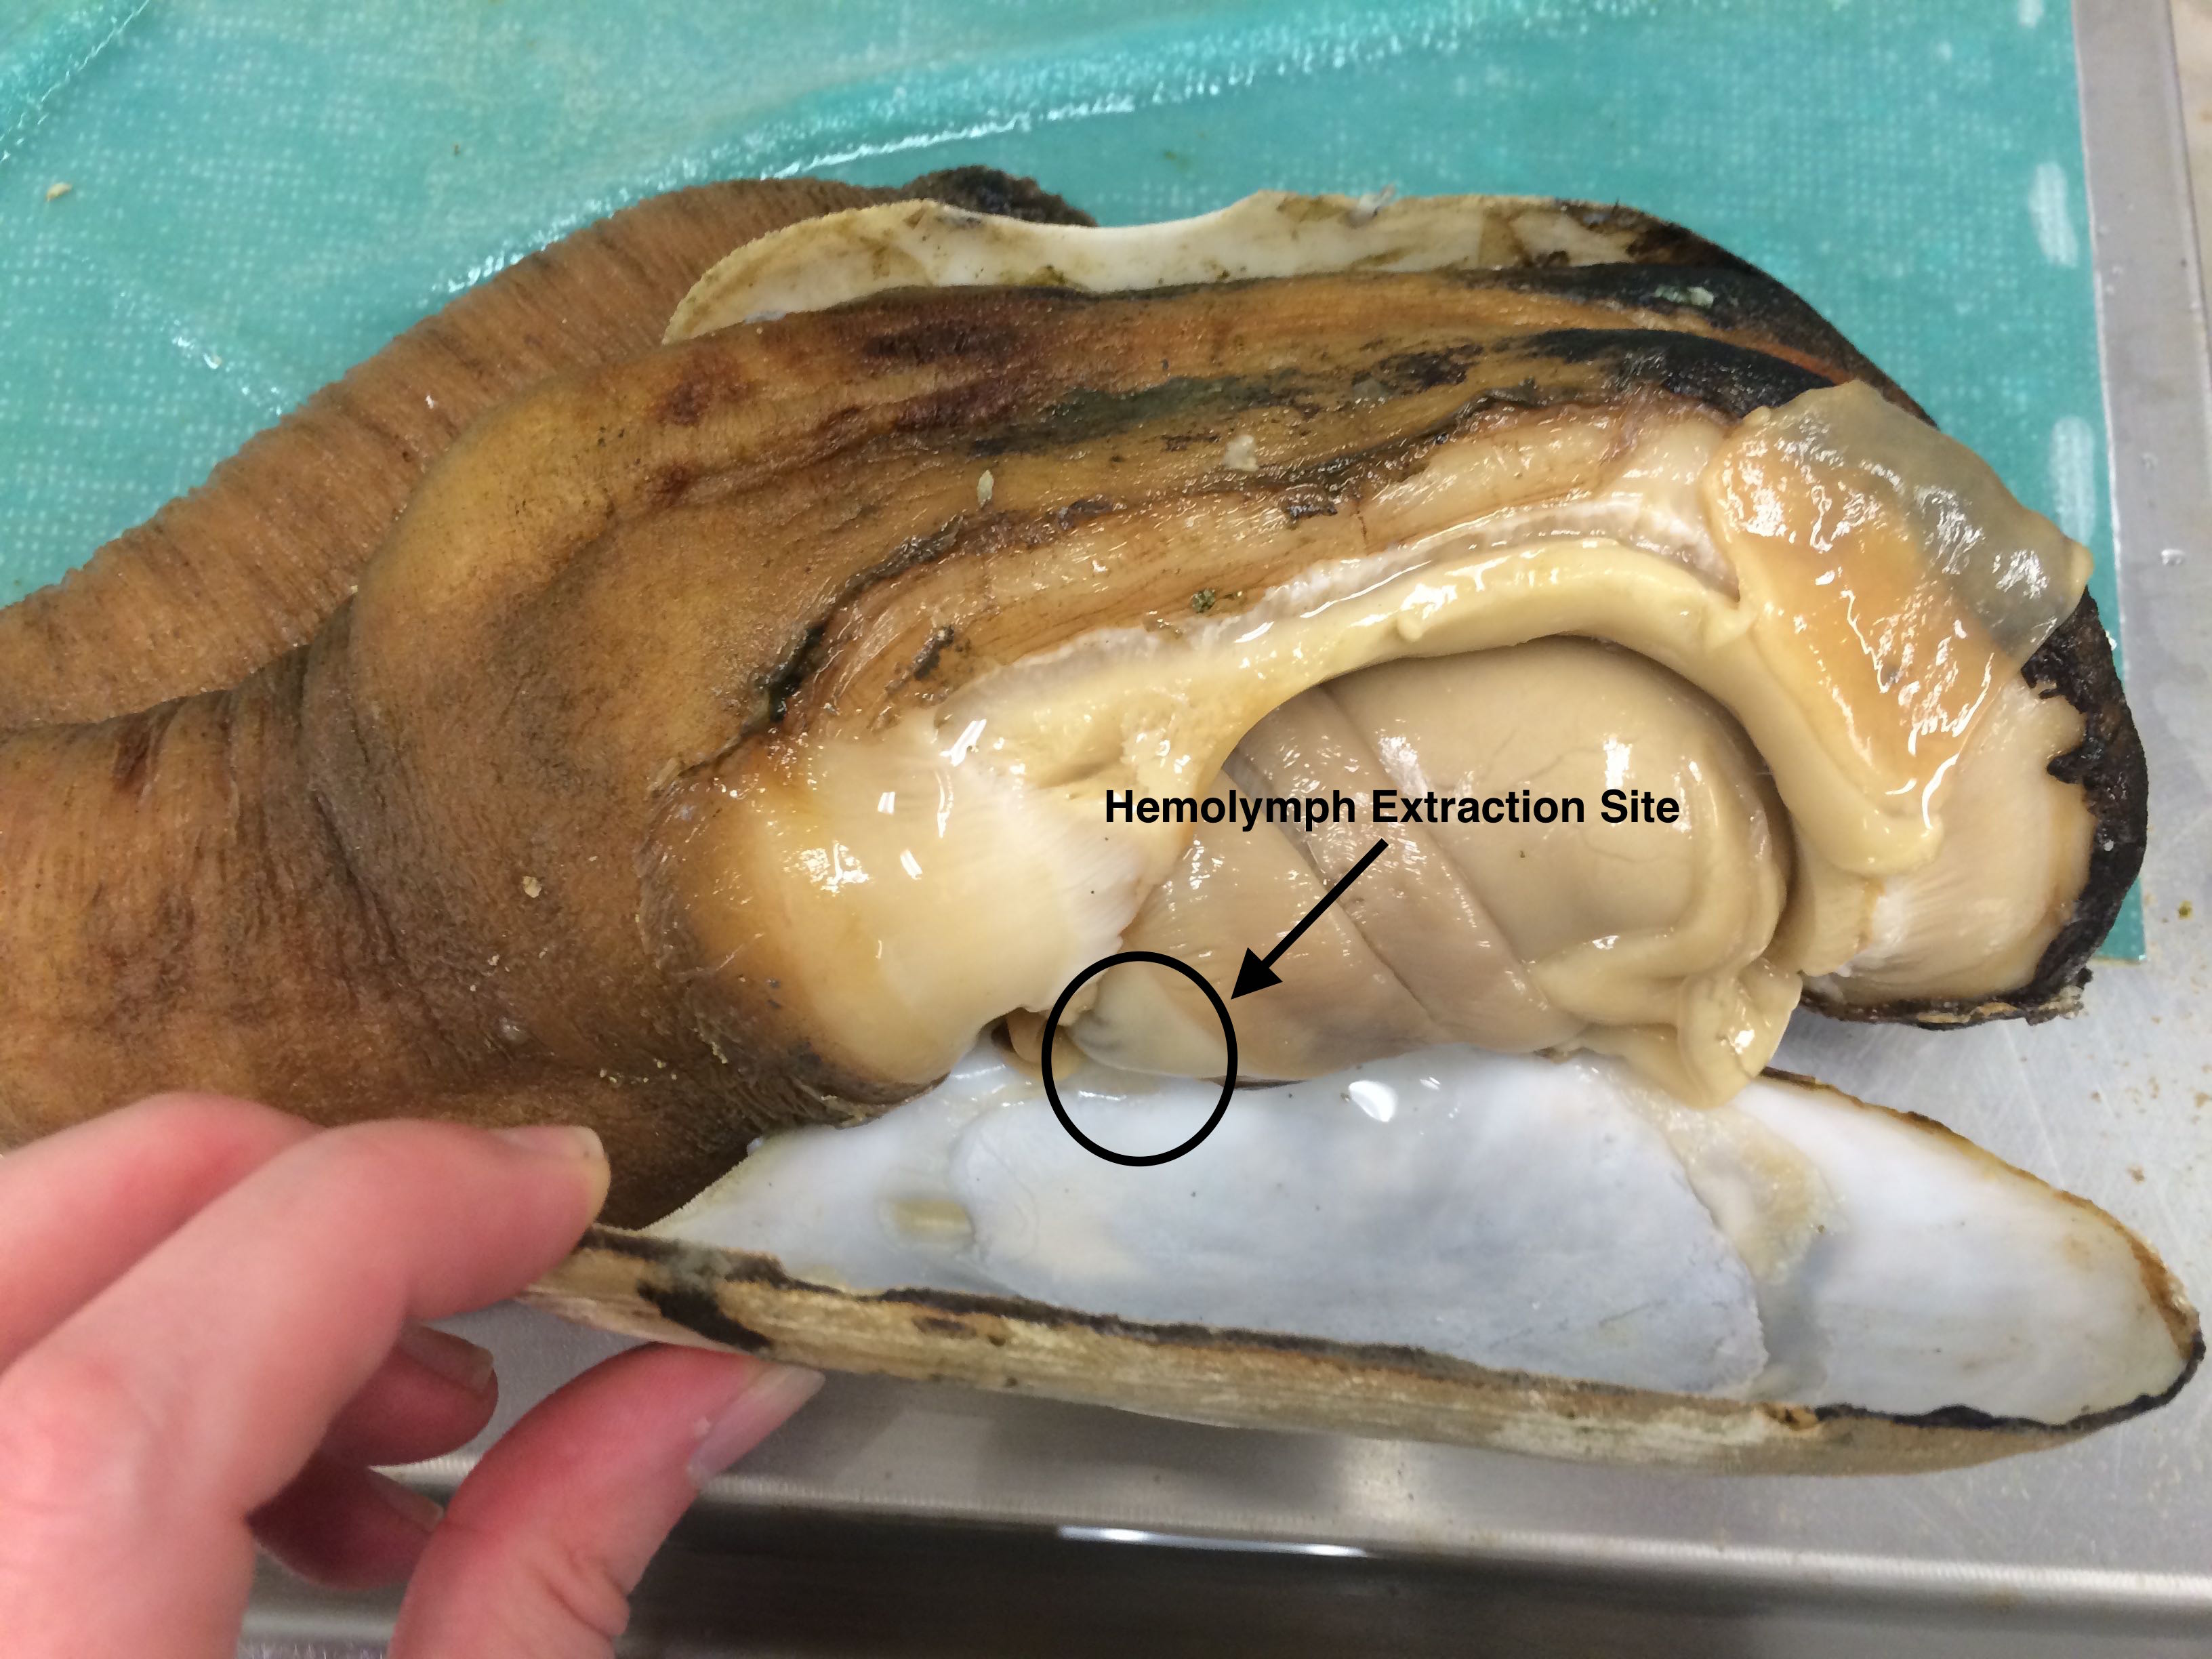 |
| The circled area is where the pericardial area is. This is the area around the heart where hemolymph extraction would optimally be occurring. However, it is difficult to do without cutting the animal out of the shell. The goal is to figure out a way to extract hemolymph non-lethally. |
| Label |
Weight (g) |
Length |
Notes |
| Geo-25 |
829.7 |
133 |
|
| Geo-26 |
1316.5 |
146 |
|
| Geo-27 |
1131.6 |
127 |
|
| Geo-28 |
1231.2 |
136 |
|
| Geo-29 |
1550.2 |
160 |
Started cleaning the razor blade in between samples. From here on out, I will be wiping the blade, dipping it in 10% bleach and then water, and then wiping it again. Previous to this, I had been simply wiping the blade between Geoduck sampling, which was not good because it could potentially create contamination between the specimens. |
| Geo-30 |
1081.8 |
158 |
|
| Geo-31 |
966.4 |
147 |
|
| Geo-32 |
1372.1 |
161 |
Tuesday, December 2, 2014
Today, Sam sent out the Geoduck gonad tissue samples in the PAXgene Tissue STABILIZER solution for Geo-01 through Geo-24 to the lab in Sacramento, CA where they will be made into histology slides and mailed back here.Monday, December 1, 2014
Today I read more of the papers I have on geoducks and sex-determination in manila clams. I then realized that I never tried to egrep the two terms "vitellogenin" and "vitellin" again after they didn't work several months ago. Today they did work and I posted the new notebook versions with the added egrep section.I then filled out a form for sending out the Geoduck gonad tissue samples to Sacramento, CA to be made into histology slides.
Monday, November 24, 2014
While I'm not dissecting Geoducks, i am working with blast and fasta files of related clam species' transcriptomes. The python notebooks that are kept at the top of this wikispace page are the completed blasts and SQL share joins for the clam species labeled. The goal is to find a way to compare the proteins pertaining to reproduction and male/female development across the species, eventually including Geoducks once information is gleaned from the dissections and histology slides.I found a very interesting website today called ChamelaBase (http://compgen.bio.unipd.it/chameleabase/) that essentially has all the aspects that I perform in a python notebook in a searchable/browsable form. It is the transcriptome database of the saltwater clam Chamelea gallina, and you can search for specific contig information, GO terms, BLAST results, etc.
Friday, November 21, 2014
Today was more Geoduck dissections with an added sampling of hemolymph. Sampled 8 Geoducks from Taylor hatcheries. I forgot to come in and empty out the water yesterday (Thursday) after they were delivered by Steven to the lab yesterday. The geoducks didn't look dehydrated like they did the first sampling week, though.Unfortunately I also forgot to to take a gonad smear sample to look at under the microscope because we were pre-occupied with trying to find cells in the possible hemolymph samples we were taking.
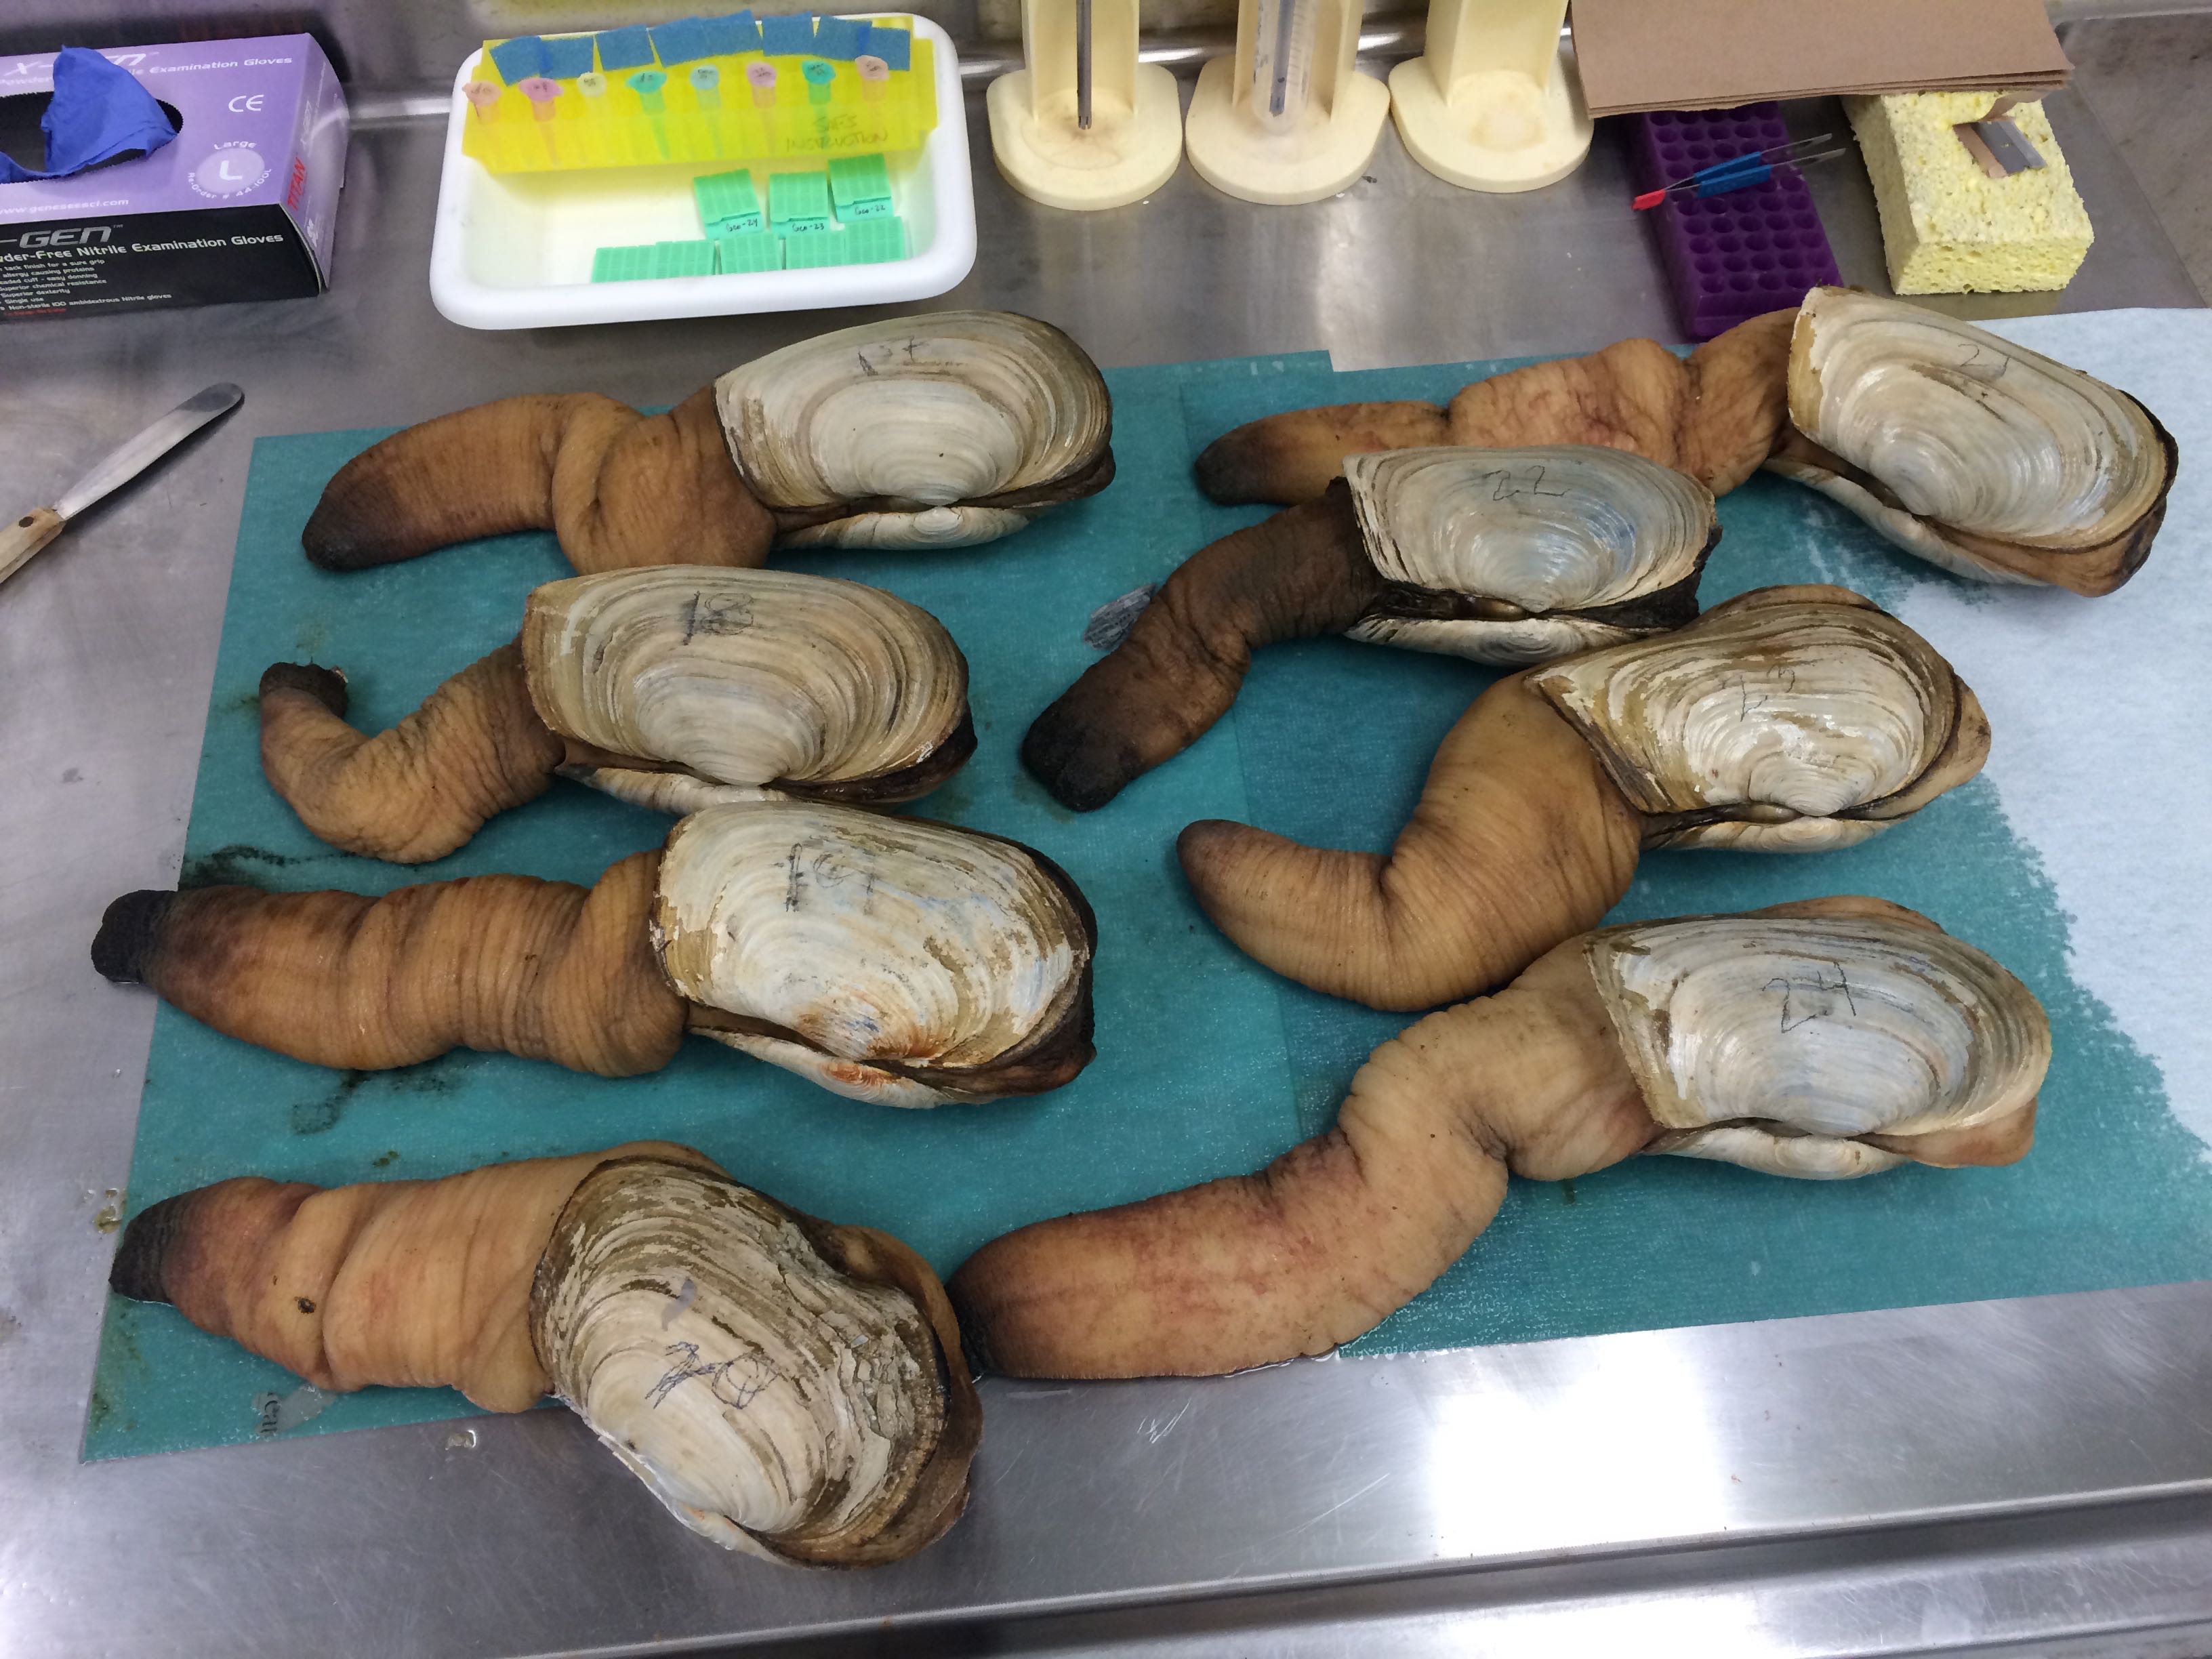 |
| Geo-17 through Geo-24 samples |
| Animal Label |
Weight (g) |
Length |
Notes |
| Geo-17 |
1425.8 |
162 |
Couldn't find heart. |
| Geo-18 |
1443.8 |
173 |
took a hemolymph sample |
| Geo-19 |
1427.3 |
159 |
took a hemolymph sample |
| Geo-20 |
1264.4 |
149 |
shell crushed on one side; hemolymph sample |
| Geo-21 |
1481.6 |
160 |
hemolymph sample |
| Geo-22 |
1204.2 |
150 |
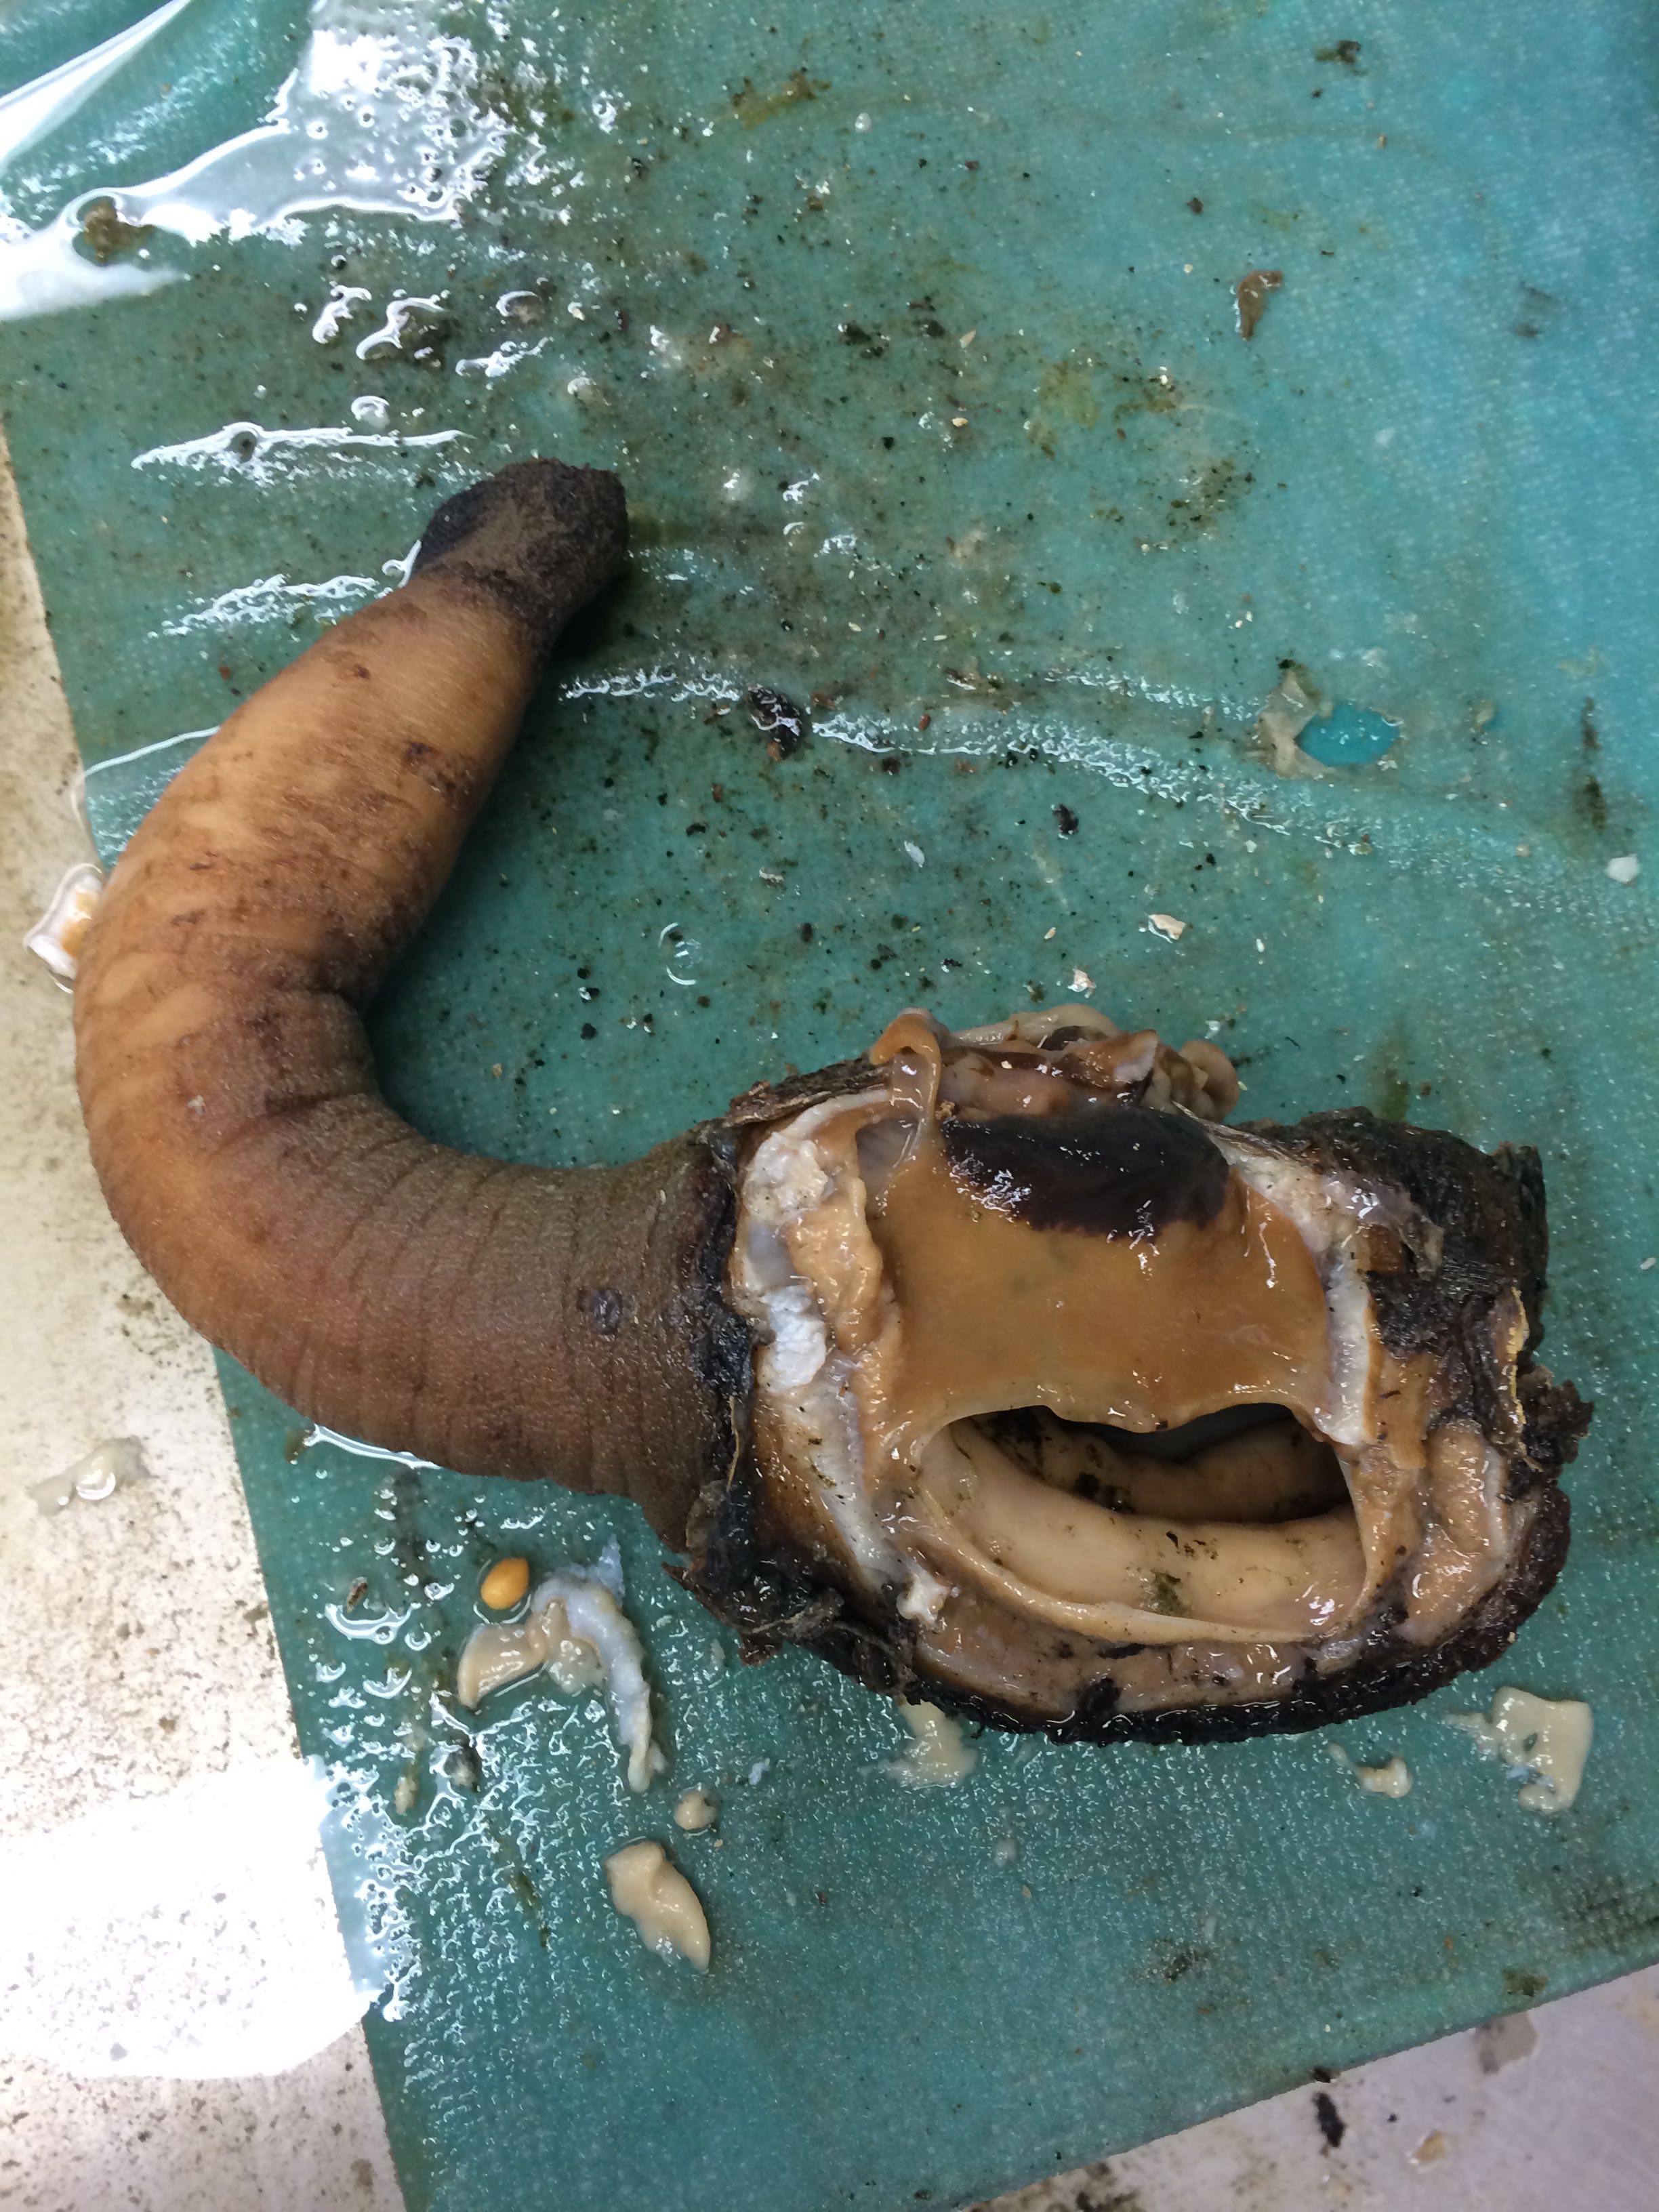
green coloration at tip of siphon and the rest of the tissue was blackish green. some of the tissue was incredibly attached to the shell while the rest of it was black and shrunken away from the shell. very smelly; took hemolymph sample |
| Geo-23 |
1525.1 |
160 |
slits on gonad upon full shell removal - likely occurred during shell removal process, but not certain; lots of water squirted and leaked from the pedal gape and siphon opening. much more sea water than any other previous individual; took hemolymph sample |
| Geo-24 |
1263.5 |
155 |
sores or growths on siphon. tissue is reddish. awful smelling upon opening organism. hemolymph sample taken |
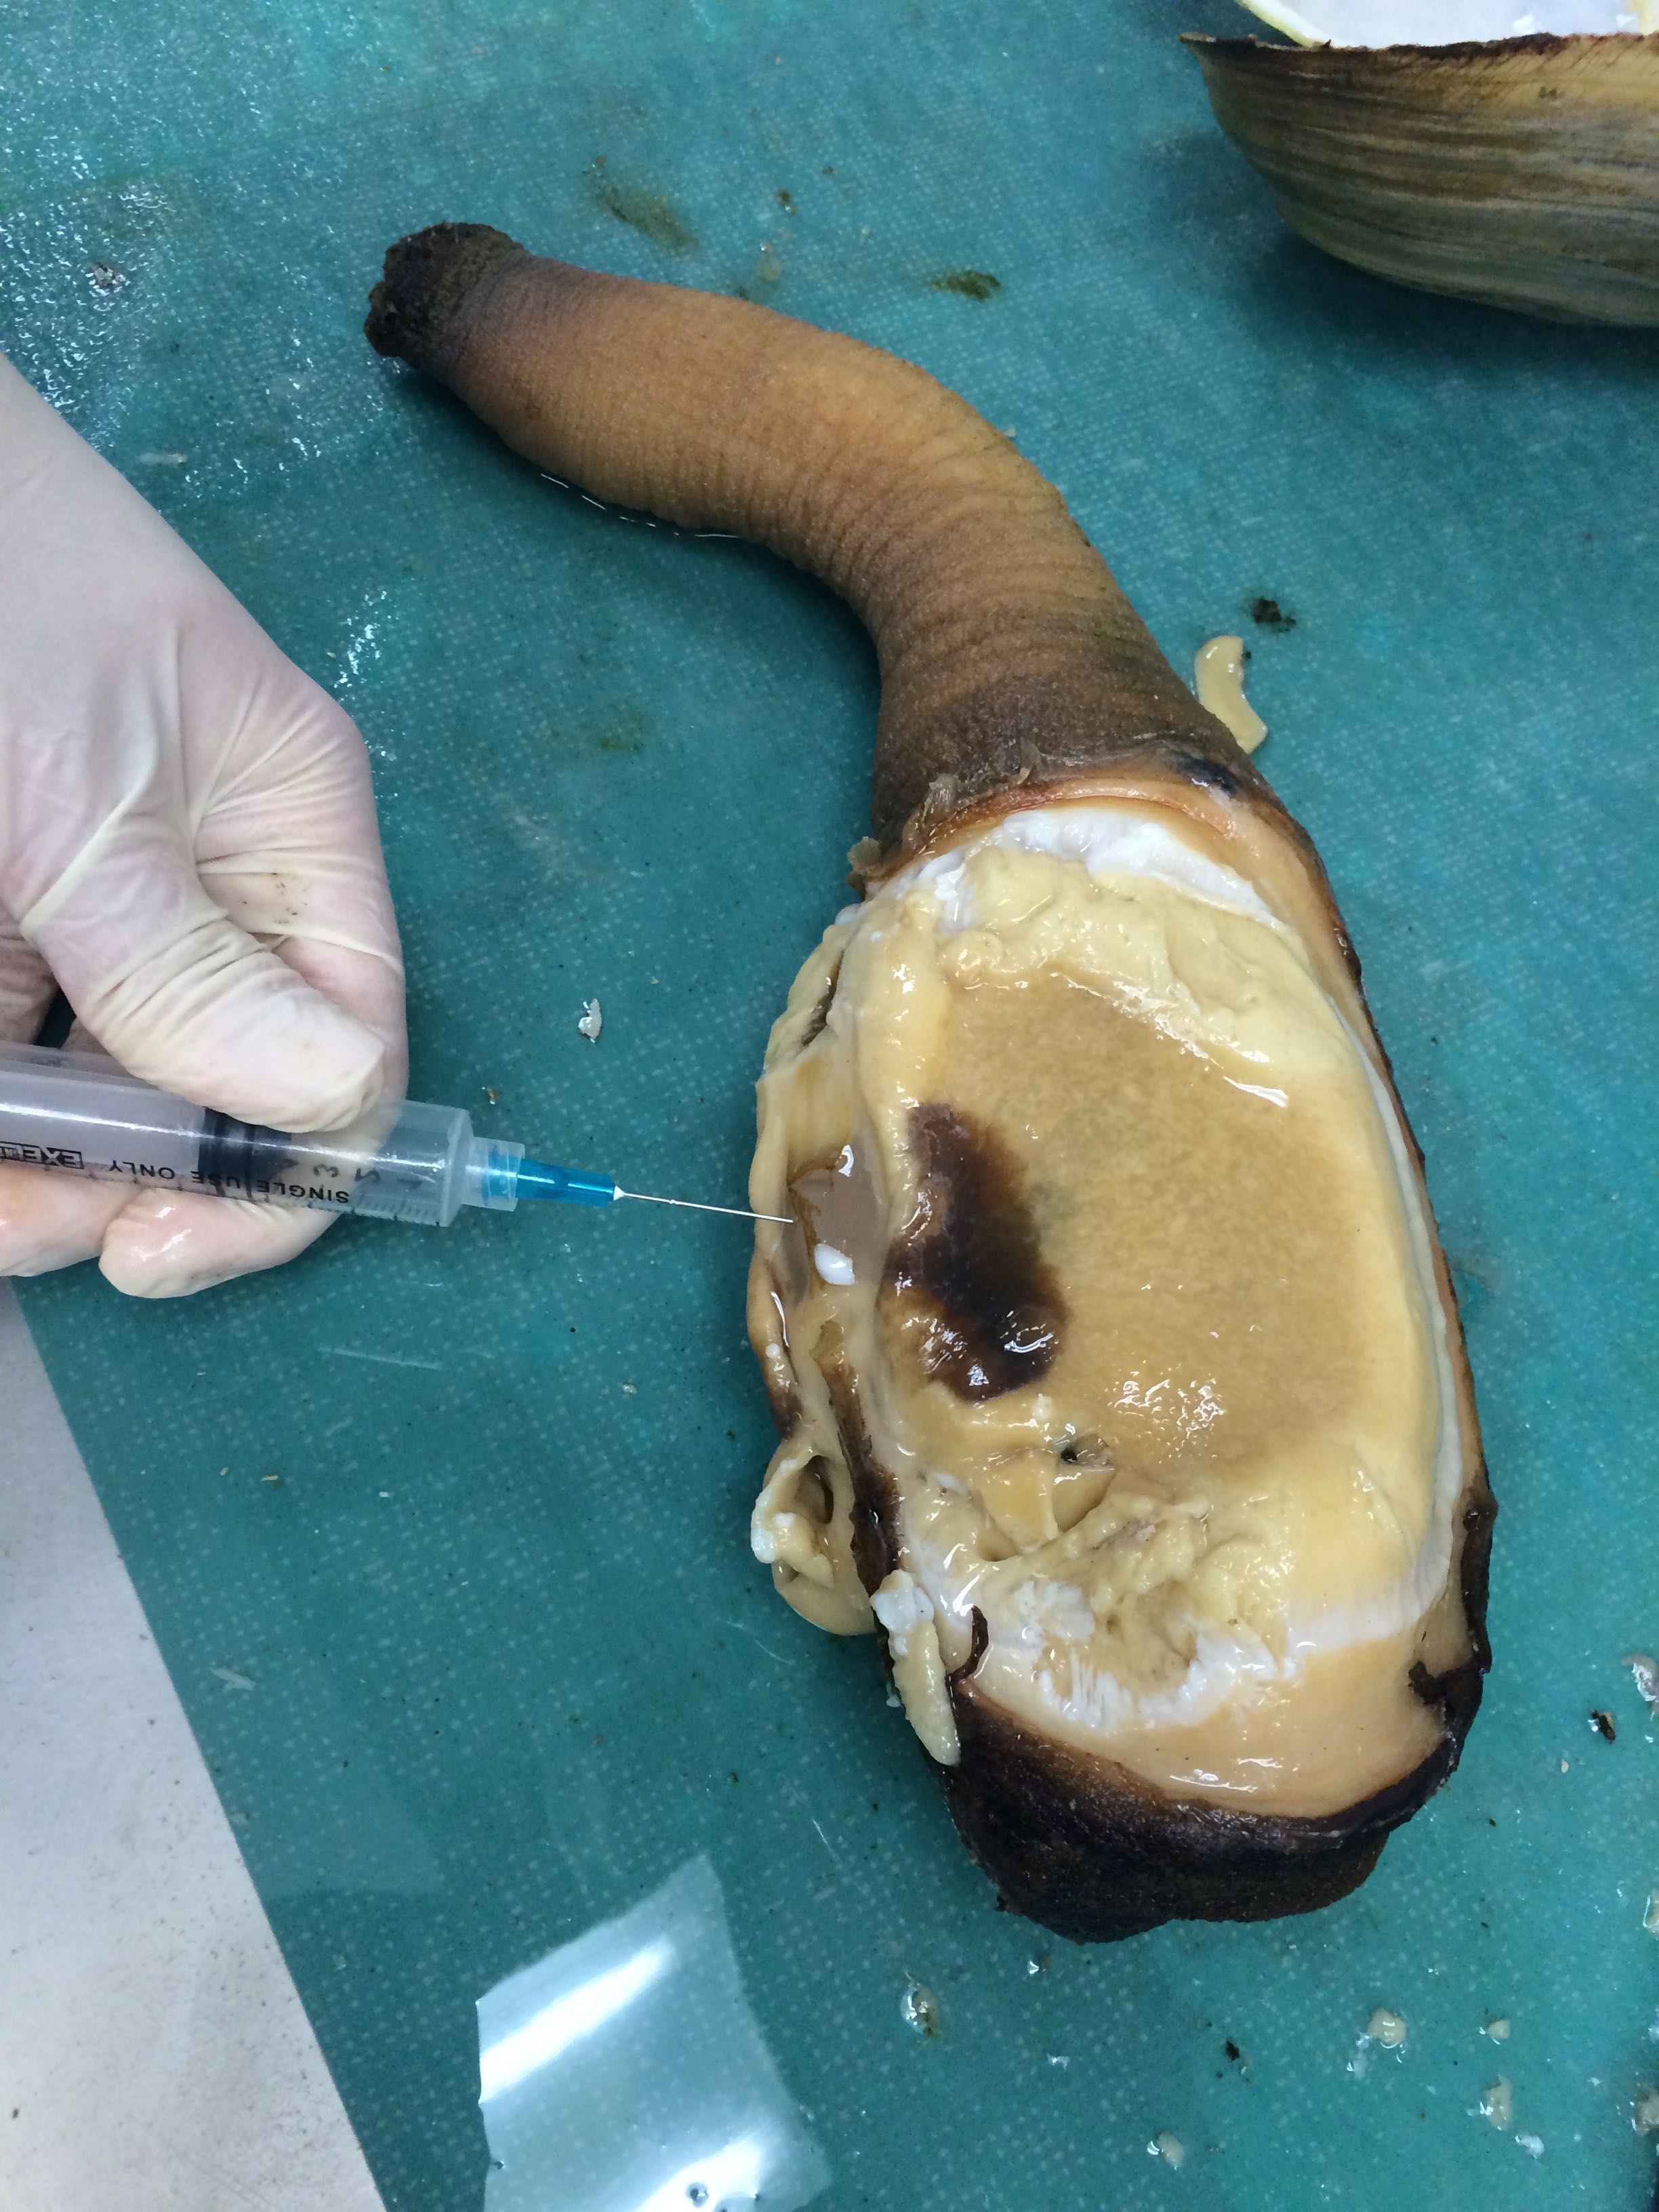 |
| Sampling hemolymph from Geo-18 |
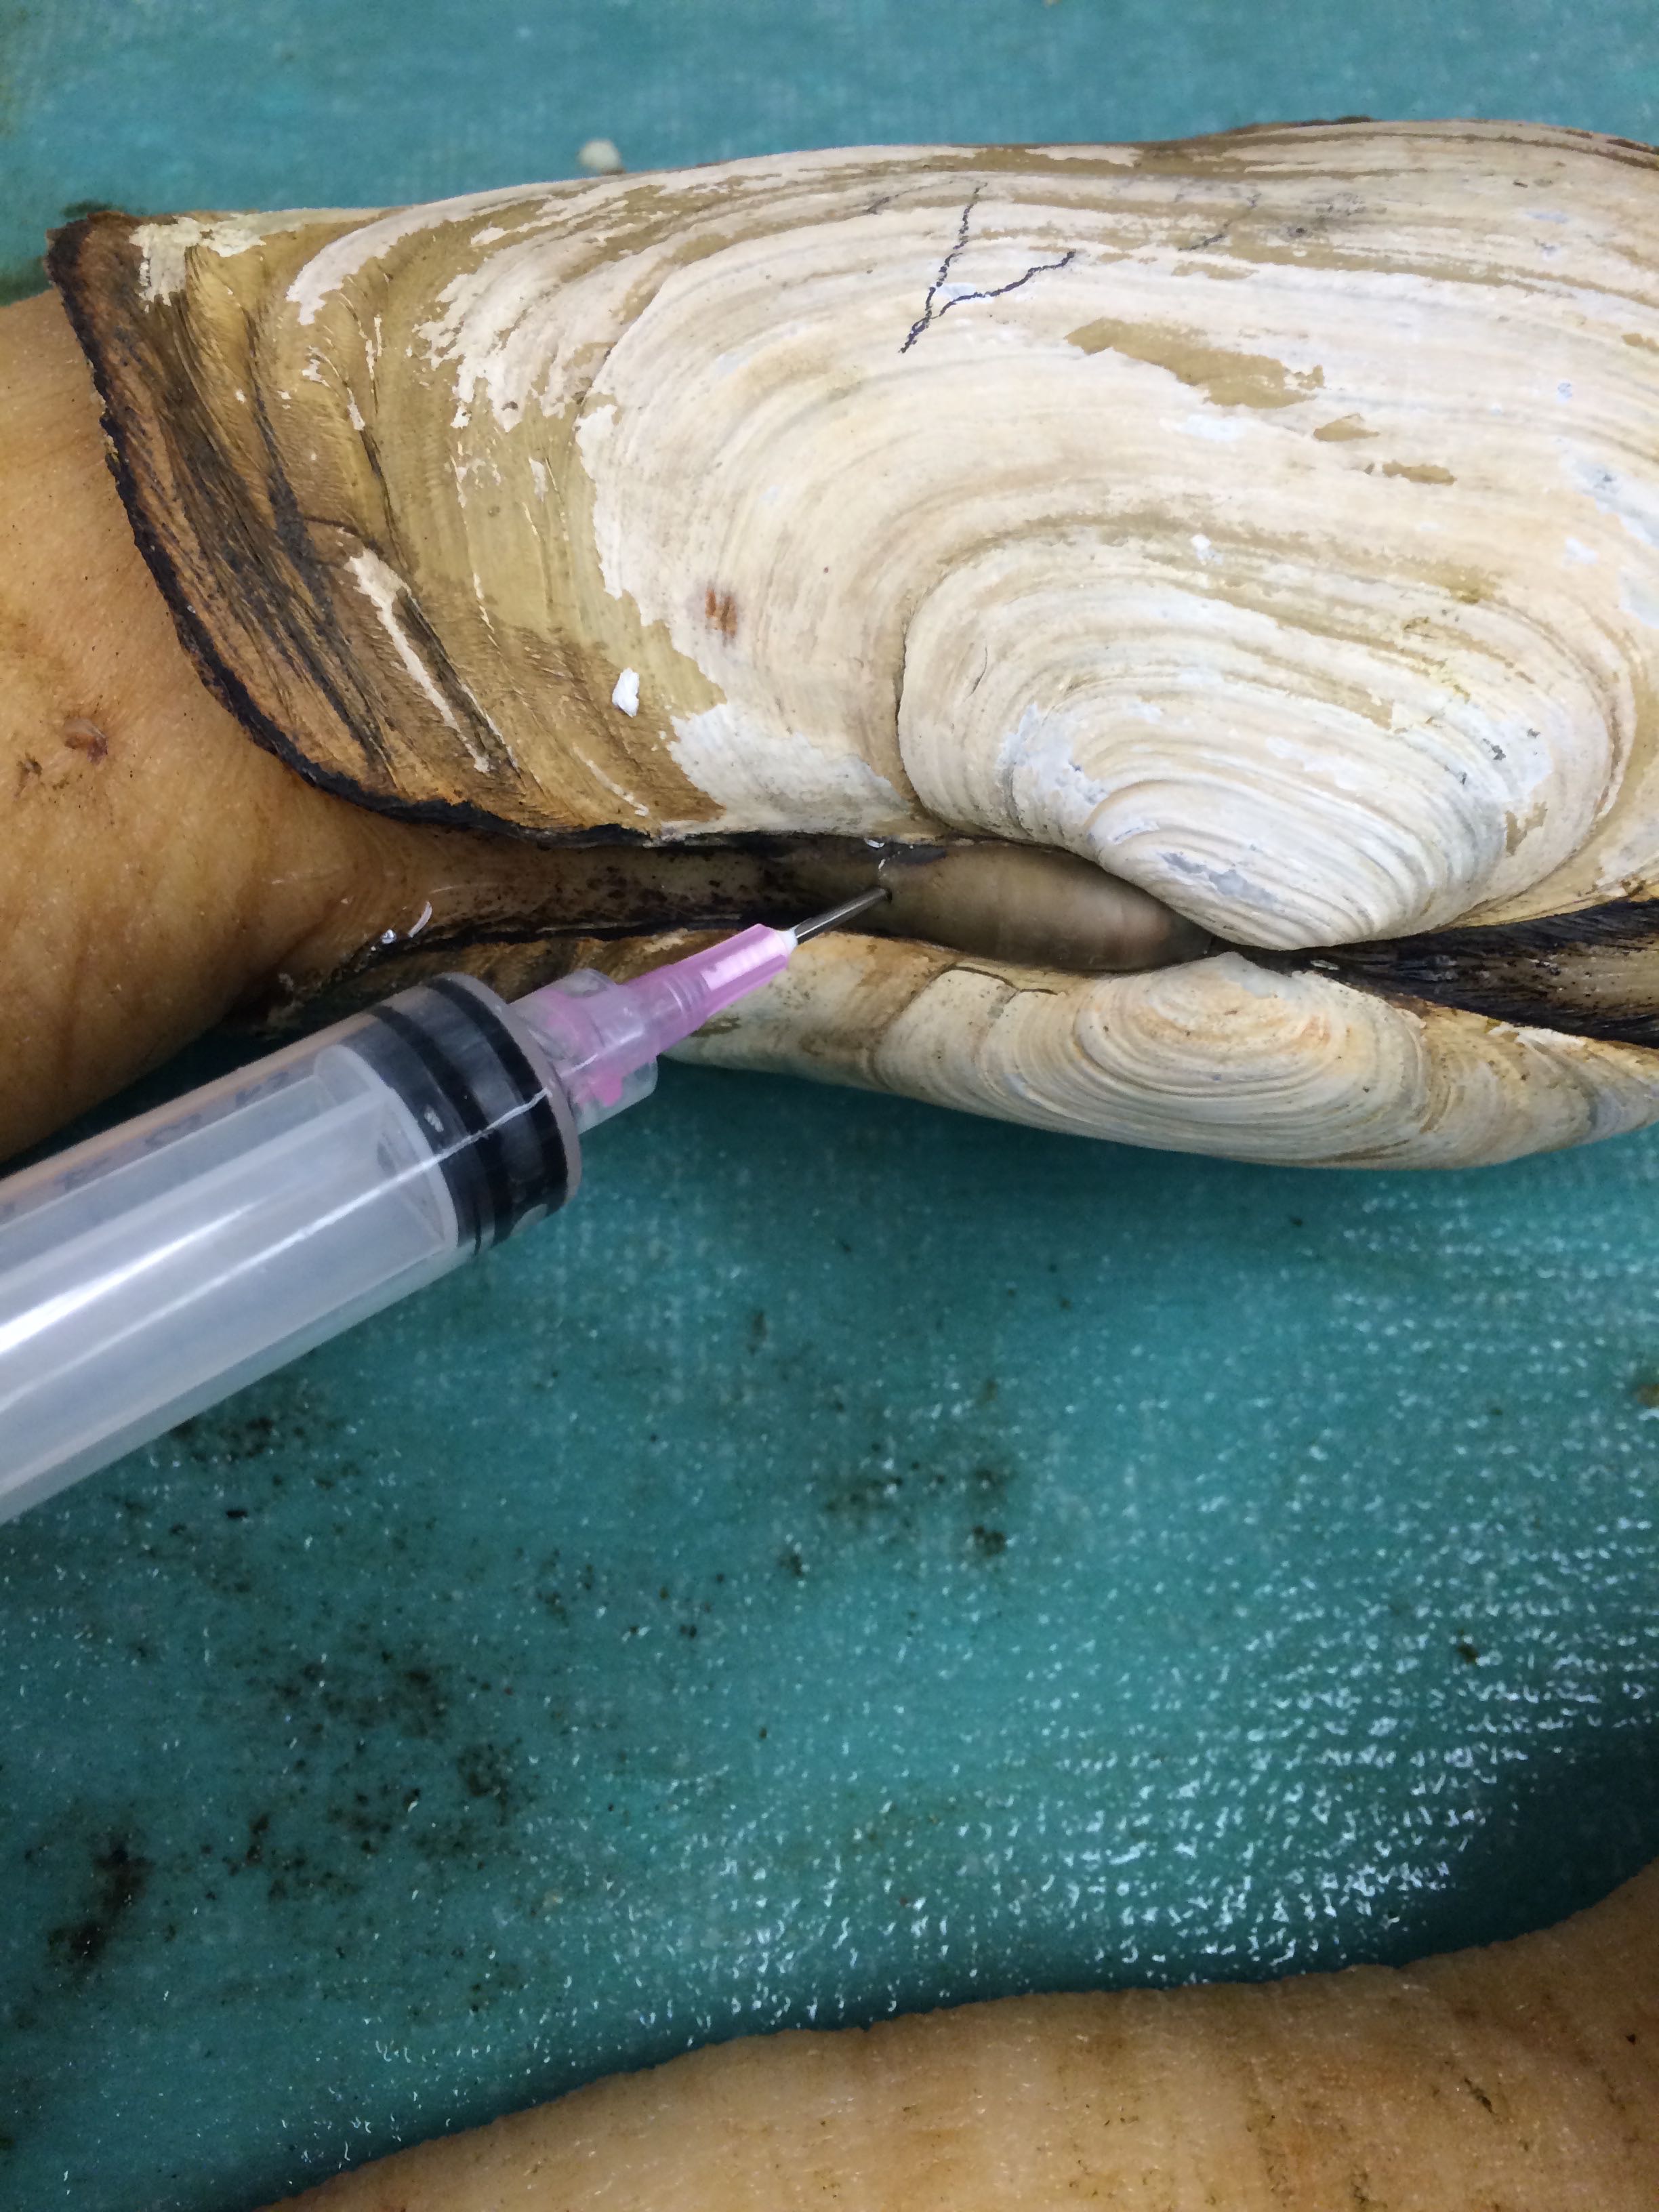 |
| Location where we attempted to extract hemolymph from live geoduck: Geo-22 |
Images of Geo-22
Thought to be infected with some sort of alga
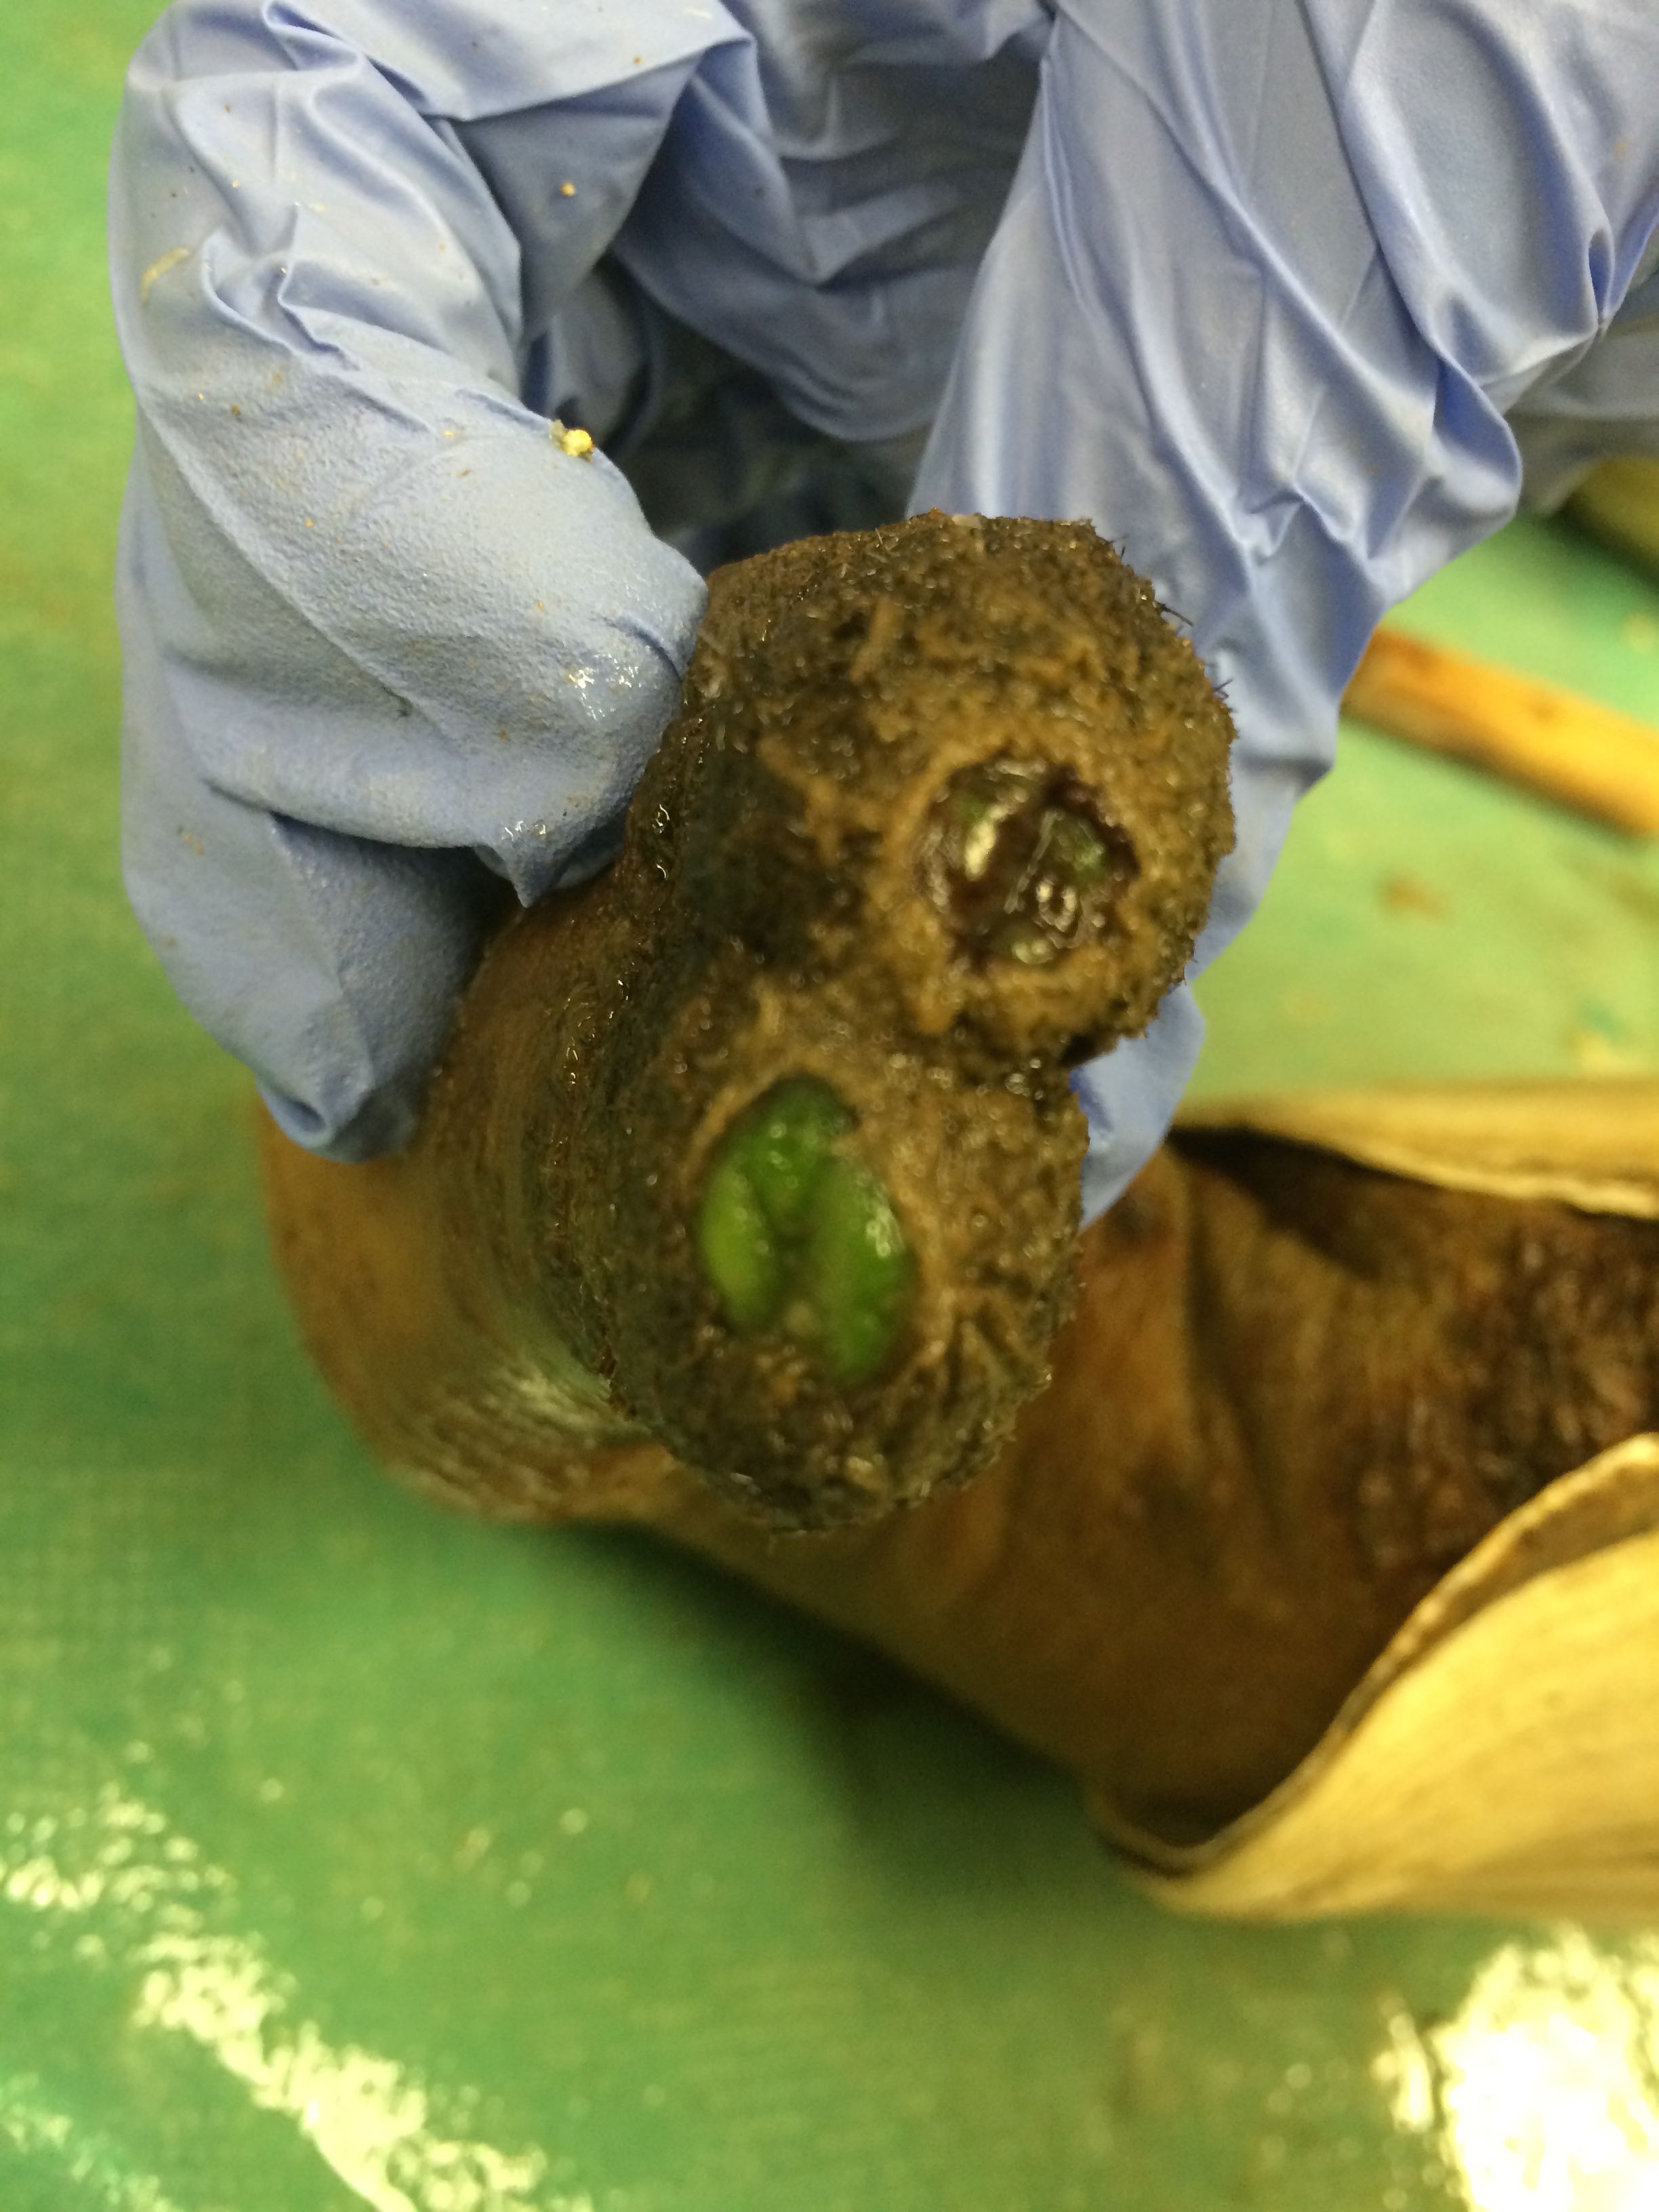 |
| Siphon tip of Geo-22 |
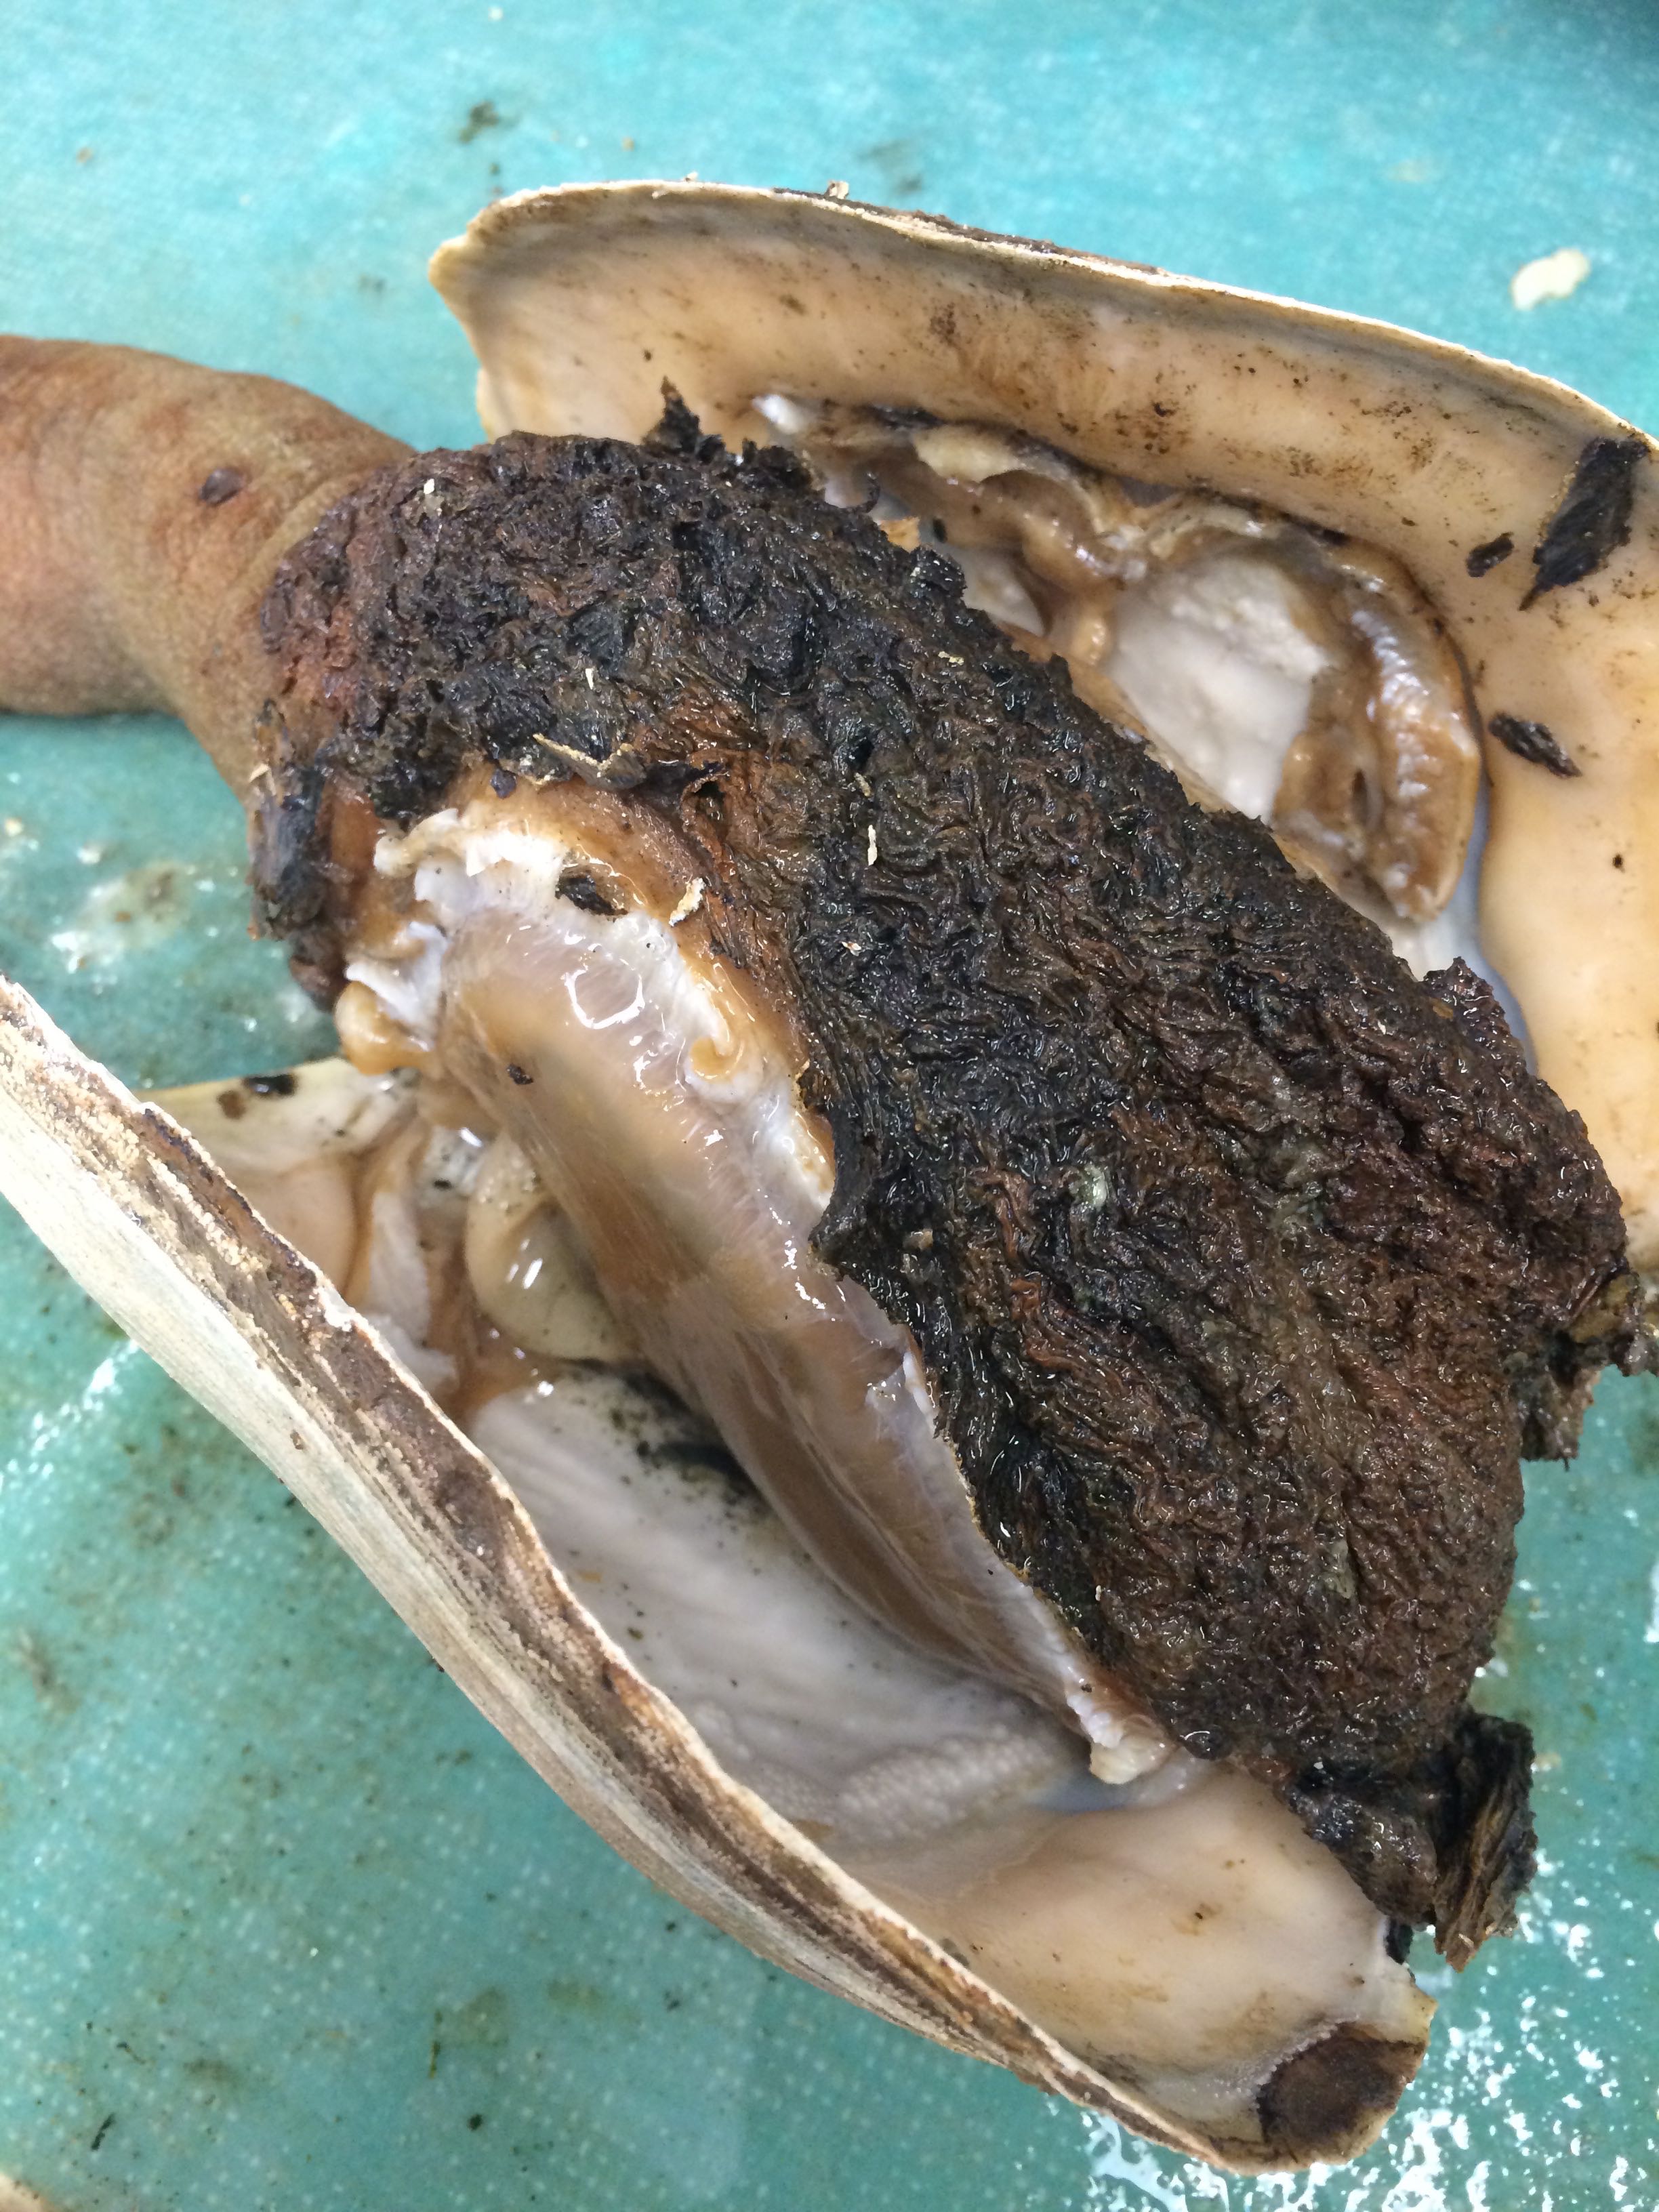 |
| Some of tissue strongly attached to shell while rest is blackish green and shriveled (Geo-22) |
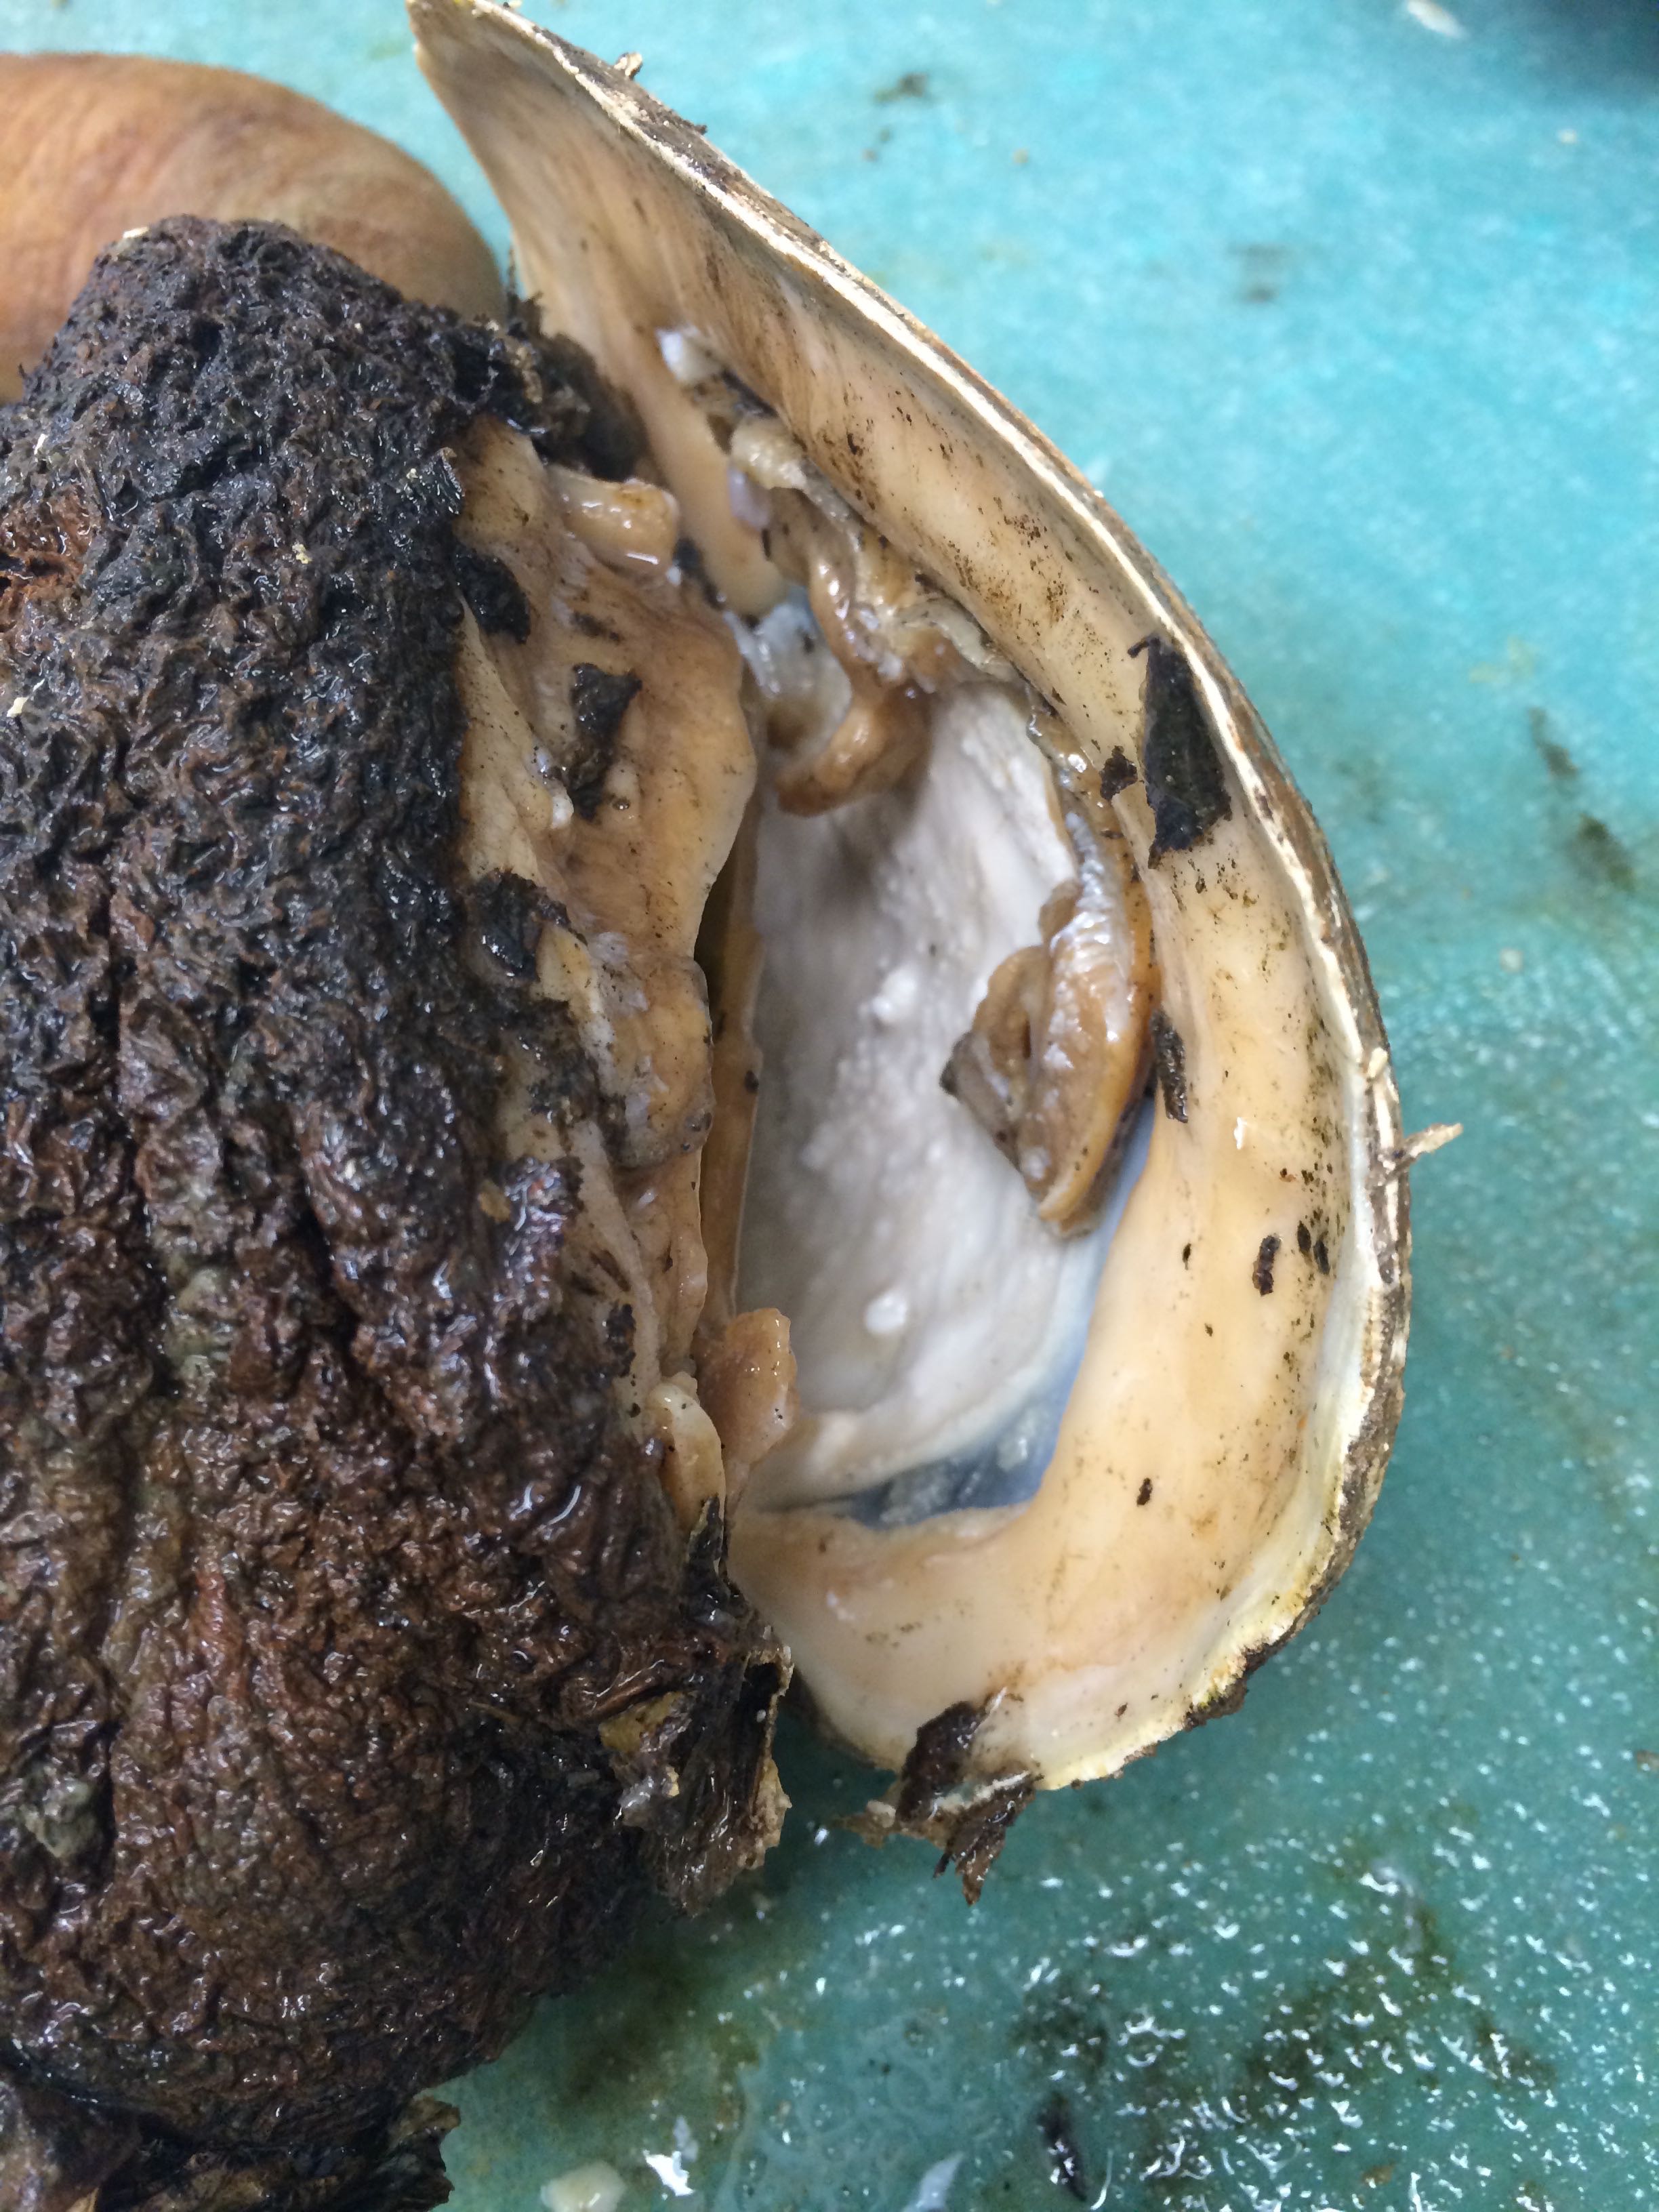 |
| Close-up of tissue (Geo-22) |
 |
| Shell fully removed (Geo-22) |
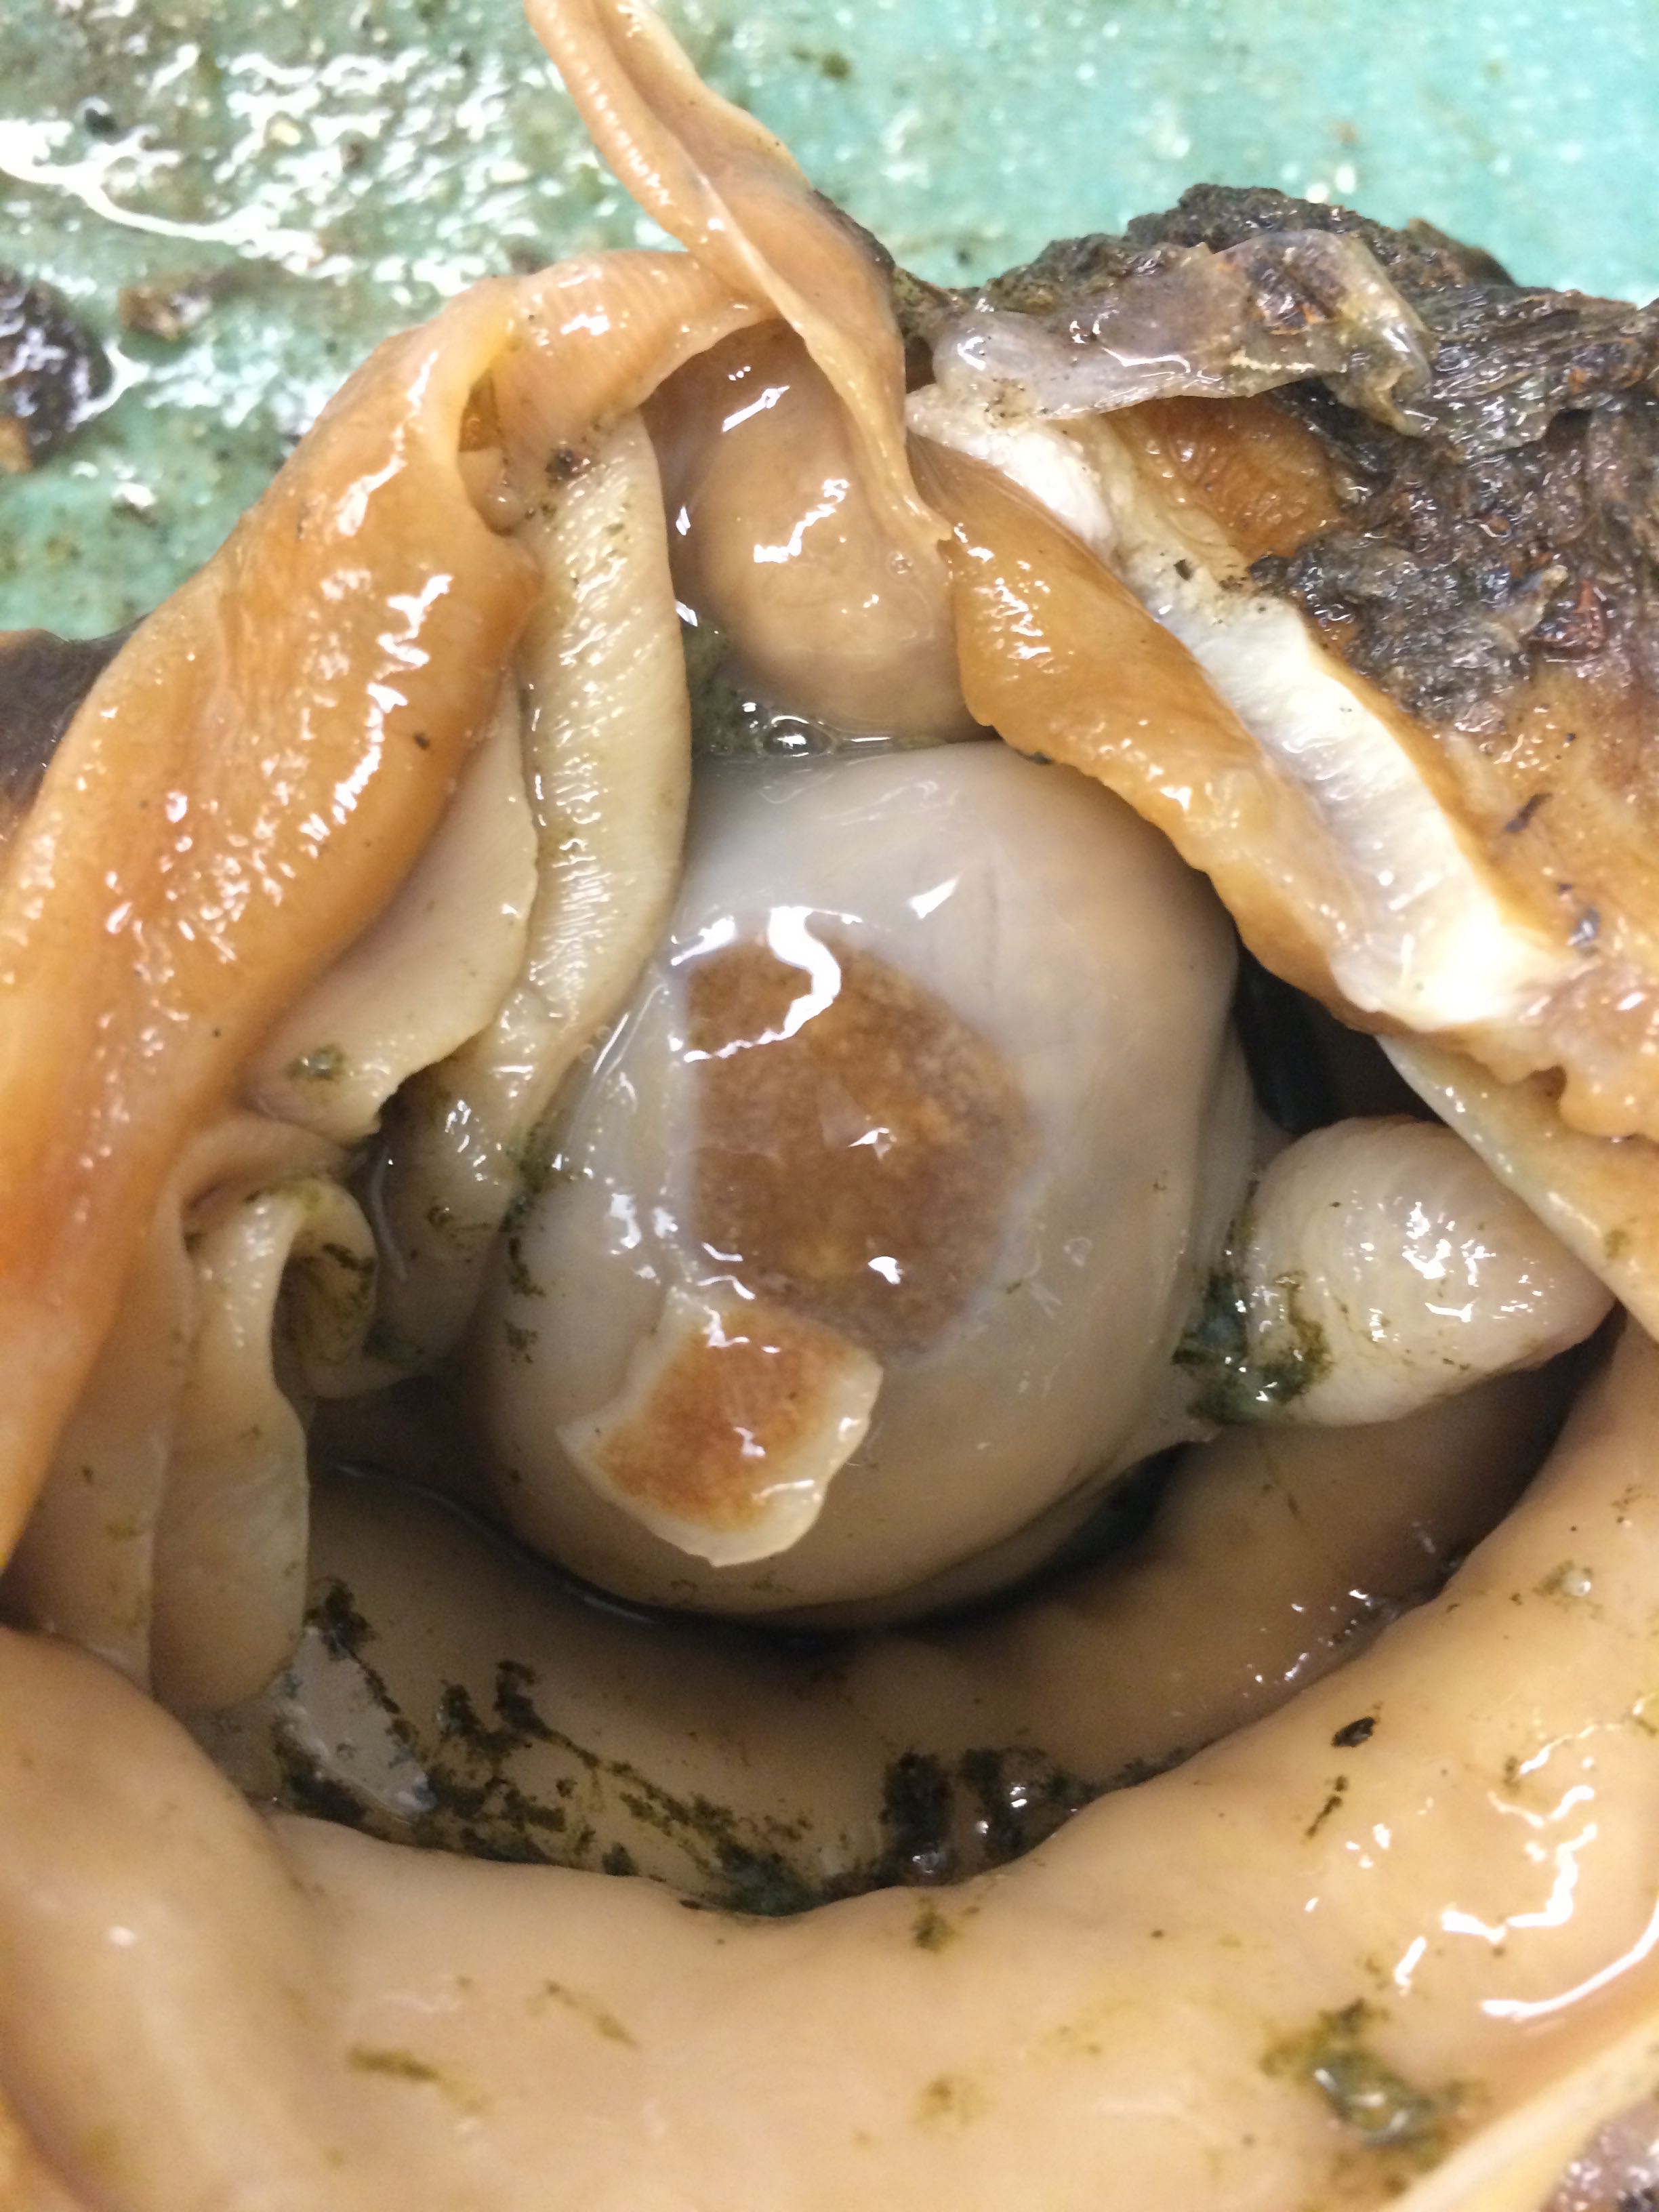 |
| Gonad tissue - Geo-22 |
Images of Geo-24
According to Brent, this appearance is fairly common to Geoducks
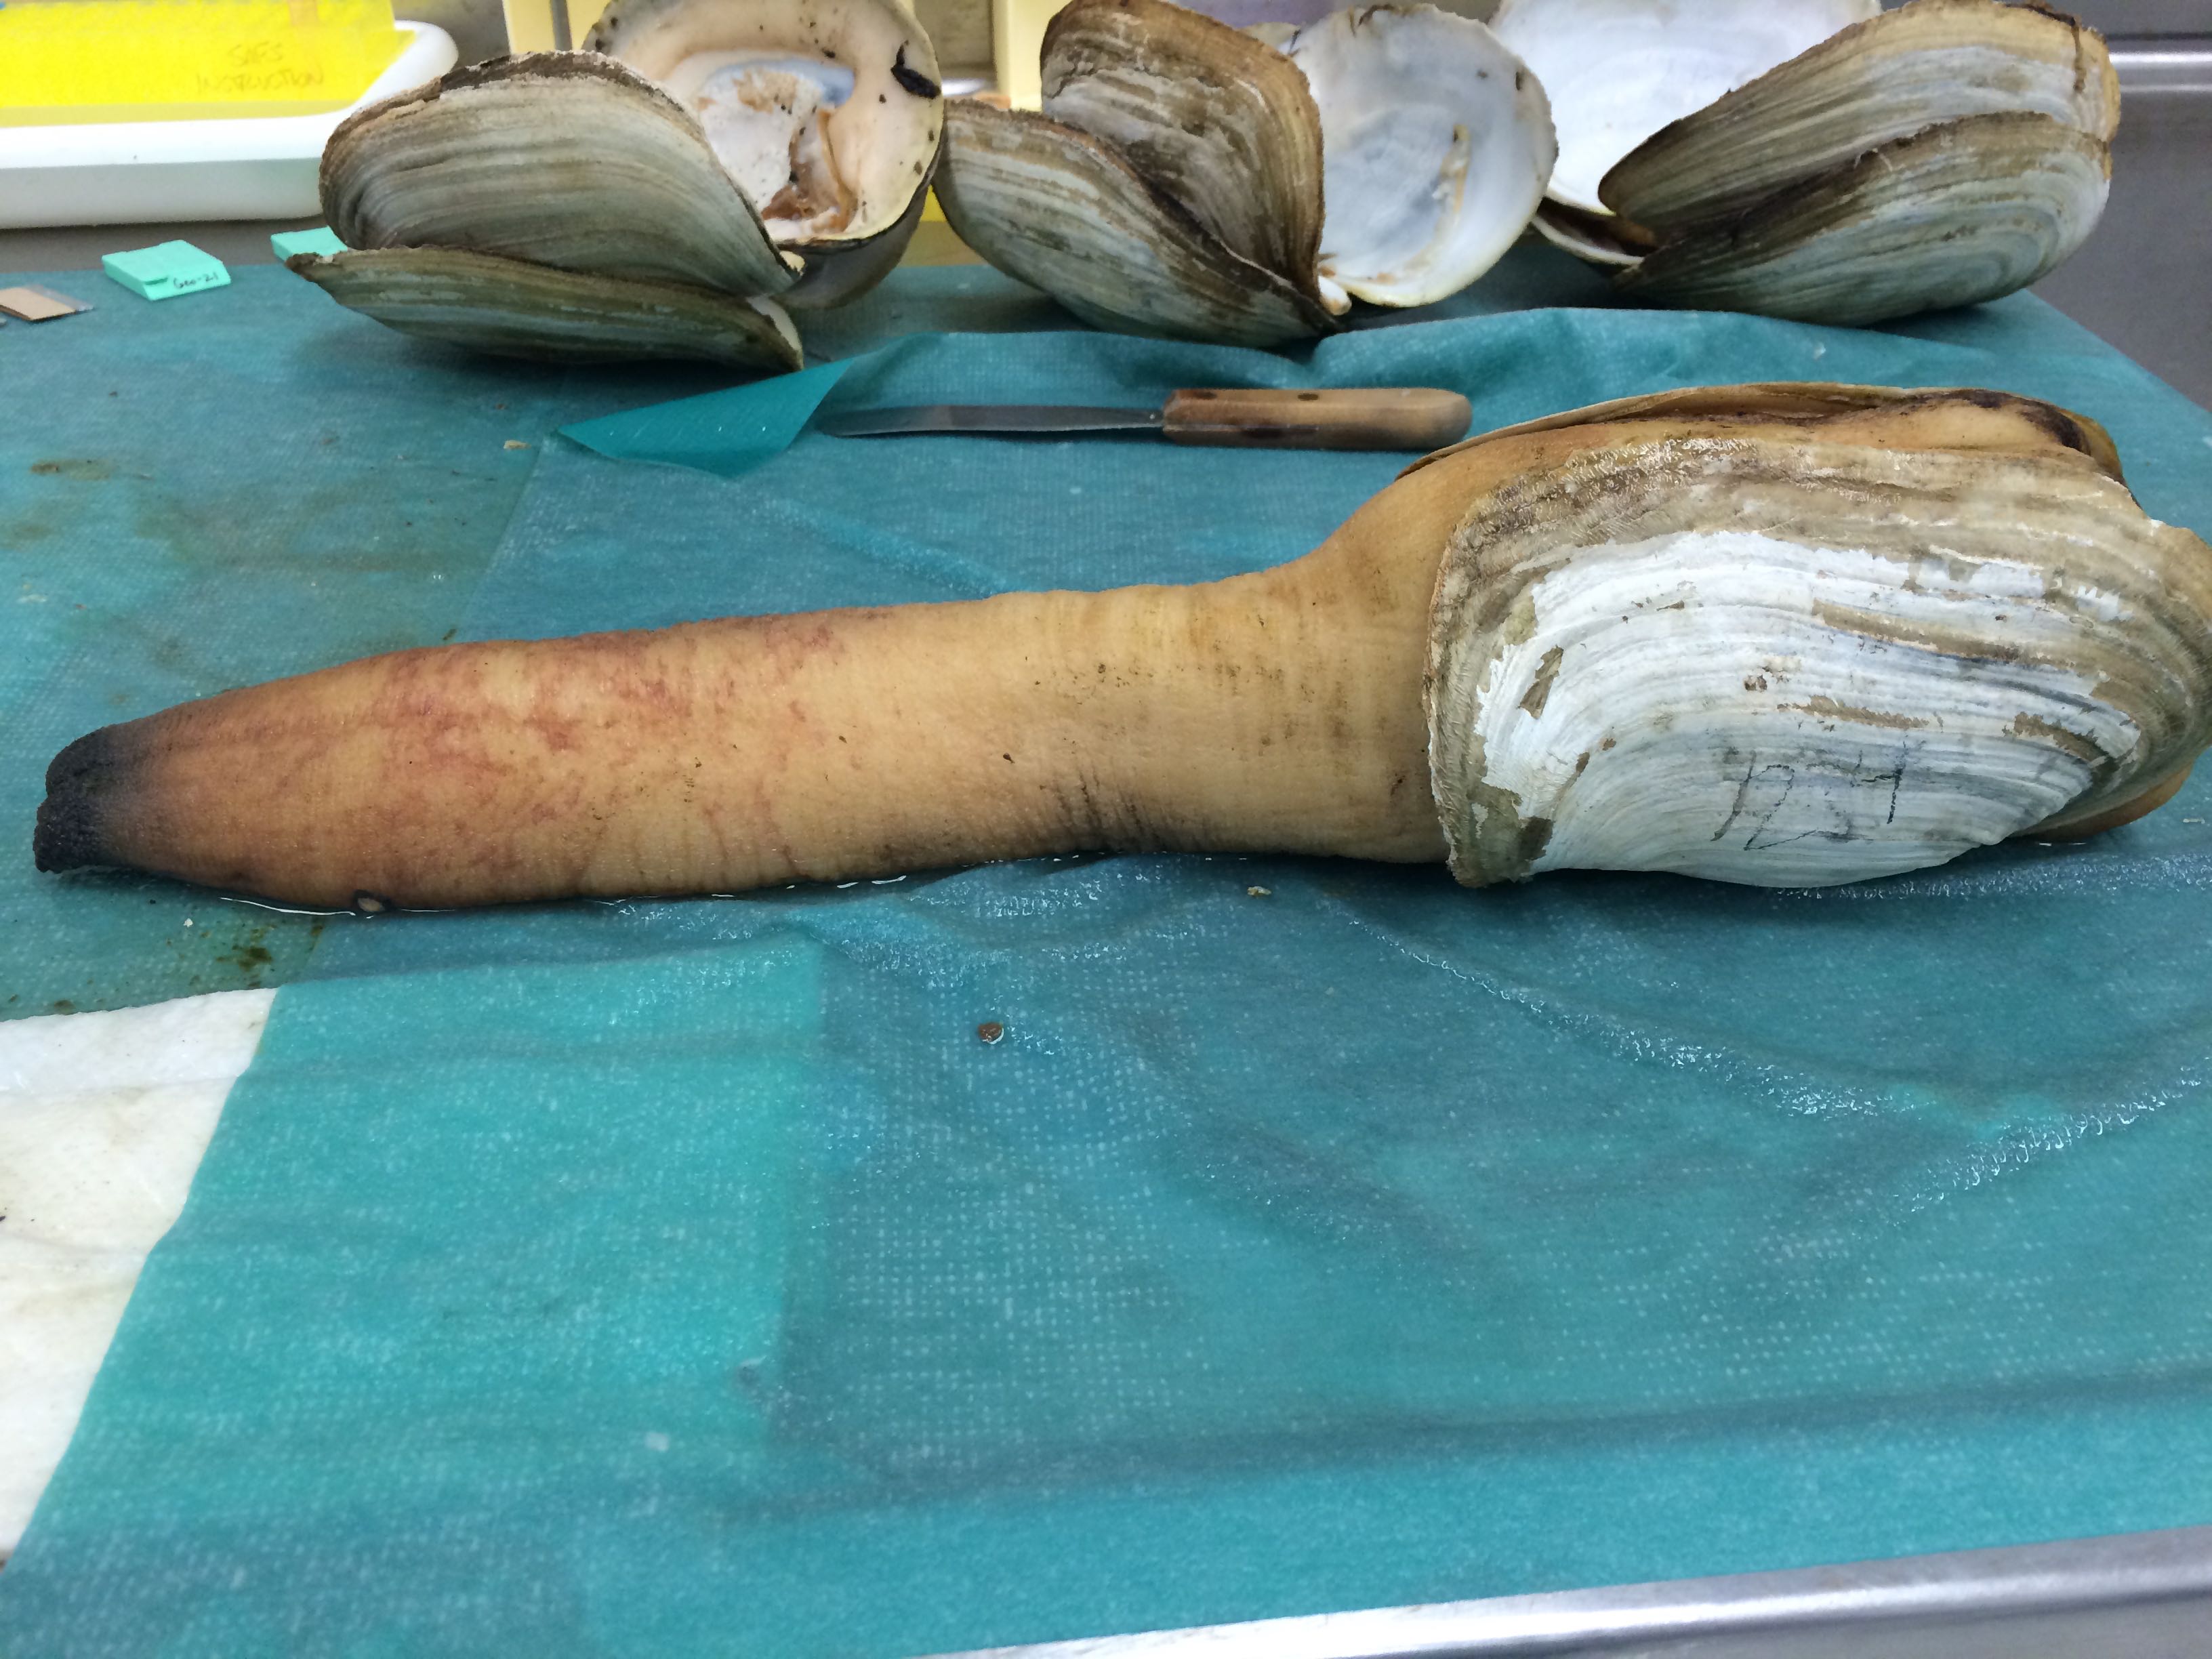
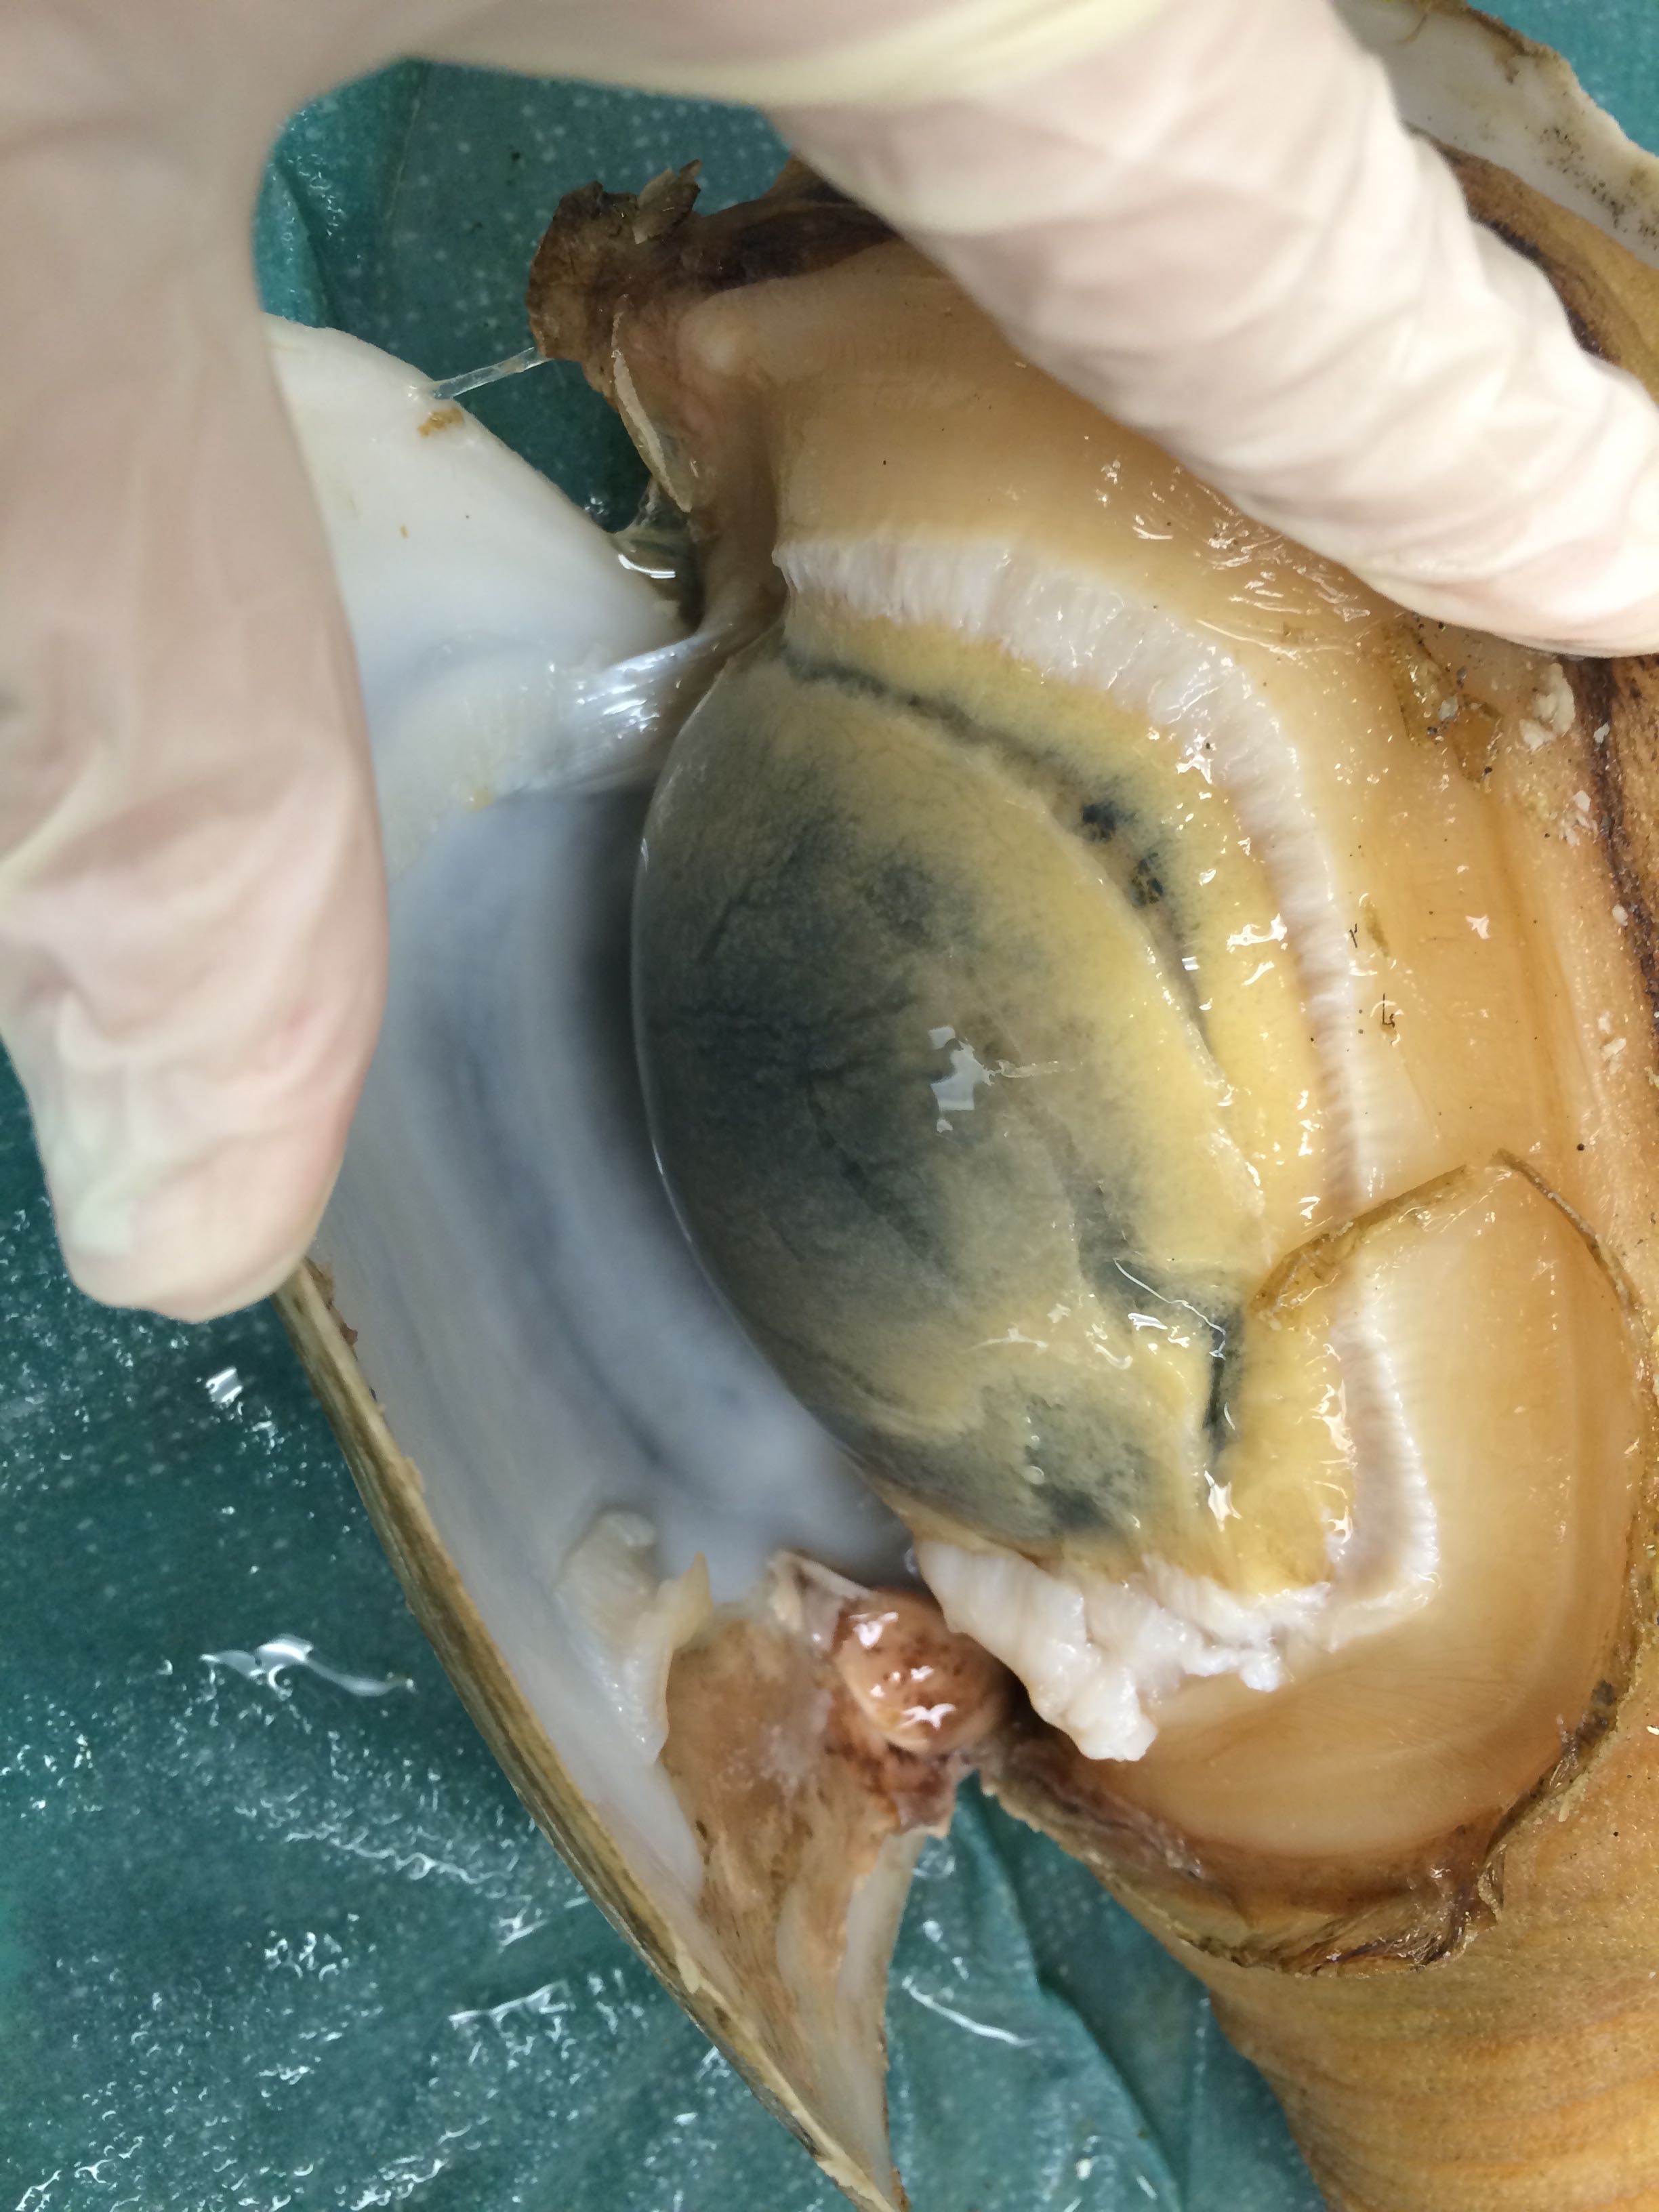 |
| Gonad is the dark round tissue under the thin membrane. Reddish coloration to the tissue. - Geo-24 |
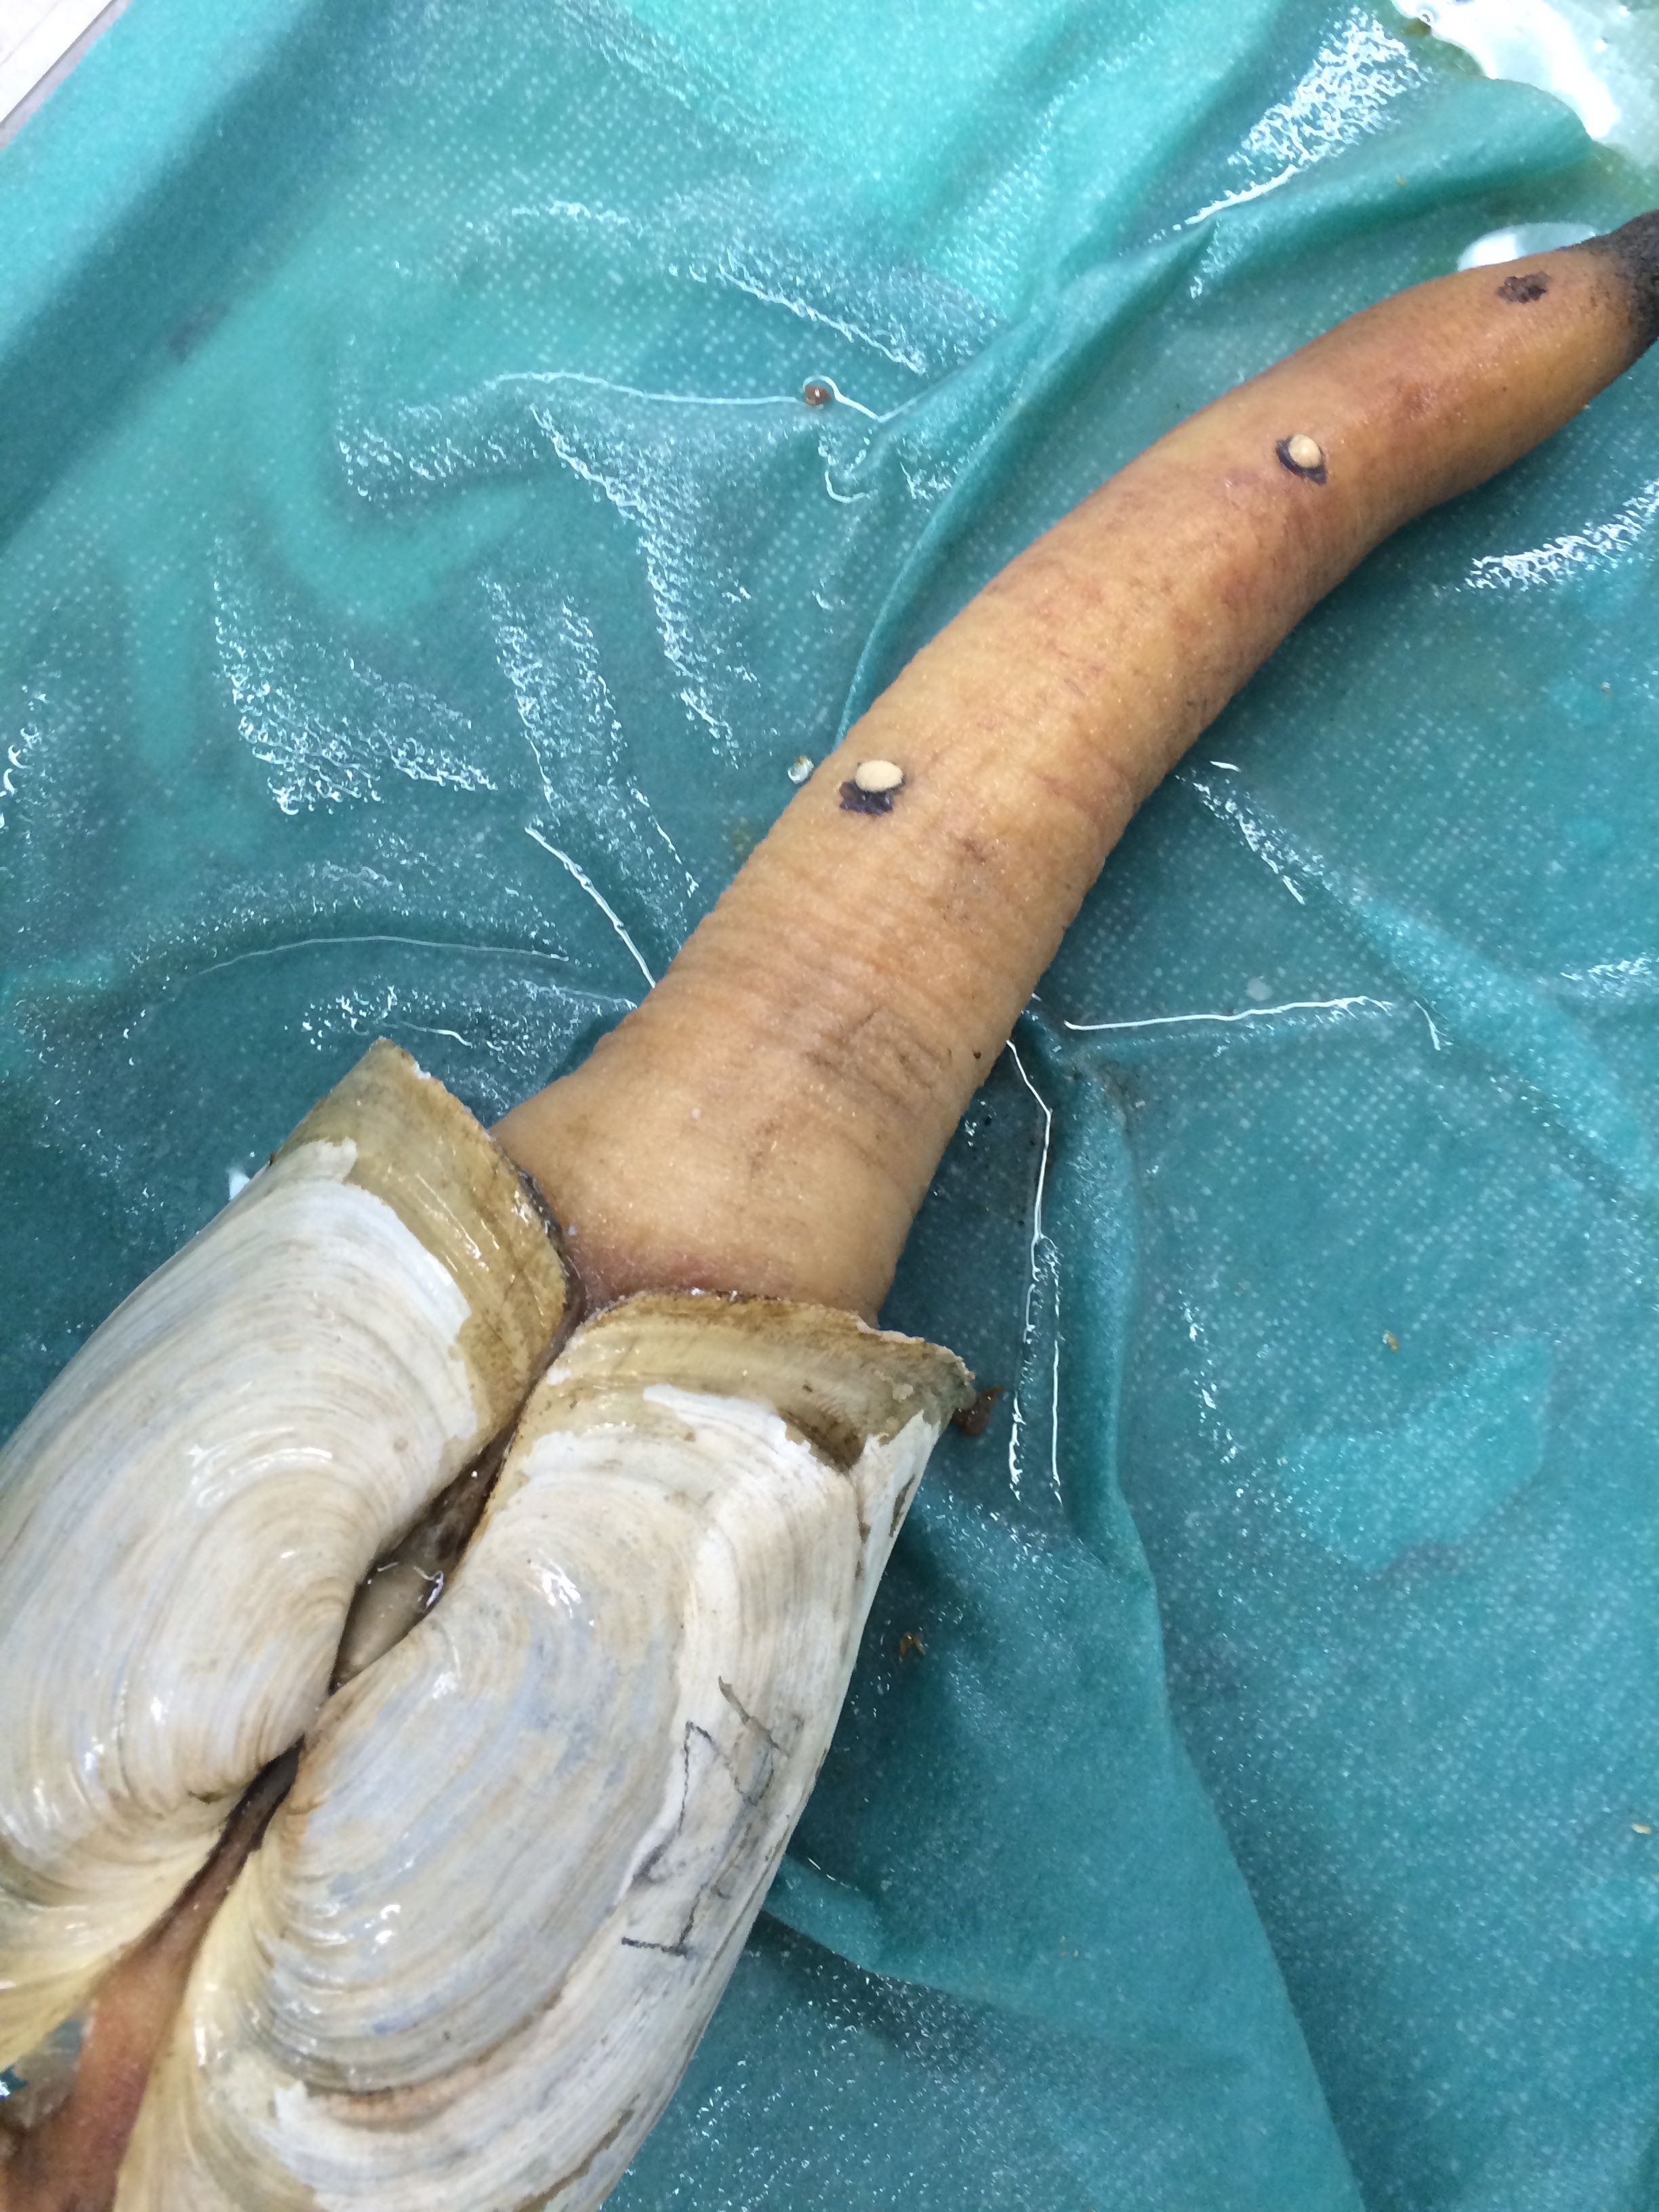 |
| Some sort of growths on Geo-24. Reddish coloration to the siphon |
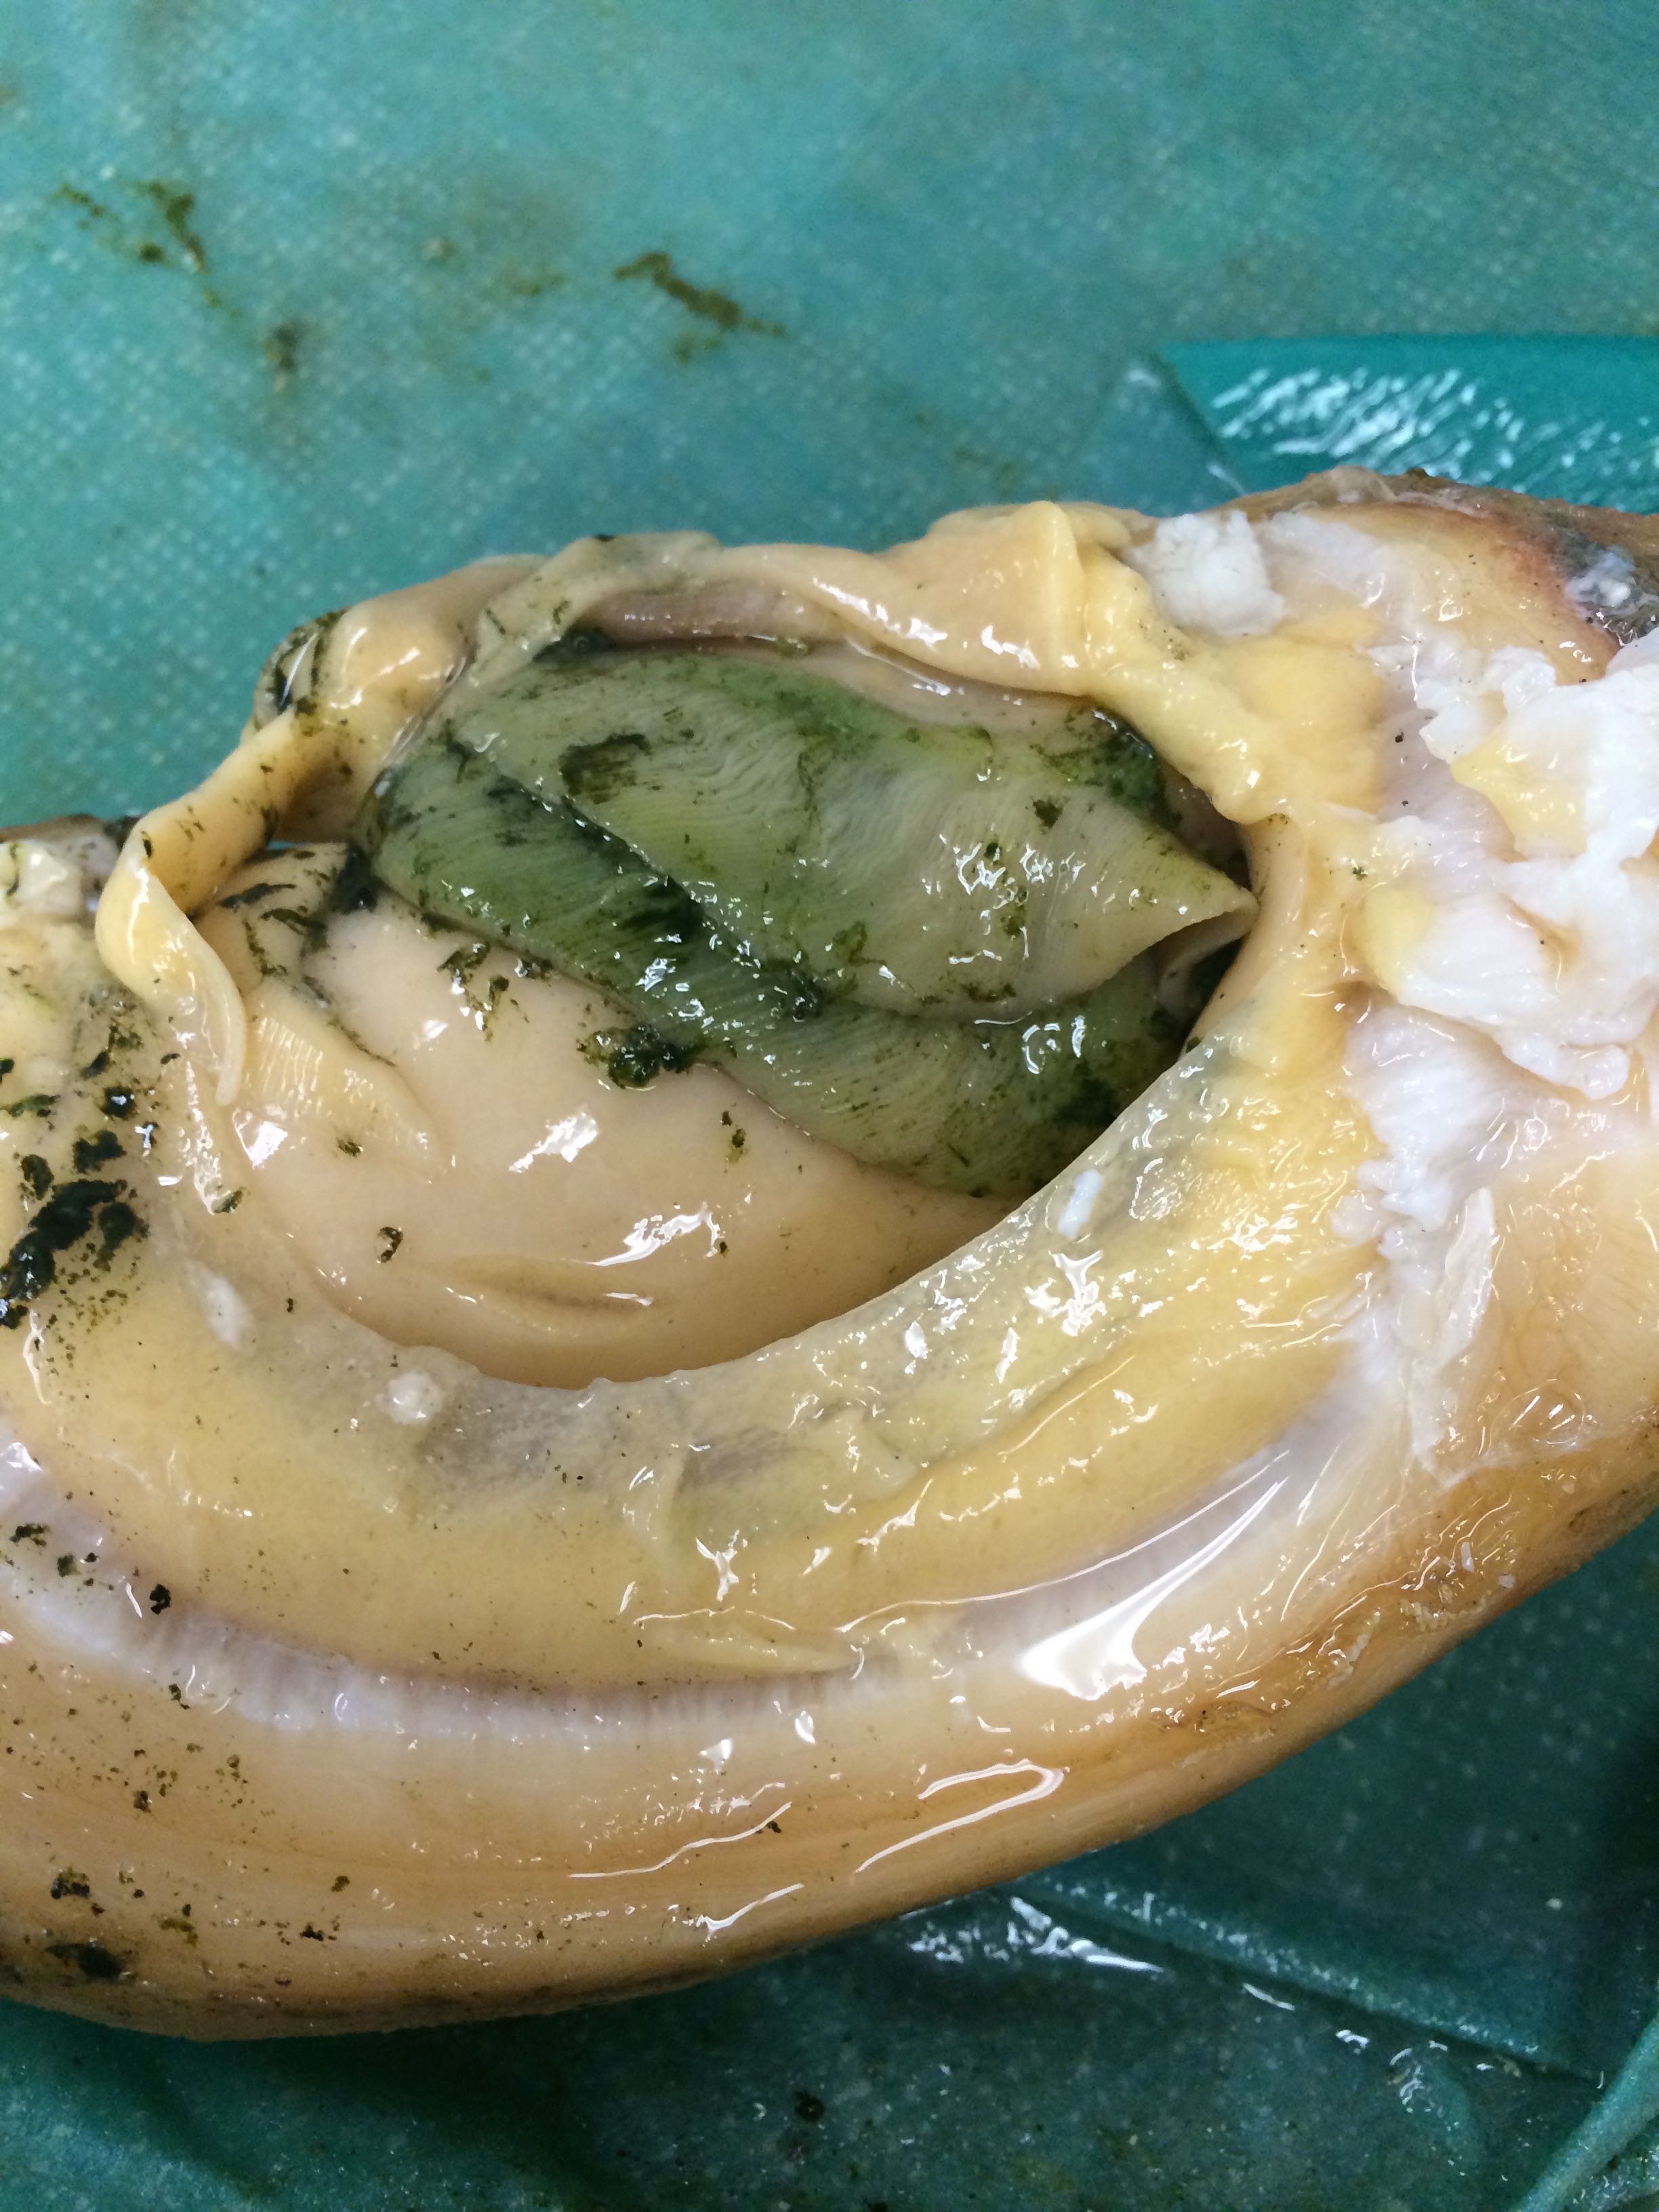
Tomorrow I will switch out the PAXgene Tissue FIX with the PAXgene Tissue STABILIZER.
Wednesday, November 19, 2014
Today I made another python notebook with blasting and SQL sharing for the Manila Clam (Ruditapes philippinarum).Also, it has been decided that we will start taking hemolymph samples from the Geoducks starting this week, so I have been looking into how we would go about doing that this Friday.
Monday, November 17, 2014
Today I started a new blast python notebook for the manila clam.Link:
http://nbviewer.ipython.org/url/eagle.fish.washington.edu/scaphapoda/Grace/Transcriptomes/rphilippinarum/R.%20philippinarum%20Blast%20.ipynb
I also am reading about a study done on manila clams involving sex-determination.
Article link:
http://www.ncbi.nlm.nih.gov/pubmed/21976711
Saturday, November 15, 2014
I switched the PAXgene Tissue FIX solution out with the PAXgene Tissue STABILIZER solution, re-labeled the containers, and placed in the refrigerator with the samples from last week.Friday, November 14, 2014
Today I did the same process as last week with a new sample of 8 geoducks that were delivered to the lab yesterday morning by Steven. Molly got the geoducks from Taylor Hatchery at 3pm on Wednesday, November 12th, so they have been out of the water since then. Yesterday afternoon I came in and dumped out the water that they were sitting in, as Brent suggested. They were much less dehydrated-looking when I came in today than the geoducks last week.The geoducks today were quite a bit bigger than last week's.
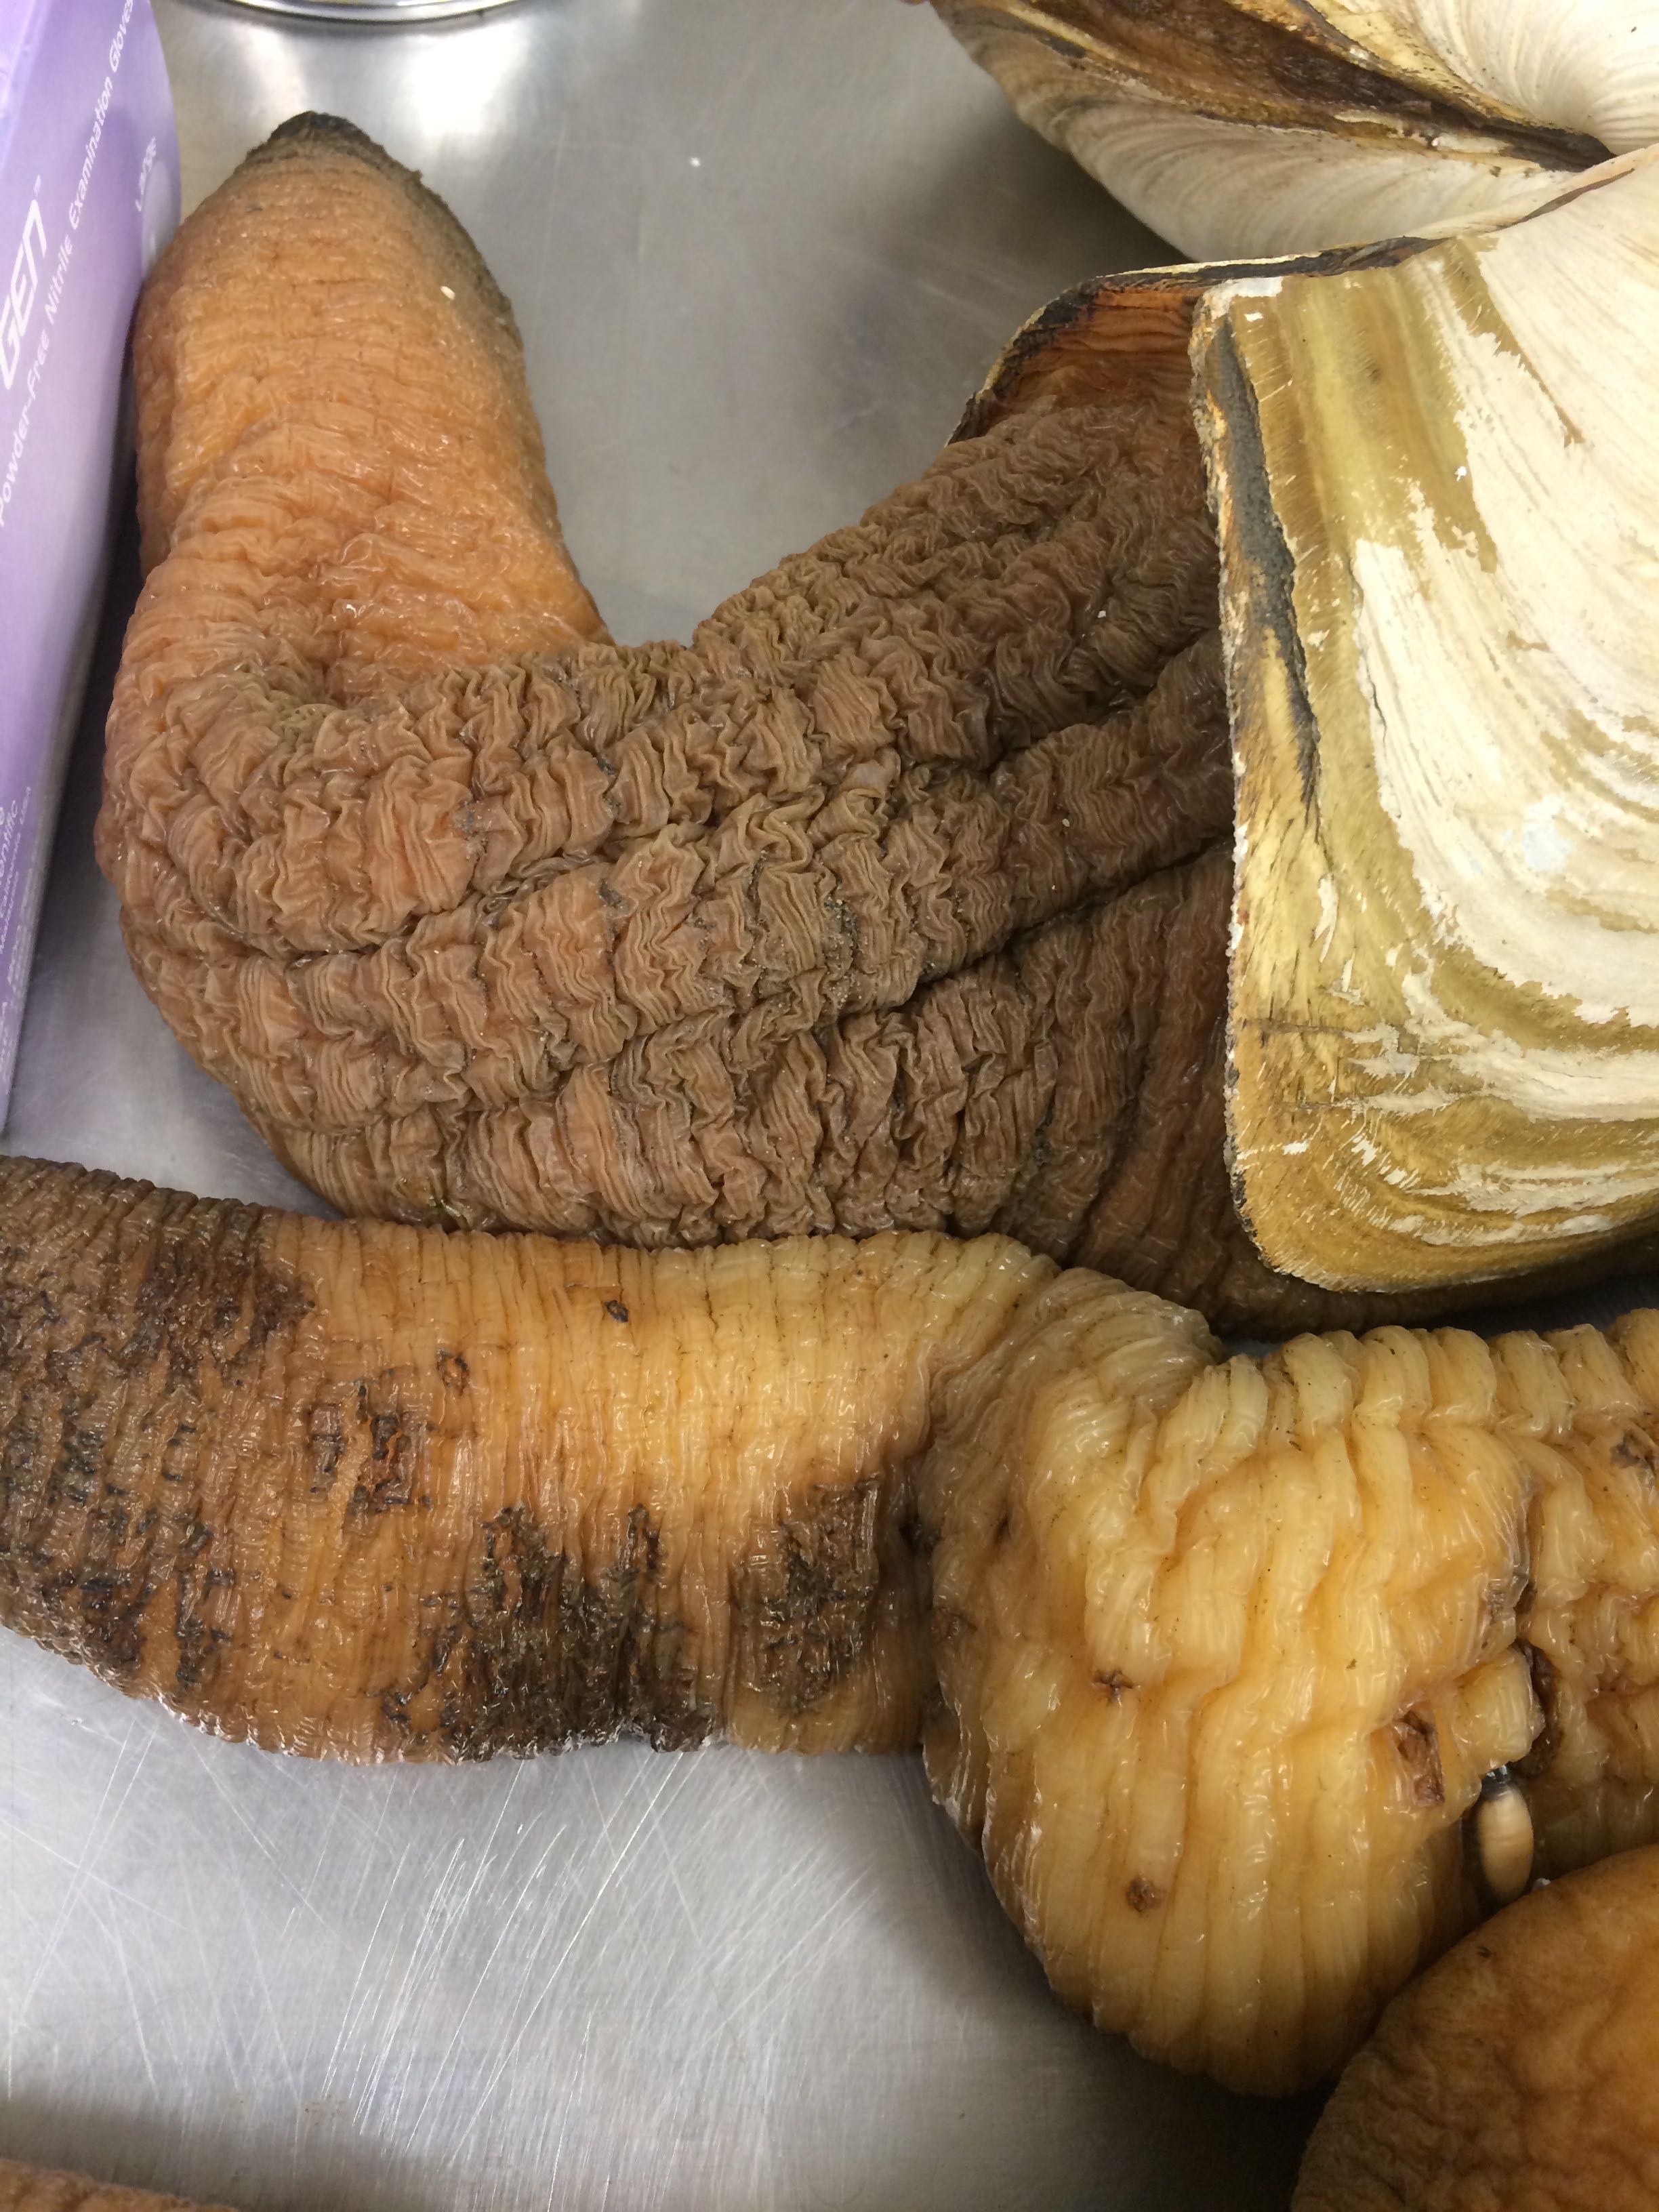
Some of them had this strange texture to them:
Also, a lot of them had their pedal gapes open and their feet were either visible, or actually coming out a little bit. Feet in adults are vestigial.
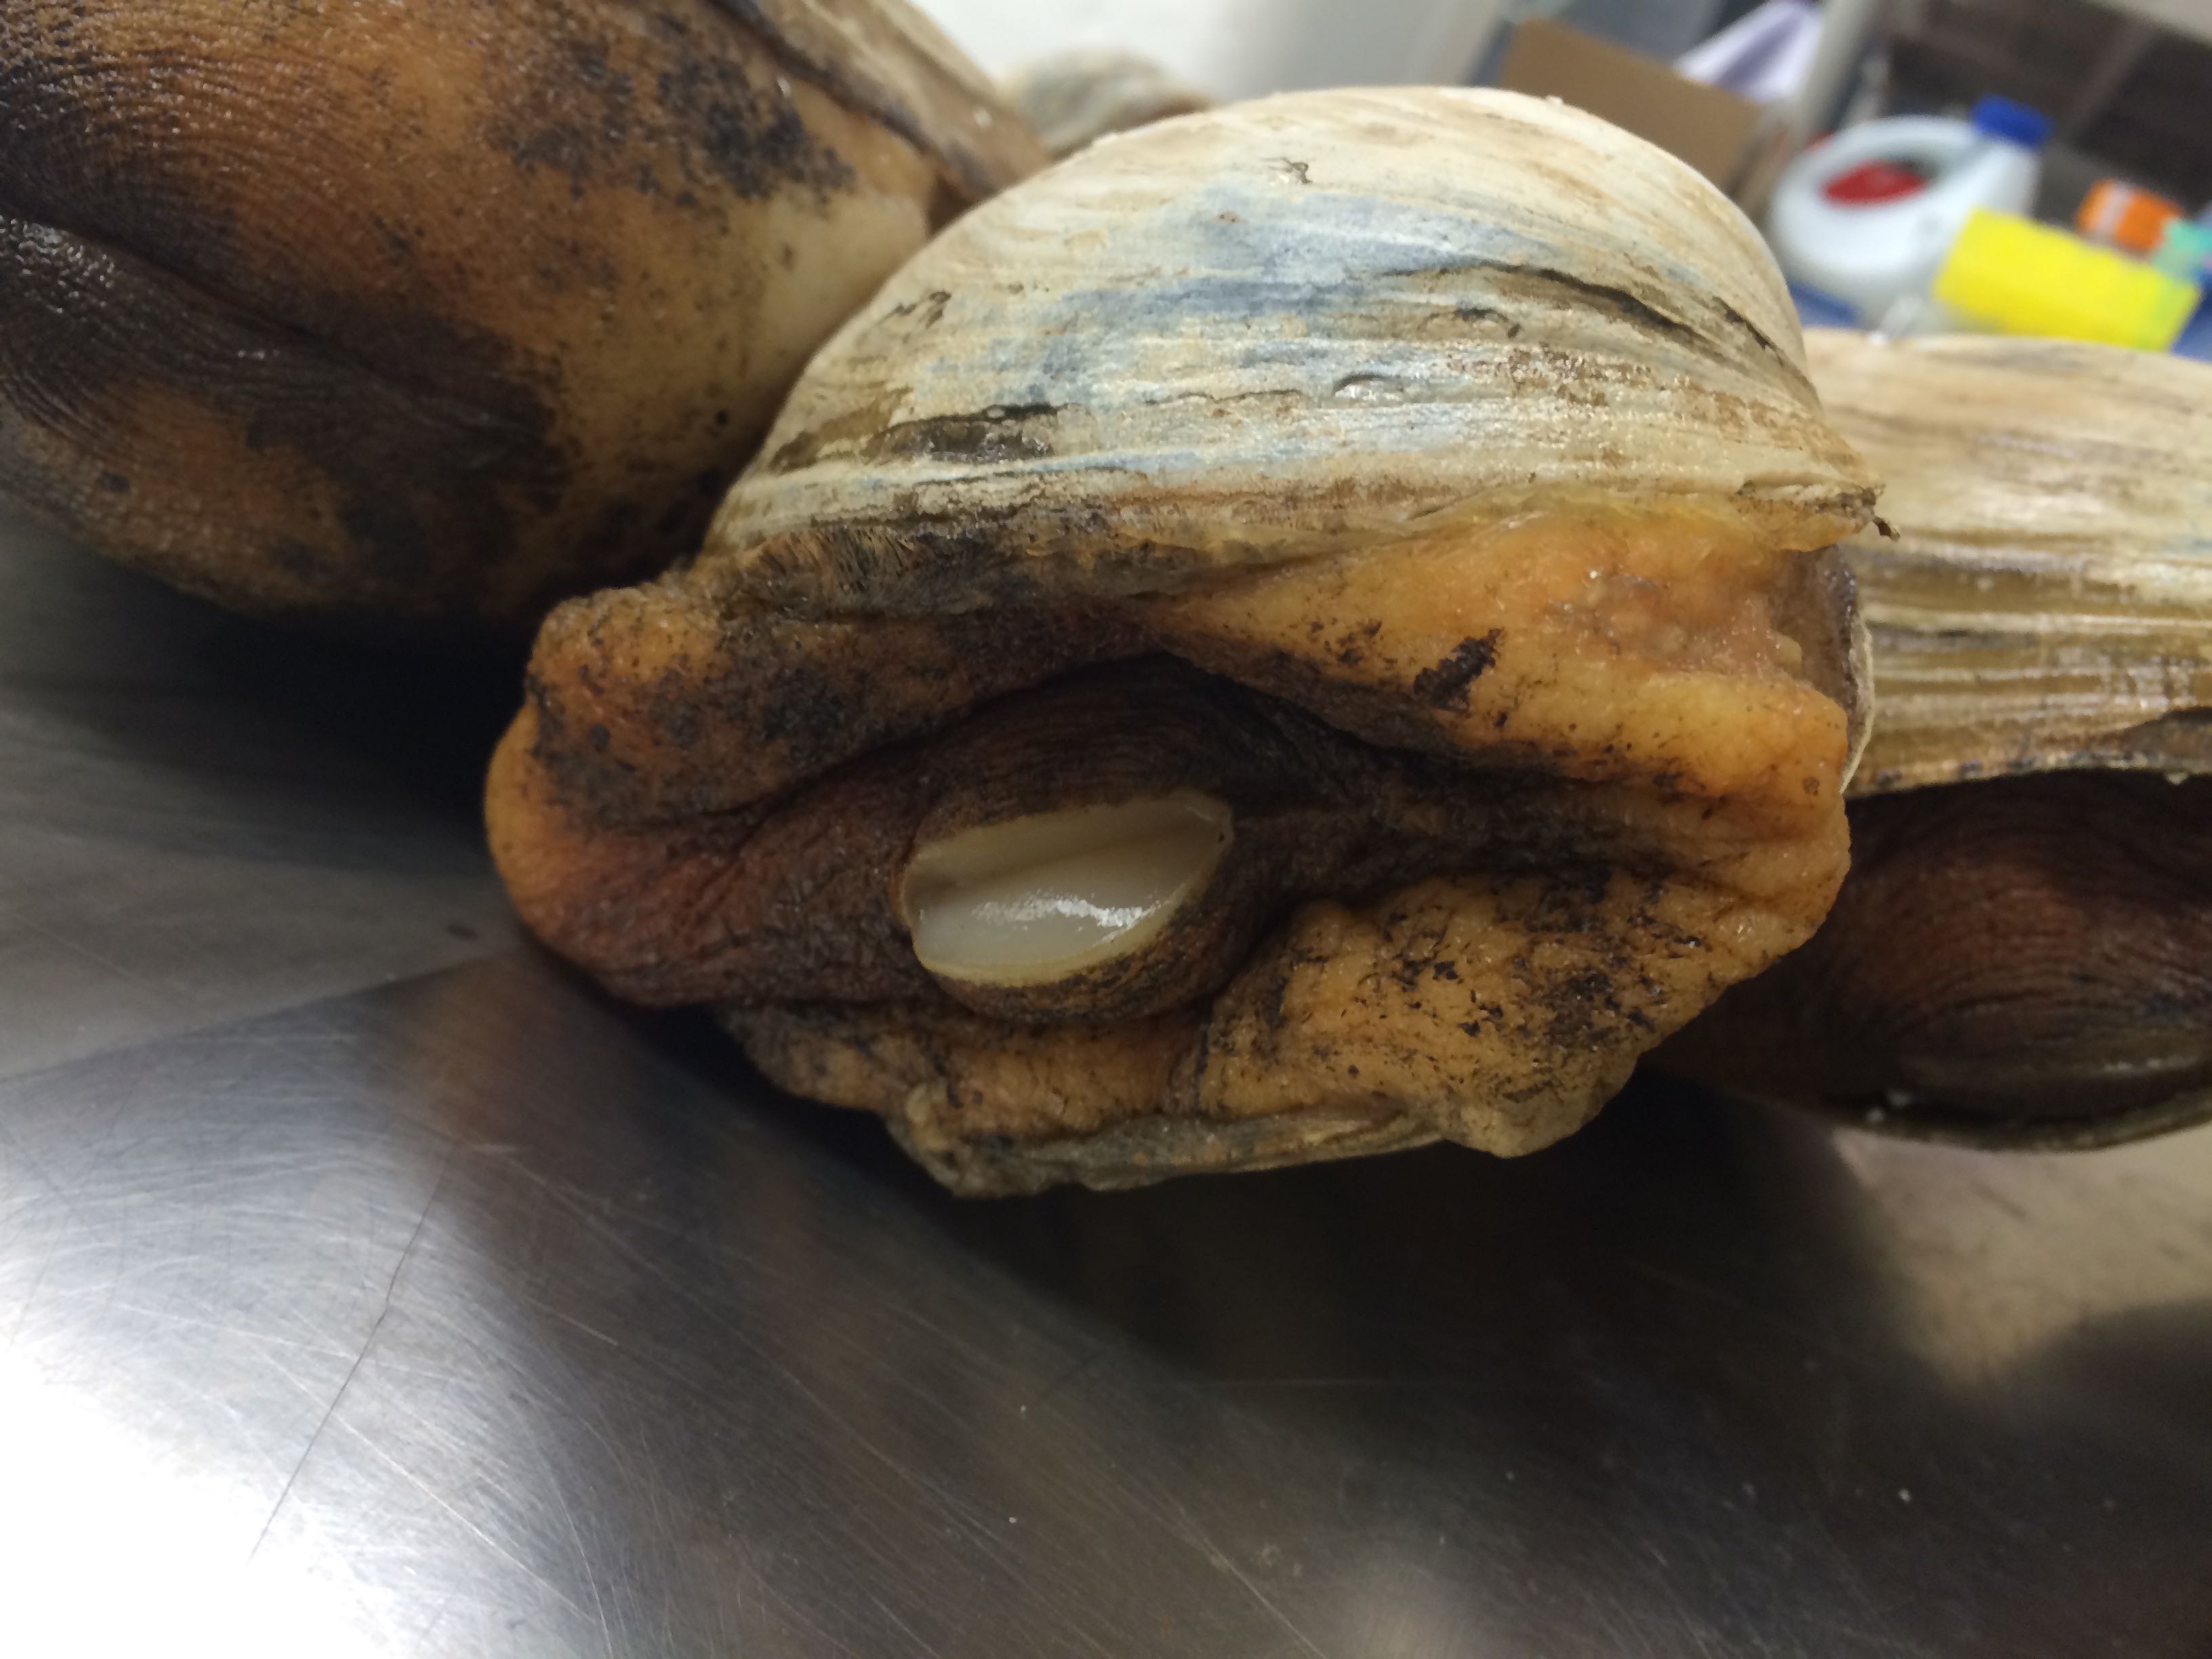
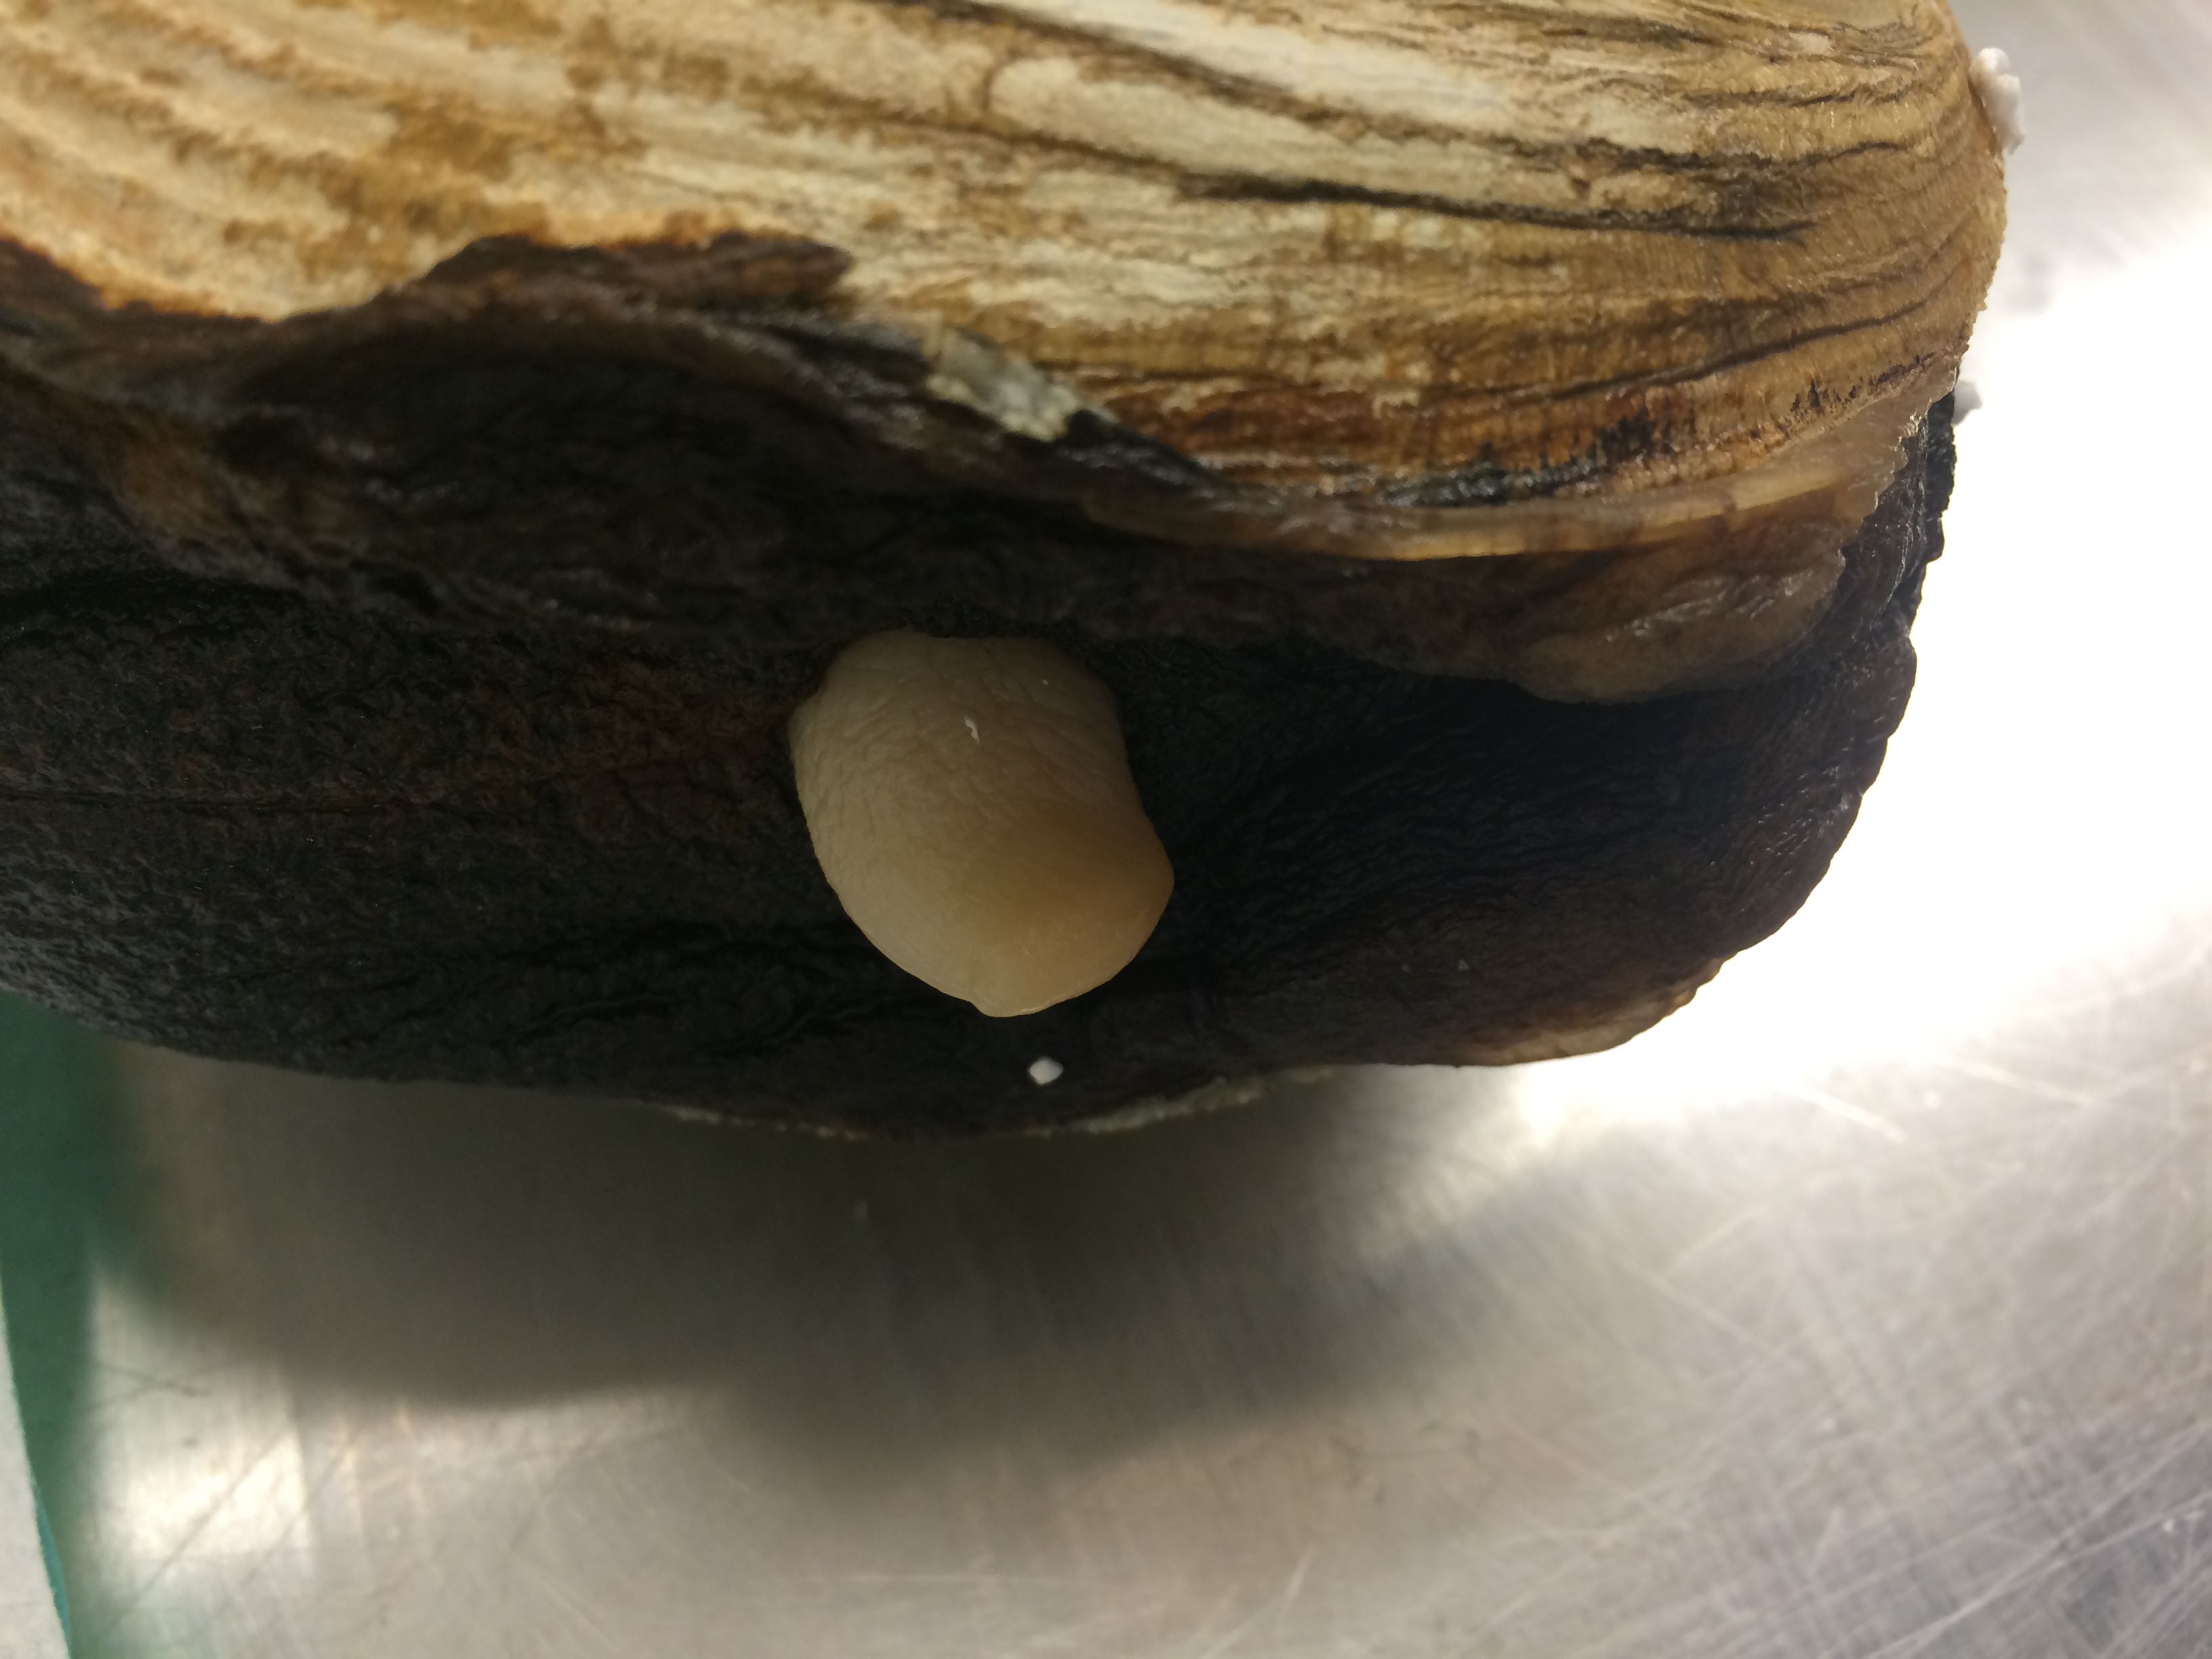
Geo-10 with pedal gape and foot visible Geo-09 pedal gape and foot coming out
Geo-11 even had a white sore-like looking thing on it. I'm not sure what it could be.
I also took a smear of the gonad of Geo-16 and placed it on a slide to look at the cells under the microscope.
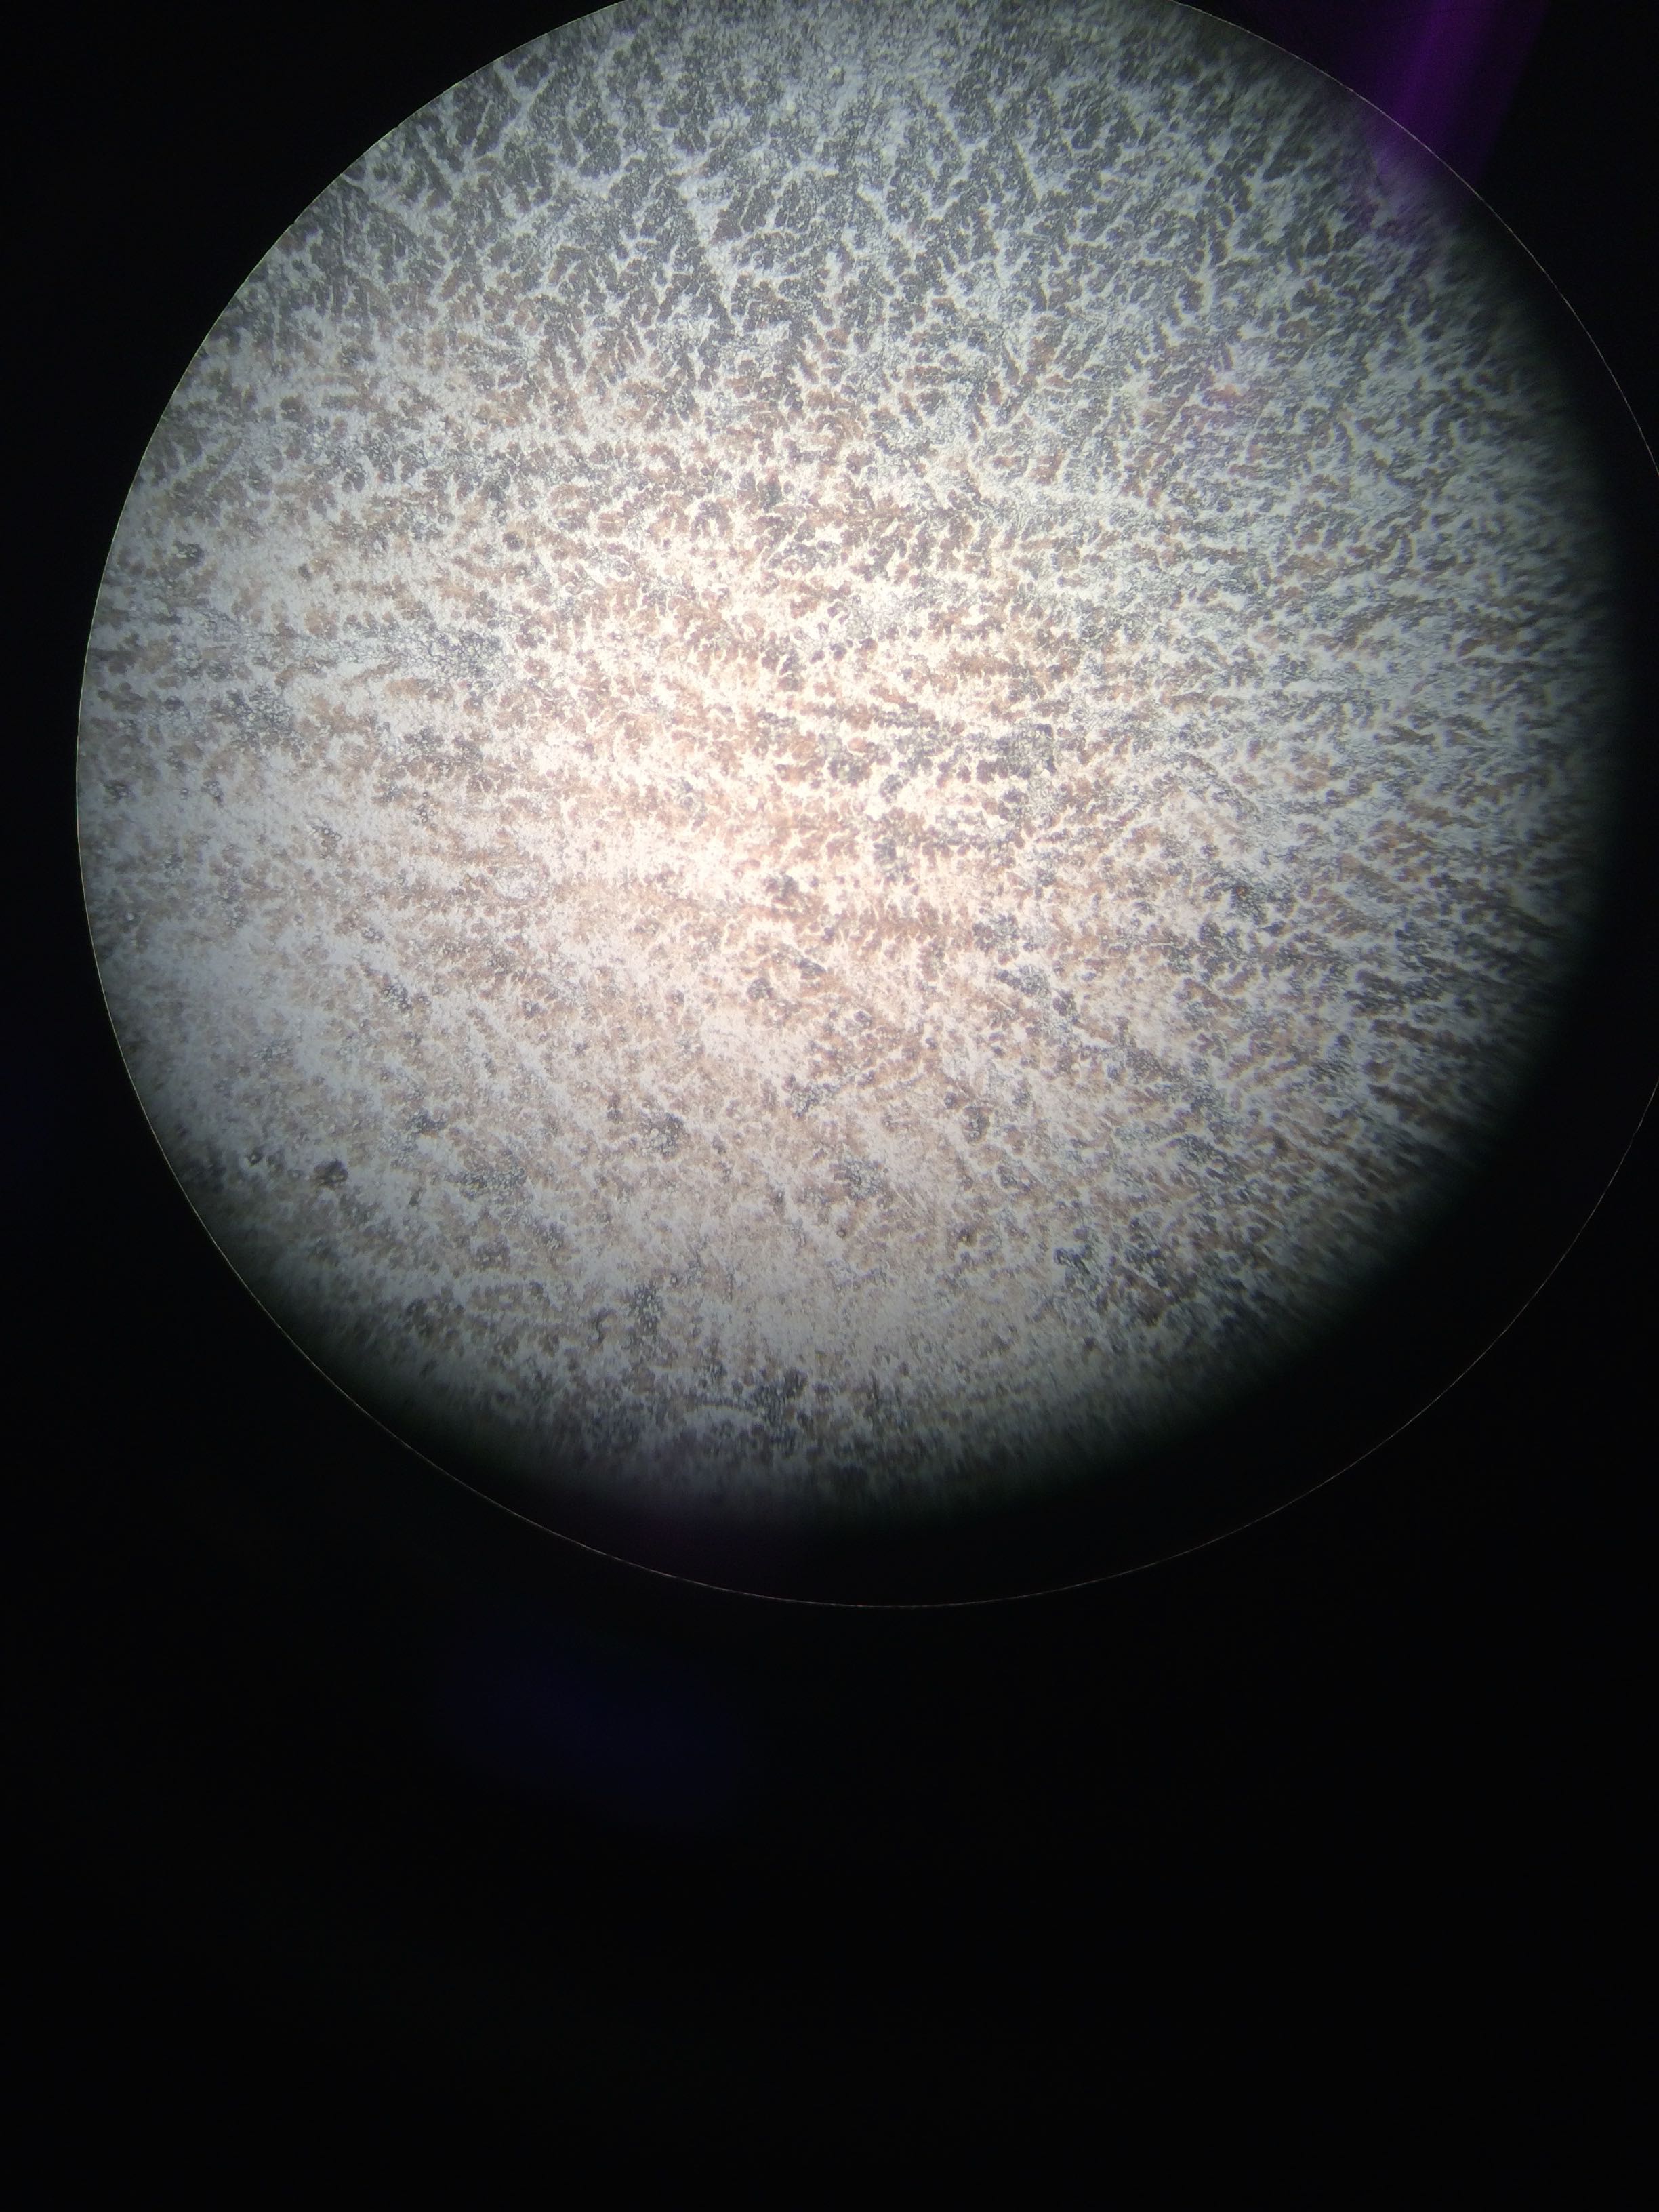
Geo-16 gonad smear cells
The weight and length data from today:
| Animal Label |
Weight (g) |
Length |
| Geo-09 |
1107.8 |
155 |
| Geo-10 |
1342.3 |
164 |
| Geo-11 |
1230.1 |
150 |
| Geo-12 |
1653.0 |
178 |
| Geo-13 |
1170.2 |
169 |
| Geo-14 |
1355.2 |
161 |
| Geo-15 |
1026.8 |
150 |
| Geo-16 |
1100.5 |
141 |
Saturday, November 8, 2014
Today I came in and switched the histology cassettes that were sitting in the PAXgene Tissue FIX with the PAXgene Tissue STABILIZER after I diluted it with 350ml of 200-proof ethanol, creating a solution of 500 ml. I re-labeled the containers saying that they now contain the STABILIZER and set them in the fridge in FTR 213 until we ship them to become histology slides within the month.Friday, November 7, 2014
Today I started my capstone project! Brent Vadopalas came up with the experiment and design.There are a total of 100 Geoducks being kept at Taylor Fish Hatchery from _. Brent brought 8 to lab yesterday for sampling today.
They were kept in a container in the refrigerator in lab. They were on the more dehydrated side, so they weren't looking too happy when we came in to lab today.
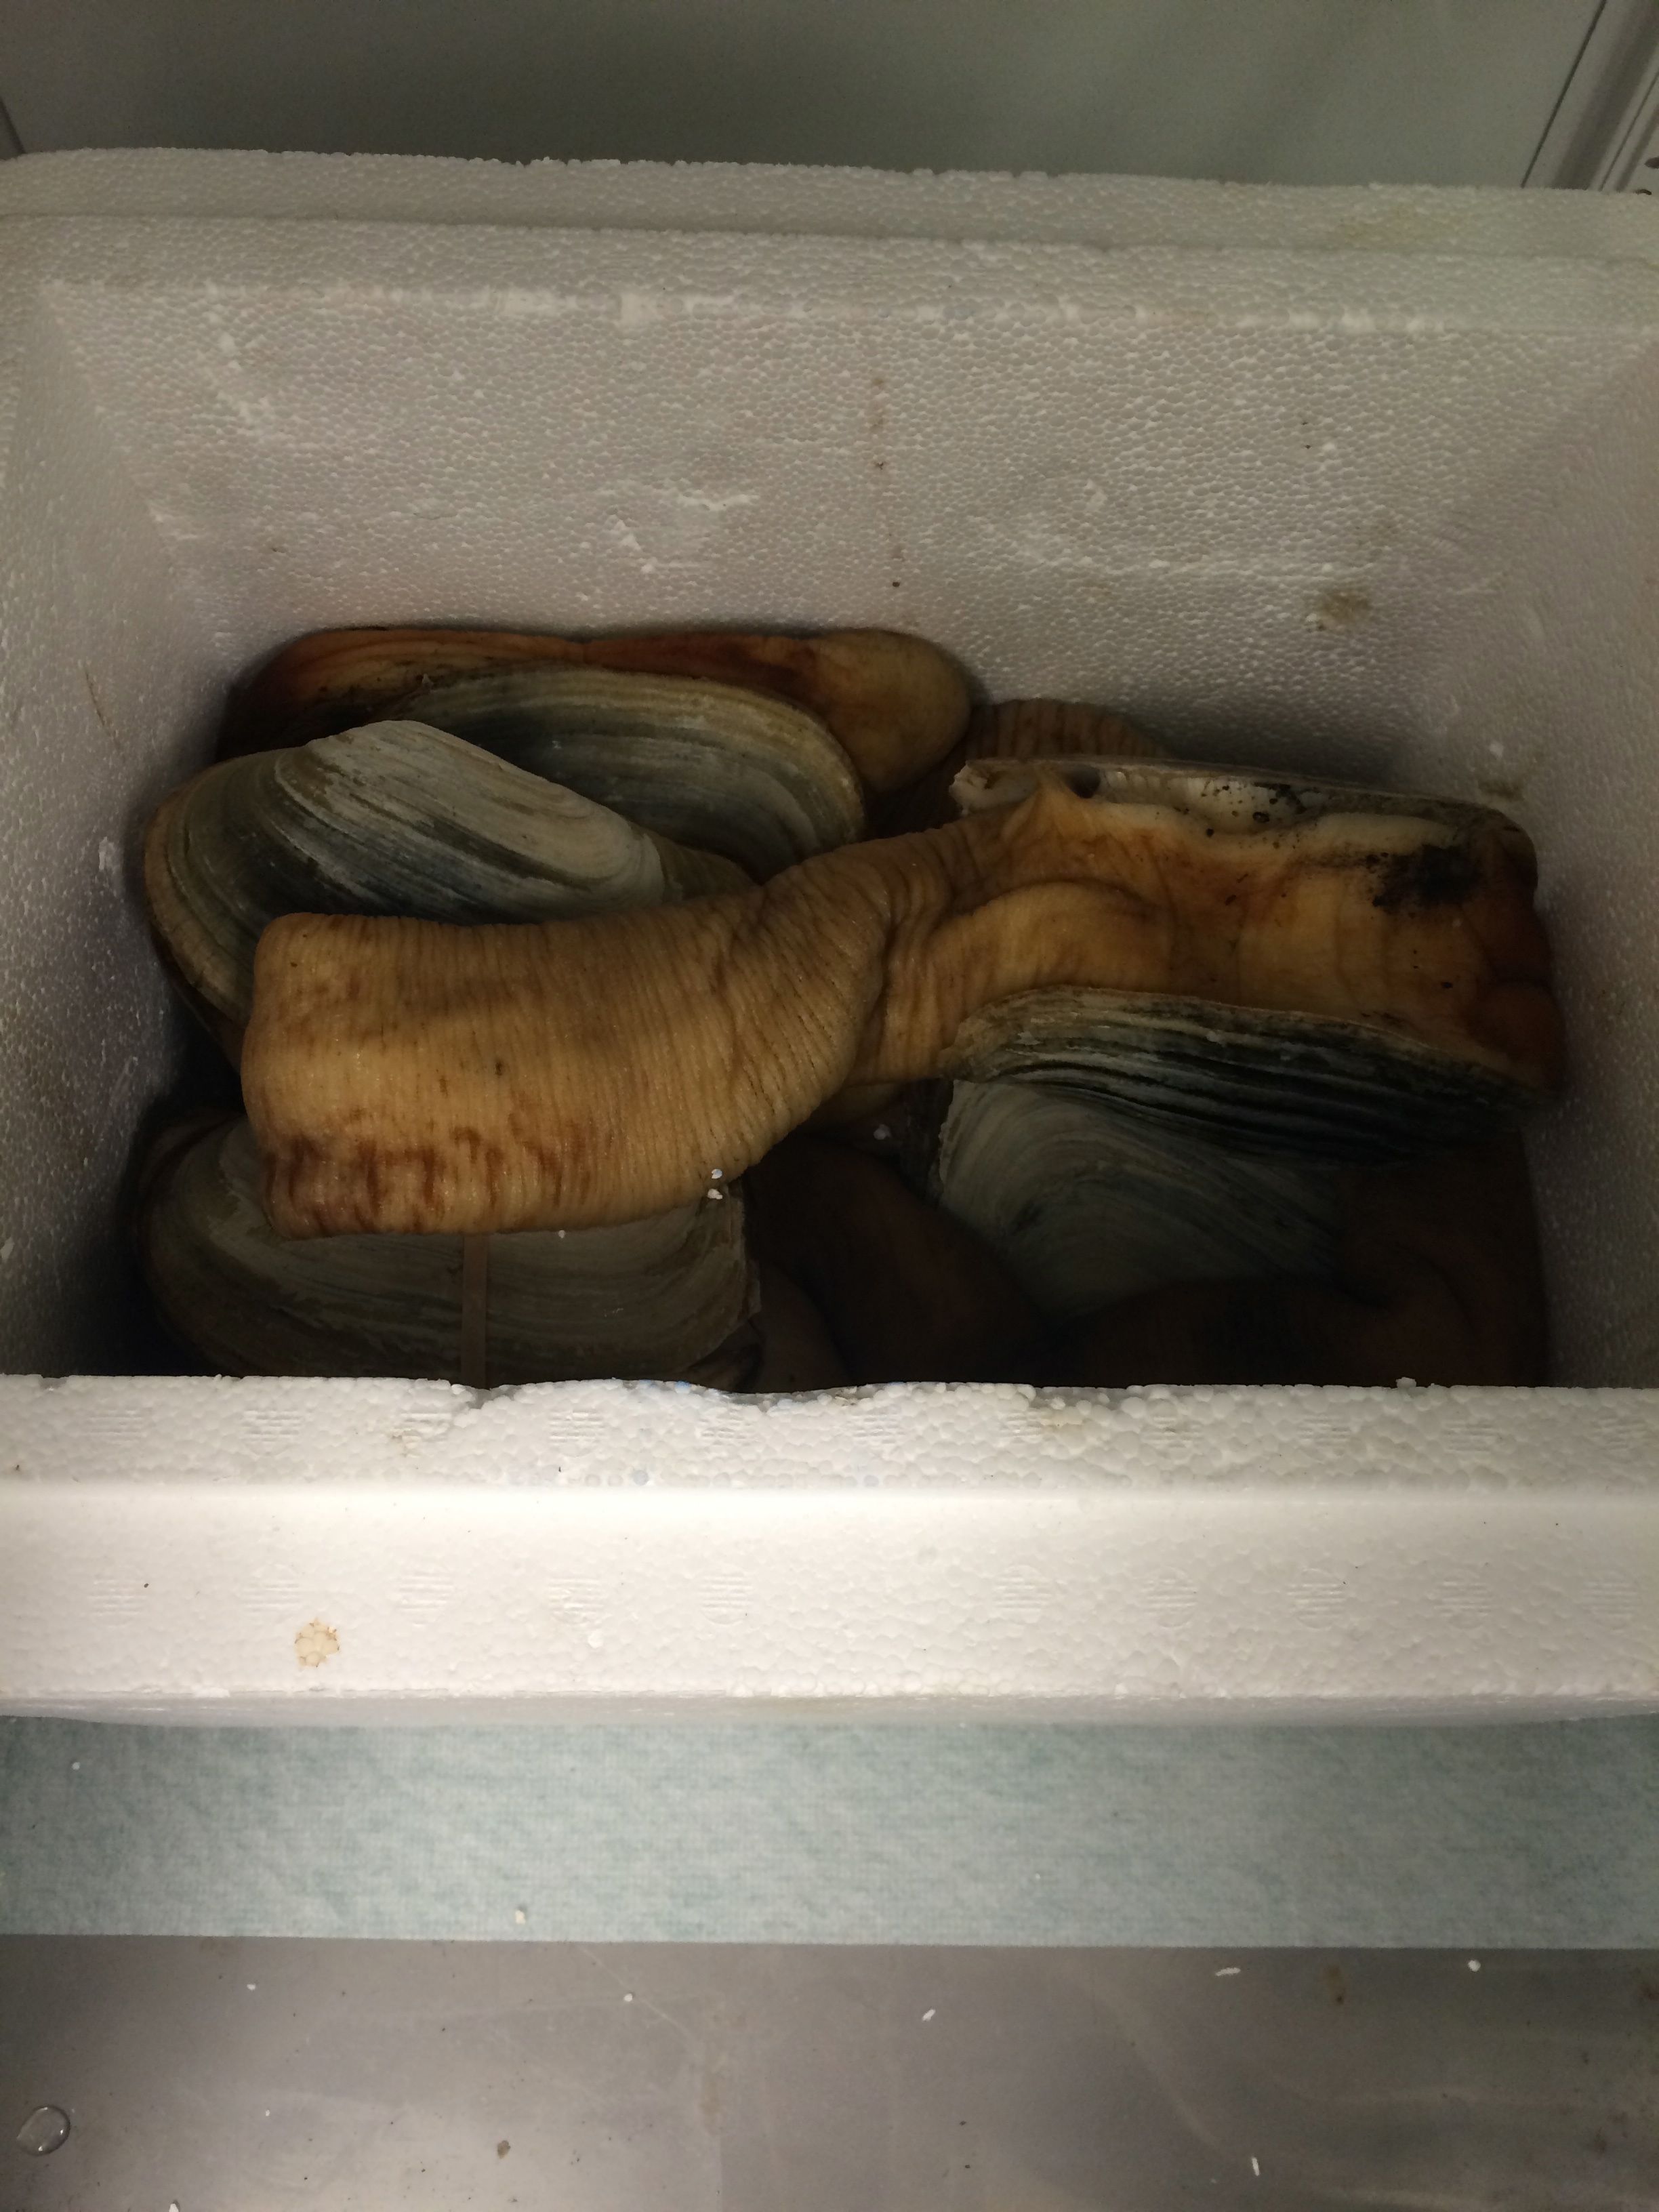
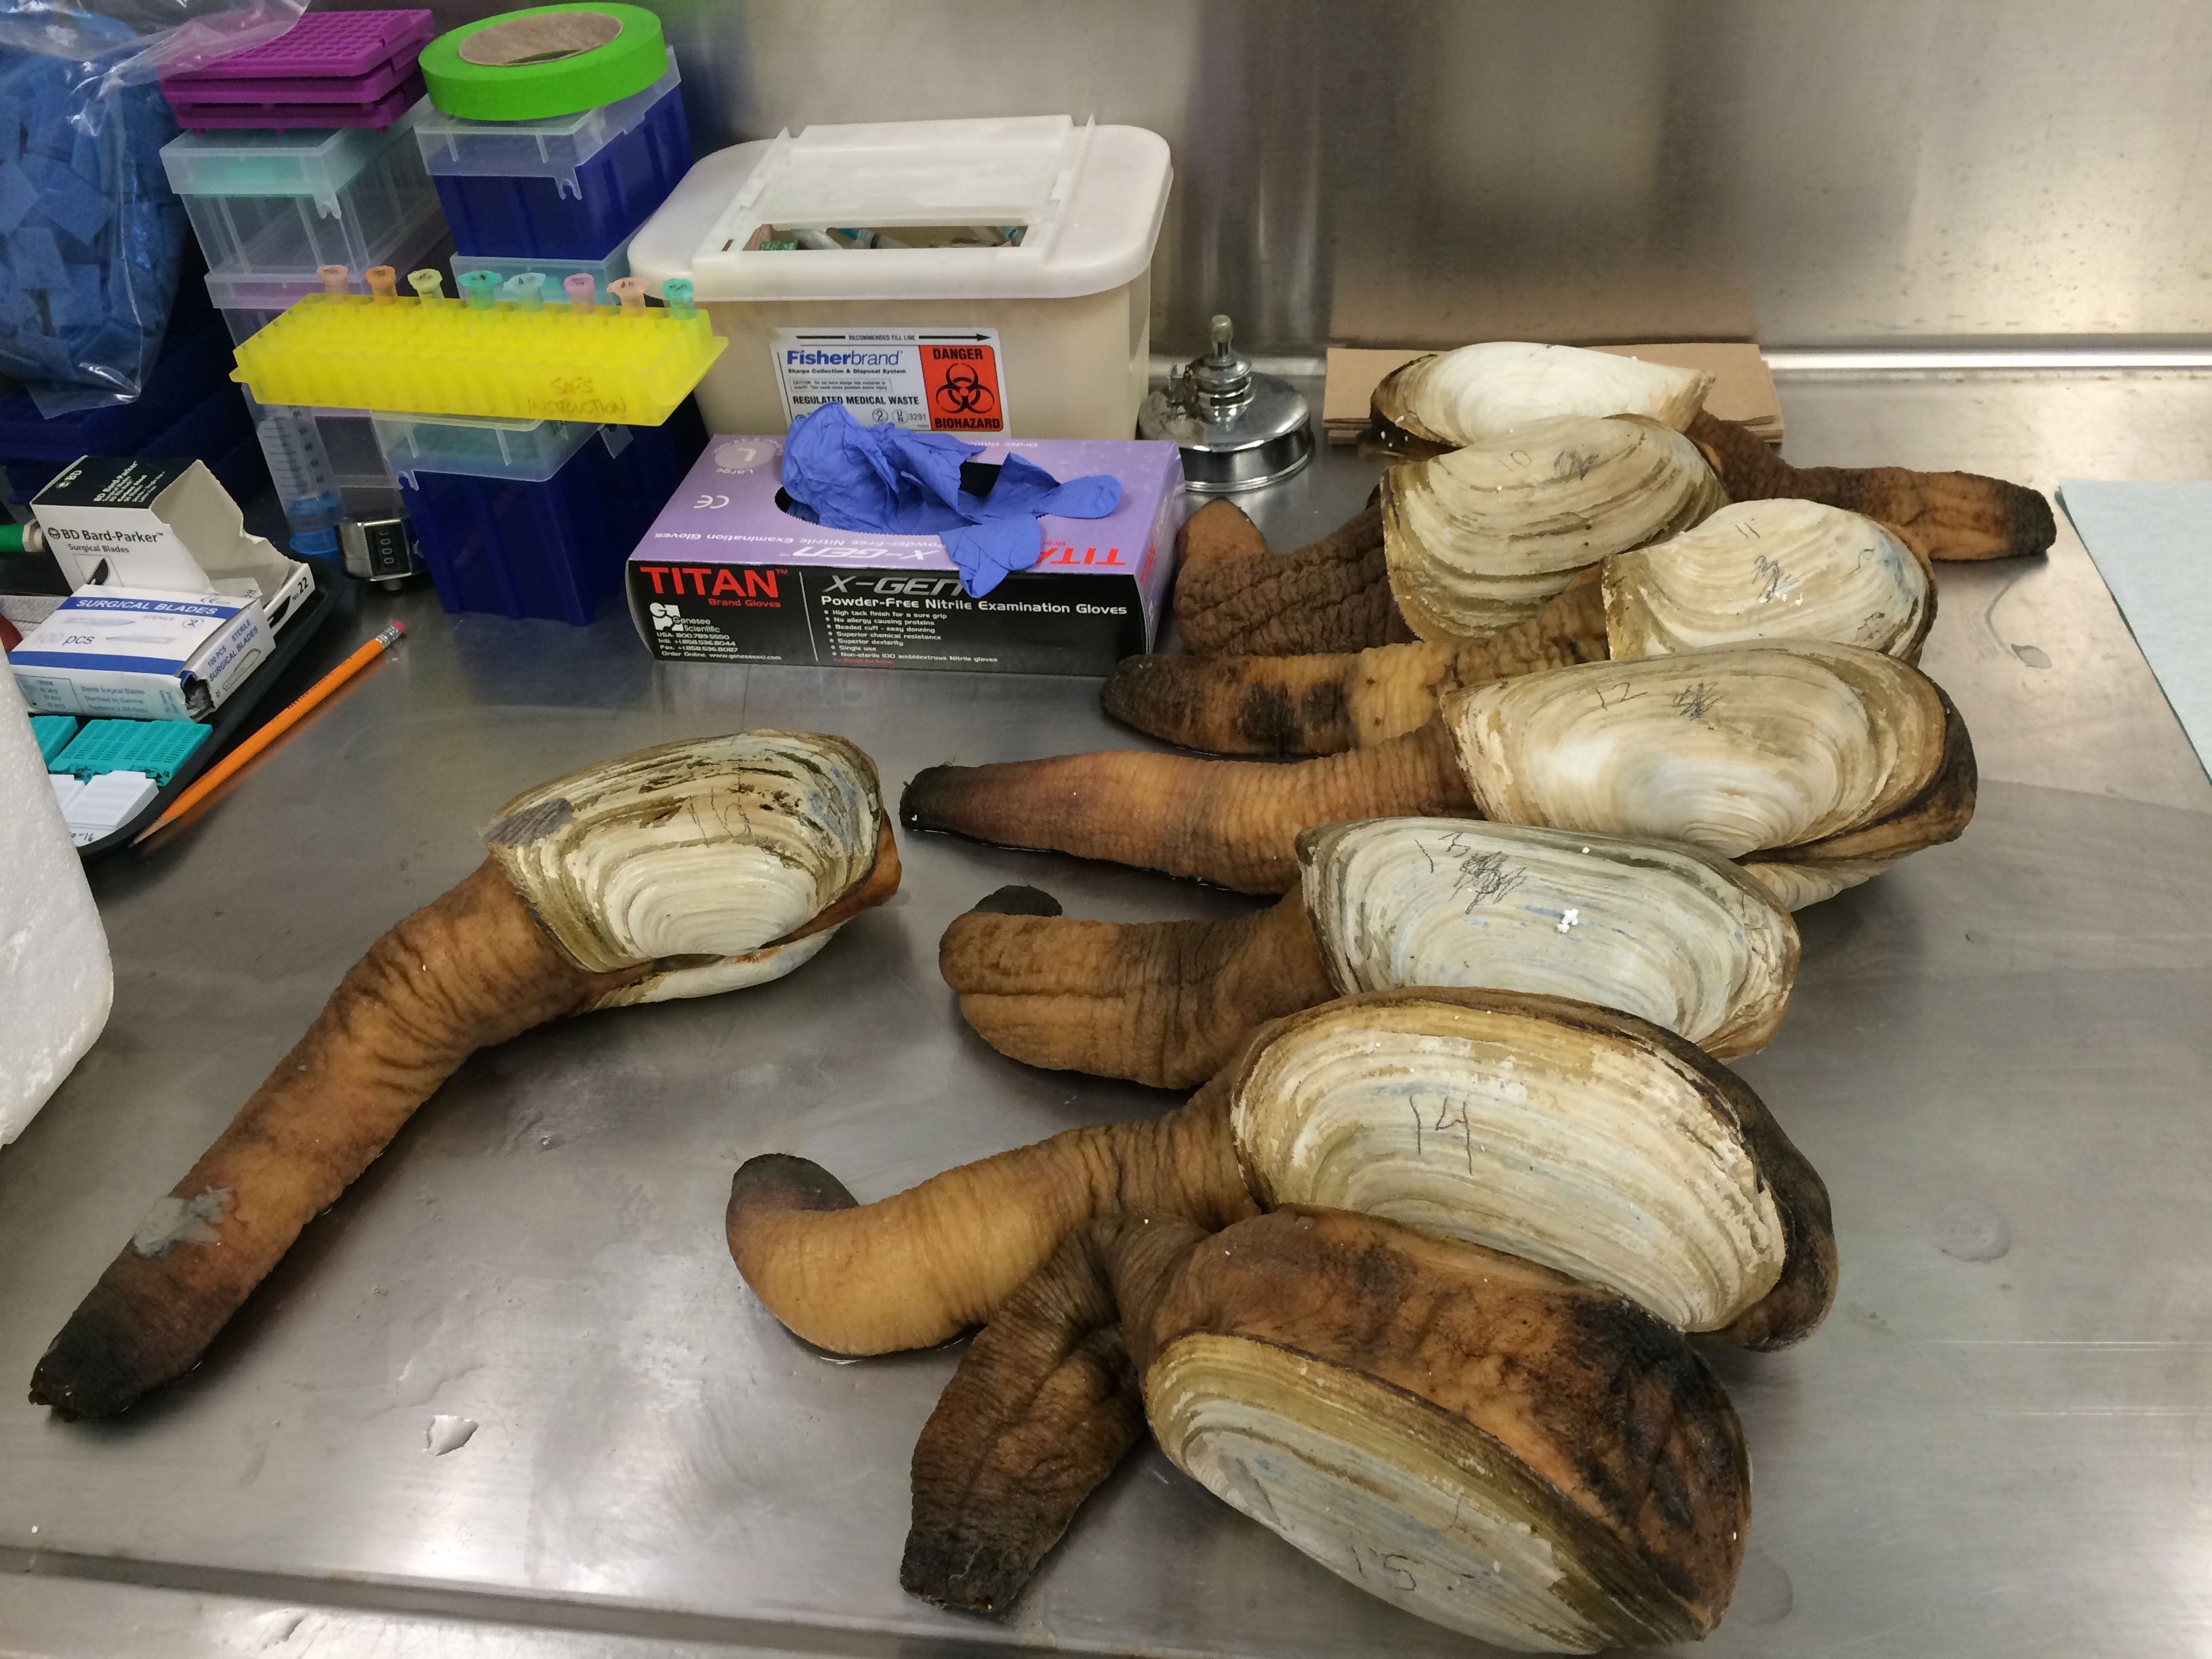
Geoducks in styrofoam container kept in fridge overnight
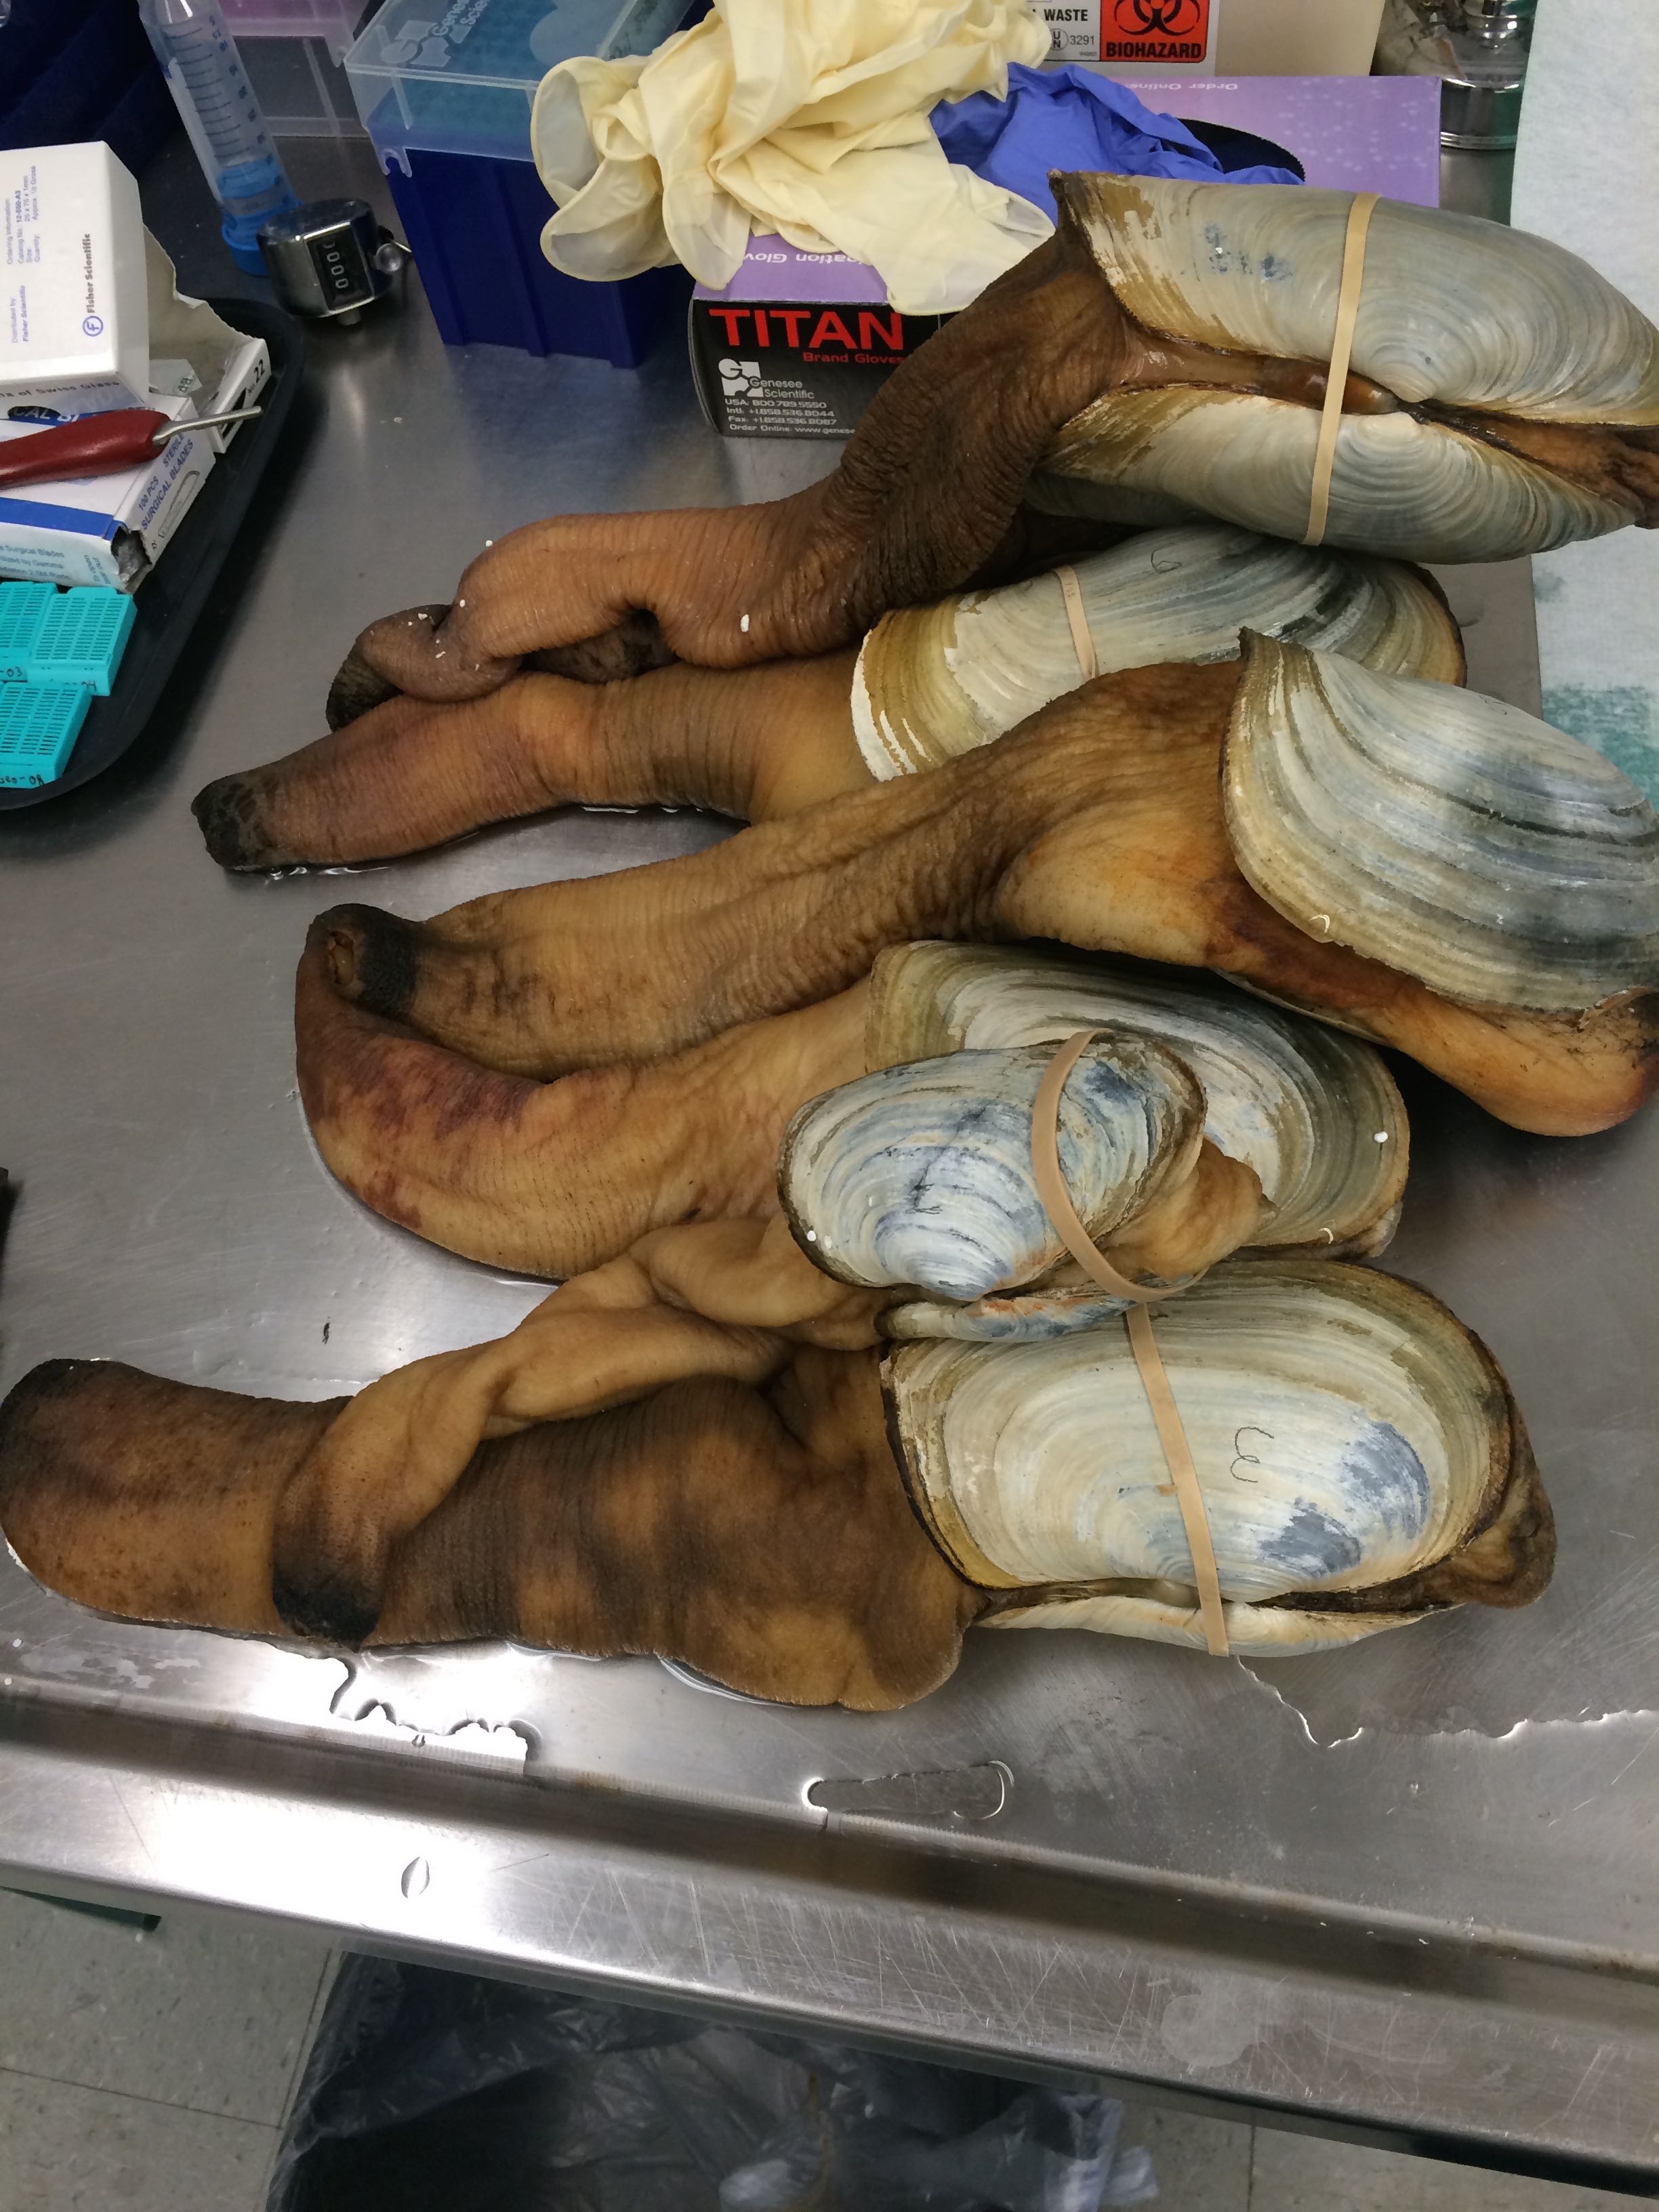
Geoducks out on the counter.
We labeled the shells numbered 1 through 8. We weighed each animal and also measured shell length using a caliper. Data below:
| Animal label |
Animal weight (g) |
Shell length |
| 1 |
991.3 |
146 |
| 2 |
841.2 |
143 |
| 3 |
1135.6 |
134 |
| 4 |
1062.5 |
168 |
| 5 |
1244.3 |
161 |
| 6 |
1317.8 |
172 |
| 7 |
479.8 |
105 |
| 8 |
1609.3 |
179 |
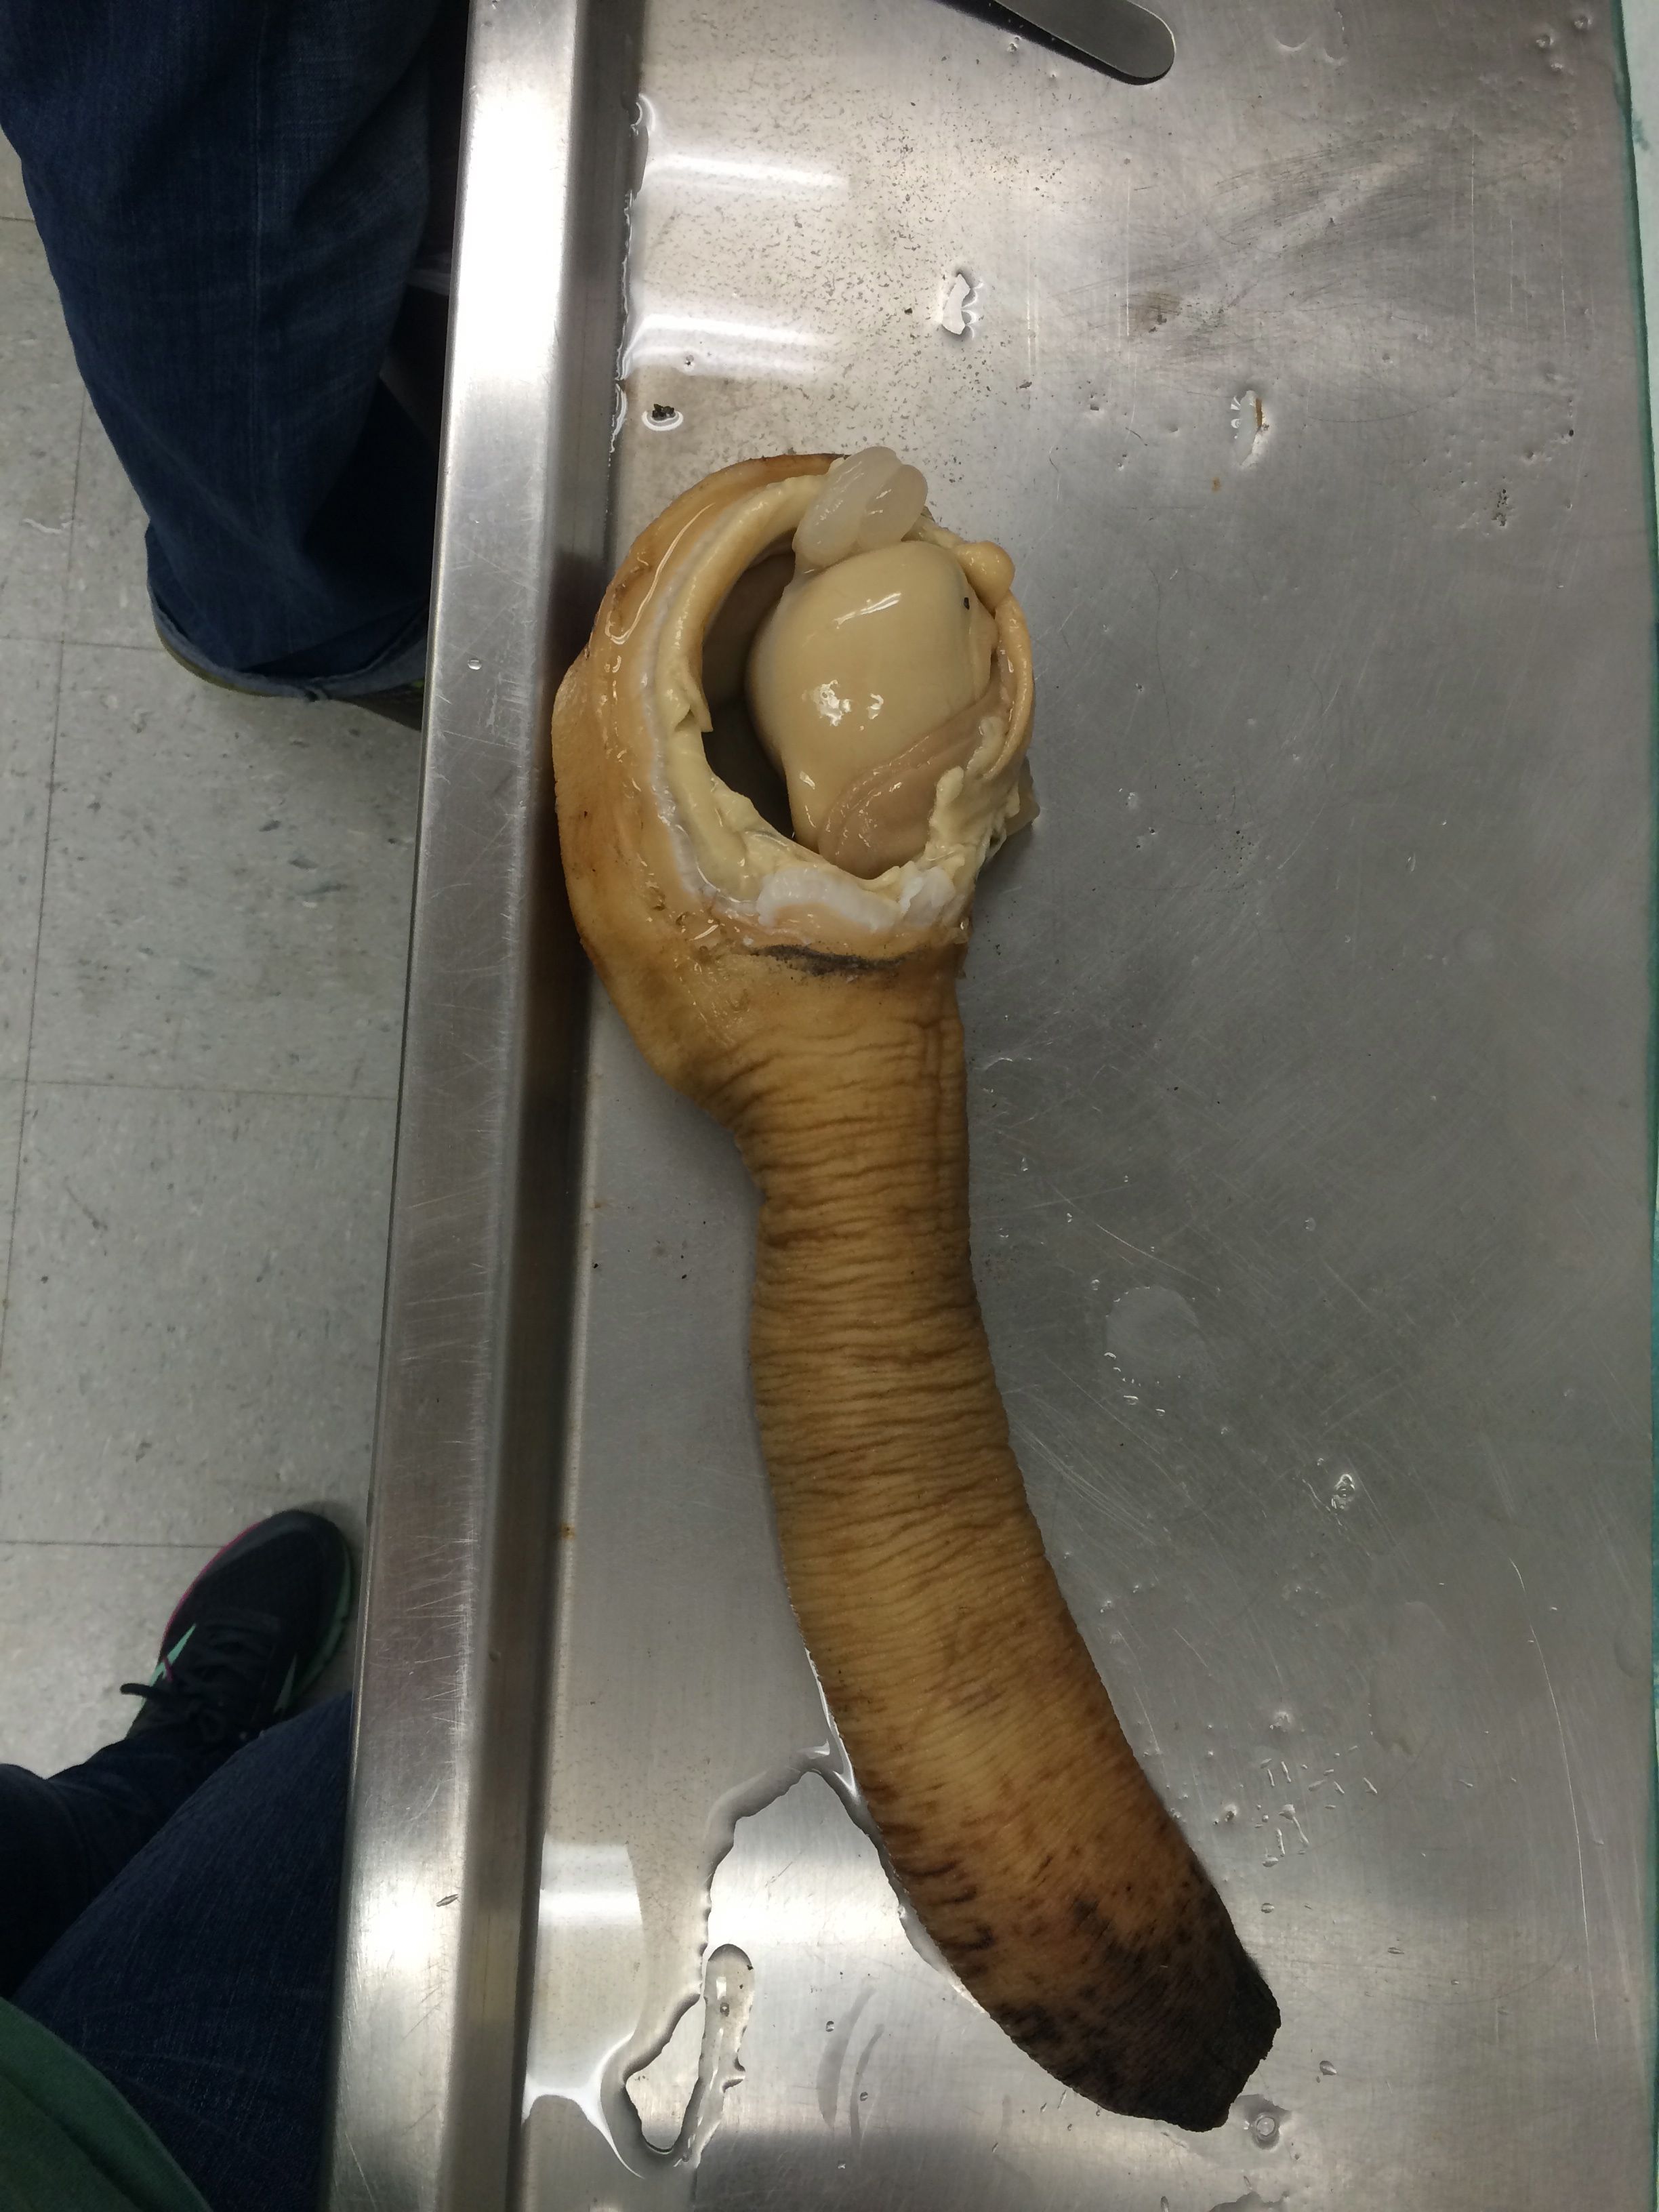 |
| Dissected geoduck. Removed shell, opened up body tissue to get to gonad tissue - the ball of tissue seen in the image. |
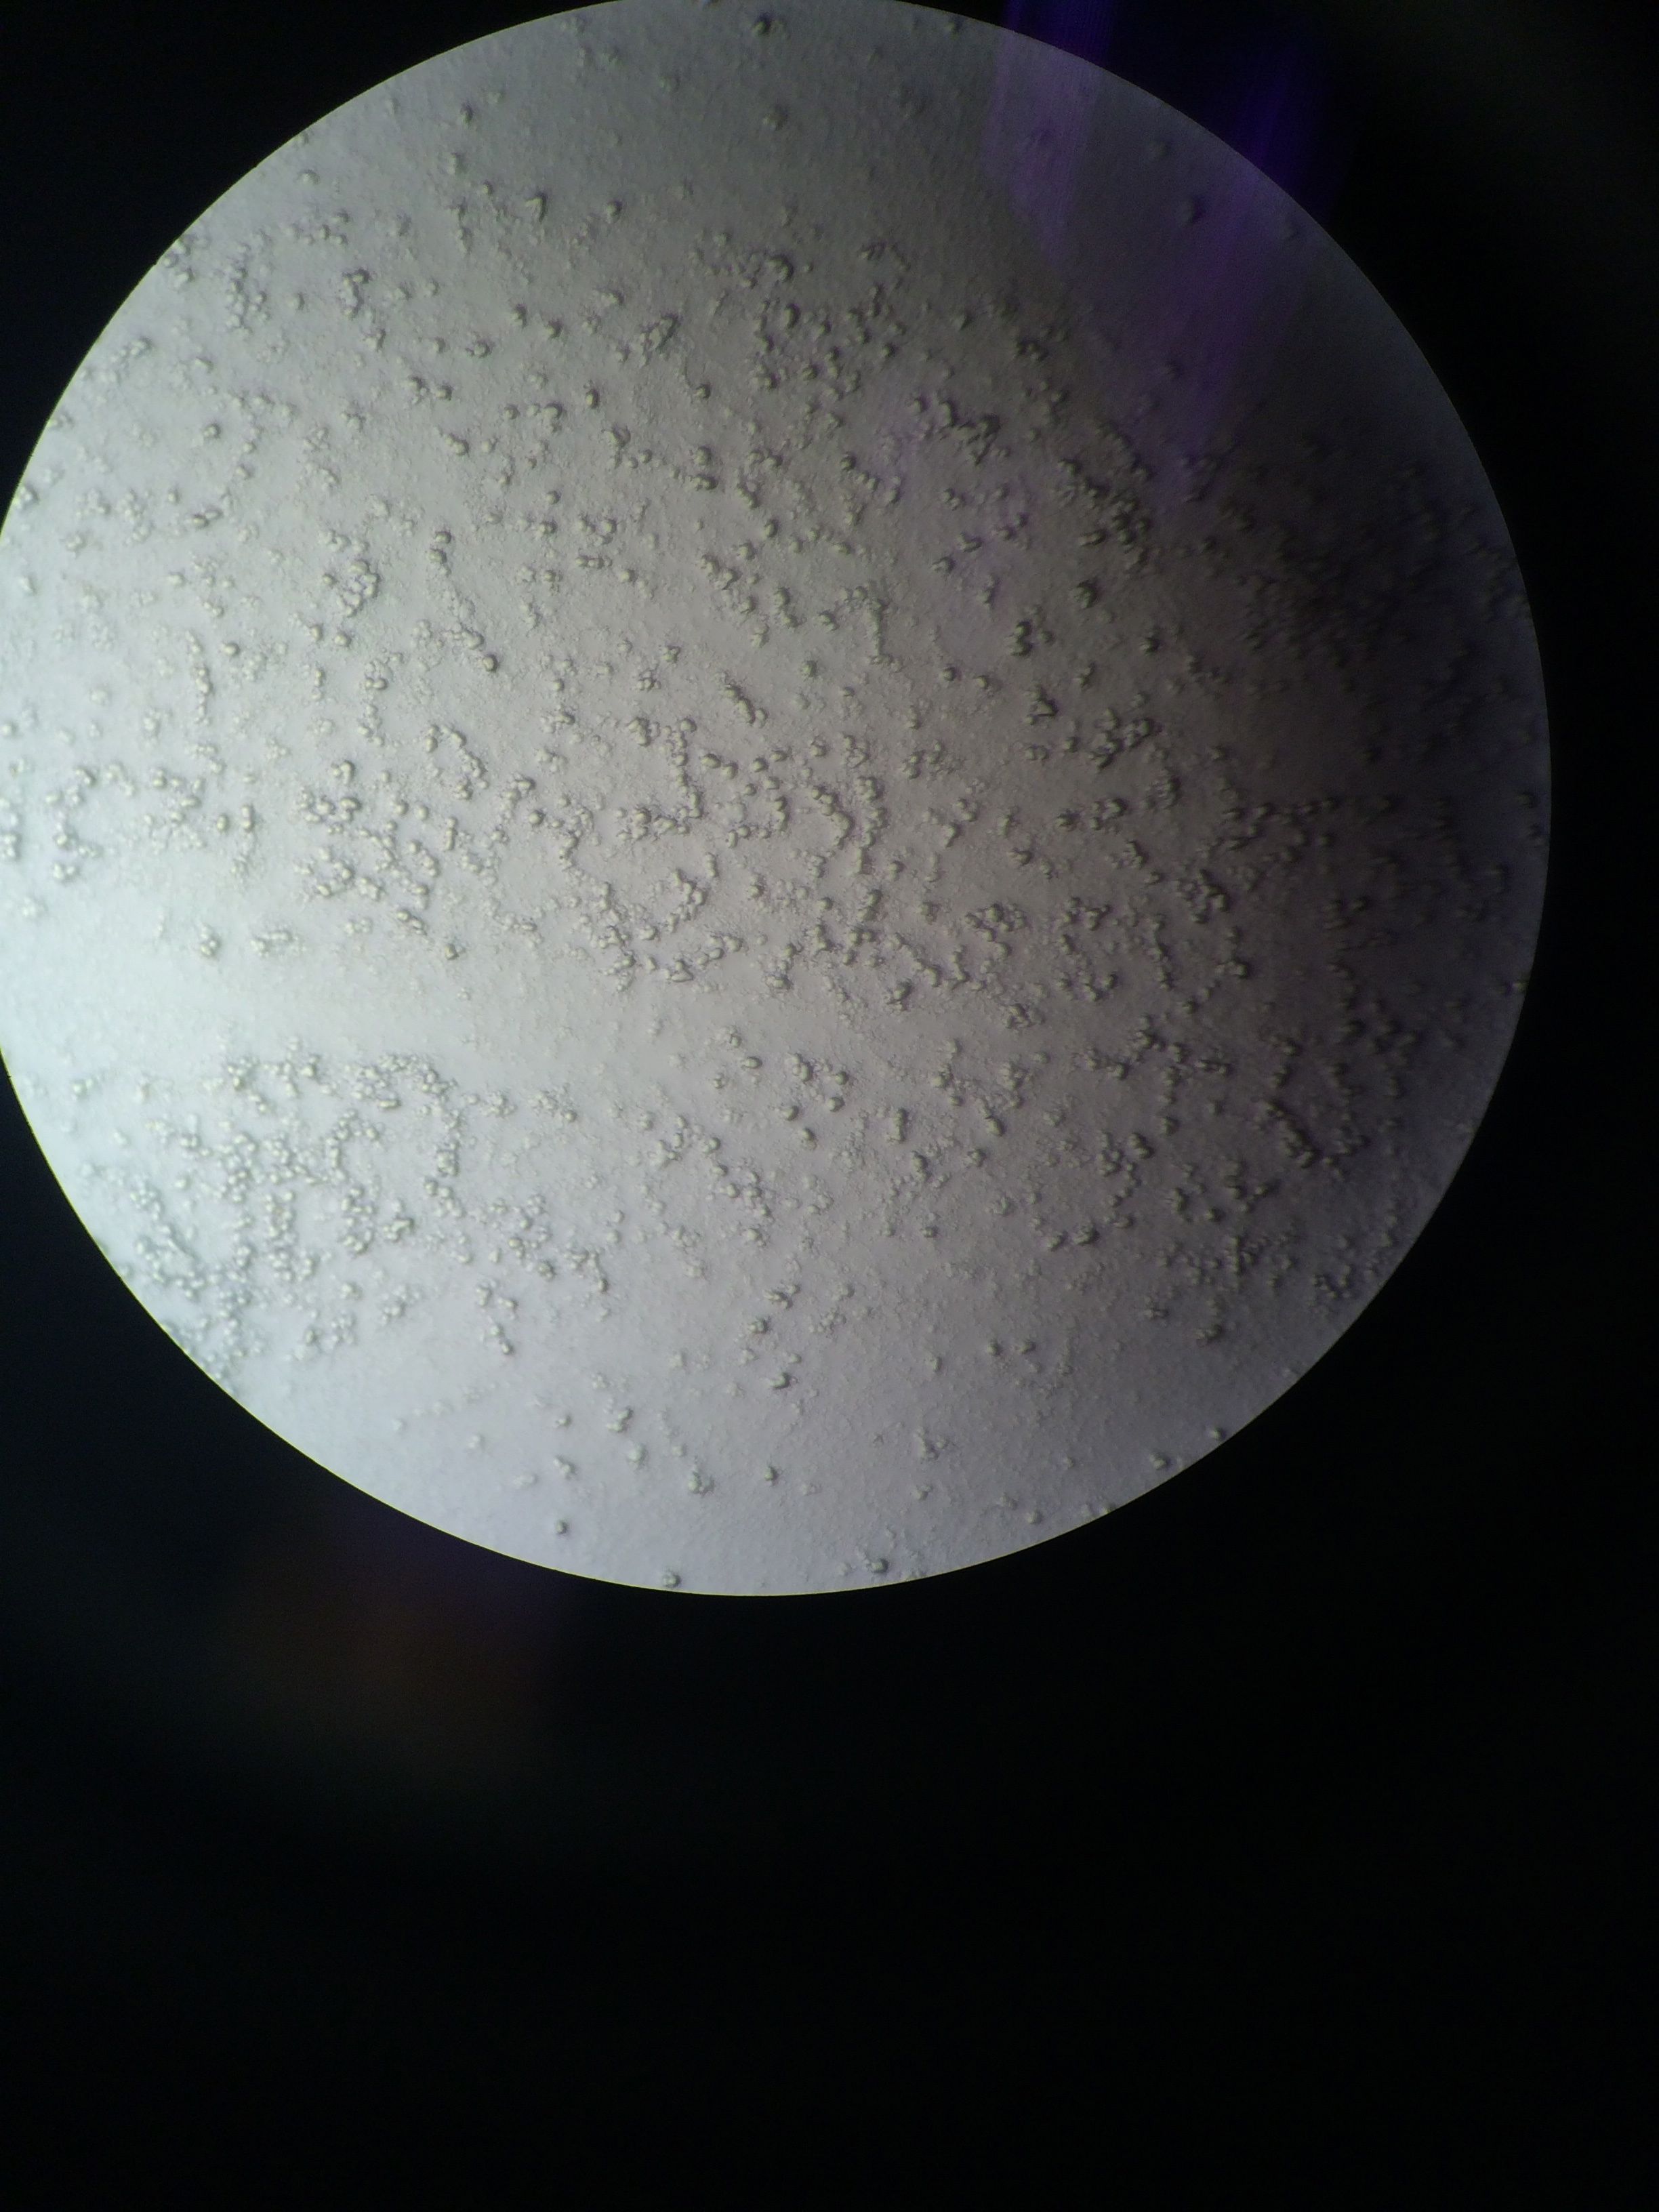 |
| Smear of cells taken from gonads. Can't tell what kind of cells they are. |
We then cut out slivers of tissue that were no bigger than 4x15x15 mm and placed them into histology cassettes. We also put in a piece of padding to force the tissue up against the cassettes. Each cassette had a piece of one individual, so we had a total of eight cassettes. We then started the fixing of the tissue using the PAXgene Tissue FIX protocol:
Sampling
- tissue size no bigger than 4x15x15 mm
- Put tissue into cassette
Procedure
- Put up to four cassettes per 50 ml container of PAXgene Tissue FIX
- incubate at room temperature between 3-24 hours (we'll do about 24 hours - no more than 24hrs)
- After incubation period, discard PAXgene Tissue FIX into labeled waste container and poor in diluted PAXgene Tissue STABILIZER (dilution instructions: on bottle- poor in 350 ml of 96-100% ethanol and invert at least 10 times) (**I used 200-proof ethanol)
Storage
- store in containers in refrigerator for up to a month with proper labeling
We also saved a piece of gonad tissue from each animal and placed in -80 degree freezer for later use if anything interesting presents itself after histology slides are delivered.
Wednesday, November 5, 2014
Today I started setting up for Geoduck dissections which will be done starting this Friday. I will also familiarize myself with PAXgene protocol.Monday, November 3, 2014
Today I made simplified notebooks for the transcriptomes of M. donacium, O. lurida, and M. mercenaria. The notebooks will be kept at the top of this page.Working on a simplified notebook for O. lurida (had to reblast so should be done by Wednesday) and C. viriginica. My attempts at working from the directory in the C. virginica notebook are not working for some reason.
Link to O. lurida working notebook:
http://nbviewer.ipython.org/url/eagle.fish.washington.edu/scaphapoda/Grace/nb/O.%20lurida%20Simplified%20Notebook.ipynb
Link to C. virginica working notebook:
http://nbviewer.ipython.org/url/eagle.fish.washington.edu/scaphapoda/Grace/nb/C.%20virginica%20Simplified%20Notebook.ipynb
Friday, October 31, 2014
Today Steven and I tried to make a graph from the egrep-ed terms. Struggling because when use "awk" command, it separates the terms within a column that are separated by spaces.Also, I made a python notebook that has directions for blasting, sql share joining, and egrep-ing that people can try for themselves to see if it works.
http://nbviewer.ipython.org/url/eagle.fish.washington.edu/scaphapoda/Grace/nb/Getting%20proteins%20pertaining%20to%20reproduction.ipynb
Wednesday, October 29, 2014
The two notebooks from Friday finished blasting, but the rest of the commands were messed up saying that there was "no such file or directory" for a lot of the commands. I opened up the "AnnotationWorkflow" notebook, but it never loaded and then the other two notebooks froze, so I had to shutdown python. This messed up the commands from the two notebooks started Friday, so I had to restart the commands after the blast.I really don't know why python is so finicky. It gets stuck on things sometimes and then freezes. Or it won't even open a notebook (for example, the AnnotationWorkflow notebook) and it'll just become unresponsive and I'll have to shut it all down.
After fixing some command errors, the notebook for M. donacium finally finished all the way through the egrep-ing.
Link to nbviewer notebook:
http://nbviewer.ipython.org/url/eagle.fish.washington.edu/scaphapoda/Grace/nb/Workflow%20M.%20donacium%20and%20swiss%20prot%20(1).ipynb
Same with M. mercenaria.
Link to nbviewer notebook:
http://nbviewer.ipython.org/url/eagle.fish.washington.edu/scaphapoda/Grace/nb/Workflow%20M.%20mercenaria%20and%20swiss%20prot%20(1).ipynb
Since neither of these went all the way on their own, I reentered the commands for the M. mercenaria blast/sqlshare/egrep into a new notebook. Steven cut this transcriptome down to 40 or so sequences just so we could figure out how best to run the cells in the notebook.
Link to notebook:
http://nbviewer.ipython.org/url/eagle.fish.washington.edu/scaphapoda/Grace/nb/M.%20mercenaria%20with%20swiss%20prot%20again%20(trying%20all%20in%20one%20go).ipynb
I then started trying to figure out how to make charts based on the egrep-ed information. I did it in the notebook with the full M. mercenaria transcriptome because the other M. mercenaria notebook only had two egrep-ed terms.
Link to attempt at making a chart with egrep-ed terms:
http://nbviewer.ipython.org/url/eagle.fish.washington.edu/scaphapoda/Grace/nb/Workflow%20M.%20mercenaria%20and%20swiss%20prot%20(2).ipynb
I'm fairly certain the problem is stemming from the fact that when the terms in the file are egrep-ed, they lose their column headings, which is what I would use to differentiate between the terms when creating a chart.
Friday, October 24, 2014
Started two new notebooks with the sequential blasting, sql-sharing, and egrep-ing commands.Link to python notebooks:
M. mercenaria blast:
http://nbviewer.ipython.org/url/eagle.fish.washington.edu/scaphapoda/Grace/nb/Workflow%20M.%20mercenaria%20and%20swiss%20prot.ipynb
M. donacium blast:
http://nbviewer.ipython.org/url/eagle.fish.washington.edu/scaphapoda/Grace/nb/Workflow%20M.%20donacium%20and%20swiss%20prot.ipynb
Wednesday, October 22, 2014
Python was incredibly slow today… had to shutdown and restart the notebooks too many times.The notebook with the commands lined up worked, however it went very slow and we had to re-run most of the cells when I returned to lab today. Not sure what happened, but in the end, it all worked. The egrep with a large amount of terms worked as well, but only after cutting it down to about half as many terms as I originally had, because it's a lot for it to handle.
Link to complete blast, SQLshare, and grep notebook:
http://nbviewer.ipython.org/url/eagle.fish.washington.edu/scaphapoda/Grace/nb/Annotation_workflow.ipynb
Not sure why some of this notebook is not visible…?
The grep in the C. virginica blast notebook finally finished, but I also had to cut down the number of terms to approximately half as much as I originally had. However, the new file with just the "grep"-ed terms isn't working… I think it has something to do with the fact that the file names start with "/" and the "/" is what's used to differentiate between the original file name and the new name after the grep occurs…
Link to notebook:
http://nbviewer.ipython.org/url/eagle.fish.washington.edu/scaphapoda/Grace/nb/C.%20virginica%20blast%20with%20swiss%20prot.ipynb
Again, not sure why some of this notebook is not visible…
Monday, October 20, 2014
Fixed problem with C. virginica SQL share- needed quotation marks around joining argument.Link to python notebook:
http://nbviewer.ipython.org/url/eagle.fish.washington.edu/scaphapoda/Grace/nb/C.%20virginica%20blast%20with%20swiss%20prot.ipynb
Notebook is working on "egrep"-ing the list of words that pertain to reproduction, sex-determination, etc. It's a big file and I asked it to look for a lot of terms, so it should take a while. I also figured out how to make all three of the joins for SQL share happen in one command.
Then, Steven showed me how to make a python notebook with the commands lined up so that I have much less information to put into the notebook.
Link to python notebook:
http://nbviewer.ipython.org/url/eagle.fish.washington.edu/scaphapoda/Grace/nb/Annotation_workflow.ipynb
Friday, October 17, 2014
C. virginica and M. mercenaria blasts against swiss prot from Wednesday finished.Link to M. mercenaria blast:
http://nbviewer.ipython.org/url/eagle.fish.washington.edu/scaphapoda/Grace/nb/M.%20mercenaria%20blastx%20with%20swiss%20prot.ipynb
Grep-ed multiple terms on the GOSlim_bin terms of M. donacium pertaining to reproduction/sex-determination/etc:
http://nbviewer.ipython.org/url/eagle.fish.washington.edu/scaphapoda/Grace/nb/M.%20donacium%20blast%20hummingbird.ipynb
I am also trying to do SQL sharing within python rather than having to upload it into SQL share manually and transferring the information back and forth between SQLshare and python. Steven showed me how to do it. However, I am doing something wrong and it isn't working. I'm not sure why, because the code that I put into python worked in SQL share, so there must be something that needs to be changed (besides the spacing, which I already fixed) in order for it to work. Will ask Steven Monday. I think that python is telling me what the error is in the code, but I just don't understand what it's saying.
Link to C. virginca blast and attempt at SQL share (at end of notebook) within python:
http://nbviewer.ipython.org/url/eagle.fish.washington.edu/scaphapoda/Grace/nb/C.%20virginica%20blast%20with%20swiss%20prot.ipynb
Wednesday, October 15, 2014
The blast that I started last Friday on the mac computer in the lab meeting room is still going.The blast is still occurring according to the TextWrangler file, but it is not showing up in the python notebook anymore as a result of Chrome quitting unexpectedly on Monday. Will check on this again when I come back in on Friday.
The blast of M. donacium against swiss prot using hummingbird with all 16 threads being used from Monday has finished! This is the first blast to finish completely.
Link to python notebook:
http://nbviewer.ipython.org/url/eagle.fish.washington.edu/scaphapoda/Grace/nb/M.%20donacium%20blast%20hummingbird.ipynb
Tried to download the SQL share with GOSlim_bin, but computer is going too slow. Hopefully Friday it'll be faster so that I can grep the terms dealing with reproduction.
Started two new blasts today, each using 8 threads of hummingbird.
Link to nbviewer version of blast between swiss prot and M. mercenaria:
http://nbviewer.ipython.org/url/eagle.fish.washington.edu/scaphapoda/Grace/nb/M.%20mercenaria%20blastx%20with%20swiss%20prot.ipynb
NOTE: Blast finished at 4:46pm October 15, 2014. Blast started an hour or so before.
Link to nbviewer version of blast between swiss prot and C. virginica;
http://nbviewer.ipython.org/url/eagle.fish.washington.edu/scaphapoda/Grace/nb/C.%20virginica%20blast%20with%20swiss%20prot.ipynb
If all goes well, both should be done blasting by Friday when I come back in to lab.
Steven would like for us to figure out a way to have python do the blasting, and SQL share joining all in one go, so that once a button is clicked, all processes will go in order until finished with SQL share join with protein names and GOSlim_bin. Project to work on in coming days/weeks.
Monday, October 13, 2014
Website I found with other types of greps in python:http://www.exfer.net/blog/2007/07/29/python-grep-script-with-multiple-files/
Today I did another blast of M. donacium against swiss prot, but used Hummingbird with all threads being used.
Link to nbviewer version of python notebook:
http://nbviewer.ipython.org/url/eagle.fish.washington.edu/scaphapoda/Grace/nb/M.%20donacium%20blast%20hummingbird.ipynb
The blast that I started on Friday on the mac computer in the lab meeting room is still going.
Link to nbviewer version of python notebook:
http://nbviewer.ipython.org/url/eagle.fish.washington.edu/scaphapoda/Grace/nb/Olurida_v1_Blast.ipynb
UPDATE: 4:34pm... notification pops up on mac saying that google chrome quit unexpectedly. Unfortunately, that is what the blast was opened in, so I don't know how that affected blast... looking at the same blast that has been kept open in text wrangler, it still seems to be happening... so will check on it on Wednesday.
With Steven's help, we figured out how to grep multiple terms. This was what needed to be done with the GOSlim data on O. lurida so that I could combine all the terms pertaining to reproduction and male/female development.
Link to nbviewer version of python notebook:
http://nbviewer.ipython.org/url/eagle.fish.washington.edu/scaphapoda/Grace/nb/Olur_GOslim_piechart.ipynb
Friday, October 10, 2014
Attempt at having a blast for O. lurida to finish: I re-blasted the O. lurida transcriptome in iPython, but this time blasted it with all of the files saved to the computer rather than having them be from eagle. Also, the database was moved to this computer, so that the blast would happen through the computer rather than through eagle. This might make it so that the blast will finish. Will see on Monday.I also learned how to convert my python notebooks so that they are more reader-friendly.
Link to new blast python nb:
http://nbviewer.ipython.org/url/eagle.fish.washington.edu/scaphapoda/Grace/nb/Olurida_v1_Blast.ipynb
Link to two other python notebooks that I've been working on in reader-friendly format:
Mesodesma donacium blast against swissprot: http://nbviewer.ipython.org/url/eagle.fish.washington.edu/scaphapoda/Grace/nb/M.donacium_swissprot_blastx.ipynb
O. lurida GOSlim: http://nbviewer.ipython.org/url/eagle.fish.washington.edu/scaphapoda/Grace/nb/Olur_GOslim_piechart.ipynb
Not sure why the O. lurida GOSlim notebook is missing so many chunks...
In this notebook, I did a lot of !fgrep commands to try to isolate the proteins using terms to do with reproduction/gonad development/ sex determination/ etc.This information will help figure out which proteins are involved in such processes for the geoduck project.
New db python notebook where Steven showed me how to move database for blast on to computer rather than eagle:
http://nbviewer.ipython.org/url/eagle.fish.washington.edu/scaphapoda/Grace/nb/Make%20Blast%20DB.ipynb
To convert python notebook to reader-friendly format: eagle link to notebook into "nbviewer" and then paste the new link of the notebook into the wikispace
Wednesday, October 8, 2014
Still trying to figure out how to make a pie chart with GOSlim bar graph data:I'm not sure if what I'm thinking of doing for the pie chart would be considered "cheating"...? I plan to have python count how many data points are in each category and then input each of those points into the code for creating a pie chart and correspond the order of the numbers to match their respective category titles. I say "cheating" because I feel like there must be a more direct way to have python create a pie chart from the data without me having to count the numbers in each category.
Turns out this doesn't actually work, or at least not in the way that I did it, so I will keep looking for other ways to go about this. There's some sort of "AssertionError". I don't know what this means or how to fix it, so I'll have to learn more about this.
Steven tried to blast the O. lurida again. It didn't work again. Link below:
Olurida_v1_Blast.ipynb 46KB Oct 06 2014 03:29:53 PM
Link to pie chart attempt python notebook:
Olur_GOslim_piechart.ipynb 402KB Oct 08 2014 04:08:09 PM
Also: I think I need to learn how to make the python notebook links more reader-friendly, because these are hard to look at and understand. I thought I was doing it right, but I'm not.
Monday, October 6, 2014
Steven will be looking into possible ways to get a blast to finish.
Today I tried to figure out how to make a bar graph out of the O. lurida GOSlim SQLShare data. I tried to do it on my own, but I wasn't going in the right direction, so Steven came in and showed me how.
Link to iPython notebook with GOSlim and bar graph:
Olur_GOslim_piechart.ipynb 386KB Oct 06 2014 04:04:25 PM
I will continue to try to figure out how to make that information into a pie chart. Also, I noticed that the bar graph doesn't include a category having to do with reproduction or gonad development, so that could be an issue since the main focus is on proteins that are responsible for those biological processes.
Link to Steven's notebook with the code for creating a bar graph:
http://nbviewer.ipython.org/github/sr320/ipython_nb/blob/master/fish546/blast2pie-generic.ipynb
Link to information on pandas... which is responsible for making it possible to create tables in python and thus, the bar graph:
http://pandas.pydata.org/
Possible link to help make pie chart:
http://pandas.pydata.org/pandas-docs/stable/visualization.html
or:
http://matplotlib.org/1.2.1/examples/pylab_examples/pie_demo.html
Link to an online manual for learning to use python:
http://oreilly.com/catalog/lpython/chapter/ch09.html
Friday, October 3, 2014
Both of the blasts from Wednesday failed again. Not sure what to do about that.
Still trying to figure out how to make a pie chart out of the olurida go slim. Claire mentioned using R... never used it before, but I might look into it. Will continue to look into making one in iPython. Will work more on it next week.
Link to what could possibly be a helpful website for making a pie chart in iPython:
http://matplotlib.org/1.2.1/examples/pylab_examples/pie_demo.html
Wednesday, October 1, 2014
Today Steven came in before I got to the computer and noticed that the blast that I started Monday had stopped for some reason. So, he re-booted it and is now letting it run on hummingbird.When I got here, I decided to try to blast a transcriptome of Mesodesma donacium against the swiss prot to see if I could do it on my own. I made a couple mistakes which made it not work, but Steven came in and helped me fix my errors. They were mainly command line argument errors and errors in saving files.
I downloaded the transcriptome of the clam from:
http://datadryad.org/resource/doi:10.5061/dryad.8jd18/2.
(Link to fasta transcriptome: M_donacium_fasta.fa 68218KB Oct 01 2014 02:47:03 PM)
The link to the iPython notebook with the current blast project:
mesodesma_blastx_uniprot.tab 10KB Oct 01 2014 03:46:33 PM
The link to the iPython notebook with olurida blast project (from Monday):
olur_blastx_uniprot_3.tab 57KB Oct 01 2014 03:46:33 PM
I will also be working on making a pie chart using the
Olur_goslim_a.csv 956KB Sep 29 2014 03:50:49 PM olur go slim. The GOslim is already showing just the proteins involved in biological processes. However, I now will try to create a pie chart showing what percentages of the proteins involved in biological processes are involved in what aspects of biology, i.e., reproduction, growth, etc.
I am having a hard time remembering how to separate the GOslim results into columns that are easy to see. I know I do this in iPython, but I'm not sure how or how to make a graph from there. Lots to learn!
Here's my attempt at organizing the GOslim in iPython:
Olur_goslim_a.tab 956KB Oct 01 2014 04:30:13 PM
Now I just have to figure out how to make a pie chart! If I did the organizing correctly…
Monday, September 29, 2014
Today Steven showed me how to use iPython and SQLShare to find the names of the proteins that were blasted, then join that table with the GOslim which summarizes what the proteins function as.
Link to list of protein names:
Olur_SPID_description_a.tab 338KB Sep 29 2014 03:35:59 PM
Link to protein names with GO and GOslim
Olur_goslim_a.csv 956KB Sep 29 2014 03:50:49 PM
I am also re-blasting the swiss prot because the blast that I did over the weekend never finished for some unknown reason.
Olurida_v1_Blast.ipynb 38KB Sep 29 2014 04:07:28 PM
I was going to blast it against a manila clam transcriptome, but safari can't download the fasta transcriptome file for some reason. So i'm just re-doing the previous blast against Ostrea lurida.
Friday, September 26, 2014
Today Steven quickly showed me how to sort of use iPython. I'm still trying to learn about all the markdown tools and such. It makes sense to me, but I will just have to work on remembering the syntax and also how to run blast. I have it written out in iPython so I know how to replicate what he showed me today. Here's a link to the iPython notebook that Steven started for me today:
Olurida_v1_Blast.ipynb 6KB Sep 26 2014 03:01:14 PM
I'll be keeping the iPython blasting running so that it can finish. Will continue to work with this next week.
Still looking for transcriptomes of other organisms like mussels, clams, sea urchins, other oysters
Also still looking at geoduck information and working on compiling information on them
Tuesday, September 23, 2014
Today Steven showed me how to do the basics of command line blastx. I haven't really any experience with command lines or terminals, but I feel like I understand the basics so far. We are letting the computer continue to blast all of the transcriptome of the O. lurida version 1 found here: http://eagle.fish.washington.edu/cnidarian/Supp_1_Ostrea_lurida_transcriptome.fastaagainst a database of proteins found here:
uniprot_sprot.fasta 252739KB Oct 02 2013 08:14:57 AM
I am also going to be compiling information on geoducks and also transcriptomes of other related organisms that are published such as other types of clams, oysters, and mussels.
Here's a link to a downloadable transcriptome of hard clams:
http://figshare.com/articles/Hard_clam_transcriptome_contigs/90073
I wasn't able to download it and save it into my folder in eagle because my laptop apparently doesn't have the right application to actually open the file.
Here's a link to what I think is a transcriptome of eastern oysters, Crassostrea virginica, and again I wasn't able to dave it to eagle for the same reason as above.
http://www.brown.edu/Research/Istrail_Lab/rnaseq.php (I think the transcriptome is the [zip] link on the left side under "Resources".
Here is a link to an article on the gonad transcriptome of the pearl oyster Pinctada margaritifera. There could be a link to an actual transcriptome somewhere.
http://www.biomedcentral.com/1471-2164/15/491
A link to an article on the transcriptome of Sydney rock oysters Saccostrea glomerata.There could be a link to an actual transcriptome somewhere.
http://www.sciencedirect.com/science/article/pii/S187477871400097X
Link to an article on the invasive mussel Limnoperna fortunei. Could contain an actual transcriptome link somewhere in article. The link is located in the "Supporting Information" in the article. The transcriptomes can be downloaded from there.
http://www.plosone.org/article/info%3Adoi%2F10.1371%2Fjournal.pone.0102973
Monday, September 22, 2014
Still trying to get more familiar with NCBI BLAST.
Found a useful YouTube video:
https://www.youtube.com/watch?v=HXEpBnUbAMo
It helped me understand what the results mean a little better. I still have lots to learn, though.
I am also learning more about Geoducks and their reproductive processes.
Monday, September 15 through Wednesday, September 17, 2014
I have been trying to familiarize myself with NCBI BLAST so that I can help with a project involving Geoducks and trying to find the protein responsible for reproduction. I am learning quite a bit about the processes involved in BLAST, but a majority of the results that you get after running the program are confusing to me since I still don't understand what they are telling me. I have found some online manuals and videos, so I have been reading and watching tutorials.Link to online guidebook:
http://www.ncbi.nlm.nih.gov/books/NBK1734/
Link to another online guidebook:
http://www.ncbi.nlm.nih.gov/books/NBK21101/
Link to YouTube channel with How-To Videos:
https://www.youtube.com/channel/UCvJHVo5xGSKejBbBj0A5AyQ
Tuesday, September 2, 2014
Today I attempted to isolate DNA. I had six samples, each labeled 1 through 6:
1 - 5000 larvae
2 - 1000 larvae
3 - 1000 larvae
4 - 1000 larvae
5 - 1000 larvae
6 - 1000 larvae
I removed all the remaining ethanol from each of the six blue tubes. Then, one by one, I added 500 uL of DNAzol and then used a pestle to crush the oyster larvae. I crushed them until they no longer felt gritty. Then, I added an additional 500 uL of DNAzol, so that each of the 6 samples had a total of 1000 uL of DNAzol.
Then, I put all six of the samples in the centrifuge for 10 minutes at 10,000 g. I then transferred the supernatant from each sample into new separate tubes, which I labeled 1 through 6, keeping each sample with the same label after the transfers were made. I kept the tubes that still had the mashed up oyster larvae.
Then, using the tubes with the supernatant, I added 500 uL of 100 % ethanol into each sample tube and mixed it with the DNAzol supernatant by inverting the tubes 8 times each. At this point, it was stated in the protocol that a cloudy precipitate should have been visible, but there was none in any of the samples. Then, I put them all back in the centrifuge for 5 minutes at 5000 g. After this step, a pellet of DNA should have been visible in all of the sample tubes, but there were none in any of them.
The next step was DNA wash. I removed all the 100% ethanol from each tube and then put in 850 uL of 75% ethanol into the tube. I inverted the tube three times and then let it sit for a little bit (however, I forgot to let samples 1 and 2 sit) so that any DNA that is present can settle to the bottom. I then removed the ethanol. I repeated this step so that each DNA sample was washed twice with the 75% ethanol.
Since there were no DNA pellets visible, I kept the supernatant from each sample and transferred them into new separate tubes, which I labeled 1s, 2s, etc. And each sample (numbered 1 through 6) supernatant were transferred into their respective new tubes.
Then, back to the centrifuge for the samples that were washed with the 75% ethanol for 1 minute at 5000 g to get all the ethanol to accumulate at the bottom for better complete removal. After the centrifuge, I used a pipette to remove all the remaining ethanol.
The next step was the DNA solubilization in which I added 25 uL of Nanopure water to each sample tube and let them all sit for 5 - 10 minutes. Then, I used the Nanodrop to see if there were any DNA in any of the samples, which it didn't look too good:

The second sample "6" was an accident in activating the Nanodrop after cleaning the surfaces.
So, since the results were not very satisfactory, Sam said that he will be working with the remaining samples that I left. I re-homogenized with DNAzol and pestles the 6 original larvae samples that I left behind in their tubes and then put them on a rotating holder overnight so that they will be constantly agitated. The supernatant samples are still saved, so Sam might also do something with those.
Friday, August 28, 2014
Today I counted out 4 more sets of `1000 larvae. These will all be used in DNA isolation.Wednesday, August 27, 2014
Today I counted out 5 more sets of 1000 larvae.Tuesday, August 26, 2014
Today I counted out 4 more sets of 1000 larvae.Monday, August 25, 2014
Today I counted out another set of 1000 larvae. I also helped Brent by putting Wild Oly Oyster shells into labeled bags.Thursday, August 21, 2014
Today I counted out two more sets of 1000 oyster larvae and placed them into the blue tubes.Wednesday, August 20, 2014
Today I put all the rest of the tide data into the excel spreadsheet for Fidalgo. I also finally figured out how to de-clutter the x-axis for the tidal graphs. Here is the graph for Oyster Bay's Tidal Fluctuations over the course of August 17, 2013, through July 31, 2014:
(Link to data for graph above: AlltidesatOyster.xlsx 72KB Aug 20 2014 11:56:03 AM)
Tides for Fidalgo:

(Link to data for graph above: AllTidesForFidalgo.xlsx 75KB Aug 20 2014 12:13:59 PM)
For Manchester:
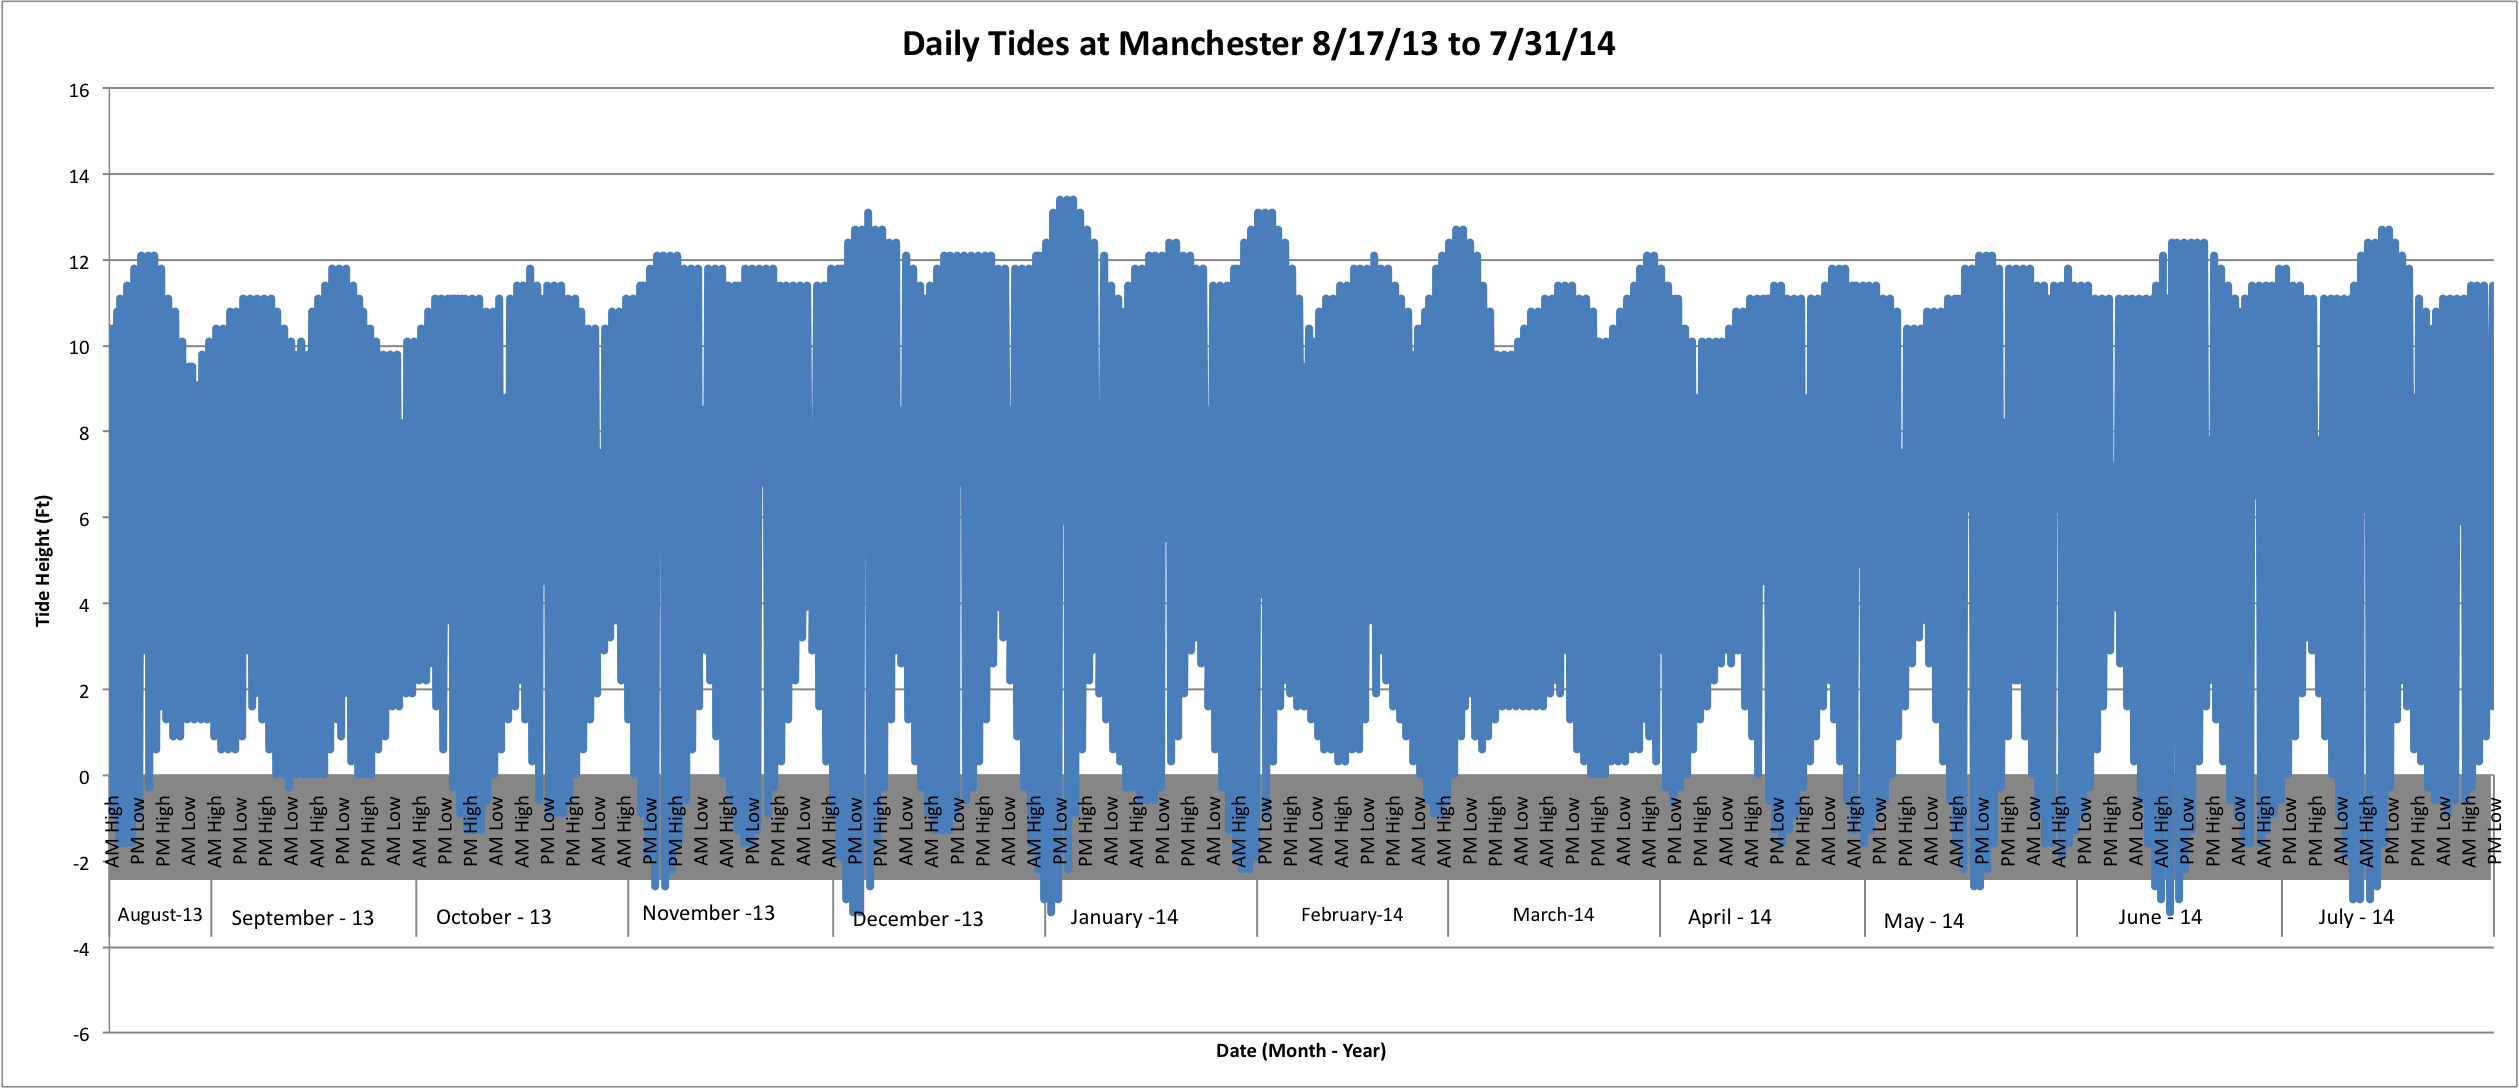
(Link to data for graph above: ALLTidesManchester.xlsx 77KB Aug 20 2014 12:29:22 PM)
Monday, August 18, 2014
Today I updated some of the graphs that I've been working on for Jake's data and also worked on trying to fix the tide chart graphs. I put the tide data for Manchester into an excel spreadsheet:ALLTidesManchester.xlsx 62KB Aug 18 2014 11:48:30 AM
And I also started putting in the tide data for Fidalgo:
AllTidesForFidalgo.xlsx 54KB Aug 18 2014 12:10:29 PM
I still haven't been able to successfully de-clutter the x-axis for the graphs… so I will continue to work on that.
Friday, August 15, 2014
Today I learned from Sam how to use the Nanodrop spectrophotometer machine. We used it on the larvae counts that Etilet and I helped count out. There were three tubes filled with 10 larvae each, three with 500 each, and we only got around to one with 1000 larvae. The following links are the data and the graphs from the Nanodrop:http://eagle.fish.washington.edu/Arabidopsis/20140815%20-%20gigas%20larvae%20gDNA%20plots.JPG <-- Graphs
http://eagle.fish.washington.edu/Arabidopsis/20140815%20-%20gigas%20larvae%20gDNA%20ODs.JPG <-- Data
I also watched Sam quantize… quantitate… DNA from the same larvae samples. The results that we looked at from the machine weren't very satisfactory, so he will be doing it again later this week, and I will observe again.
Thursday, August 14, 2014
Today I watched Sam perform PCR on a sample of bacteriophage that infect abalones infected with withering syndrome that Sam is working on for Friedman's lab.
Wednesday, August 13, 2014
Today I worked with Etilet and separated the oyster larvae into three samples each of 10, 500, and 1000 oyster larvae. We counted them out under the microscope and transferred them into small tubes (name….?). We then removed the ethanol with a pipette and then added 500uL of DNAzol and used a pestle to smash the larvae. After 5 or 6 grindings of the larvae, we added an additional 500uL to the tube, so that each had a total of 1000uL of DNAzol with the mashed up oyster larvae. The DNAzolMonday, August 11, 2014
Today I finished the tide graph for Oyster Bay and used the same date range as that for the temperature data at Manchester.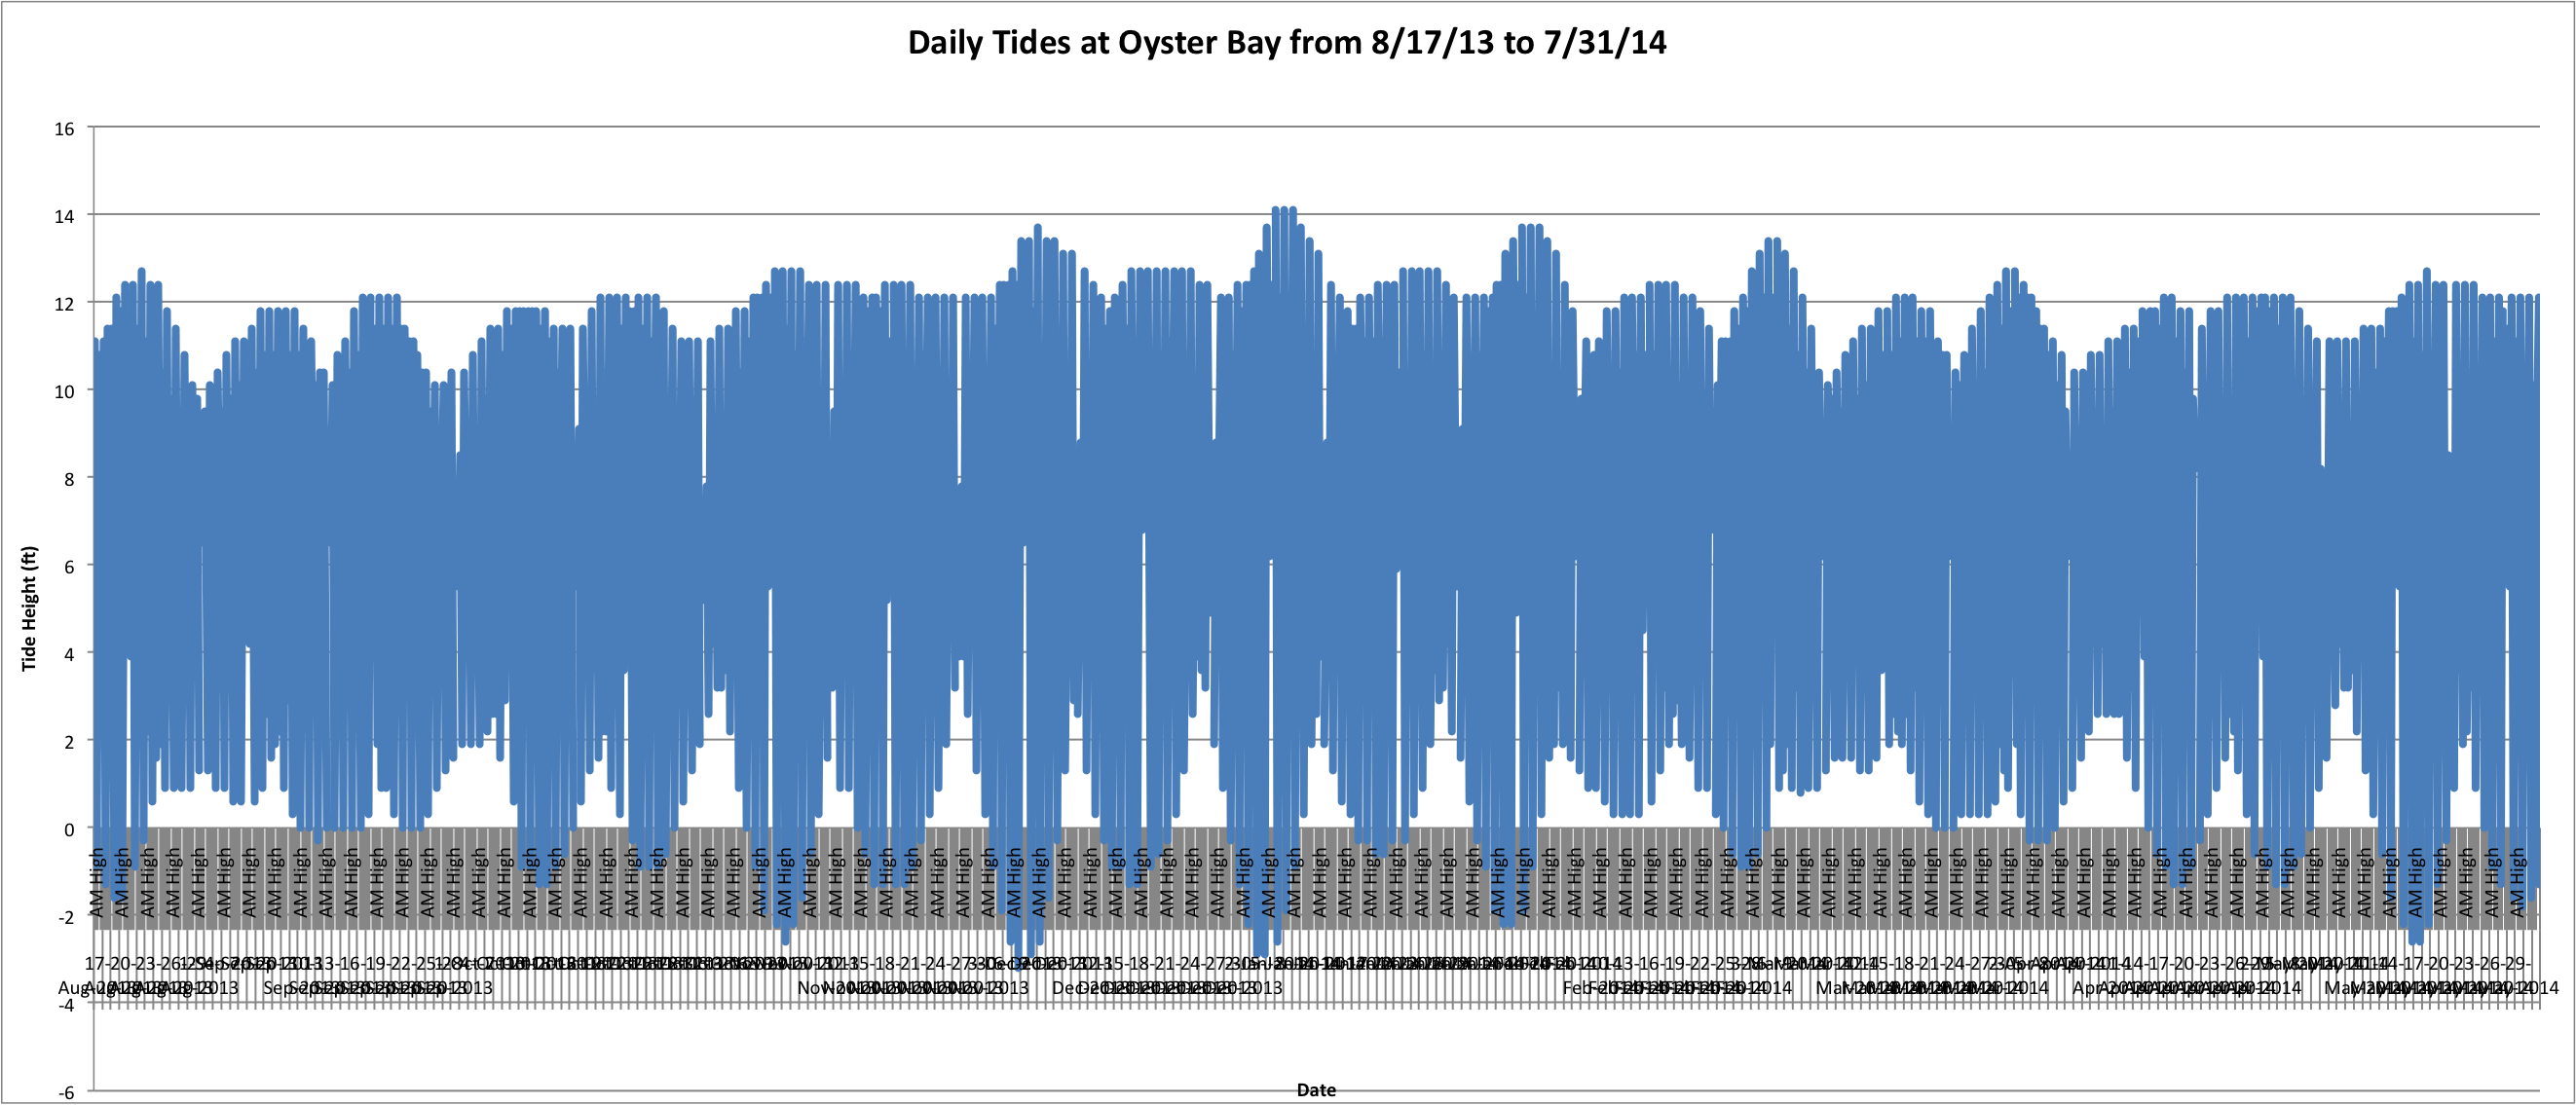
It's kind of a mess and I have to work on the x-axis labels because they're just all blobbed together. But the general trends of the tidal fluctuations can be seen fairly easily over time. (Link to Excel File: AlltidesatOyster.xlsx 75KB Aug 11 2014 11:31:13 AM)
Thursday, August 7, 2014
Today I just worked more on graphing the temperature data and tide data. I was able to graph the temperature data from August 2013 to June 2014.(Link to Excel file: ManAug13toJun14.xls 1734KB Aug 07 2014 01:48:49 PM)
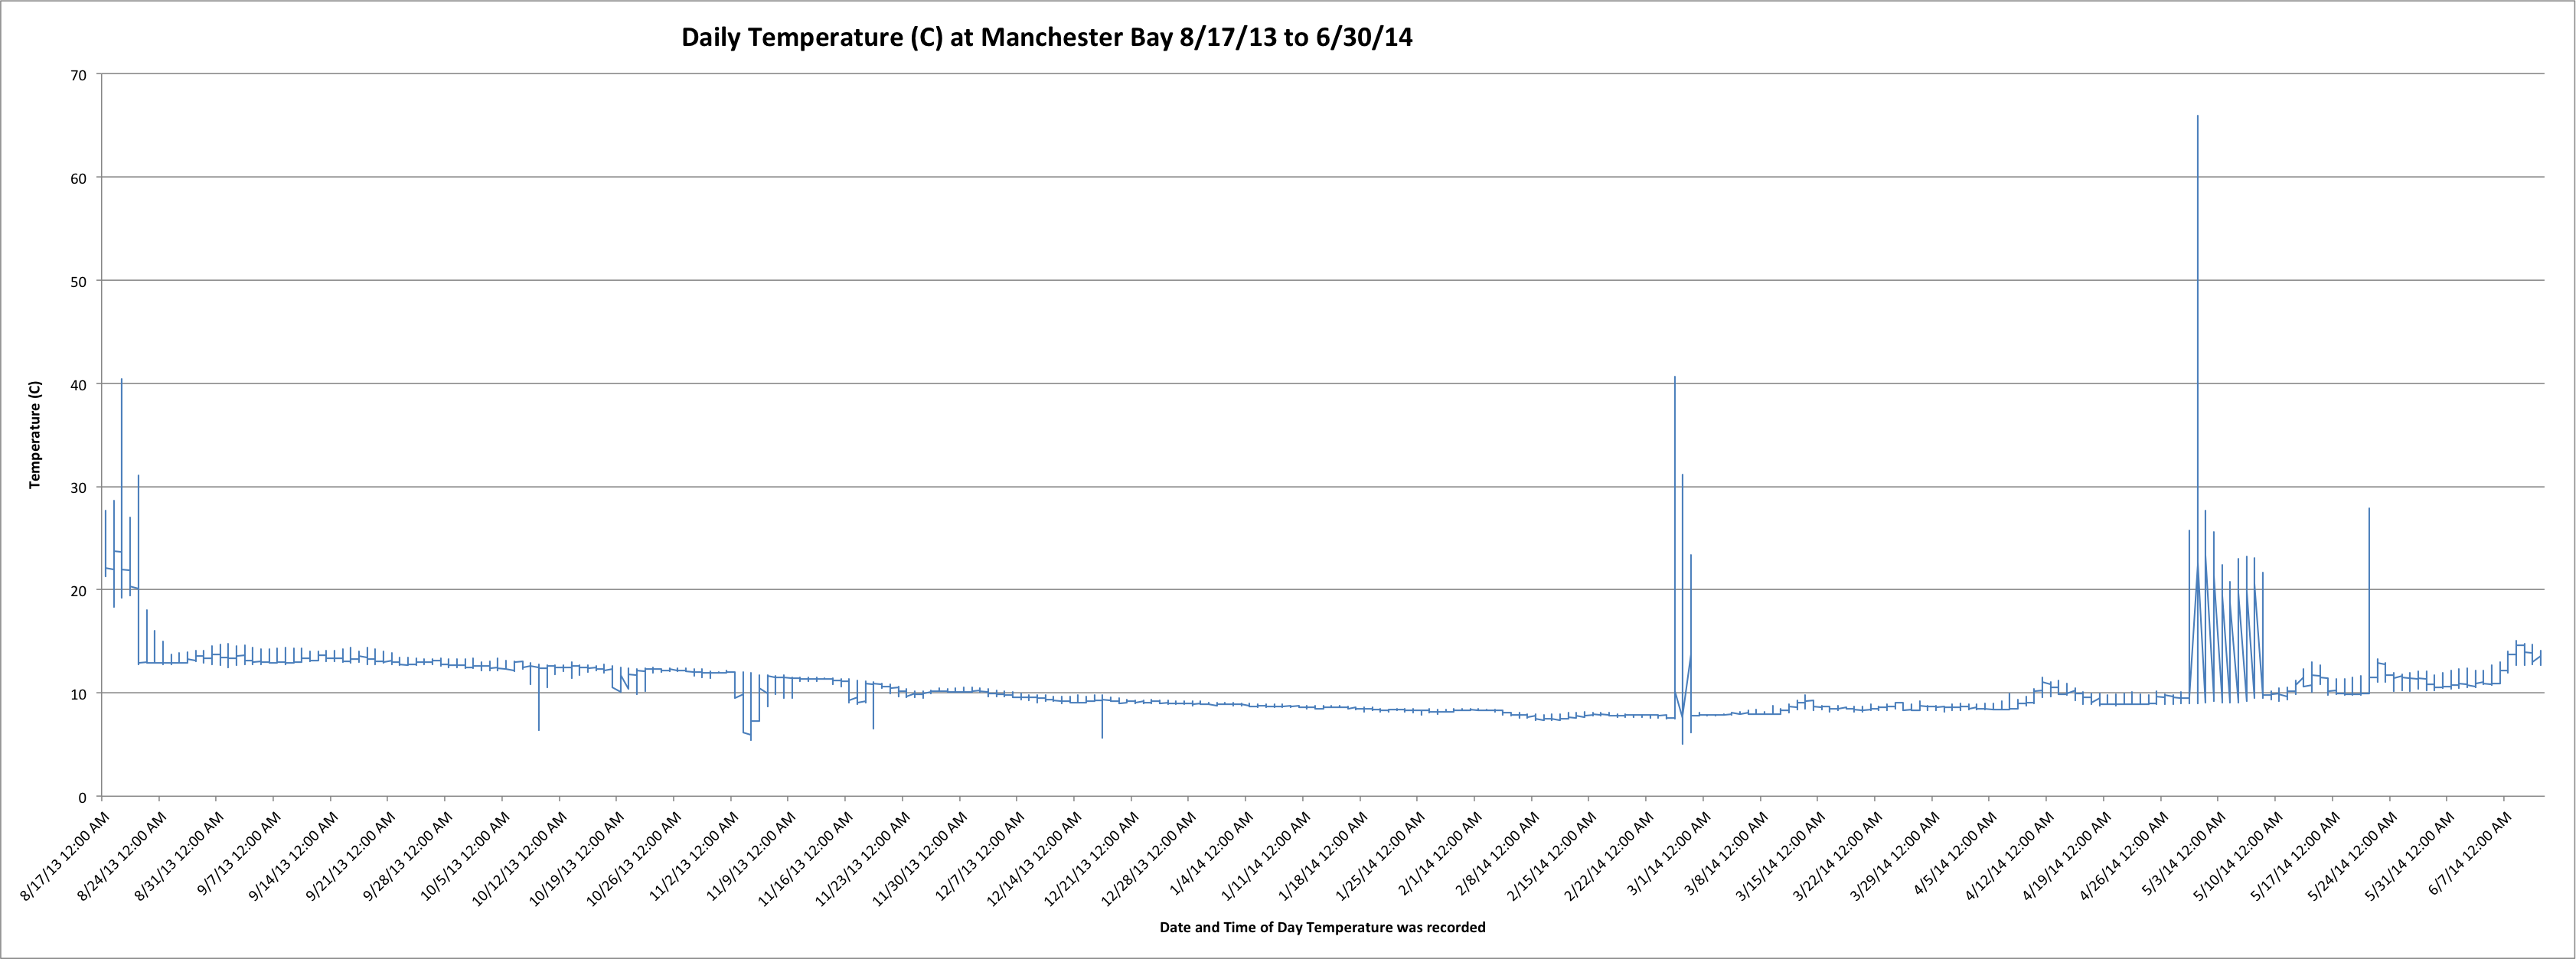
I also worked on entering tidal data into an excel spreadsheet for Oyster Bay. I have been getting the data from this website :
http://www.tides4fishing.com/us/washington/tracyton , and have four more months' worth of data to enter for this site. I am using the same time frame as that of the temperature data, so August 2013 to June 2014. Here's a link to the current progress: Alltidesattempt.xlsx 39KB Aug 05 2014 05:24:36 PM)
Tuesday, August 5, 2014
Today I worked on counting larvae for a few hours. I had an approximately 45mL sample of ethanol with the oyster larvae. I then stirred them in a beaker in one direction and then did a final stir in the opposite direction and immediately used a pipette to take a sample to place in a well for counting under the microscope. I tried doing both 500uL and 1000uL samples to count larvae. The numbers and averages are in this link to the spreadsheet -
https://docs.google.com/a/uw.edu/spreadsheets/d/1cCSCxO-Sz4GhS93cTMfPAVOhV5gQR5lCX7vJPOgtpGE/edit#gid=0
I also worked on making a more detailed temperature and tidal changes graphs. Excel still can't really do much with the temperature because there are too many data entries, so I'll have to ask what to do about that. I worked on making a more detailed tide chart and the rough draft of the tides at Tracyton (Oyster Bay) follows: (Link to excel spreadsheet: Alltidesattempt.xlsx 39KB Aug 05 2014 05:24:36 PM)
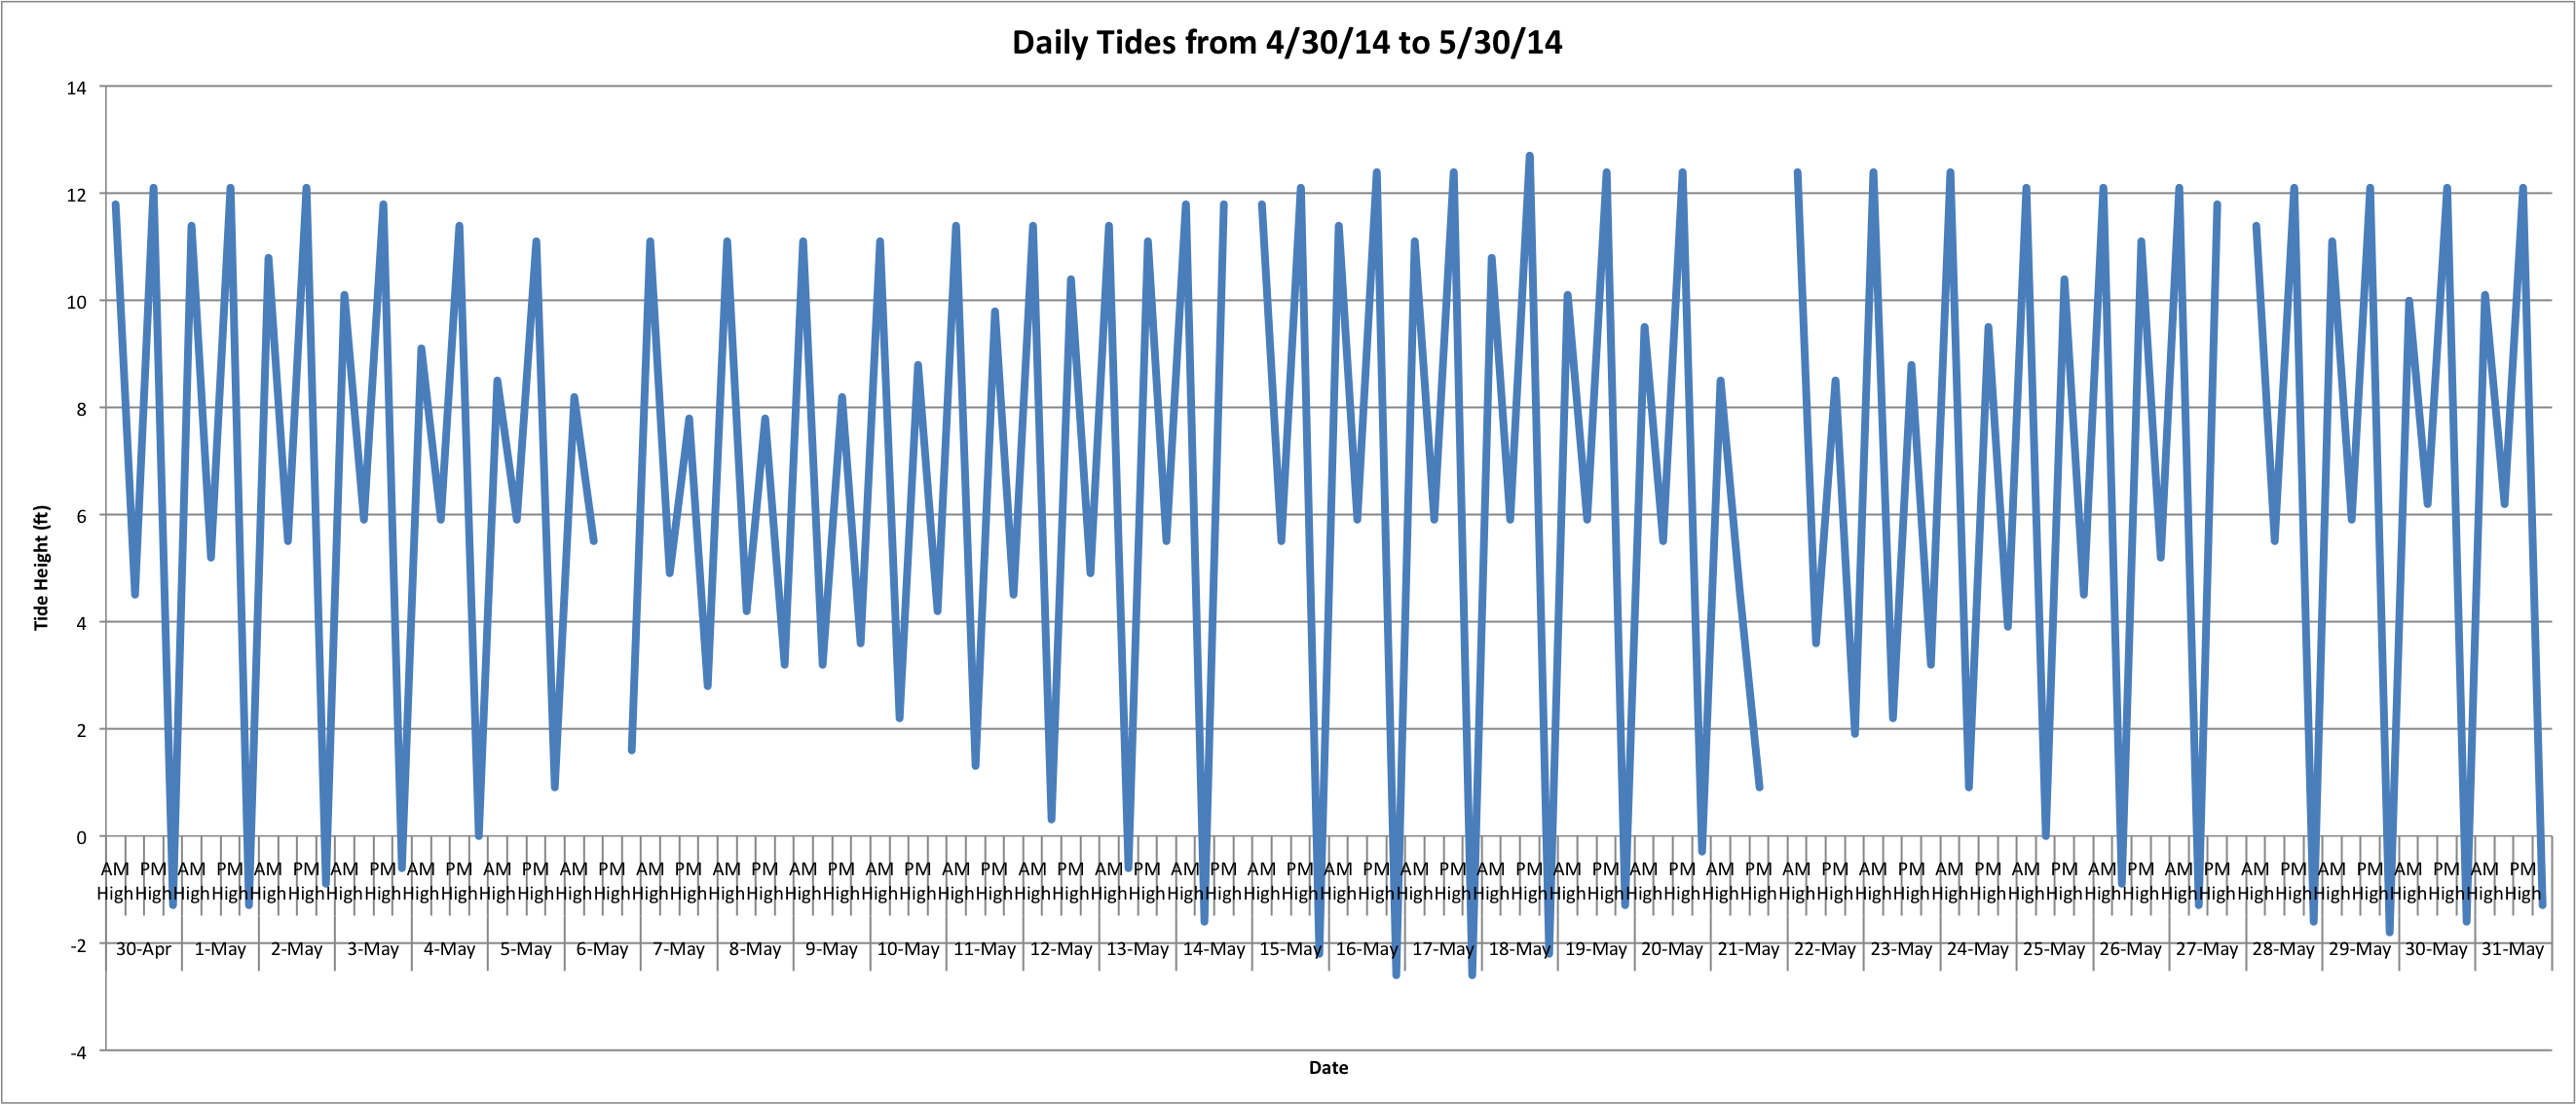
This is just for April 30, 2014 through May 30, 2014. I'll have to figure out how to make it less cluttered and maybe just show one Low and one High per day? I'm not sure yet.
I also looked at the agar plates that Sam and I tried to grow the V. tubiashii on. The samples that were kept in the freezer grew perfectly fine, while the sample that had been used at room-temperature for a while did not have any growth.
Friday, August 1, 2014
Today I did more lab stuff! I played around with this acrylic wheel that is designed to split a volume into two theoretically equal parts, and thus, theoretically, also whatever is suspended in the volume of liquid. In today's case we were trying to split a volume of ethanol with oyster larvae into small enough equal portions for an easier counting experience under a microscope. It was challenging to use the device because the larvae kept getting stuck to the surface of the wheel and it was hard to figure out how to keep them from doing that.After playing with that for a while, I then tried another method of taking smaller samples of the ethanol and larvae in order to count them under the microscope. This worked fairly well. I used one half of the ethanol and larvae sample. I had sort of succeeded in splitting the original 200mL of ethanol and oyster larvae into one 112mL sample and one ~100mL sample. There was an increase in ethanol because I stopped midway through the process to spray down the inside of the wheel with ethanol in the hopes that it would keep more of the larvae in the sample. I took the sample that contained 100mL of ethanol and stirred it in one direction until it looked fairly suspended, and then once in the opposite direction to try to counteract the tendency of the larvae to accumulate in the middle of the ethanol. I then used a pipette to place 500microliters into a well. I did this process two more times so that I ended with three wells with about 50microliters of ethanol and however many larvae were suspended.
I then counted the larvae in each well. The counts follow:
| Well # in Column 2 |
Count 1 |
Count 2 |
Count 3 |
Average |
| Well # 1 |
13 |
13 |
13 |
13 |
| Well # 2 |
14 |
14 |
14 |
14 |
| Well # 3 |
22 |
22 |
22 |
22 |
Thursday, July 31, 2014
Today I did some lab work! I helped Sam with spreading Vibrio tubiashii across agar plates to try to get some cultures growing. We used both frozen samples and room-temperature samples. I then worked on making some more graphs in excel, but this time just focusing on more detailed temperature data over the course of the sampling dates for Jake's research. Excel is having a rough time dealing with all the data entries, so a graph hasn't been made yet that can be easily read. I will continue to work on this in the next week.Link to the data:
ManAug13toJun14-2.csv 579KB Jul 31 2014 04:05:06 PM
Wednesday, July 30, 2014
Today I updated the percent brooders with averaged weekly temperature graphs with the new data from Jake's field work last week. I then put the graphs of percent brooders with the temperature and also with the tides into a google doc presentation just for an easier viewing experience.Link to google doc presentation:
https://docs.google.com/a/uw.edu/presentation/d/1qrGKryRLCdWkpo1ZnP5FVGPqXPVEfkuvk8nTwtYART8/edit#slide=id.g36bcdc8e4_045
Tuesday, July 29, 2014
Today I worked on graphing the relationship between the Percent Brooders separated by site with the tidal cycles. I found the tide information from the following website:For Fidalgo -
http://www.tides4fishing.com/us/washington/anacortes-guemes-channel
For Manchester-
http://www.tides4fishing.com/us/washington/clam-bay
For Oyster Bay-
http://www.tides4fishing.com/us/washington/tracyton
I took the averaged lowest low tides per sample week dates per site. Then I graphed those against the percent brooder data which are separated through color-coding into the different populations.
The link to the Excel File:
NewPercBrooderswithTidesatSepSites.xlsx 57KB Jul 29 2014 04:14:22 PM
The graphs follow:
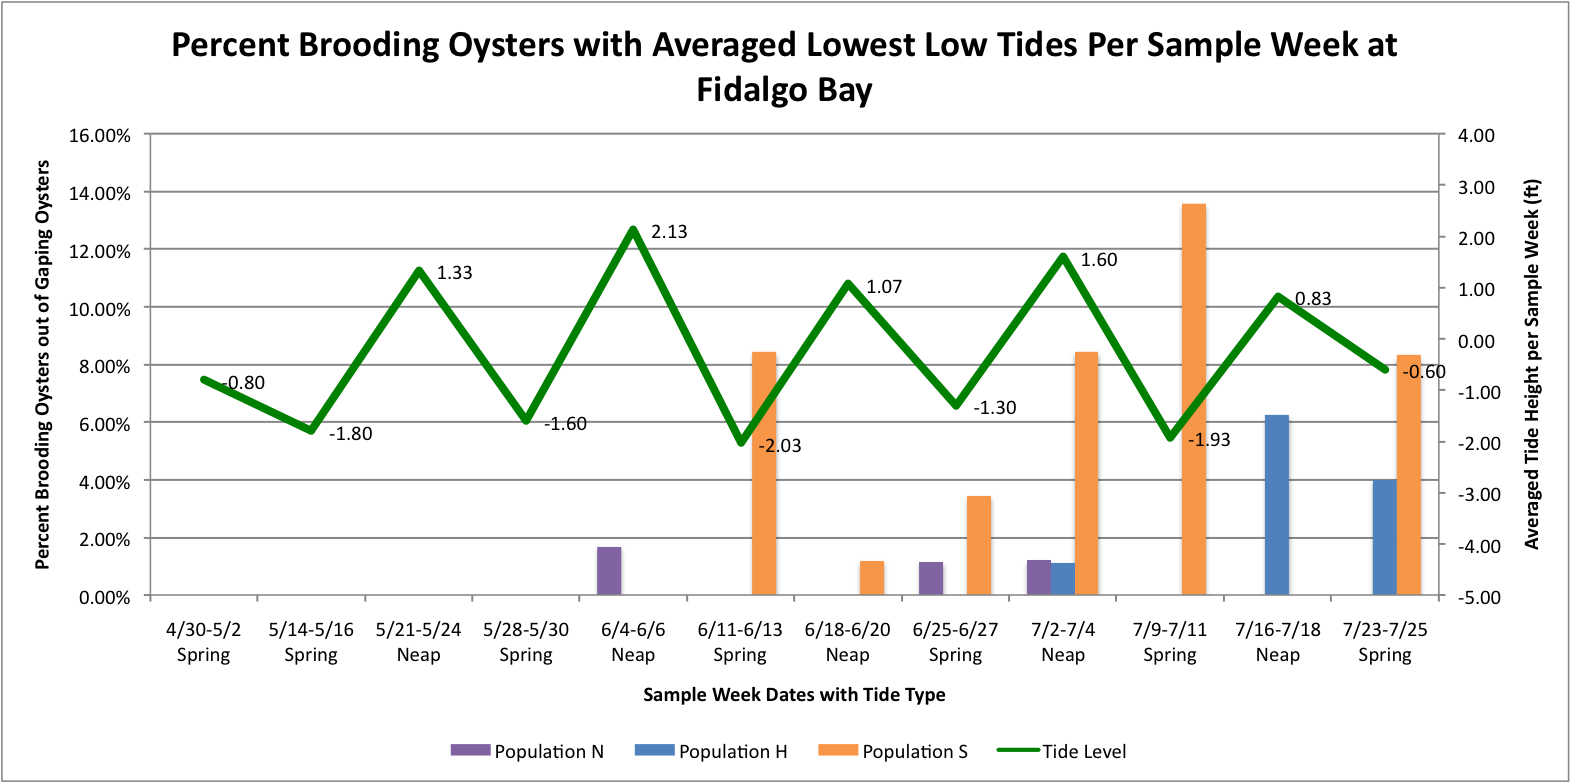
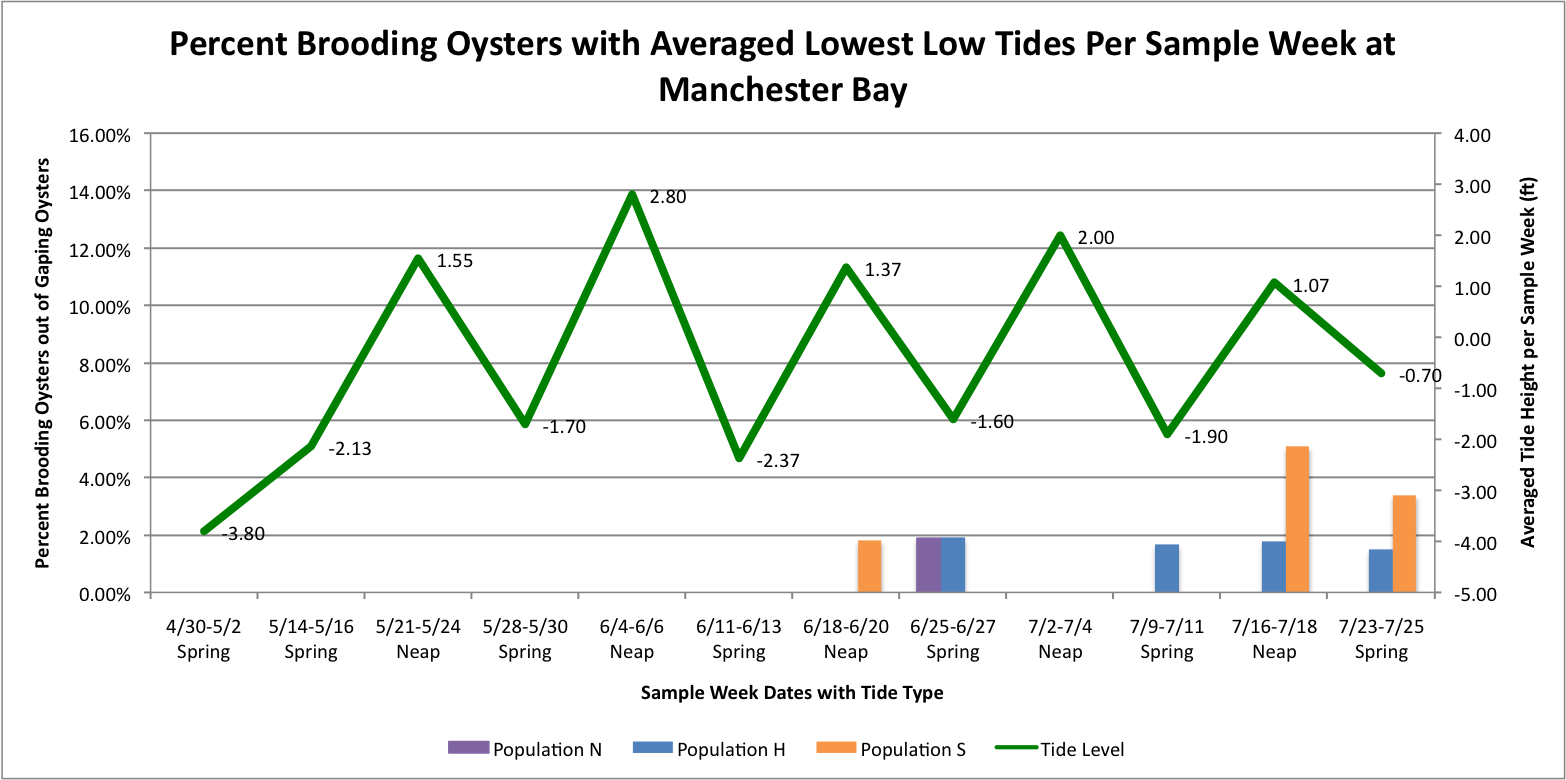
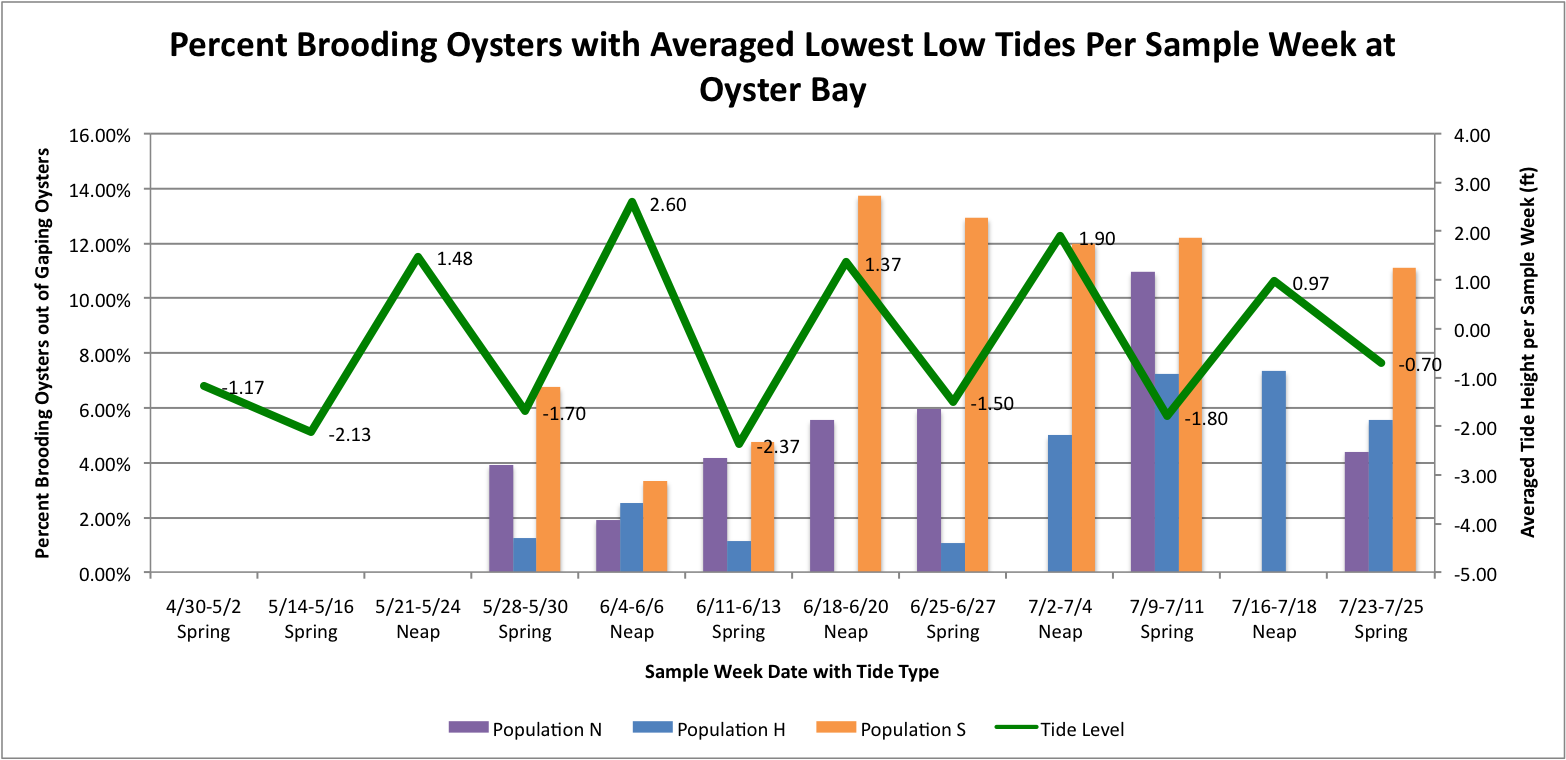
It looks like at Oyster Bay that there could be a correlation between the spring tides and the increased brooding in the Southern Population.
Friday, July 25, 2014
Today I figured out how to make the Percent Brooders over Time with Temperature at the different sites separated by population graphs look the way I was trying to make them. I was organizing the data in excel all wrong. So here are the new versions of the graphs:
(Link to Excel file: NewerPercBrooderswithTatSepSites.xlsx 59KB Jul 25 2014 11:39:28 AM)
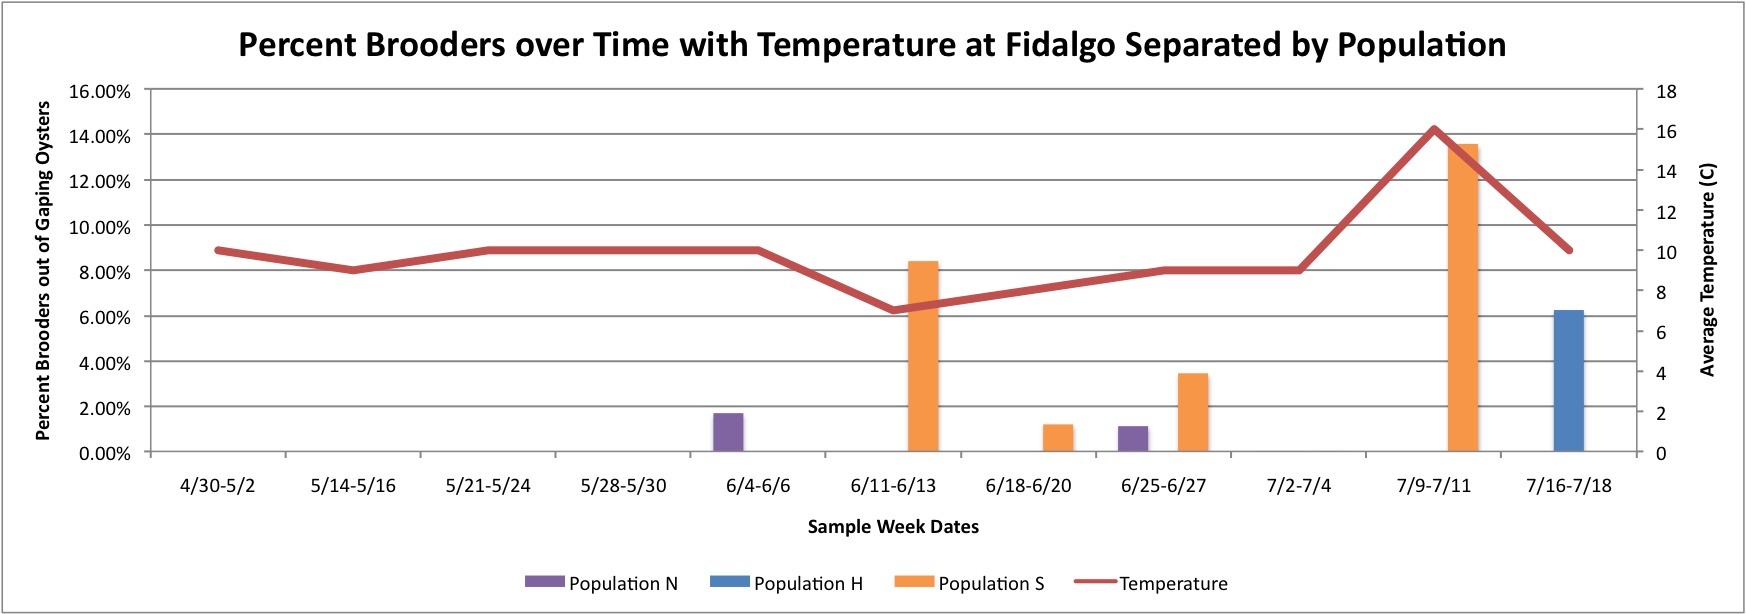
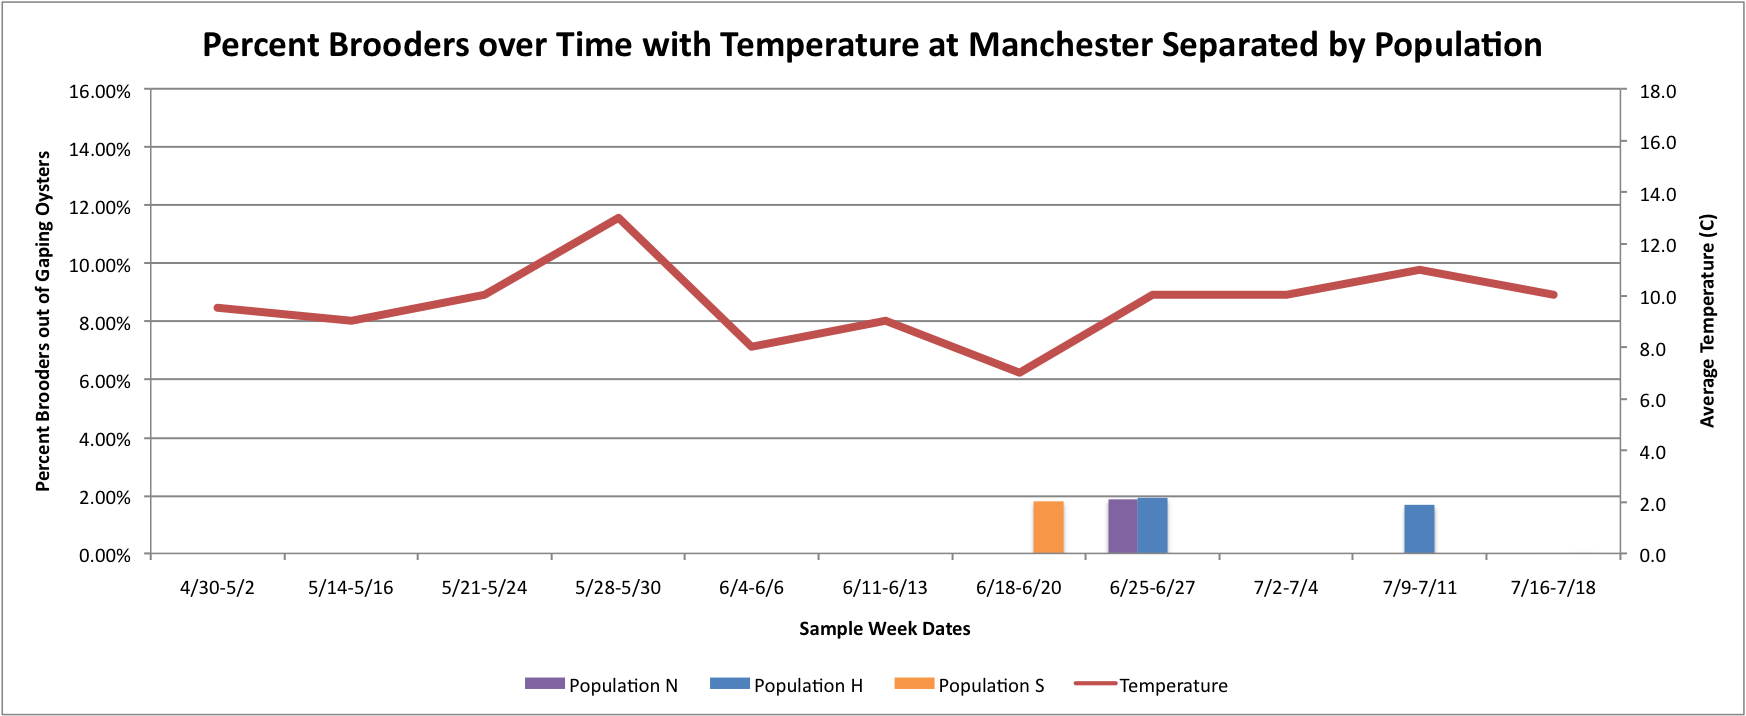
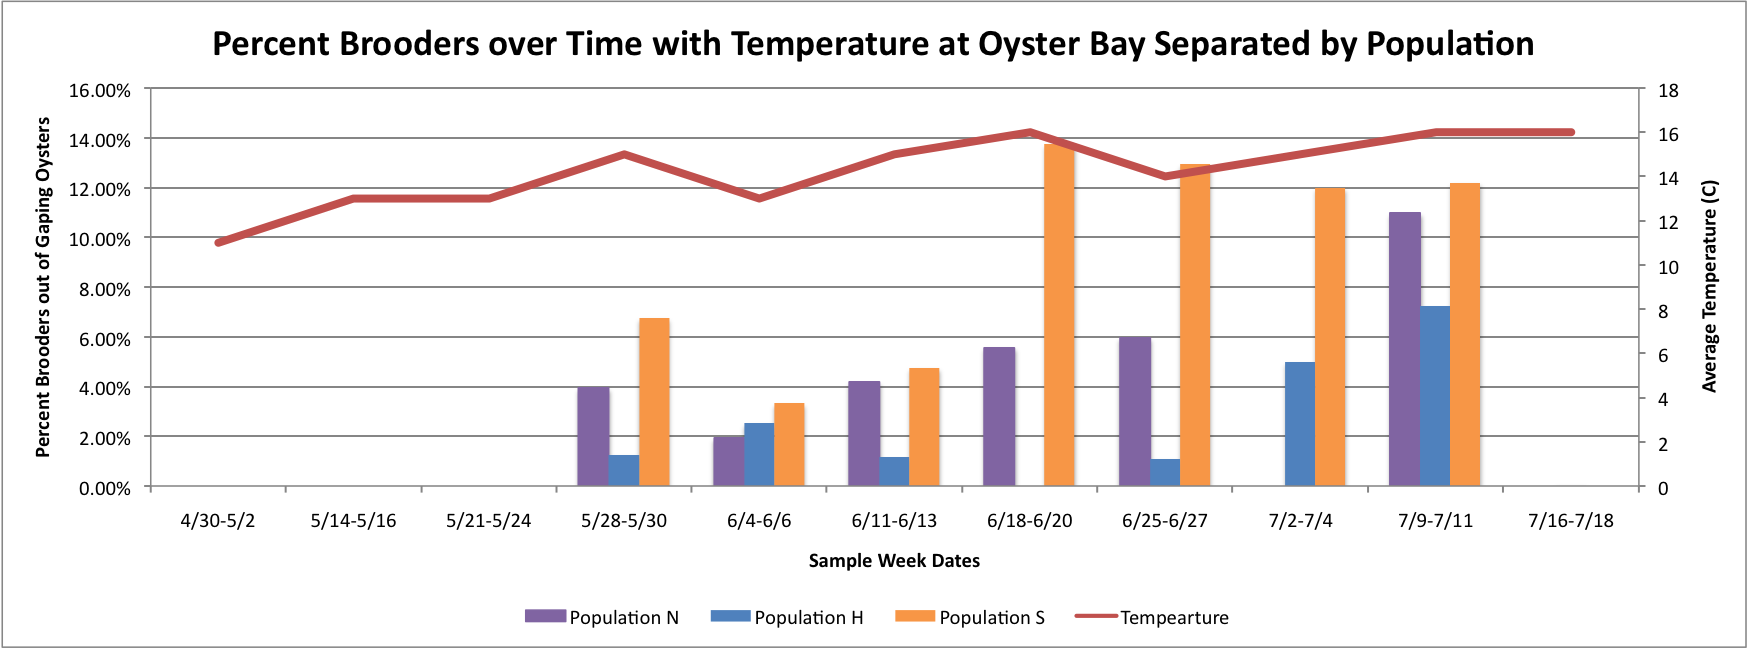
Based on these graphs it seems as though the S Population broods better in warmer temperatures.
Thursday, July 24, 2014
Today I have been playing around with the Percent Brooder data and am having a hard time figuring out how to make the graphs that I want on Excel. I have been working with the Percent Brooder data per site per population and the average weekly temperature per site data.First, I made some graphs of the average temperature over time.
(Link to Excel File: AverageGperPopOverTime.xlsx 30KB Jul 08 2014 04:09:45 PM)
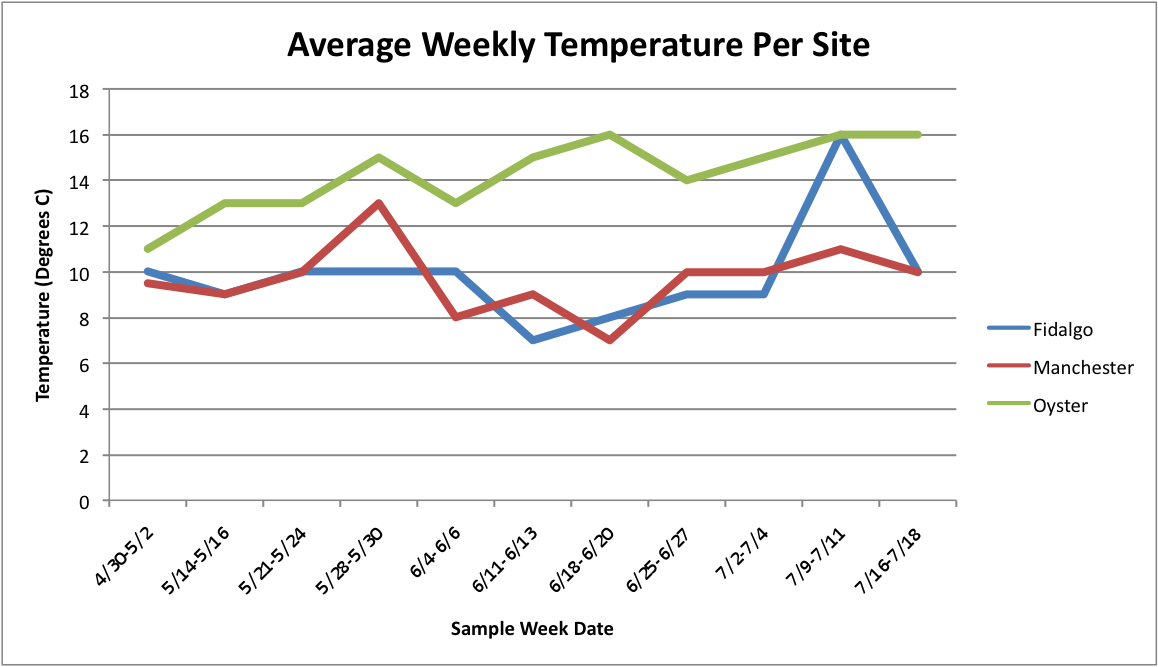
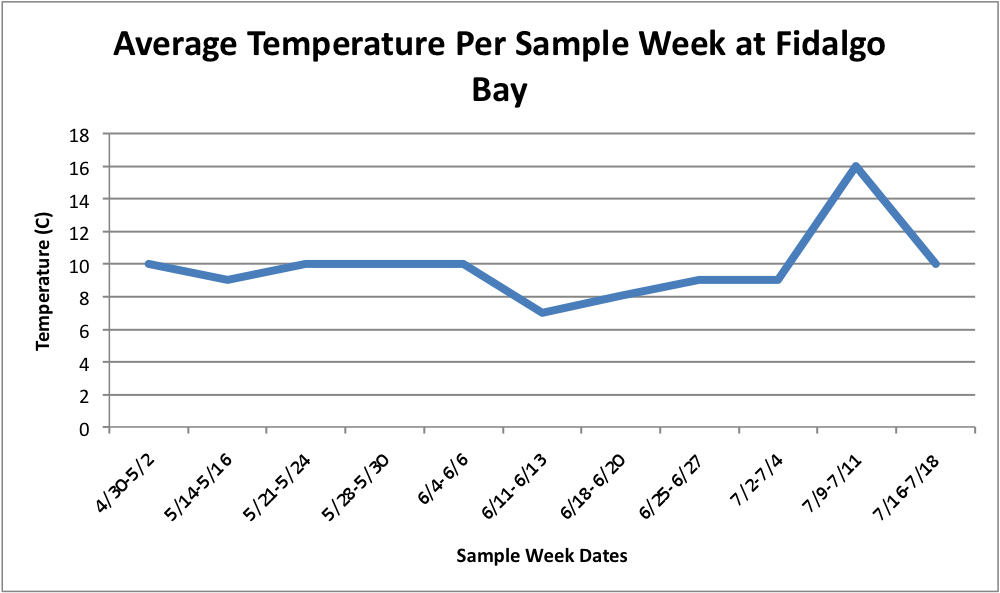
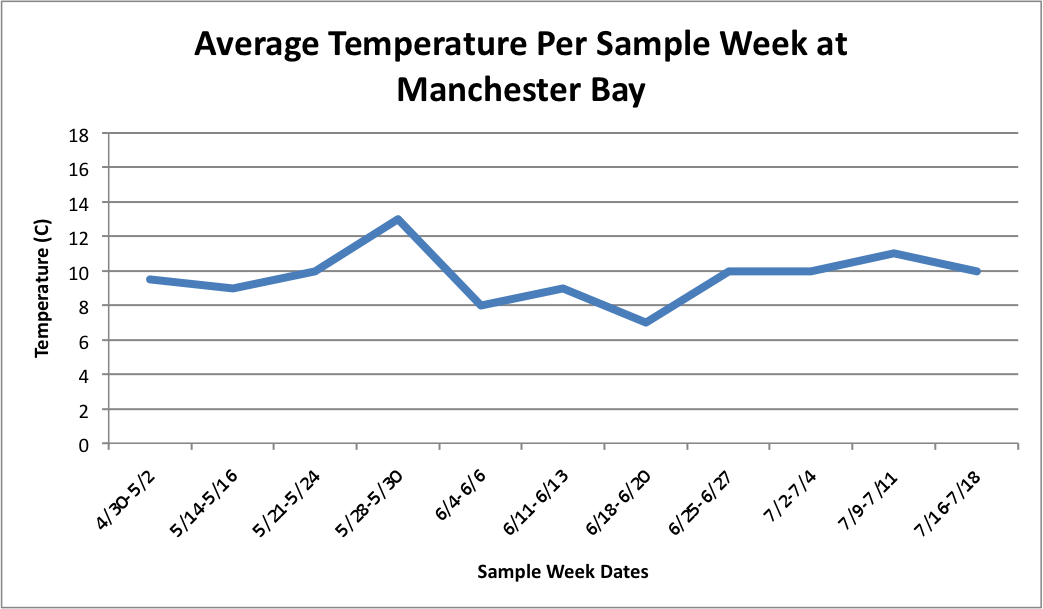
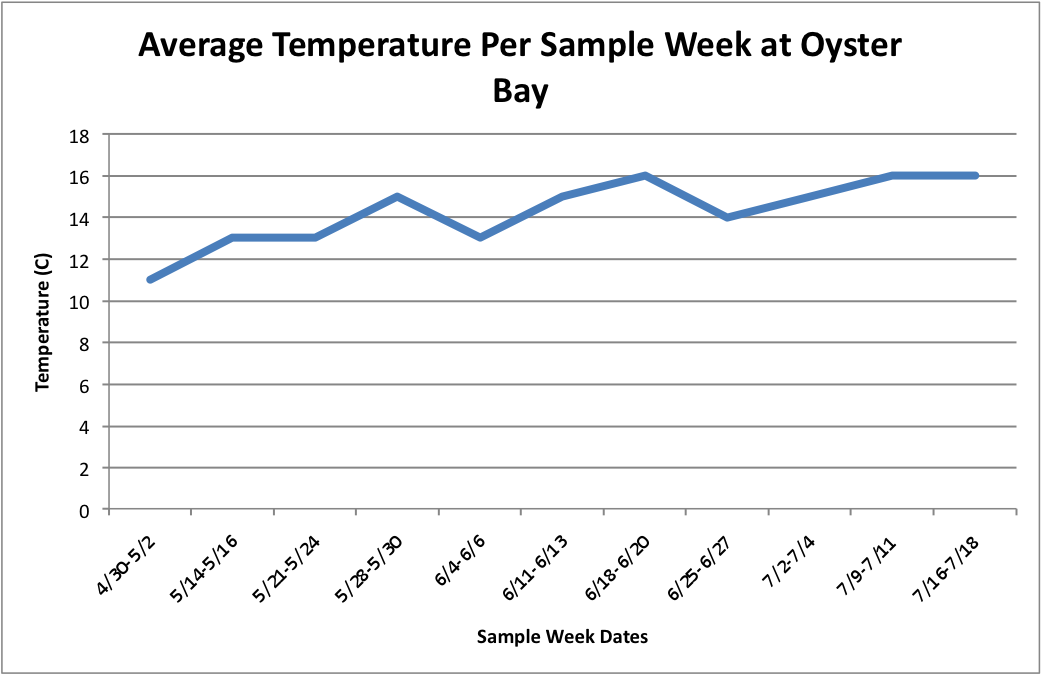
Next, I tried to figure out how to combine this temperature data in line-graph form with the column charts I have previously made of the percent brooders over time. I tried first doing each population separately. So, for each site, I created three separate graphs:
(Link to Excel File for following charts: PercentBroodersSepbyPopwithToverlay.xlsx 60KB Jul 24 2014 04:41:41 PM)
Fidalgo:
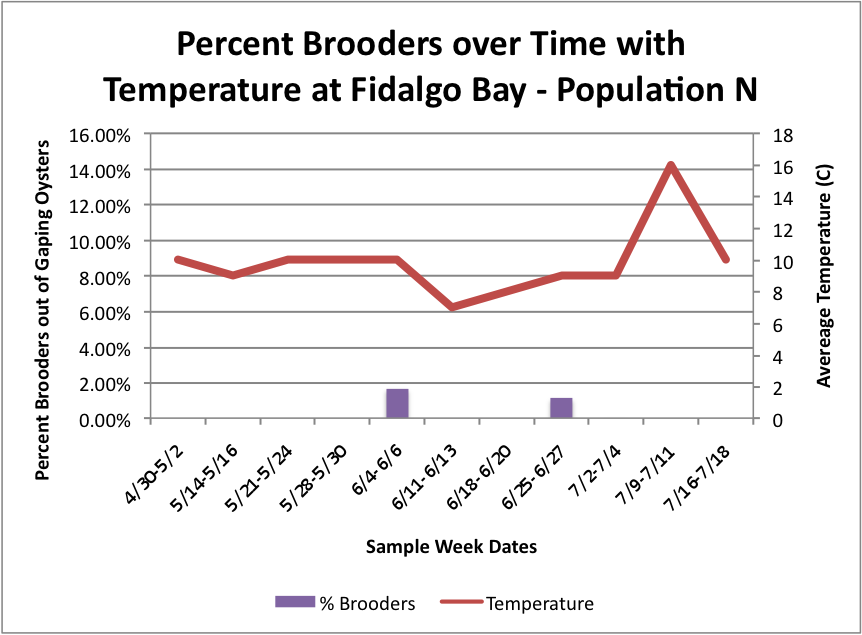
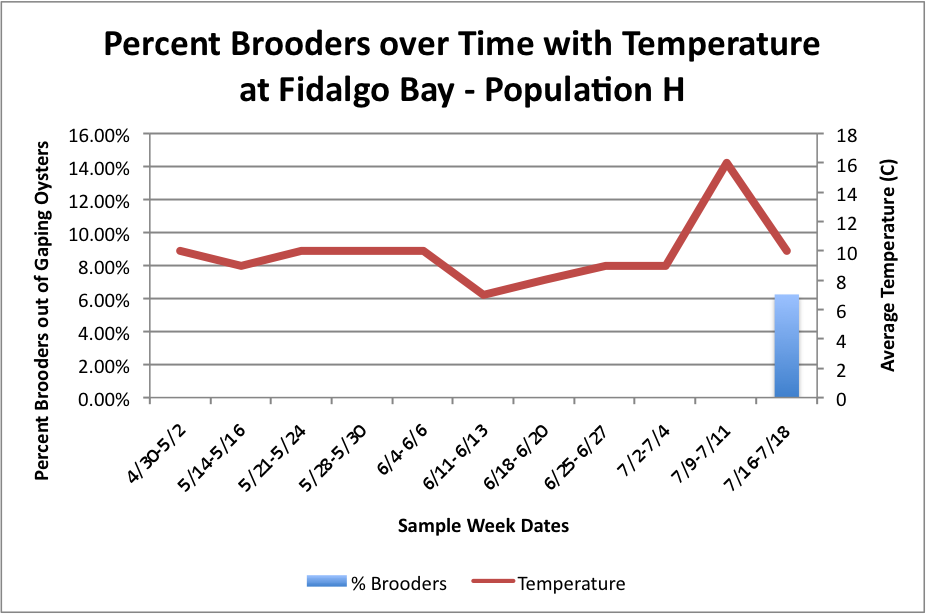
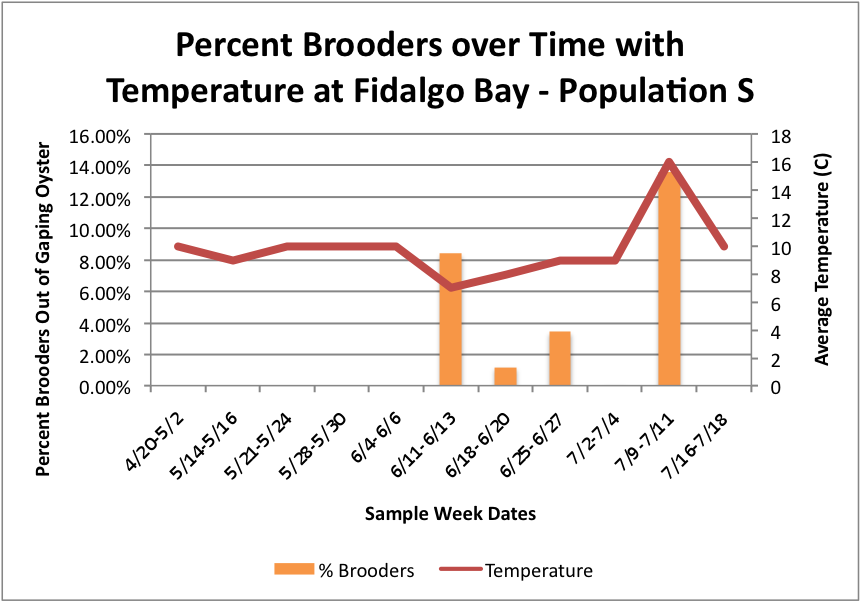
Manchester:
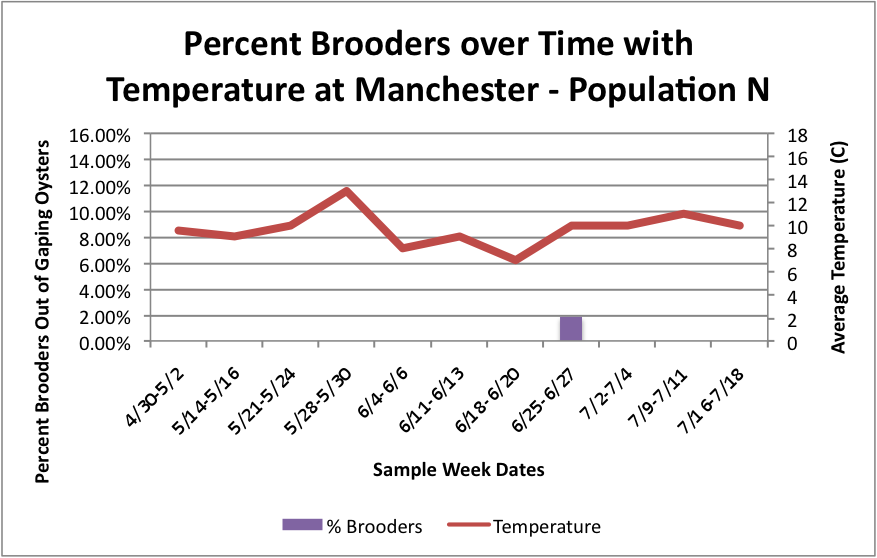
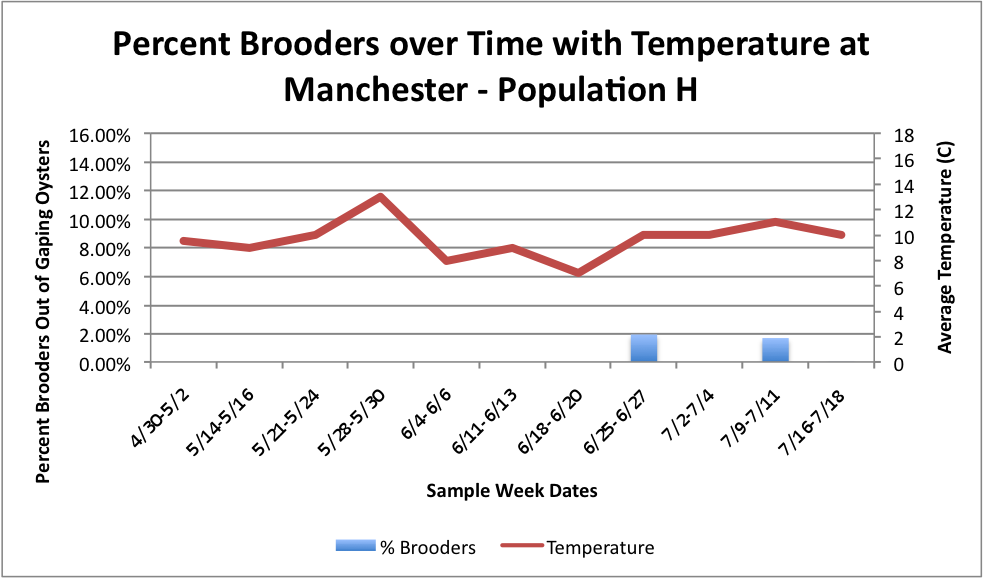
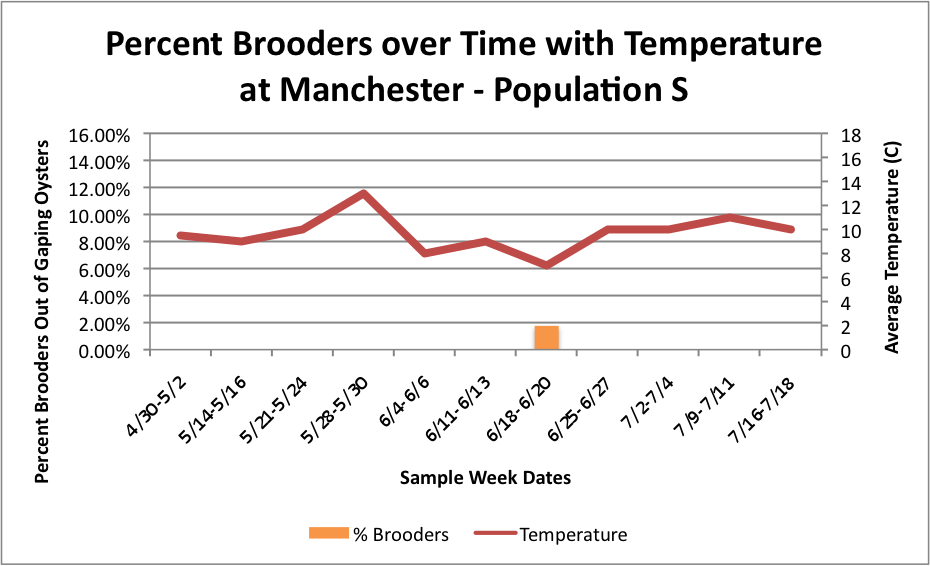
Oyster:
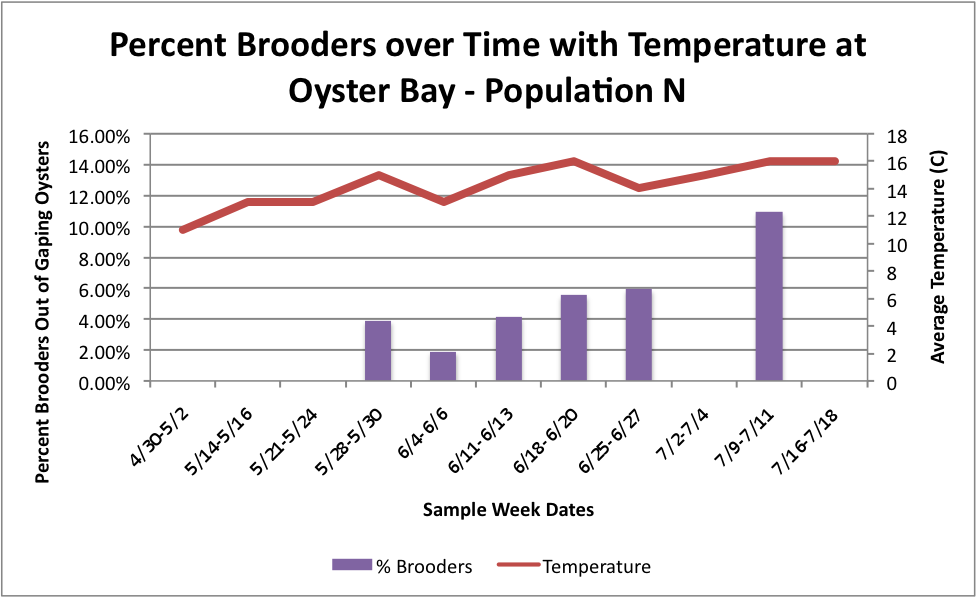
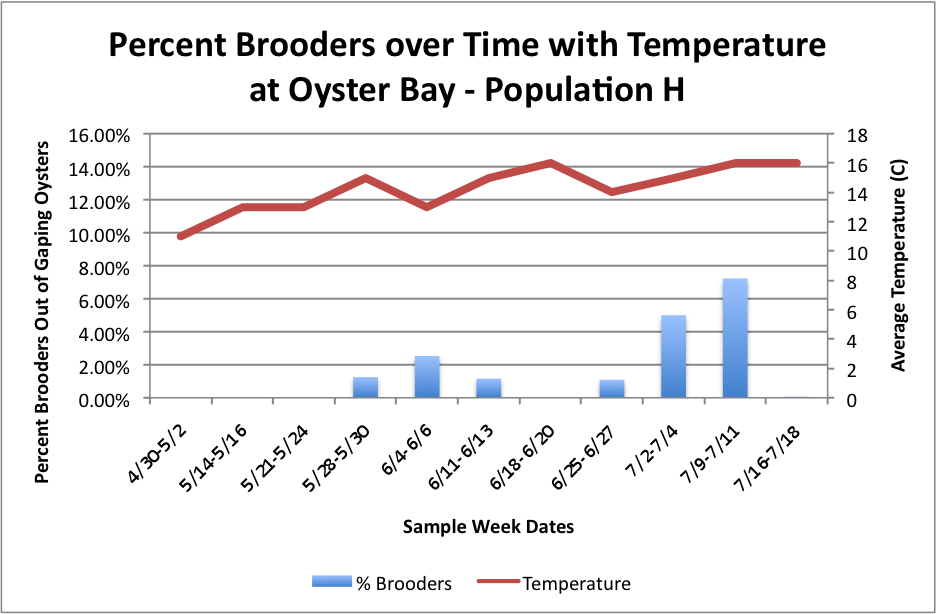
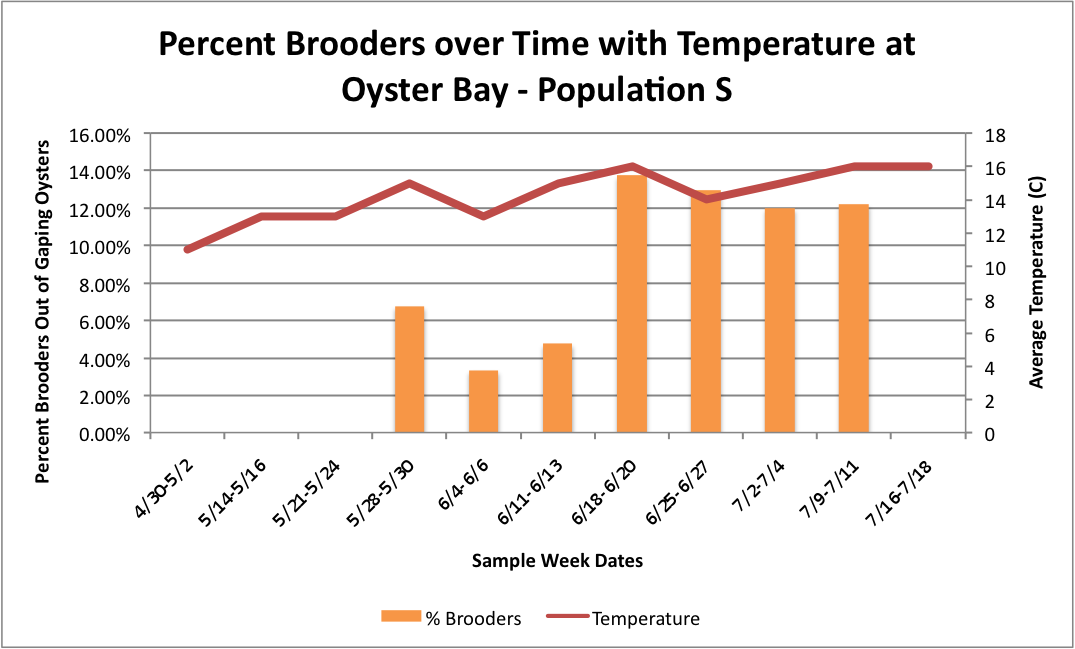
Then, I tried to do it with all populations combined, but separated by sites with the temperature. I don't know how easy these are to read, but I'm still working on them.
(Link to Excel File with Data: attemptatToverlayonPercentBrooders.xlsx 52KB Jul 24 2014 04:35:39 PM )
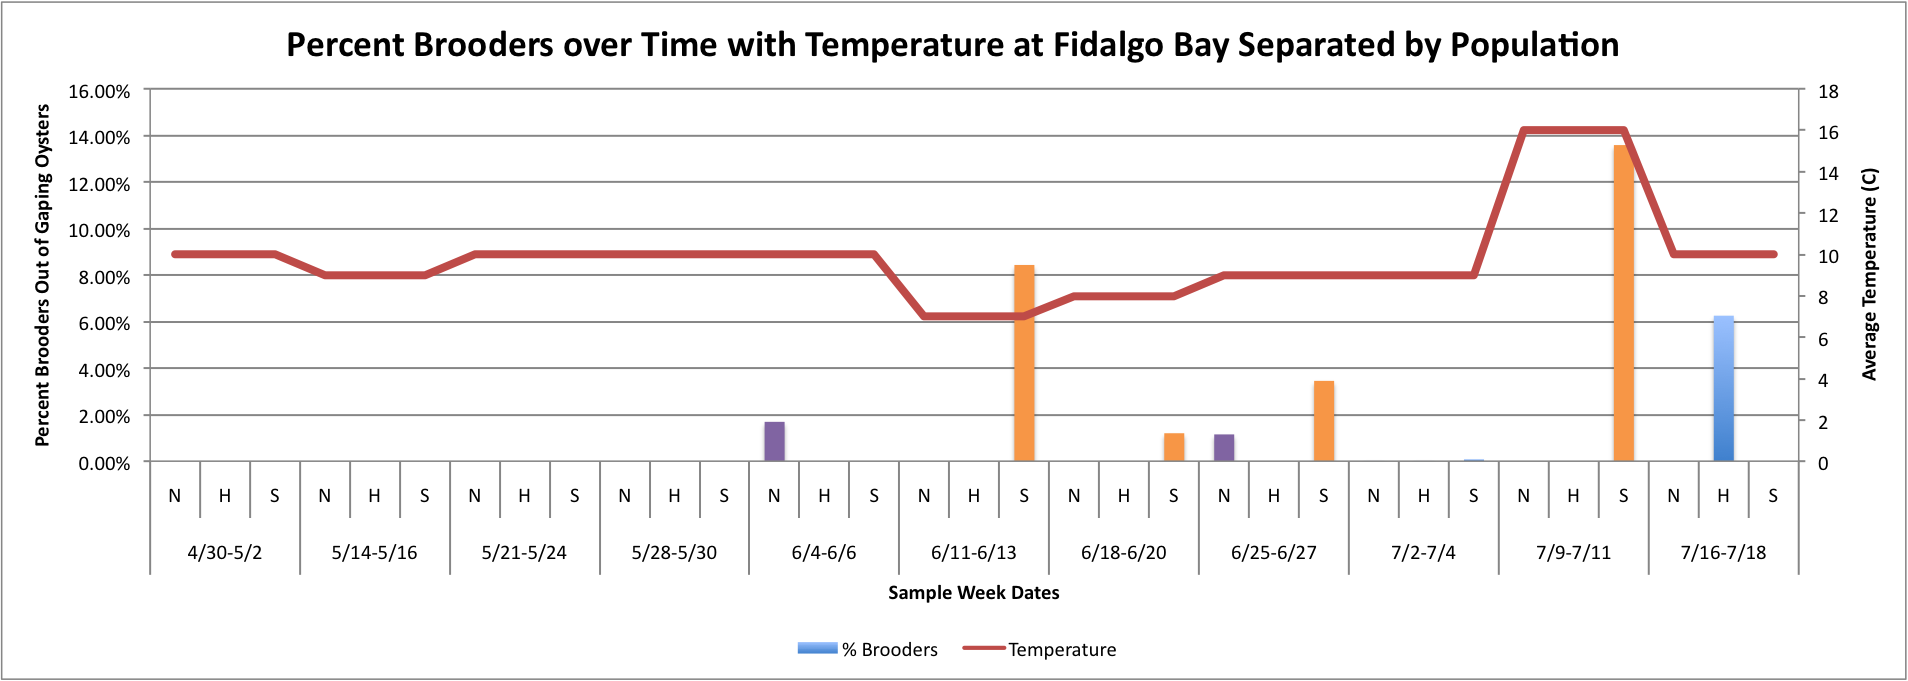
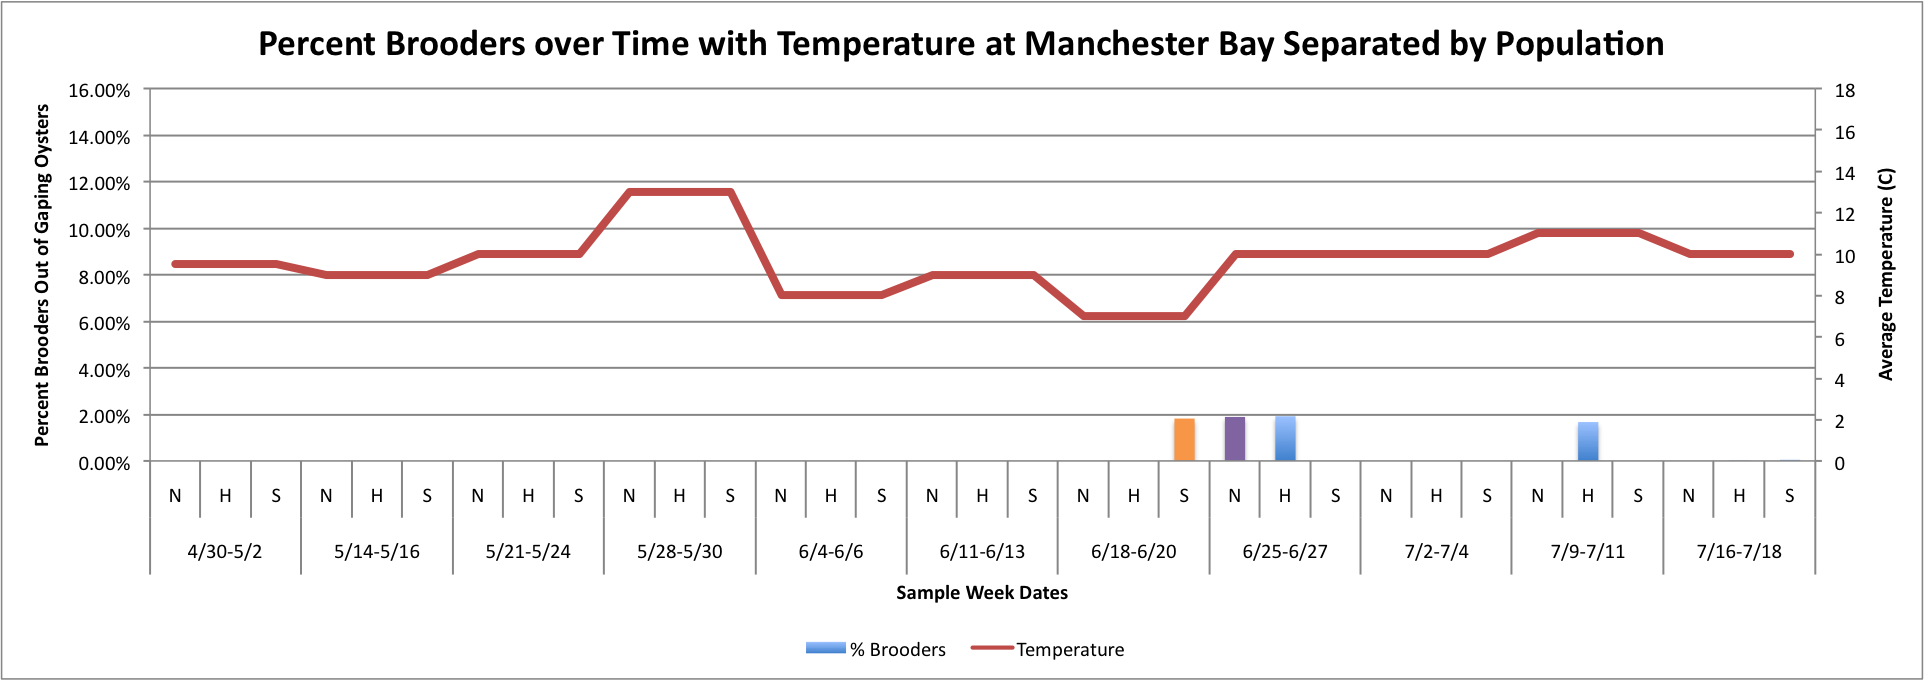
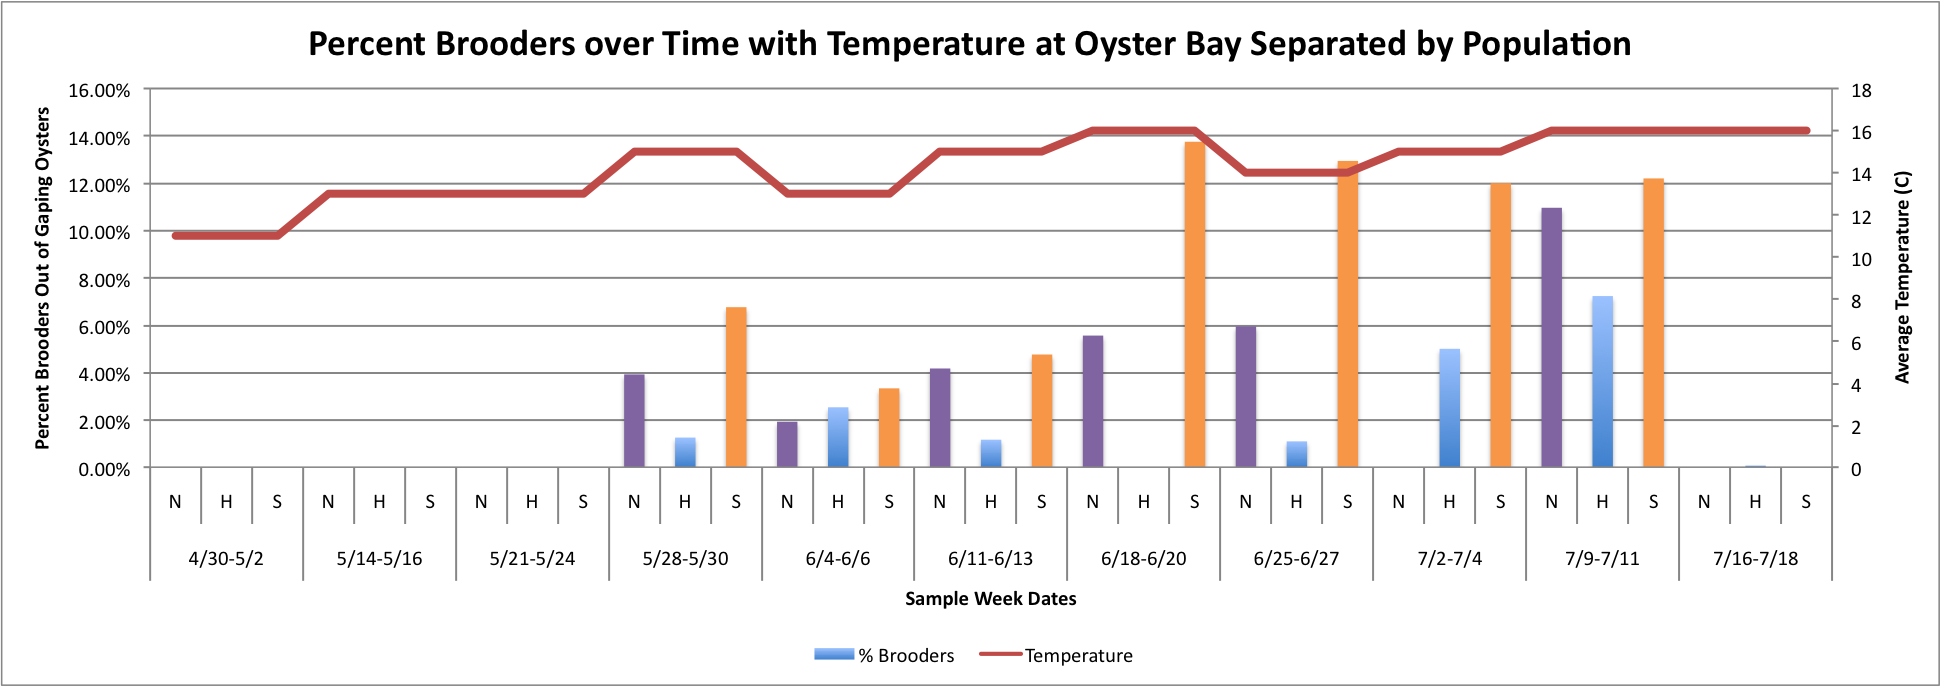
The three graphs directly above were really hard to figure out how to make because the data has to be separated by date and also by population, which made the temperature hard to graph because in order for excel to be able to make a line graph, I had to put in each Temperature three times per sample week date since each week is separated into three categories. I don't really like how these graphs look, so I will continue to work on them.
Monday, July 21, 2014
Today I didn't do a whole lot of new stuff, but mostly talked with Steven about what I should focus on in the coming weeks. I will be working mostly with the Percent Brooders data from July 11th post and try to figure out better ways to visualize the data and keep updating as new data comes in week to week. I haven't made too many changes yet, but will be doing so in the next few days. I will also be thinking of ways to relate that data visually with the changes in temperature per site over time.Link to Percent Brooder data: BroodersovertimeSEPARATESITESgood.xlsx 48KB Jul 21 2014 12:04:16 PM
Wednesday July 16, 2014
Today I made some more adjustments to graphs that I have been working on, and have always made some new graphs. The following show number of spawners per site as the total number for that week, rather than an additive visual over time…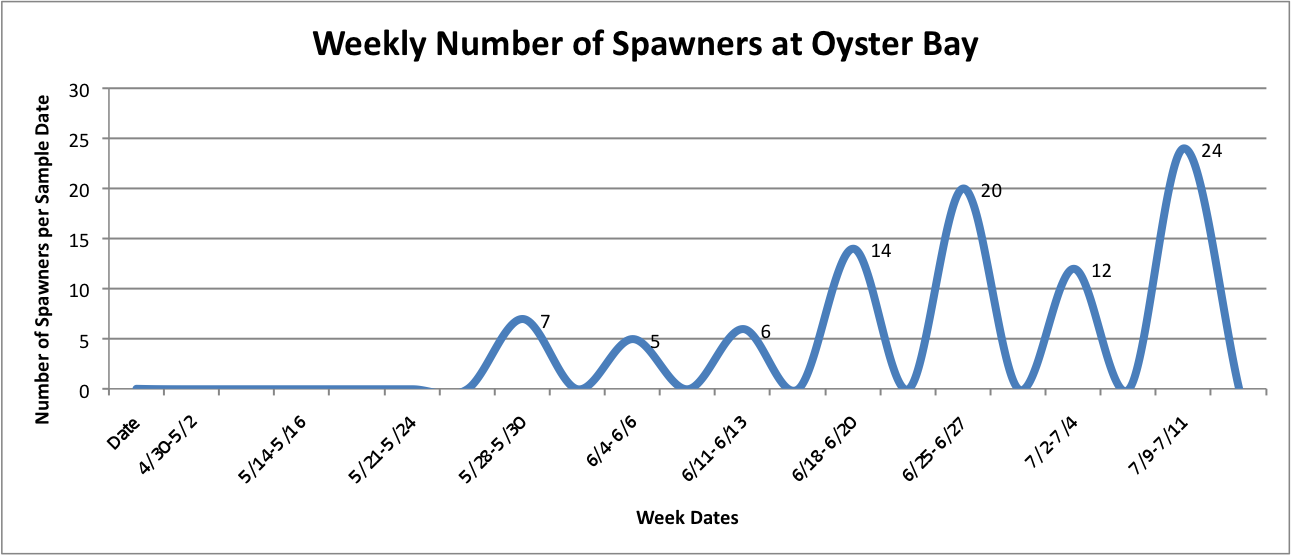
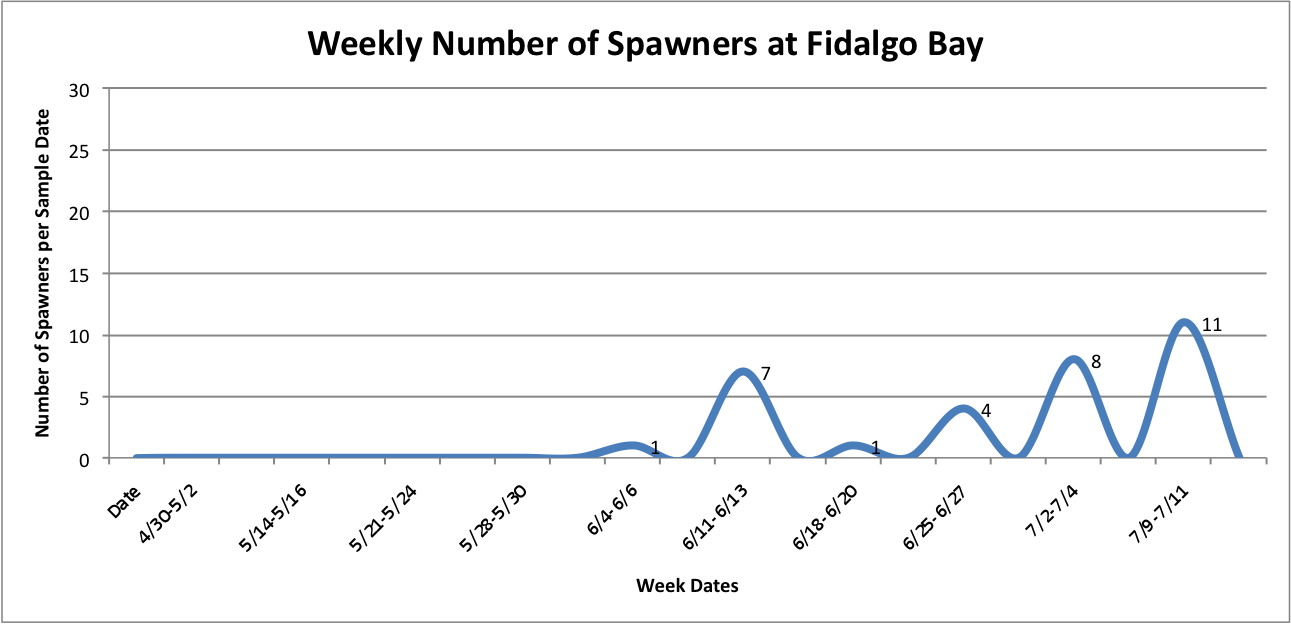
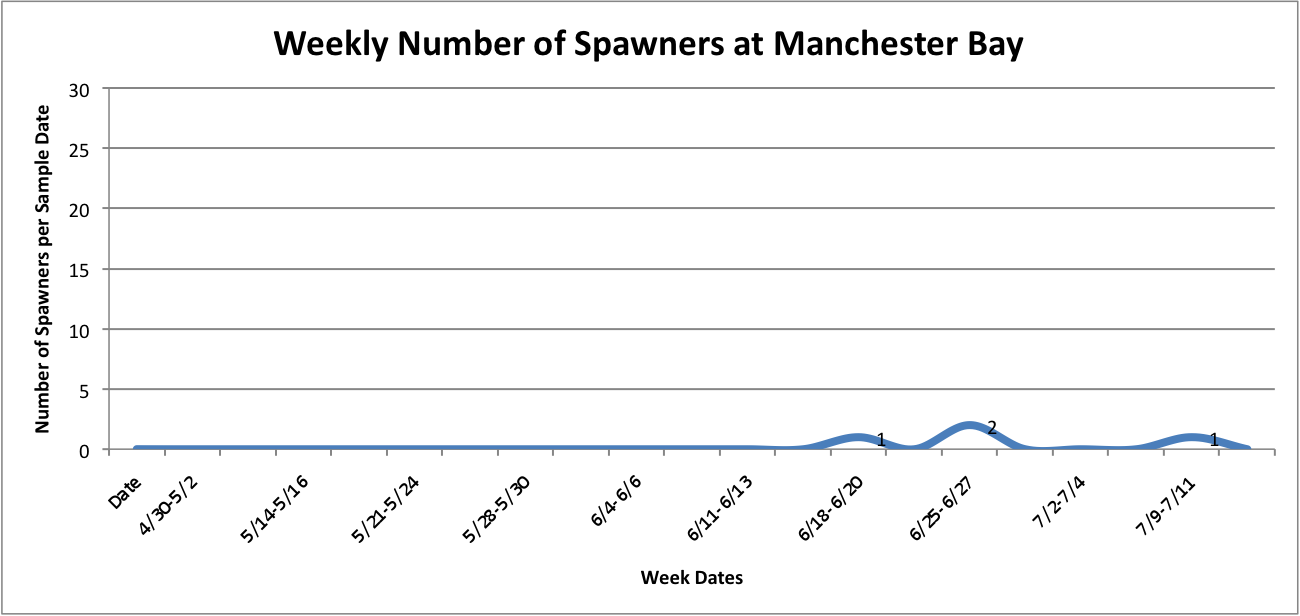
Link to data:
UpandDownGraphofNumSpawnersperdaypersite... 42KB Jul 16 2014 10:32:03 AM
Then, I added the temperature fluctuations over the weeks at those individual sites over the above graphs to try to show any correlation between the two factors:
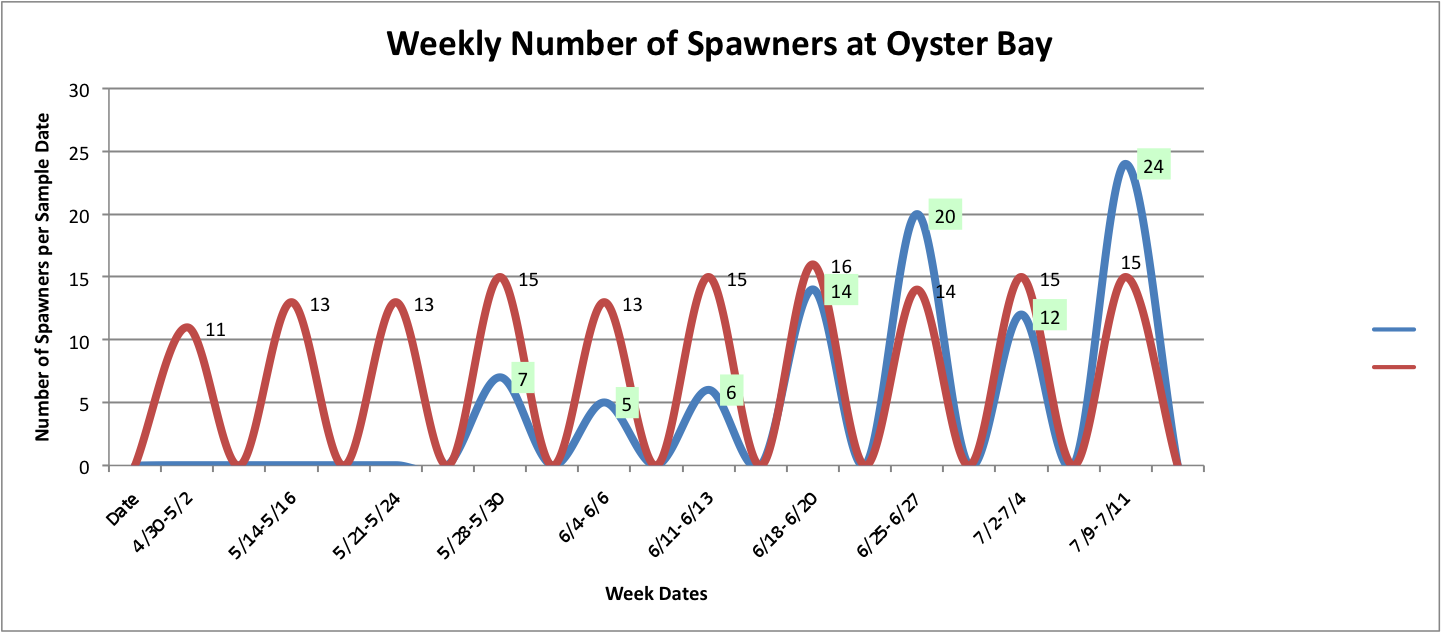
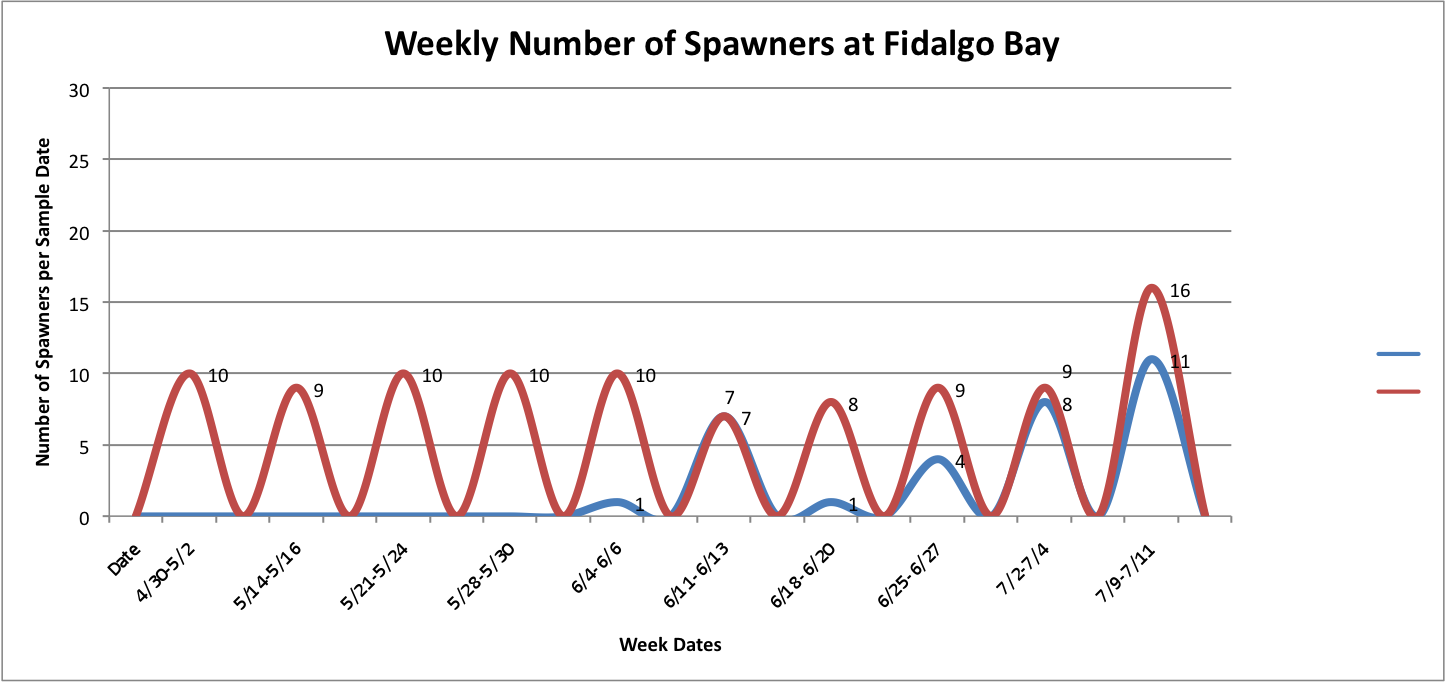
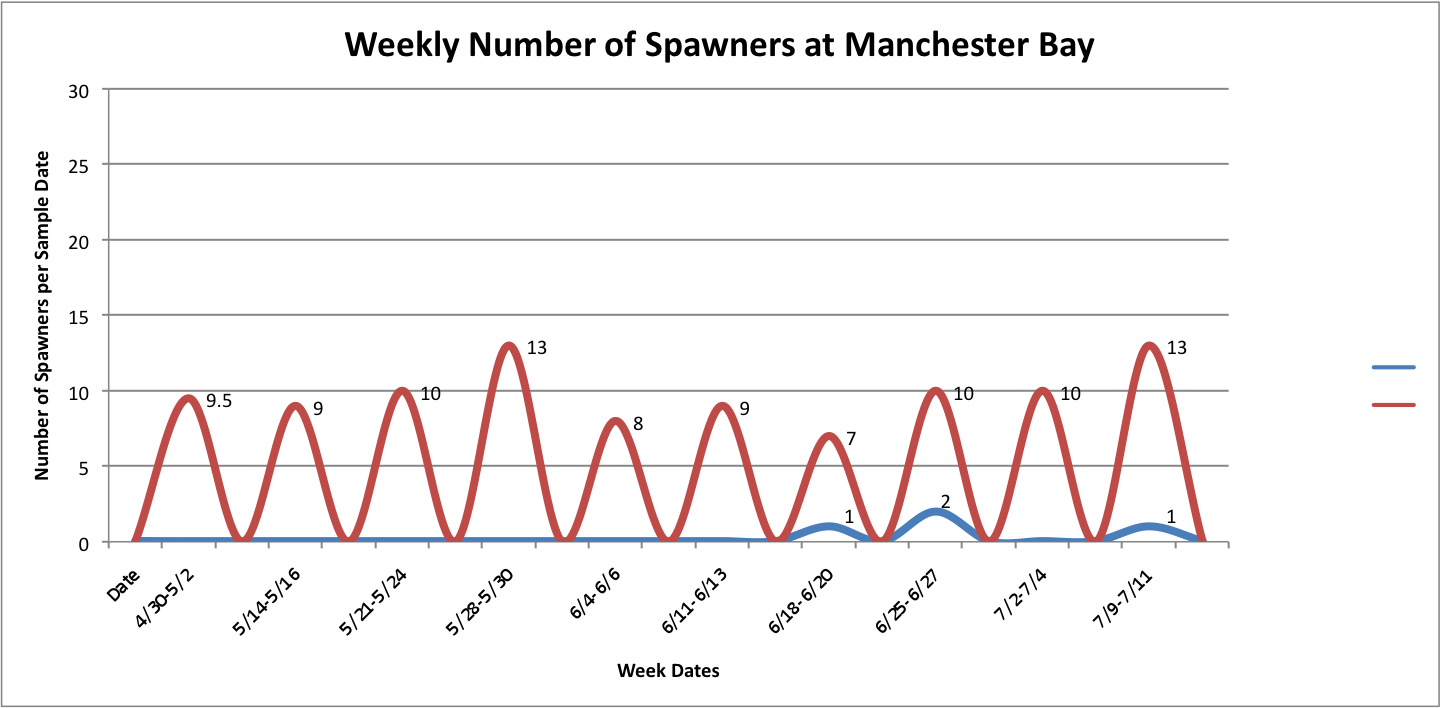
Link to data:
UpandDownGraphofNumSpawnersperdaypersite... 44KB Jul 16 2014 04:02:10 PM
The graph for Oyster Bay with the addition of the Temperature averages for the sample dates, it looks like the temperature and number of brooders could be correlated, but hard to tell just from what I've done whether anything is really significant.
Also today, I got to count oyster larva! So, I got a little break from the computer work. Both fun, just different kinds of fun. The counts are in the table below.
| Well # |
Count 1 |
Count 2 |
Count 3 |
Average |
| 1 |
333 |
337 |
322 |
330.67 |
| 2 |
255 |
247 |
249 |
250.33 |
| 3 |
228 |
224 |
229 |
227 |
Friday July 11, 2014
Today I tried fixing some of the graphs that I made earlier this week. I had to adjust the axes to be the same so that the values on the graphs could be better compared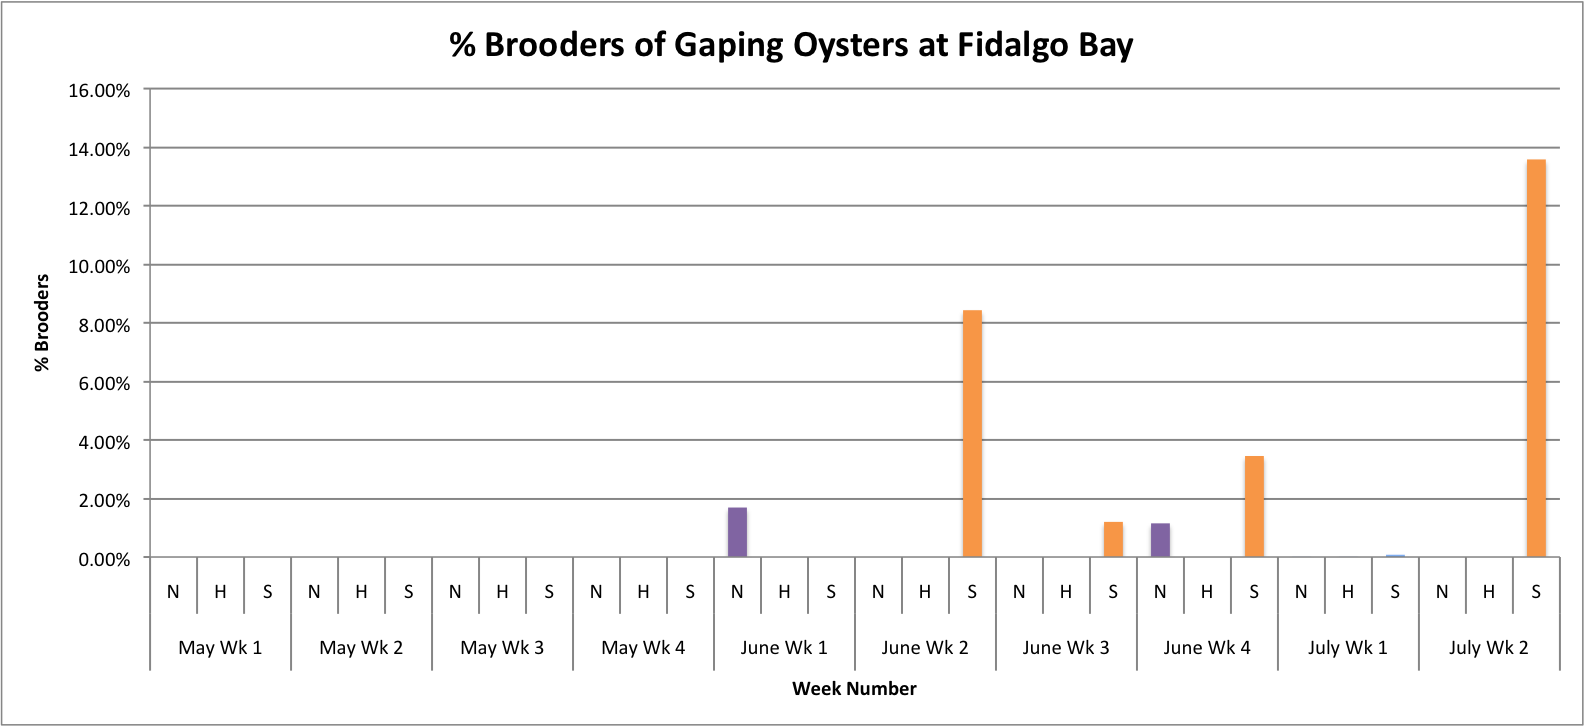
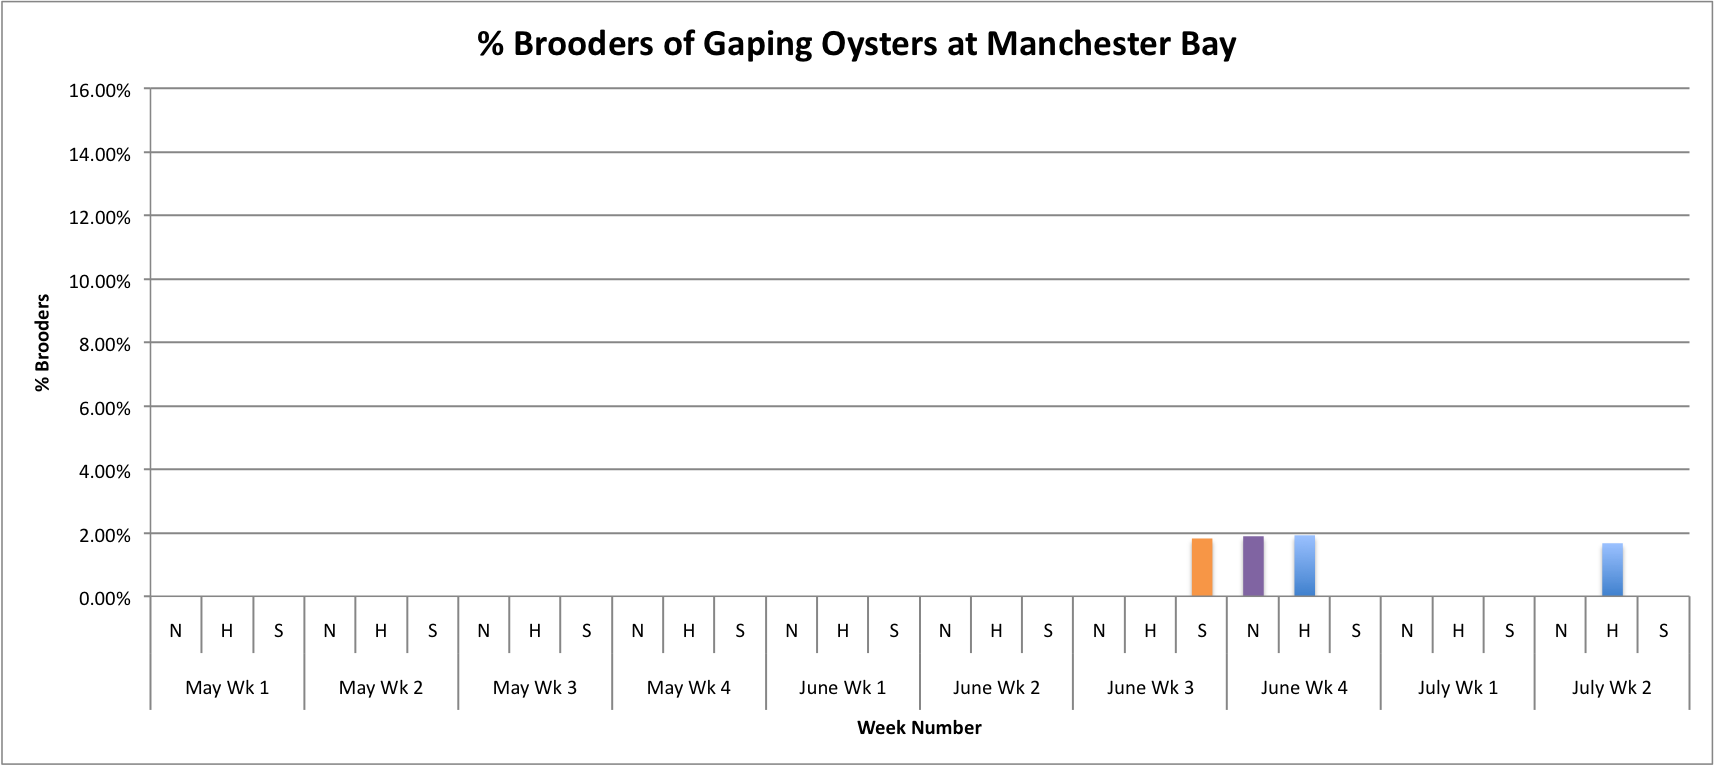
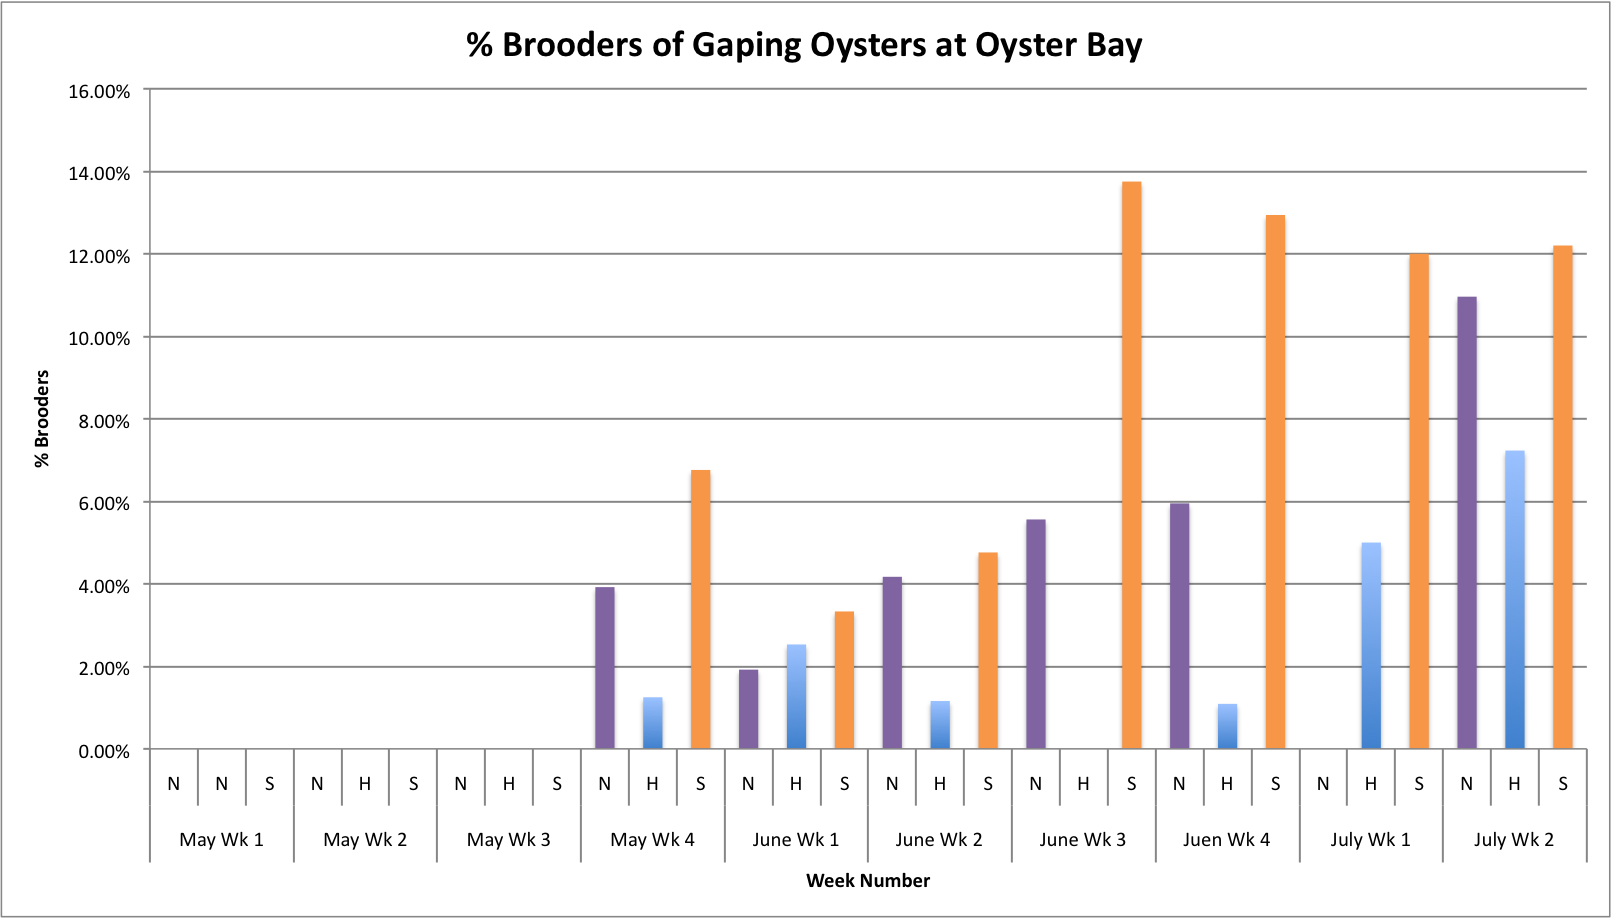
(Link to data:
BroodersovertimeSEPARATESITES.xls 49KB Jul 14 2014 11:58:47 AM
I also tried making a few more graphs showing the relationship between the number of brooders per population across all sites
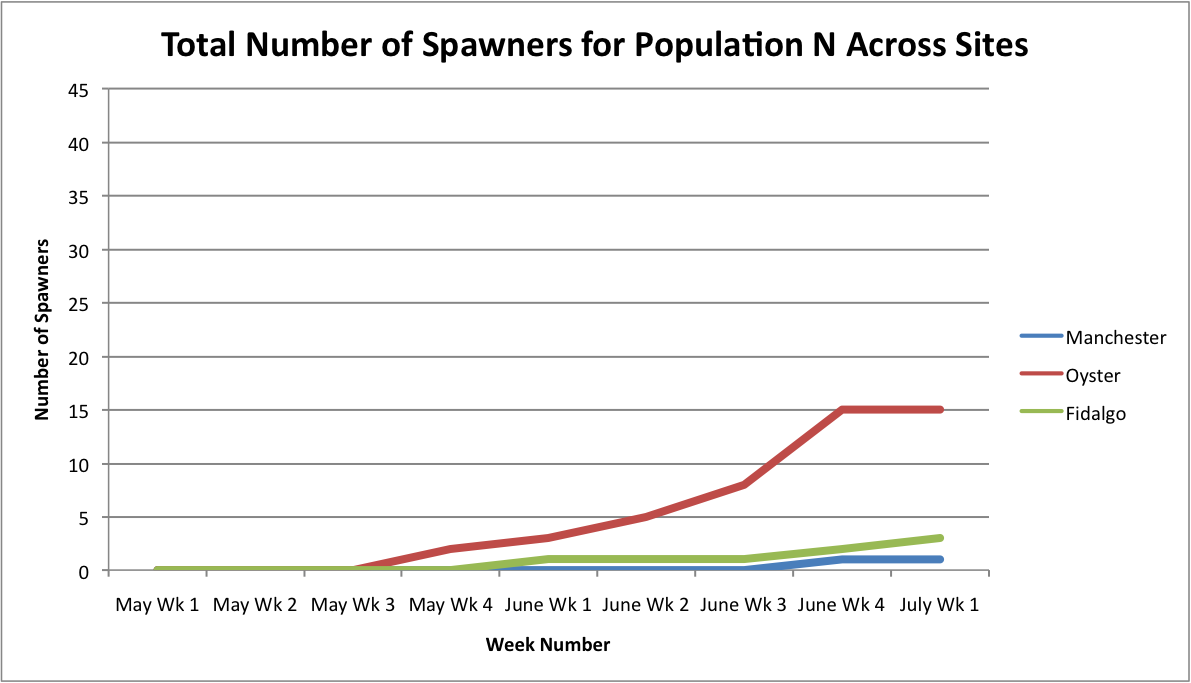
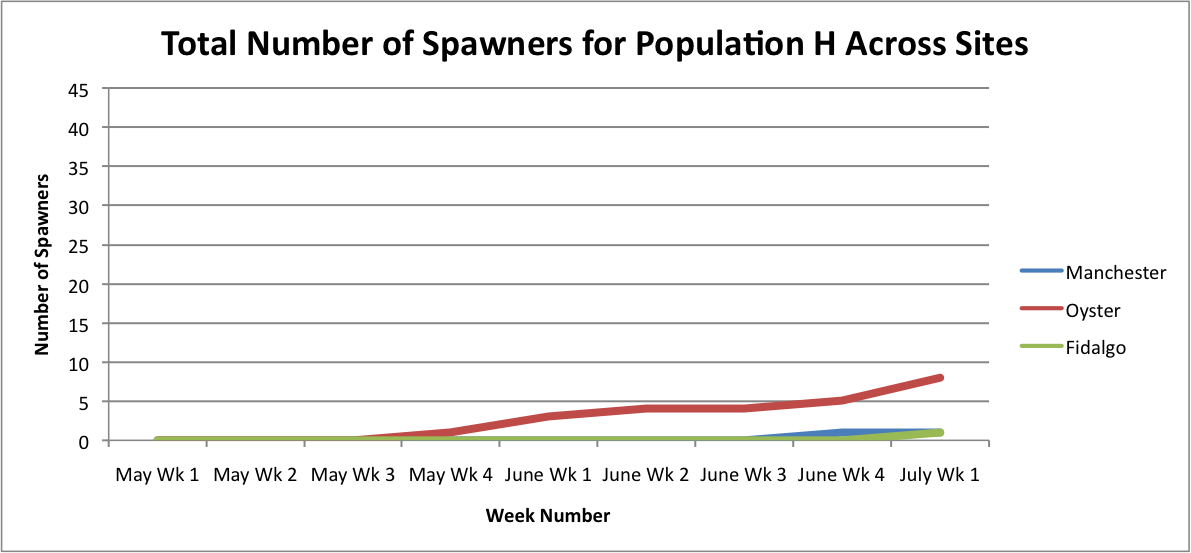
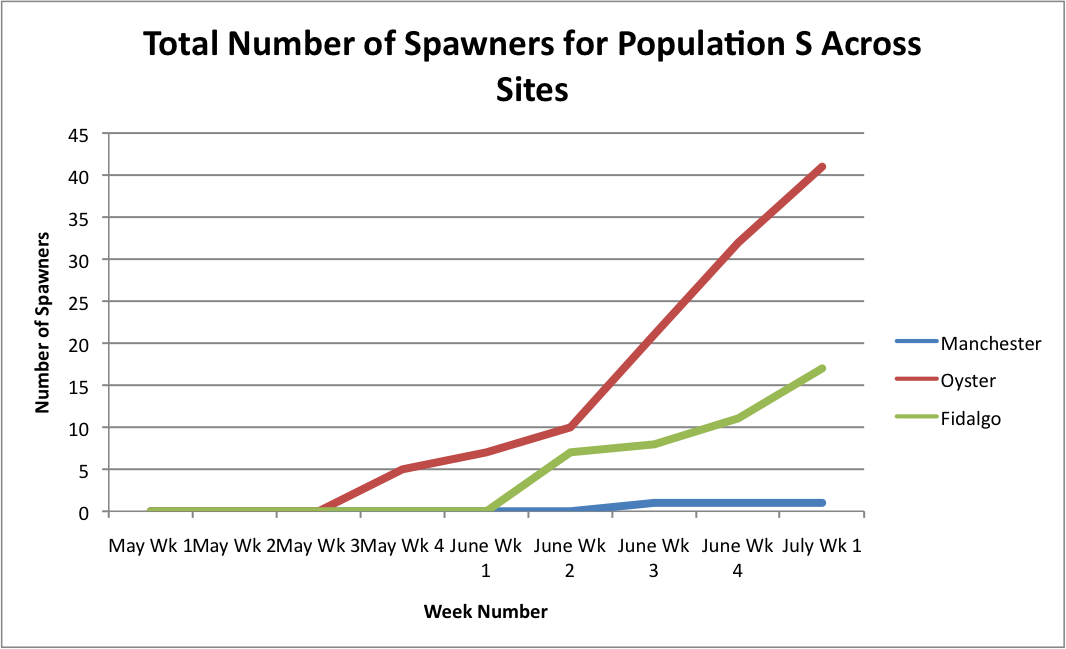
From these graphs, it looks like the Oyster Bay site is doing pretty well.
Link to excel data sheet: SeparatePopulationSpawnersAcrossSites.xlsx 45KB Jul 11 2014 11:15:52 AM
July 9, 2014
Today I worked on trying to figure out a way to combine the previous three visuals into one. My attempt follows:
I feel like there should be a way for me to make all the points connect into a smoothed-out line, but as of yet, I have not been able to figure it out.
(Link to data: TotalNumSpawnersOverTimeAllPopsinOneGrap... 43KB Jul 14 2014 11:31:48 AM)
July 8, 2014
Today I worked on demonstrating the relationship between the percentage of brooders of gaping oysters per population per site over time.
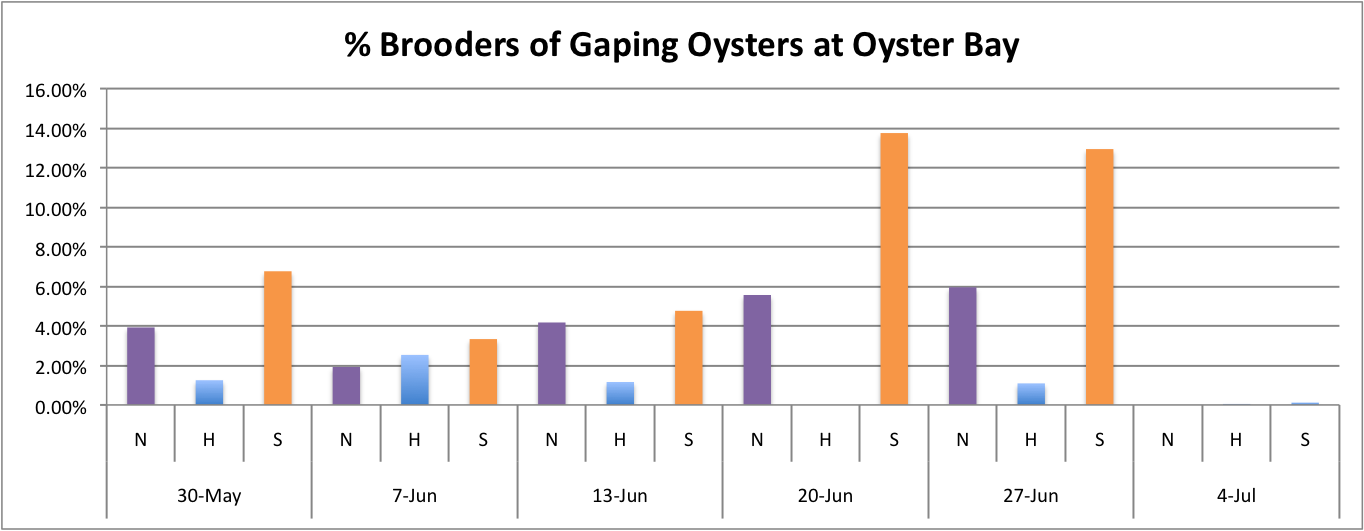
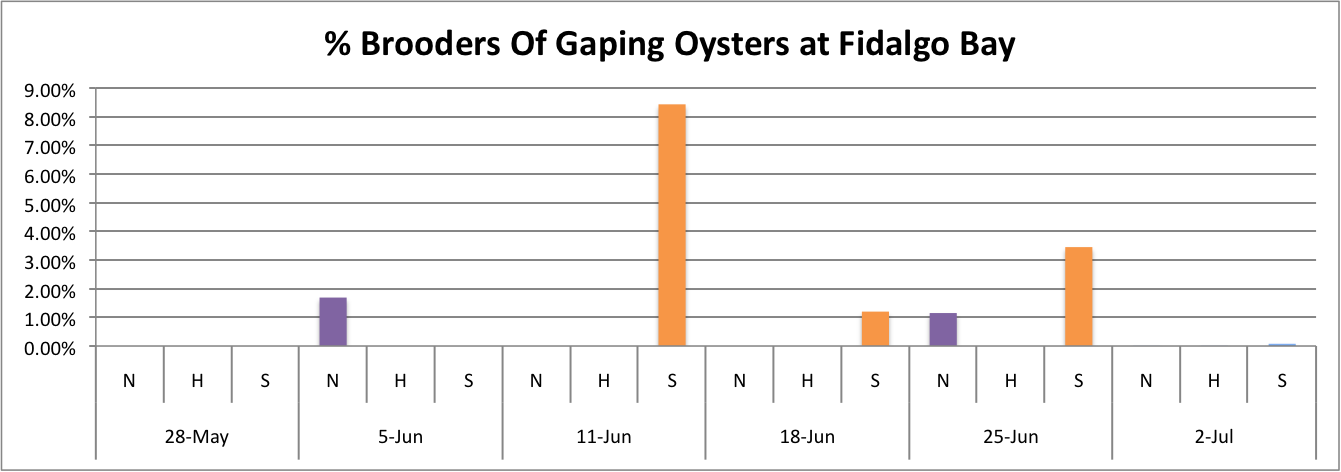
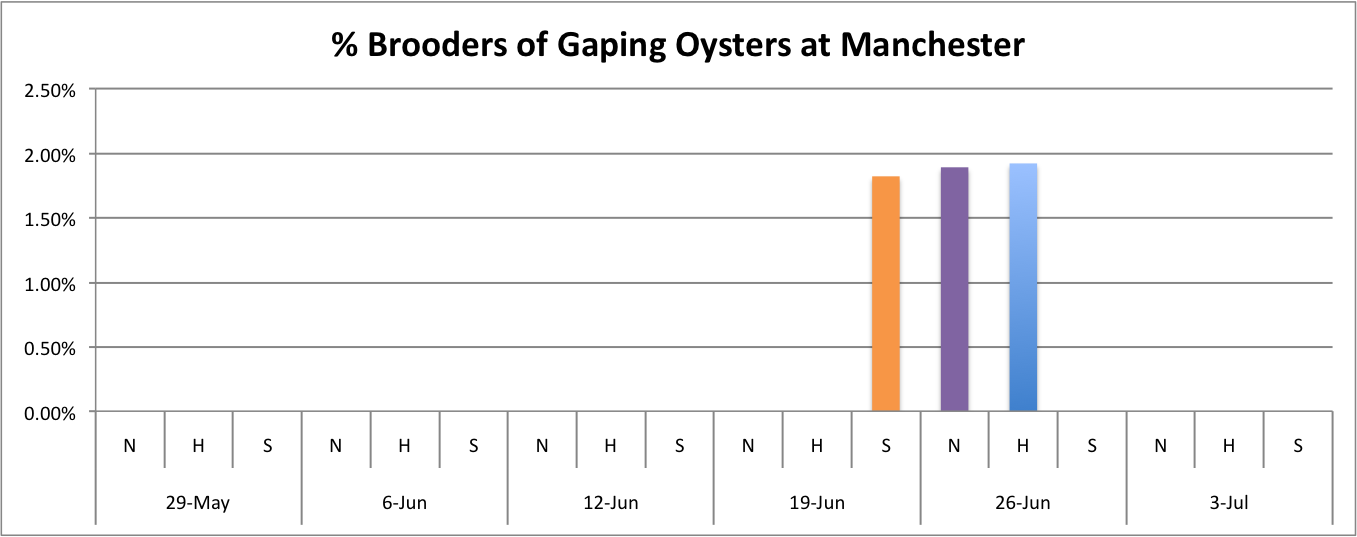
These graphs all seem to show that in general, the Southern population is doing a pretty good job at successful brooding compared to the N and H populations. Especially in Oyster Bay. (Link to data:
BroodersovertimeSEPARATESITES.xlsx 46KB Jul 08 2014 04:43:26 PM
I also looked at showing the total number of brooders per population over time. I separated the graphs into the separate sites and just added the spawners up to create an increasing trend as more brooders appeared. I didn't separate the brooders into the separate populations. Instead these graphs just demonstrate a running total of spawners per site.
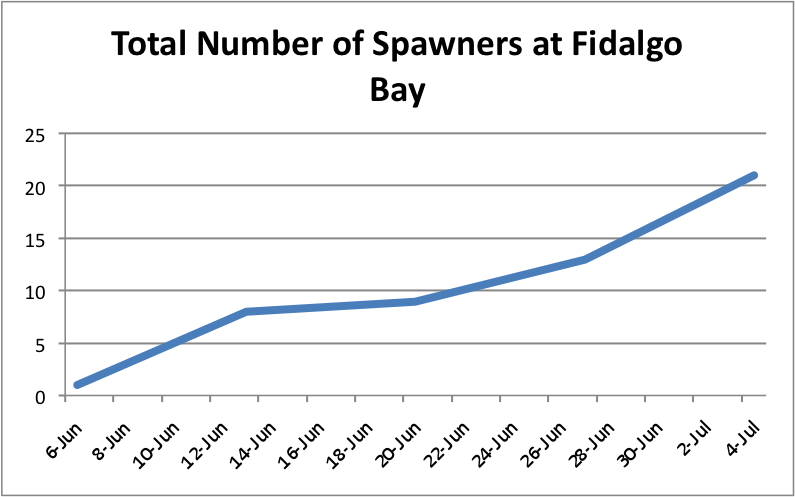
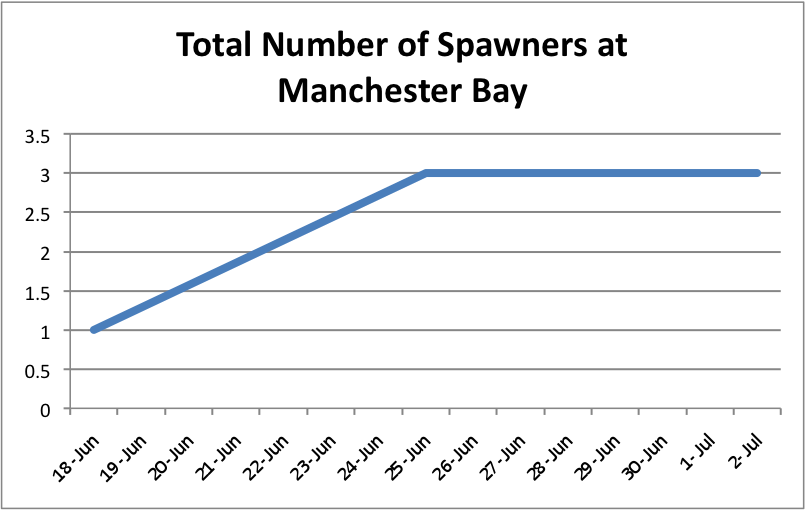
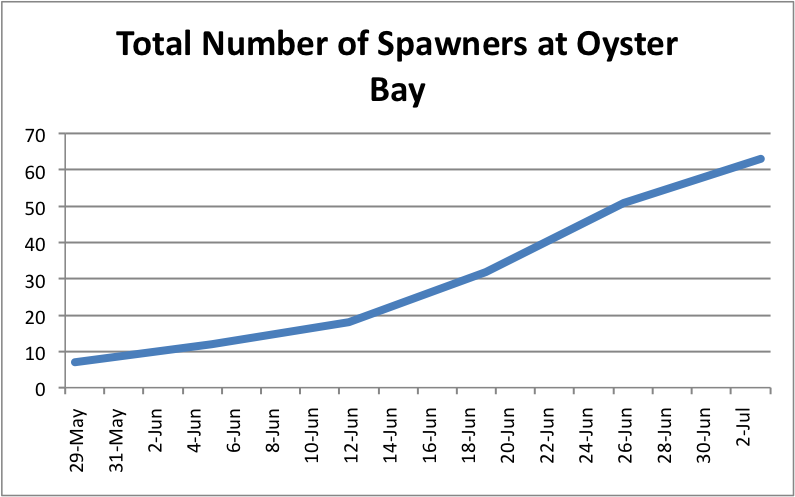
The oysters at Oyster Bay seem to be doing pretty well with spawning compared to the other two sites. ( Link to data:
TotalNumberSpawnersSEPARATESITES-3.xlsx 44KB Jul 15 2014 03:52:12 PM