Oncorhynchus mykiss creatine kinase sequence
LOCUS       NM_001124715            1312 bp    mRNA    linear   VRT 22-OCT-2008
DEFINITION  Oncorhynchus mykiss creatine kinase (ckb), mRNA.
ACCESSION   NM_001124715
VERSION     NM_001124715.1  GI:185132568
KEYWORDS    .
SOURCE      Oncorhynchus mykiss (rainbow trout)
  ORGANISM  [[http://www.ncbi.nlm.nih.gov/Taxonomy/Browser/wwwtax.cgi?id=8022|Oncorhynchus mykiss]]
            Eukaryota; Metazoa; Chordata; Craniata; Vertebrata; Euteleostomi;
            Actinopterygii; Neopterygii; Teleostei; Euteleostei;
            Protacanthopterygii; Salmoniformes; Salmonidae; Salmoninae;
            Oncorhynchus.
REFERENCE   1  (bases 1 to 1312)
  AUTHORS   Garber,A.T., Winkfein,R.J. and Dixon,G.H.
  TITLE     A novel creatine kinase cDNA whose transcript shows enhanced
            testicular expression
  JOURNAL   Biochim. Biophys. Acta 1087 (2), 256-258 (1990)
   PUBMED   [[http://www.ncbi.nlm.nih.gov/sites/entrez?cmd=Retrieve&db=pubmed&list_uids=2223887|2223887]]
[[#comment_185132568]]COMMENT     PROVISIONAL [[http://www.ncbi.nlm.nih.gov/RefSeq/|REFSEQ]]: This record has not yet been subject to final
            NCBI review. The reference sequence was derived from [[http://www.ncbi.nlm.nih.gov/entrez/viewer.fcgi?val=64315|X53859.1]].
[[#feature_185132568]]FEATURES             Location/Qualifiers
     source          1..1312
                     /organism="Oncorhynchus mykiss"
                     /mol_type="mRNA"
                     /db_xref="taxon:[[http://www.ncbi.nlm.nih.gov/Taxonomy/Browser/wwwtax.cgi?id=8022|8022]]"
     [[http://www.ncbi.nlm.nih.gov/entrez/viewer.fcgi?val=185132568&from=1&to=1312&view=gbwithparts|gene]]            1..1312
                     /gene="ckb"
                     /gene_synonym="tck1"
                     /note="creatine kinase"
                     /db_xref="GeneID:[[http://www.ncbi.nlm.nih.gov/entrez/query.fcgi?db=gene&cmd=Retrieve&dopt=full_report&list_uids=100136767|100136767]]"
     [[http://www.ncbi.nlm.nih.gov/entrez/viewer.fcgi?val=185132568&from=31&to=1182&view=gbwithparts|CDS]]             31..1182
                     /gene="ckb"
                     /gene_synonym="tck1"
                     /EC_number="[[http://www.expasy.org/cgi-bin/nicezyme.pl?2.7.3.2|2.7.3.2]]"
                     /codon_start=1
                     /product="creatine kinase"
                     /protein_id="[[http://www.ncbi.nlm.nih.gov/entrez/viewer.fcgi?val=NP_001118187.1|NP_001118187.1]]"
                     /db_xref="GI:185132569"
                     /db_xref="GeneID:[[http://www.ncbi.nlm.nih.gov/entrez/query.fcgi?db=gene&cmd=Retrieve&dopt=full_report&list_uids=100136767|100136767]]"
                     /translation="MEKINDKMAKLTIKRLSPEEEFPDLSQHNNHMAKVLTQDMYTKL
                     RDRATPNGFTIDGVIQTGIDNPGHPFIMTVGCVAGDEETYEVFKELLDPIIEDRHGGY
                     KPTDKHKTDLNPDNLKGGDDLDPNYVISSRVRTGRSIRGFCLPPHCSRGERRGVEKMS
                     VEALDSLSGDLKGKYYALKNMTDAEQQQLIDDHFLFDKPVSPLLLASGMARDWPDGRG
                     IWHNDTKTFLVWVNEEDHLRVISMQKGGNMKEVFNRFCTGLTKIETLFKDKGTSFMWN
                     EHLGYVLTCPSNLGTGLRAGVHVKIPNISKHAKFEEVLKRLRLQKRGTGGVDTAAVGG
                     TFDISNADRLGFSEVELVQMVVDGVKLLVEMEKKLEKGQSIDDLMPAQK"
     [[http://www.ncbi.nlm.nih.gov/entrez/viewer.fcgi?val=185132568&from=1238&to=1243&view=gbwithparts|polyA_signal]]    1238..1243
                     /gene="ckb"
                     /gene_synonym="tck1"
     [[http://www.ncbi.nlm.nih.gov/entrez/viewer.fcgi?val=185132568&from=1293&to=1298&view=gbwithparts|polyA_signal]]    1293..1298
                     /gene="ckb"
                     /gene_synonym="tck1"
     [[http://www.ncbi.nlm.nih.gov/entrez/viewer.fcgi?val=185132568&itemID=4&view=gbwithparts|polyA_site]]      1312
                     /gene="ckb"
                     /gene_synonym="tck1"
ORIGIN
[[#sequence_185132568]]        1 gactgcctcc acctaagaac agccacaacc atggagaaaa tcaatgataa aatggctaaa
       61 ctgaccatca agaggctgtc acccgaggag gagttccctg acctaagcca gcacaacaac
      121 cacatggcca aggtcttaac ccaggacatg tacaccaaac tccgagaccg tgccaccccc
      181 aacggcttca ccatagatgg tgtcattcag acggggattg ataatcctgg ccatcccttc
      241 atcatgactg tgggatgtgt ggctggagat gaggagacgt acgaggtctt caaggagctg
      301 ctggatccca tcattgagga cagacatgga ggatacaagc ctacagacaa gcacaagact
      361 gacctcaacc cagacaacct gaagggtgga gatgacctgg accccaacta tgtcattagc
      421 tcccgtgtcc gaacaggcag gagcatccgt gggttctgcc tgcccccaca ctgcagccgt
      481 ggagagcgaa ggggtgttga gaaaatgtca gtcgaagctc tggactccct gtctggtgac
      541 ctgaagggga agtactatgc cctgaagaac atgacagatg ctgagcagca gcagctaatt
      601 gatgaccact ttctgtttga caagcctgtg tctcctctgc tgctggcctc tggcatggcc
      661 cgggactggc ctgatggcag gggtatctgg cacaatgata ccaagacctt tctggtctgg
      721 gtcaatgagg aggaccacct gcgtgtcatc tccatgcaga agggtggcaa catgaaggag
      781 gtgttcaacc gtttctgcac tggcctcaca aagattgaaa ccctgtttaa agataagggc
      841 acttcattca tgtggaatga gcacttgggc tacgttctca cctgcccatc caacctgggc
      901 acagggctac gtgctggagt ccacgtcaag atccccaaca ttagcaagca tgccaaattt
      961 gaggaagtgc tcaagaggct aaggctccag aaacgtggaa ccggtggggt ggacaccgca
     1021 gctgtgggtg gcaccttcga catctccaac gcagaccgcc tgggcttctc tgaggtggag
     1081 ctggtgcaaa tggttgtgga cggtgtcaag ctgctggttg agatggagaa gaagctggag
     1141 aagggacagt ctattgatga cctcatgcct gcccagaagt gacactcttg attgcctccc
     1201 ccttgtcatc tgaatgacat cctggaatgc actctgtaat aaacagcact tactctctta
     1261 caagacactc tcattgaaag aggacatctg aaaataaaaa ctgtttcttc cg
<span class="Apple-style-span" style="font-family: Times; font-size: 16px; line-height: normal; white-space: normal;">[[code format="genbank"]]
LOCUS       X53859                  1312 bp    mRNA    linear   VRT 18-APR-2005
DEFINITION  Trout mRNA for creatine kinase.
ACCESSION   X53859
VERSION     X53859.1  GI:64314
KEYWORDS    creatine kinase.
SOURCE      Oncorhynchus mykiss (rainbow trout)
  ORGANISM  [[http://www.ncbi.nlm.nih.gov/Taxonomy/Browser/wwwtax.cgi?id=8022|Oncorhynchus mykiss]]
            Eukaryota; Metazoa; Chordata; Craniata; Vertebrata; Euteleostomi;
            Actinopterygii; Neopterygii; Teleostei; Euteleostei;
            Protacanthopterygii; Salmoniformes; Salmonidae; Salmoninae;
            Oncorhynchus.
REFERENCE   1  (bases 1 to 1312)
  AUTHORS   Garber,A.T., Winkfein,R.J. and Dixon,G.H.
  TITLE     A novel creatine kinase cDNA whose transcript shows enhanced
            testicular expression
  JOURNAL   Biochim. Biophys. Acta 1087 (2), 256-258 (1990)
   PUBMED   [[http://www.ncbi.nlm.nih.gov/sites/entrez?cmd=Retrieve&db=pubmed&list_uids=2223887|2223887]]
REFERENCE   2  (bases 1 to 1312)
  AUTHORS   Garber,A.T.
  TITLE     Direct Submission
  JOURNAL   Submitted (09-JUL-1990) A.T. Garber, UNIVERSITY OF CALGARY, MEDICAL
            BIOCHEMISTRY, 3330 HOSPITAL FRIVE N.W., CALGARY T2N 4N1, CANADA
[[#comment_64314]][[#feature_64314]]FEATURES             Location/Qualifiers
     source          1..1312
                     /organism="Oncorhynchus mykiss"
                     /mol_type="mRNA"
                     /db_xref="taxon:[[http://www.ncbi.nlm.nih.gov/Taxonomy/Browser/wwwtax.cgi?id=8022|8022]]"
                     /sex="male"
                     /tissue_type="testis"
                     /dev_stage="adult"
     [[http://www.ncbi.nlm.nih.gov/entrez/viewer.fcgi?val=64314&from=1&to=1312&view=gbwithparts|mRNA]]            1..1312
                     /experiment="experimental evidence, no additional details
                     recorded"
     [[http://www.ncbi.nlm.nih.gov/entrez/viewer.fcgi?val=64314&from=1&to=30&view=gbwithparts|5'UTR]]           1..30
     [[http://www.ncbi.nlm.nih.gov/entrez/viewer.fcgi?val=64314&from=31&to=1182&view=gbwithparts|CDS]]             31..1182
                     /EC_number="[[http://www.expasy.org/cgi-bin/nicezyme.pl?2.7.3.2|2.7.3.2]]"
                     /codon_start=1
                     /product="creatine kinase"
                     /protein_id="[[http://www.ncbi.nlm.nih.gov/entrez/viewer.fcgi?val=CAA37852.1|CAA37852.1]]"
                     /db_xref="GI:64315"
                     /db_xref="GOA:P24722"
                     /db_xref="InterPro:[[http://www.ebi.ac.uk/interpro/ISearch?mode=ipr&query=IPR000749|IPR000749]]"
                     /db_xref="UniProtKB/Swiss-Prot:[[http://www.uniprot.org/entry/P24722|P24722]]"
                     /translation="MEKINDKMAKLTIKRLSPEEEFPDLSQHNNHMAKVLTQDMYTKL
                     RDRATPNGFTIDGVIQTGIDNPGHPFIMTVGCVAGDEETYEVFKELLDPIIEDRHGGY
                     KPTDKHKTDLNPDNLKGGDDLDPNYVISSRVRTGRSIRGFCLPPHCSRGERRGVEKMS
                     VEALDSLSGDLKGKYYALKNMTDAEQQQLIDDHFLFDKPVSPLLLASGMARDWPDGRG
                     IWHNDTKTFLVWVNEEDHLRVISMQKGGNMKEVFNRFCTGLTKIETLFKDKGTSFMWN
                     EHLGYVLTCPSNLGTGLRAGVHVKIPNISKHAKFEEVLKRLRLQKRGTGGVDTAAVGG
                     TFDISNADRLGFSEVELVQMVVDGVKLLVEMEKKLEKGQSIDDLMPAQK"
     [[http://www.ncbi.nlm.nih.gov/entrez/viewer.fcgi?val=64314&from=1183&to=1312&view=gbwithparts|3'UTR]]           1183..1312
     [[http://www.ncbi.nlm.nih.gov/entrez/viewer.fcgi?val=64314&from=1238&to=1243&view=gbwithparts|polyA_signal]]    1238..1243
     [[http://www.ncbi.nlm.nih.gov/entrez/viewer.fcgi?val=64314&from=1293&to=1298&view=gbwithparts|polyA_signal]]    1293..1298
     [[http://www.ncbi.nlm.nih.gov/entrez/viewer.fcgi?val=64314&itemID=7&view=gbwithparts|polyA_site]]      1312
ORIGIN
[[#sequence_64314]]        1 gactgcctcc acctaagaac agccacaacc atggagaaaa tcaatgataa aatggctaaa
       61 ctgaccatca agaggctgtc acccgaggag gagttccctg acctaagcca gcacaacaac
      121 cacatggcca aggtcttaac ccaggacatg tacaccaaac tccgagaccg tgccaccccc
      181 aacggcttca ccatagatgg tgtcattcag acggggattg ataatcctgg ccatcccttc
      241 atcatgactg tgggatgtgt ggctggagat gaggagacgt acgaggtctt caaggagctg
      301 ctggatccca tcattgagga cagacatgga ggatacaagc ctacagacaa gcacaagact
      361 gacctcaacc cagacaacct gaagggtgga gatgacctgg accccaacta tgtcattagc
      421 tcccgtgtcc gaacaggcag gagcatccgt gggttctgcc tgcccccaca ctgcagccgt
      481 ggagagcgaa ggggtgttga gaaaatgtca gtcgaagctc tggactccct gtctggtgac
      541 ctgaagggga agtactatgc cctgaagaac atgacagatg ctgagcagca gcagctaatt
      601 gatgaccact ttctgtttga caagcctgtg tctcctctgc tgctggcctc tggcatggcc
      661 cgggactggc ctgatggcag gggtatctgg cacaatgata ccaagacctt tctggtctgg
      721 gtcaatgagg aggaccacct gcgtgtcatc tccatgcaga agggtggcaa catgaaggag
      781 gtgttcaacc gtttctgcac tggcctcaca aagattgaaa ccctgtttaa agataagggc
      841 acttcattca tgtggaatga gcacttgggc tacgttctca cctgcccatc caacctgggc
      901 acagggctac gtgctggagt ccacgtcaag atccccaaca ttagcaagca tgccaaattt
      961 gaggaagtgc tcaagaggct aaggctccag aaacgtggaa ccggtggggt ggacaccgca
     1021 gctgtgggtg gcaccttcga catctccaac gcagaccgcc tgggcttctc tgaggtggag
     1081 ctggtgcaaa tggttgtgga cggtgtcaag ctgctggttg agatggagaa gaagctggag
     1141 aagggacagt ctattgatga cctcatgcct gcccagaagt gacactcttg attgcctccc
     1201 ccttgtcatc tgaatgacat cctggaatgc actctgtaat aaacagcact tactctctta
     1261 caagacactc tcattgaaag aggacatctg aaaataaaaa ctgtttcttc cg
//
Lab 1 NotesList of Supplies and Equipment
- razor blades
- pipettes (range from 1-1000uL)
- sterile filter tips
- weighboats
- scale (mg)
- mortar/pestles
- fine forceps (sterile)
- Tri-Reagent
- ice buckets
- microcentrifuge (refrigerated) or in fridge
- Sterile (RNase free) 1.5 ml microcentrifuge tubes
- gloves
- paper towels
- liquid waste container for phenol/chloroform
- solid waste container for phenol/chloroform
- pastuer pipets (1ml, 2ml)
- pastuer pipet controllers (bulb)
- lab pens
- Kim wipes
- spectrophotometer
- cuvettes
- CelLytic MT Cell Lysis Reagent
- Protease Inhibitor Cocktail
- Coomassie Protein Assay Reagent
- Water bath or heating block
- lab tape
- biohazardous waste bags (autoclavable)
- 500mL beakers (for used pipette tips)
---- - safety glasses
- dry ice
- serological pipets (1ml, 2ml) / controllers
- 50ml Falcon tubes / holders
- timers
RNA ISOLATION PROTOCOL
1. Turn on heating block to 55C. Also turn on spectrophotometer.
2. Add 500uL of TriReagent to a 1.5mL snap cap tube. Store on ice.
3. Using a clean razor blade, cut a piece of frozen tissue weighing between 50-100mg and add to tube containing TriReagent.
4. Carefully homogenize the tissue using a disposable pestle.
5. Add an additional 500uL of TriReagent to the tube and close the tube.
6. Vortex vigorously for 15s.
Measured 2 samples: (1) 95mg, (2) 51mg
* spilled sample (2) during homogenization - some sample lost
PROTEIN EXTRACTION PROTOCOL
1. Add 0.5mL of CelLytic MT solution to a 1.5mL snap cap tube.
2. Add 25mg of your tissue to the tube.
3. Homogenize the tissue with a disposable pestle.
4. Close the tube and invert the tube several times.
5. Spin the tube in a refrigerated microfuge for 10mins. @ max speed.
6. While spinning, label a fresh tube with the word "Protein", source organism/tissue, your initials, and today's date.
7. Carefully transfer supernatant to labeled tube and store tube on ice.
8. To a fresh tube, add 1.5mL of Bradford reagent.
9. To this same tube, add 30uL of your protein extract.
10. Invert the tube several times and then incubate at RT for 10mins.
11. Mix the tube several times and transfer 1mL to a plastic, disposable cuvette.
12. Measure the absorbance at 595nm and record the value.
13. Remove the cuvette from the spectrophotometer. Using a P1000 set to 1mL, carefully pipette the solution in the cuvette up and down a couple of times to mix.
14. Measure the absorbance at 595nm and record the value.
15. Repeat steps 13 and 14.
16. Average the three absorbance values you recorded.
measured 2 samples (1) 31mg, (2) 36mg* sample (2) lost during centrifugation
ran 3 absorbance readings with sample (1): 1.538, 1.527, 1.525
ran coomassie blue - only: -0.039
Standard curve was generated as per Manufacturers Instructions. Please Read and Understand!
Pierce:Coomassie (Bradford) Protein Assay Kit
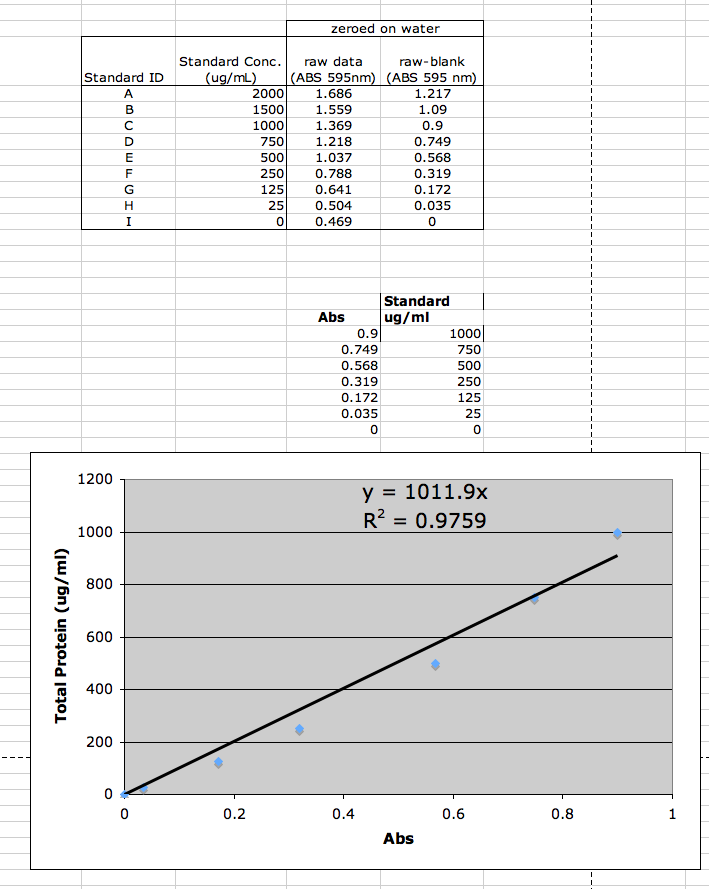 |
| Picture_1.png |
----- Stop here for Lab 1 and freeze sample at -80
1/15/09
1:5 dilution (20uL protein and 80uL DI) made for absorbance measurement within window of standards. 3 measurements made @ 595nm: 0.866, 0.873, 0.883. Average = 0.874
(blank = 1.5mL Bradford + 30mL DI)calculated protein conc.(y) = 1011.9 * 0.874 = 884.4 * 4 = 3537.6ug/mL
L2 - Tissue Extraction II
| PDF-Icon.jpg |
- re-spec dilution of protein sample
- Continue with RNA extraction protocol
- Run SDS-PAGE protein gel
- Order Primers
List of Supplies and Equipment:
- protein gel box (SR provided)
- SDS/PAGE gels
- trays for staining gels
- protein ladder marker
- digital camera
- power supply
- microfuge tube racks
- running buffer (SR provided)
- coomassie stain (SR)
- platform rocker/shaker
- plastic wrap
- sandwich bags
- gel loading tips
- pipettors (1ul-1000ul)
- sterile, 1.5mL screw cap tubes
- pipet tips (filter - RNAse free)
- RNase free water
- hot plate
- tube "floatie" (8 tube capacity)
- glass container for boiling water that can accommodate "floatie"
- 2X SDS reducing sample buffer (SR provided)
- heating block/water bath
- acetic acid
- chloroform
- isopropanol
- ethanol
- ice buckets
- phenol/chloroform waste containers (liquid/solid)
- cuvettes
- filter tips
- methanol
- safety glasses
- gloves
- timers
- 50 ml Falcon tubes / holders
- DEPC treated water (SR provided)----
- Normal light box (SR provided)
RNA ISOLATION PROTOCOL (see also Lab 1 Tissue Extraction I and Manufacturer Protocol)
1. Turn on heating block to 55C. Also turn on spectrophotometer.
2. Add 500uL of TriReagent to a 1.5mL snap cap tube. Store on ice.
3. Cut a piece of frozen tissue weighing between 50-100mg and add to tube containing TriReagent.
4. Carefully homogenize the tissue using a disposable pestle.
5. Add an additional 500uL of TriReagent to the tube and close the tube.
6. Vortex vigorously for 15s.
----- Stop here for Lab 1 and freeze sample at -80
Turn on heating block to 55C.
7. Incubate tube at room temperature (RT) for 5 mins.
8. In the fume hood, add 200uL of chloroform to your sample and close the tube. NOTE: Due to the high volatility of chloroform, pipetting needs to be done carefully and quickly. Have your tube open and close to the container of chloroform before drawing and chloroform into your pipette tip.
9. Vortex vigorously for 30s. You are vortexing correctly if the solution becomes a milky emulsion. (both solutions showing phase partitions prior to spinning - incorrect vortexing?)
10. Incubate tube at RT for 5 mins.
11. Spin tube in refrigerated microfuge for 15 mins. @ max speed.
12. Gently remove tube from microfuge. Be sure not to disturb the tube.
13. Slowly and carefully transfer most of the aqueous phase (the top, clear portion) to a fresh microfuge tube. Do NOT transfer ANY of the interphase (the white, cell debris between the aqueous and organic phase).
14. Close the tube containing the organic and interphase and properly dispose of the liquid inside the tube as well as the tube itself at the end of the lab.
15. Add 500uL isopropanol to the new tube containing your RNA and close the tube.
16. Mix by inverting the tube numerous times until the solution appears uniform. Pay particular attention to the appearance of the solution along the edge of the tube. If mixed properly, it should no longer appear viscous/"lumpy".
17. Incubate at RT for 10 mins.
18. Spin in refrigerated microfuge at max speed for 8 mins.
19. A small, white pellet (RNA and salts) should be present. If not, do not fret. Continue with procedure. (no pellet visible in sample 2)
20. Remove supernatant.
21. Add 1mL of 75% EtOH to pellet. Close tube and vortex briefly to dislodge pellet from the side of the tube. If the pellet does not become dislodged, that is OK.
22. Spin in refrigerated microfuge at 7500g for 5mins.
23. Carefully remove supernatant. Pellet may be very loose. Make sure not to remove pellet!
24. Briefly spin tube (~15s) to pool residual EtOH.
25. Using a small bore pipette tip (P20 or P200 tips), remove remaining EtOH.
26. Leave tube open and allow pellet to dry at RT for no more than 5mins.
27. Resuspend pellet in 100uL of 0.1%DEPC-H2O by pipetting up and down until pellet is dissolved. (used only 10uL in sample 2 due to no visible pellet)
28. Incubated tube at 55C for 5mins. to help solubilize RNA.
29. Remove tube from heat, flick a few times to mix and place sample on ice. This will be your stock RNA sample.
30. Quantitate RNA yield using spectrophotometer.
(absorbance reader not calibrated - stored samples at -80C)
RNA QUANTIFICATION
1. Obtain two disposable plastic cuvettes: one for a blank and another for your RNA sample.
2. Label both cuvettes at the very TOP of the cuvettes.
3. Add 1mL 0.1%DEPC-H2O to a fresh 1.5mL snap cap tube. This will be your blank.
4. To a fresh 1.5mL snap cap tube, add 990uL 0.1%DEPC-H2O and 10uL of your RNA sample. Mix well by inverting tube multiple times.
5. Transfer these two samples to their respective cuvettes.
6. Ensure wavelength of spectrophotometer is set to 260nm.
7. Insert blank cuvette as demonstrated and zero this sample.
8. Remove blank cuvette from spectrophotometer and insert your RNA sample cuvette.
9. Record the A260 value displayed.
10. Adjust the wavelength and record the values at 230nm and 280nm.
11. Calculate RNA concentration (conversion: 1 A260 unit = 40 ng/uL single-stranded RNA), total RNA yield, A260:A280, and A260:A230.
12. Clearly label your stock RNA sample with the word "RNA", source organism/tissue, your initials, today's date and the concentration in ug/uL.
13. Place tube in ice bucket at the front of the lab. Store your samples at -80C.
Background - SDS - Polyacrylamide Gel Electorophoresis (SDS-PAGE)
SDS-PAGE is the process of separating proteins from one another on the basis of molecular weight. A mixture of proteins is subjected to an electric field and pulled through a polyacrylamide matrix towards the cathode. However, proteins must be treated prior to separating them in this manner. This is because the charge on any given protein is dependent upon the amino acid sequence as well as the pH of the solution. Thus, a crude protein extract from cells or tissue contains a hetergenous mixture of proteins with varying charges. Without treating them in some manner, the proteins will migrate independent of their molecular weight. Additionally, proteins have various tertiary or quarternary structure that can influence the rate at which they migrate in an electric field. In order to address these issues, protein samples are prepared in a specific fashion to linearize the proteins and impart the same charge to all proteins in the sample to ensure that they become homogenous and their migration rate during SDS-PAGE is solely due to molecular weight.
Protein samples are combined with a reducing sample buffer. This reducing sample buffer contains sodium dodecyl sulfate (SDS), B-mercaptoethanol, glycerol, Bromophenol blue and a buffer. SDS imparts an overall negative charge to all the proteins in a sample. This ensures that all of the proteins will migrate in the same direction (towards the cathode) when placed in an electric field. B-mercaptoethanol is a reducing agent. It accepts electrons from disulfide bonds formed between two cysteine residues. It serves as one step to help break any tertiary or quartenary structure of proteins in the sample. Gycerol simply serves as a sinking agent for your sample. It has a greater density and will allow your sample to sink into the buffer contained in the wells of the gel. Bromophenol blue is a negatively charged dye that allows one to visually track the migration of your samples through the polyacrylamide gel. Bromophenol blue migrates at the same rate of proteins ~5-7kDa. Finally, the buffer is present to maintain the appropriate pH for your sample. Once samples have the appropriate amount of reducing sample buffer, they are boiled. Boiling causes the proteins to fully denature, eliminating any tertiary or quartenary structure and leads to linear chains of amino acids.
Samples are then run through polyacrylamide gels. Traditionally, a single polyacrylamide gel is actually comprised of two gels with different percentages of polyacrylamide, pH and buffer. The top portion of the gel, relative to the bottom portion of the gel, has a lower percentage of acrylamide, a lower pH and a lower concentration of buffer. This gel is referred to as the stacking gel. The bottom gel has higher mounts of all three components listed above and is called the running gel.
The low percentage of polyacrylamide in stacking gels allows all the proteins in the sample, regardless of molecular weight, to quickly and easiy migrate through the gel. When the samples begin to enter the lower gel containing a higher percentage of polyacrylamide (running gel), the proteins are now all "stacked" upon one another. This allows all of the proteins in a sample to enter the running gel at essentially the same time. Additionally, the differences in pH and buffer content between the stacking and running gels leads to a local increase in voltage around the sample, which helps drive the sample from solution in the well into the polyacrylamide matrix of the stacking gel.
After SDS-PAGE is complete (when the dye front has reached the bottom of the gel), the gel is either set up for Western blotting (see Lab #4) or is stained to reveal the proteins. There are a number of stains that can be used, depending on the sensitivity needed to visualize proteins of interest, but we will use Coomassie Brilliant Blue. This is a non-selective stain, meaning it binds all proteins regardless of their amino acid makeup. Additionally, it is cheap and rather sensitive. The dye will initially turn the entire gel blue and even a short exposure (5 minutes) often results in over staining. Thus, it is necessary to destain the gel to wash the dye out of the areas of the gel where no protein is present. After destaining, the proteins should appear as blue/purple bands and the rest of the gel should remain relatively clear.
PROTEIN GEL PROTOCOL - See also Manufacturers Protocol / Manual: Precise™ Protein Gels
1. Begin boiling water on hot plate.
2. Thaw you protein extract from last week. Mix well by inverting tube several times.
3. In a fresh, 1.5mL SCREW CAP tube add 15uL of your protein sample and 15uL of 2X Reducing Sample Buffer. (added 30uL protein and 30uL buffer)
4. Mix sample by flicking. Briefly centrifuge (10s) to pool liquid in bottom of tube.
5. Boil sample for 5 mins.
6. While sample is boiling, observe assembly of gel box and gels. Rinse gel wells thoroughly as demonstrated.
7. When sample is finished boiling, immediately centrifuge for 1min. to pool liquid.
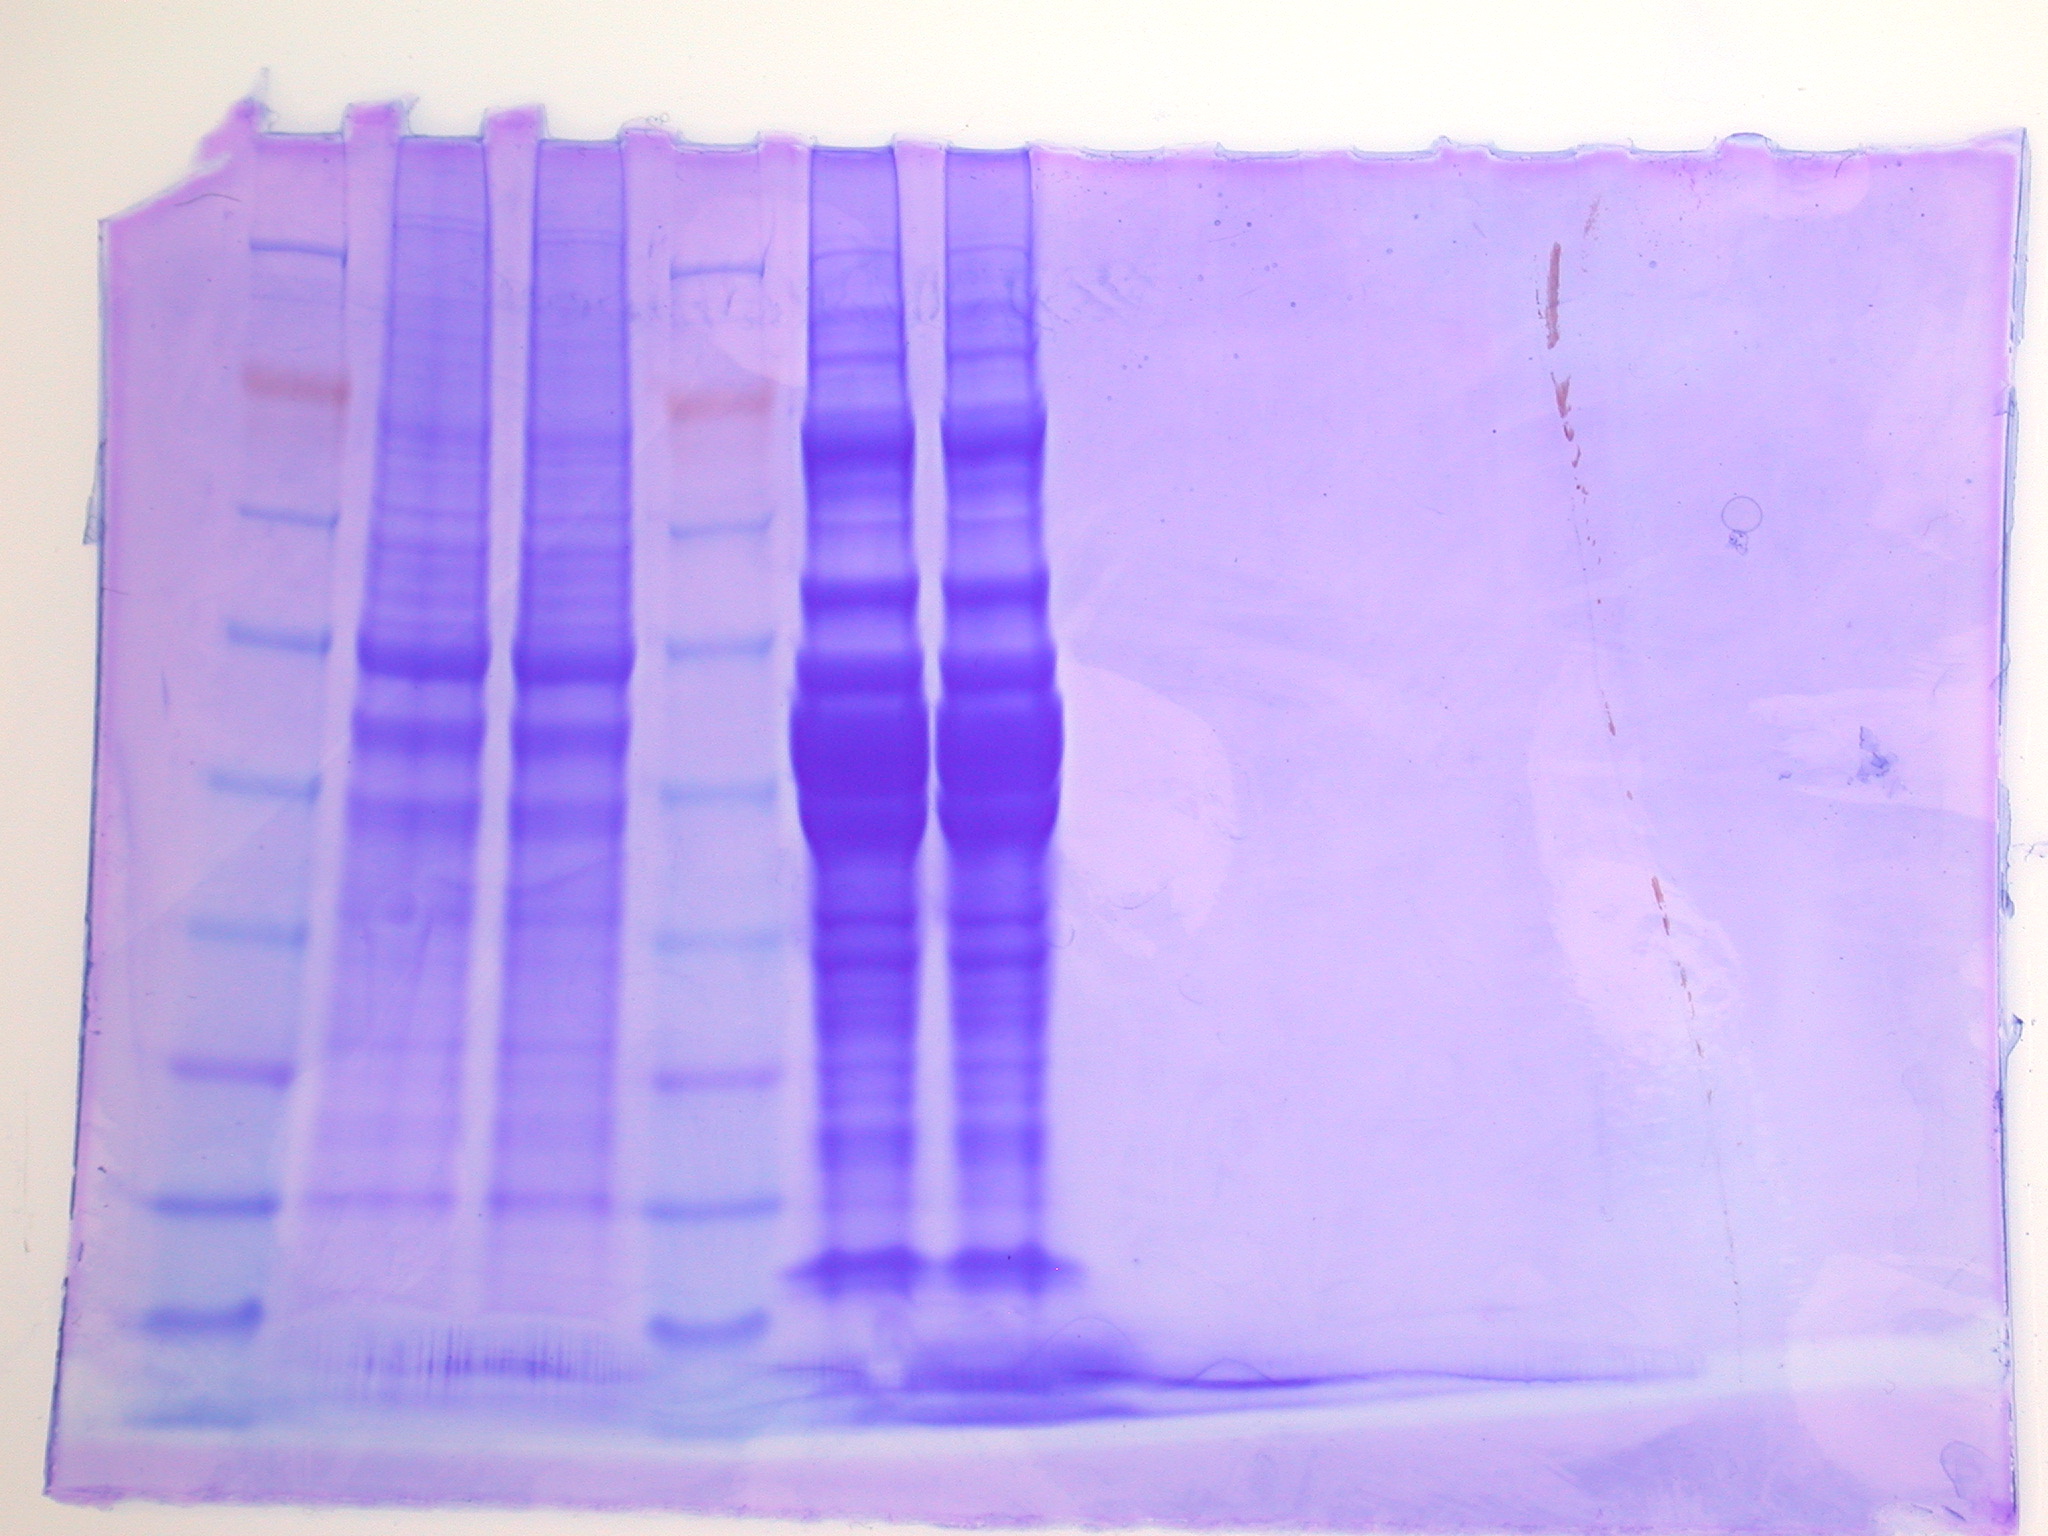
8. Slowly load your entire sample into the appropriate well using a gel loading tip. (sample loaded into lanes 5 and 6 of gel, ladders in lanes 1 and 4, Amy's protein in 2 and 3)
9. Put lid on gel box and plug electrodes into appropriate receptacles on the power supply.
10. Turn power supply on and set voltage to 150V. Run for 45mins.
11. Add ~150mL (does not have to be measured - just need enough to cover the gel) of Coomassie Stain to a designated container.
11. Turn off power supply and disconnect gel box from power supply.
12. Remove lid from gel box.
13. Disengage the tension wedge.
14. Remove gel from gel box.
15. Carefully crack open cassette to expose gel.
16. Trim wells at top of gel.
17. Notch a designated corner of the gel to help you remember the correct orientation of the gel (i.e. which is the top/bottom of the gel, which is the right/left side(s) of the gel)
18. Place gel into container with Coomassie Stain.
19. Incubate on shaker/rocker for 5 mins.
20. Carefully pour stain back into original container. Be careful not to dump out gel!
21. Rinse gel briefly with 10% acetic acid and pour this wash down the drain.
22. Add ~250mL (no need to measure) 10% acetic acid to container with gel. Incubate on shaker/rockers for 15mins. Change out buffer and repeat until bands become clearly visible. This may need to incubate O/N. If so, cover container with plastic wrap and leave on shaker/rocker.
SDS Gel (lanes 5 and 6)
1/21/09
Lab 3 Reverse Transcription and PCR
- Quantify RNA
- Reverse Transcribe RNA to complementary DNA
- Perform PCR
List of Supplies and Equipment:
- PCR tubes (0.5 ml; thin walled)
- 1.5 ml microfuge tubes (RNAse free)
- RNA samples (student provided)
- AMV RT
- Nuclease Free water
- filter tips
- thermal cycler
- kim wipes
- 2x Immomix Master Mix
- microfuge tube racks
- ice buckets
- dNTPs
- oligo dT
- 2x GoTaq Green Master Mix
- timers
- agarose
- Ethidium Bromide (SR Provided)
- gel box
- camera
- DNA ladder
RNA QUANTIFICATION
use nonopure water for blank
add 2uL to NanoDrop spectrophotometer
Sample absorbance readings (ng/mL)
1: 276.02: 324.5
For more information about interpreting your results see this technical note.
REVERSE TRANSCRIPTION PROTOCOL
1. Mix your stock RNA sample by inverting tube several times.
2. Transfer 25ug of your RNA (.25ug of mRNA) to a fresh PCR tube. Bring the volume up to 5uL with PCR water. If necessary, spin tube briefly to pool liquid.(5uL from each sample - no water added)
3. Incubate tube at 75C for 5mins in thermal cycler.
4. Transfer tube IMMEDIATELY to ice and incubate for at least 5mins.
5. Make Master Mix
PER RXN
4 ul 5x Buffer (AMV RT Buffer)
8 ul dNTPs (10 mM total)
1 ul AMV RTranscriptase
1 ul Oligo dT Primer
1 ul RNase free water
Total = 15 ul
(multiply reagent mixture by 3 - two samples plus blank DI)
- Add MM to tube with diluted RNA in it (total volume now 20 ul)
- Vortex
- Spot spin
- Incubate at RT for 10 min
- Incubate at 37C for 1 hr in thermocycler
- Heat inactivate @ 95C for 3 min
- Spot spin
- Leave on ice or store at –20C
Primer Sequences
Primer pair 1
| Sequence (5'->3') |
Strand on template |
Length |
Start |
Stop |
Tm |
GC% |
|
|---|---|---|---|---|---|---|---|
| Forward primer |
GGCAACATGAAGGAGGTGTT |
Plus |
20 |
766 |
785 |
59.97 |
50.00% |
| Reverse primer |
TCCTCAAATTTGGCATGCTT |
Minus |
20 |
965 |
946 |
60.59 |
40.00% |
| Product length |
200 |
||||||
PCR
Polymerase Chain Reaction involved amplifying a DNA (genomic or complementary) target using a polymerase, primers (short oligonucleotide), and dNTPs (A, C, T, Gs). In general the reaction is placed in a machine (thermocycler) where a series of temperature changes are performed [Denature (~94), Anneal (primer specific ~50-60), and Extention (~72)].
For this lab you will be using Promega's GoTaq Product. Please Read!
Run each template in duplicate AND make sure to include at least 2 negative controls for each primer (no template).
For a 50μl reaction volume:
| Component |
Volume |
Final Conc. |
| GoTaq®Green Master Mix, 2X |
25 |
1x |
| upstream primer, 10μM |
0.5–5.0μl |
0.1–1.0μM |
| downstream primer, 10μM |
0.5–5.0μl |
0.1–1.0μM |
| DNA template |
1–5μl |
<250ng |
add 1.0 uL * 9 each primer
(multiply component (except DNA template) volume by 9 - 2 for each sample, 2 for blanks, 2 PCR controls, 1 extra)
total volume: 432 uL
Add 2.0 uL DNA template to each reaction
Load reactions into thermocycler.
Make Agarose Gels
1) 2g agarose, 150uL tris buffer (TAE)2) heat to dissolve all agarose3 add 12uL ethidium bromide
Next Day:
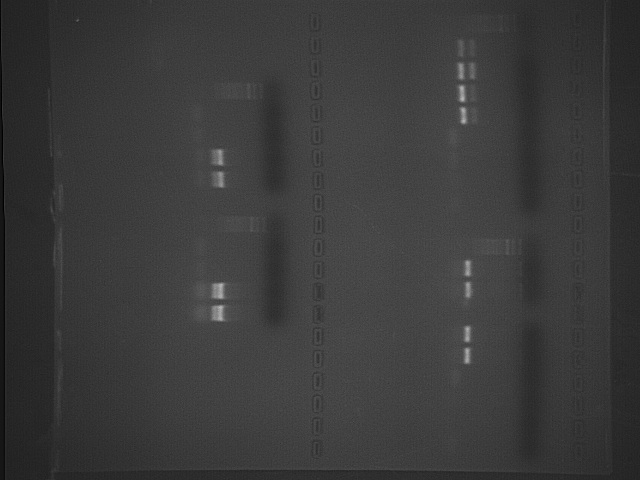
Run out PCR products on agarose gels and photograph.
gel alignment (start upper left corner) - gel aligned sideways (read from top right to left)
Ladder S1a S1b S2a S2b BLa BLb PCRa PCRb Ladder
1/28/09
Lab 4
Lab4 - Western Transfer - Immunoblots
- Run out protein samples as done previously
- Transfer proteins from gel to nitrocellulose membrane
- Probe membrane with antibody (HSP)
List of Supplies
- protein gel box (SR provided)
- SDS/PAGE gels
- trays for staining gels
- protein ladder marker
- digital camera
- power supply
- microfuge tube racks
- running buffer (SR provided)
- coomassie stain (SR)
- platform rocker/shaker
- plastic wrap
- sandwich bags
- gel loading tips
- pipettors (1ul-1000ul)
- sterile, 1.5mL screw cap tubes
- pipet tips (filter - RNAse free)
- hot plate
- tube "floatie" (8 tube capacity)
- glass container for boiling water that can accommodate "floatie"
- 2X SDS reducing sample buffer (SR provided)
- heating block/water bath
- acetic acid
- ethanol
- ice buckets
- filter tips
- methanol
- safety glasses
- gloves
- timers
- 50 ml Falcon tubes / holders
- DEPC treated water (SR provided)
- Normal light box (SR provided)
- Nitrocellulose membranes
- Filter paper (SR provided)
- small glass pipets
- Transfer Buffer (SR provided)
- HSP Antibody
- WesternBreeze Chromogenic Detection System
- forceps
Run Protein Gel [as in Lab 2]
(conc. of protein = 3537.6ug/mL x 15uL = 53.064ug)
Lane ID (back gel - two notches upper right corner)1.ladder 2.JFa 3. JFb 4.AYa 5.AYb 6.JTa 7.JTb 8.BobH17 9.BobH23
Principles of Western Blotting:
Protein Transfer:
After the protein components have been sufficiently separated by electrophoresis, they can be transferred to a nitrocellulose membrane. The transfer process uses the same principle as SDS-PAGE – this time the electric current is applied at 90 degrees to the gel and the proteins migrate out of the gel onto the membrane. The membrane used for our lab is a positively charged nitrocellulose membrane. Remember from the sample preparation for SDS-PAGE, we've treated the proteins with SDS to impart an overall negative charge to these molecules. During transfer, the proteins migrate through the electric field, out of the gel and onto the membrane. The negative charge of the proteins allows them to efficiently bind to the positively charged membrane. However, nitrocellulose membranse will bind virtually any proteins, regardless of charge. The charge simply ensures a stronger bond. Thus, it is extremely important to handle nitrocellulose membranes with clean gloves and clean utensils to minimize extraneous proteins from being bound to the membrane.
Western Blot Procedure:
• Blocking
The membrane is blocked in order to reduce non-specific protein interactions between the membrane and the antibody. This is achieved by placing the membrane in a solution of non-specific proteins (usually BSA or non-fat milk). The proteins in the blocking solution coat the remaining areas of the membrane where no protein is bound from the transfer. The reason this is necessary is described in the next step.
• Primary Antibody
The first antibody to be applied (specific for protein of interest) is incubated with the membrane. The primary antibody is specific for the protein of interest (in this case HSP70), and, at appropriate concentrations, should not bind any of the other proteins on the membrane. Remember, antibodies are proteins, too. If we had not blocked the membrane, the antibody would end up binding to both the membrane and your target protein. This would result in extremely high background (signals not related to the intended target protein(s)) and would use up a significant amount of the available antibody, making the interpretion of results difficult, if not impossible.
• Secondary Antibody
After rinsing the membrane to remove unbound primary antibody, a secondary antibody is incubated with the membrane. It binds to a species-specific portion of the primary antibody. Due to its targeting properties, the secondary antibody tends to be referred to as "anti-mouse," "anti-goat," etc., depending on the animal species that the primary antibody was created in. This secondary antibody is typically linked to an enzyme that allows for visual identification. In our case, the antibody is linked to an alkaline phosphatase (AP).
• Developing
The unbound secondary antibodies are washed away, and the enzyme substrate is incubated with the membrane so that the positions of membrane-bound secondary antibodies will either change color or emit light. Bands corresponding to the detected protein of interest can be visualized. Band densities in different lanes can be compared providing information on relative abundance of the protein of interest. The kit we will be using for visualization (Invitrogen's WesternBreeze Chromogenic Kit) utilizes an enzymatic reaction that creates a dark purple precipitate that can be seen with the naked eye.
The chromogenic system emplyed in the WesternBreeze Chromogenic Kit is the combination of BCIP (5-Bromo-4-Chlo ro-3'-Indolypho sphate p-Toluidine Salt) and NBT (Nitro-Blue Tetrazolium Chloride). Together they yield an intense, insoluble black-purple precipitate when reacted with Alkaline Phosphatase. The NBT/BCIP reaction is illustrated in the figure below. This reaction proceeds at a steady rate, allowing accurate control of the relative sensitivity and control of the development of the reaction.
 |
| external image 20090128-etdqje5s5ydq9iiqsjcytq2h5q.jpg |
Transfer Proteins to membrane
1. Cool the transfer buffer to 4°C.
2. Soak the filter paper, membrane and gel in Transfer Buffer for 15 minutes.
3. Assemble the blotting sandwich in a semi-dry blotting apparatus as follows: (note current flows top - bottom)
"sandwich" from top-to-bottom: filter paper - gel - membrane - filter paper
Anode (+++)
• Filter paper
• Nitrocellulose Membrane
• Gel
• Filter paper
• Cathode (– – –)
4. Transfer the blot for 30 minutes at 20V.
5. Remove the gel from the sandwich and rinse with transfer buffer.
6. Use a cotton swab to remove any adhering gel from the membrane.
Western Blotting Protocol
Western Breeze Manufacturer's Protocol
General Guidelines
• Avoid touching the working surface of the membrane, even with gloves.
• Work quickly when changing solutions as membranes dry quickly. If the membrane dries, re-wet the membrane with methanol and rinse with water before proceeding.
• Add solutions to the trays slowly, at the membrane edge, to avoid bubbles forming under the membrane. Decant from the same corner of the dish to ensure complete removal of previous solutions.
1. Prepare 20 mL of Blocking Solution
Ultra filtered Water 14 ml
Blocker/Diluent (Part A) 4 ml
Blocker/Diluent (Part B) 2 ml
Total Volume 20 ml
2. Place the membrane in 10 ml of the appropriate Blocking Solution in a covered, plastic dish provided in the kit. Incubate for 30 minutes on a rotary shaker set at 1 revolution/sec.
3. Decant the Blocking Solution.
4. Rinse the membrane with 20 ml of water for 5 minutes, then decant. Repeat once.
5. Prepare 10 mL of Primary Antibody Solution (1:3000 dilution)
Blocking Solution 10 ml
HSP 70 antibody 3.3 µl
Total Volume 10 ml
6. Incubate the membrane with 10 ml of Primary Antibody Solution for OVERNIGHT
NEXT DAY
Decant Primary Ab, saved at 4C.
 |
| external image 20090131-8h4penekfh59y9cd6baiehb67c.jpg |
Protein Gel
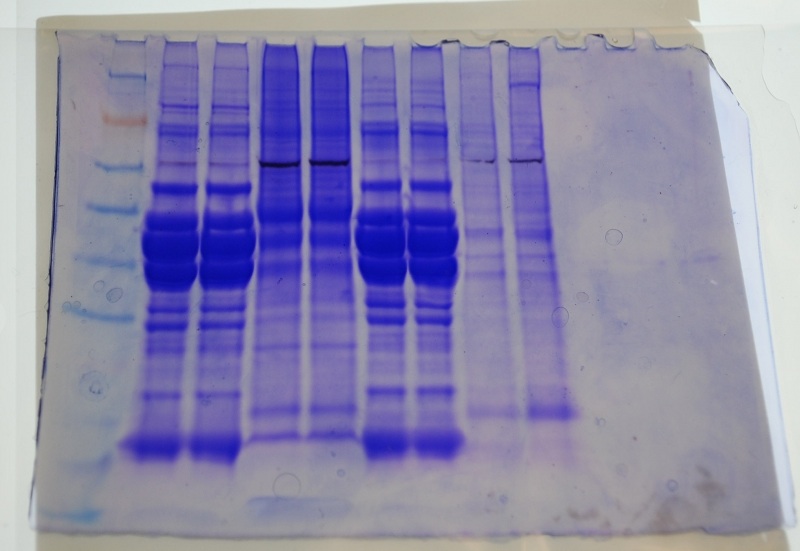
Lane ID (back gel - two notches upper right corner)1.ladder 2.JFa 3. JFb 4.AYa 5.AYb 6.JTa 7.JTb 8.BobH17 9.BobH23
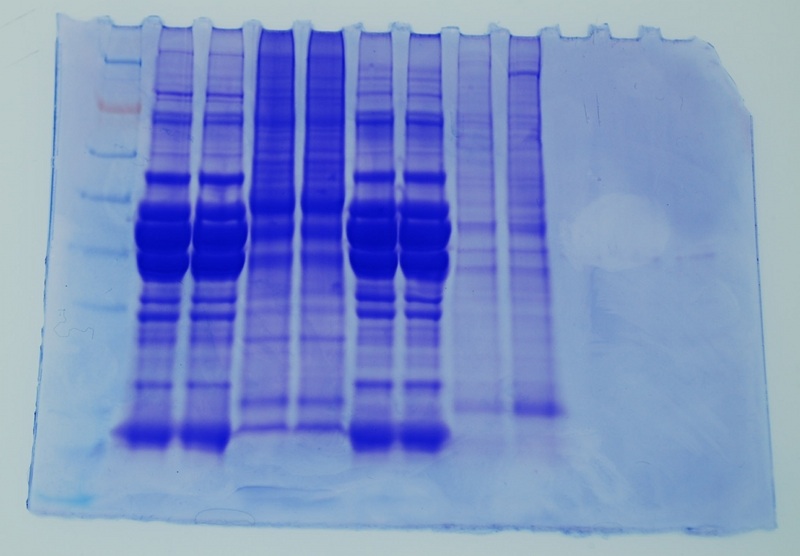
Jen and I have similar bands. We both had rainbow trout muscle - white for Jen, red for me.
Western Blot - 45 min. (lane designation same as above)
HSP 70 band lighter than Amy's (darkest)
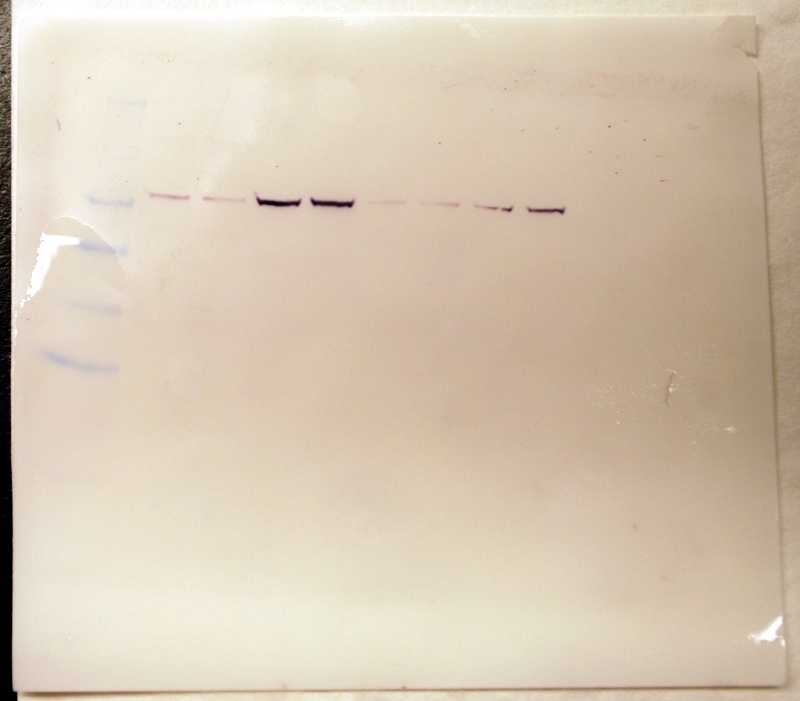
Western Blot - 1.5 hrs.
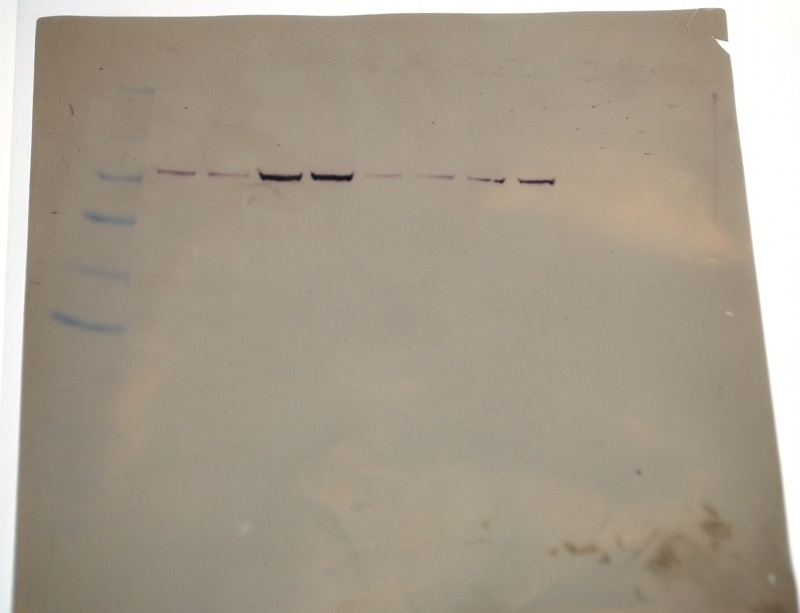
Overlay of Western on Coomasie: HSP 70 banding on Coomassie barely discernable on my lanes (yet still present as shown on Western)
2/4/09
Lab 5 Quantitative PCR
- Perform QPCR
List of Supplies and Equipment:
- PCR Plates (white); optically clear caps
- 1.5 ml microfuge tubes (RNAse free)
- Nuclease Free water
- filter tips
- Opticonthermal cycler
- kim wipes
- 2x Immomix Master Mix
- SYBR green dye (or similar dye)
- microfuge tube racks
- ice buckets
- timers
- cDNA samples (student provided)
PCR
Polymerase Chain Reaction involved amplifying a DNA (genomic or complementary) target using a polymerase, primers (short oligonucleotide), and dNTPs (A, C, T, Gs). In general the reaction is placed in a machine (thermocycler) where a series of temperature changes are performed [Denature (~94), Anneal (primer specific ~50-60), and Extention (~72)].
Run each template in duplicate AND make sure to include at least 2 negative controls for each primer (no template).
1. Prepare master mix: Prepare enough reactions to run each template in duplicate AND make sure to include at least 2 negative controls for each primer (no template). Add 1 additional reaction to the total to ensure sufficient volume recovery.
For a 50μl reaction volume:
| Component |
Volume |
Final Conc. |
| Master Mix, 2X (Immomix) |
25µL |
1x |
| Syto-13 dye (50uM) |
2-5µL |
2 - 5µM |
| upstream primer, 10μM |
0.5–5.0μl |
0.1–1.0μM |
| downstream primer, 10μM |
0.5–5.0μl |
0.1–1.0μM |
| Ultra Pure Water |
to 48uL |
NA |
2. Add mastermix to wells of a white PCR plate
3. Thaw cDNA samples.
4. Add 2uL cDNA template to each reaction.
5. Add 2uL of ultra pure water to the negative control wells.
6. Cap the wells securely.
7. If necessary, spin the strips to collect volume in the bottom of the wells.
8. and ensure the lids are clean (wipe with a Kim Wipe) before going into the Opticon.
9. Load the plate, verify the PCR conditions and start the run.
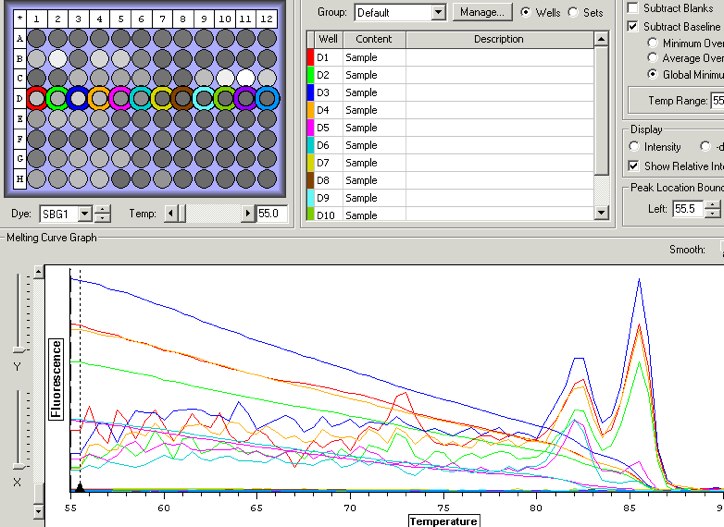
2/11/09
Developing a gene expression profile as a biomarker of exposure in juvenile Chinook salmon (Oncorhynchus tshawytsha) - Day 1
Extracted gill samples from 8 control Chinook (non-exposed) and treated with TriReagent as follows:
RNA ISOLATION PROTOCOL (steps and materials adapted from Lab 1 protocol on 1/7/09)
1. Added 500uL of TriReagent to a 1.5mL snap cap tube. Store on ice.2. Added approx. 25 mg gill tissue to each tube.
3. Carefully homogenized the tissue using a disposable pestle.
4. Vortex vigorously for 15s.
Samples labeled 0-6A1-8. Stored in -80C until next step of RNA isolation.
Chinook samples taken from Marrowstone field test in 6/08. All samples frozen at -30C until transfer to UW, where they were stored at -40C. After RNA isolated will determine RNA integrity.
2/19/09
Rec'd mRNA sequence back. Will use BLAST for confirmation that sequence codes for creatine kinase.
JF_well3_bottomband_1_jgfF Chromat_id=273492 Length=159 Type=Folder Name=090213143024 Id=1286
GCTCCAAGATTGAACCCTGTTTAAGATAAGGGCACTTCATTCATGTGGAATGAGCACTTGGGCTACGTTCTCACCTGCCCATCCAACCTGGGCACAGGGCTACGTGCTGGAGTCCACGTCAAGATCCCCAACATGAGCAAGCATGCCAAATTTGAGGAA
>JF_well3_bottomband_2_jgfF Chromat_id=273561 Length=157 Type=Folder Name=090213143024 Id=1286
TCCAAGATTGAACCCTGTTTAAGATAAGGGCACTTCATTCATGTGGAATGAGCACTTGGGCTACGTTCTCACCTGCCCATCCAACCTGGGCACAGGGCTACGTGCTGGAGTCCACGTCAAGATCCCCAACATGAGCAAGCATGCCAAATTTGAGGAA
>JF_well3_bottomband_3_jgfR Chromat_id=273604 Length=158 Type=Folder Name=090213143024 Id=1286
TGGACTCAGCACGTAGCCCTGTGCCCAGGTTGGATGGGCAGGTGAGAACGTAGCCCAAGTGCTCATTCCACATGAATGAAGTGCCCTTATCTTTAAACAGGGTTTCAATCTTTGTGAGGCCAGTGCAGAAACGGTTGAACACCTCCTTCATGTTGCCA
>JF_well3_bottomband_4_jgfR Chromat_id=273616 Length=158 Type=Folder Name=090213143024 Id=1286
TGGACTCAGCACGTAGCCCTGTGCCCAGGTTGGATGGGCAGGTGAGAACGTAGCCCAAGTGCTCATTCCACATGAATGAAGTGCCCTTATCTTTAAACAGGGTTTCAATCTTTGTGAGGCCAGTGCAGAAACGGTTGAACACCTCCTTCATGTTGCCA
>JF_well3_topband_1_jgfF Chromat_id=273508 Length=0 Type=Folder Name=090213143024 Id=1286

>JF_well3_topband_2_jgfF Chromat_id=273569 Length=0 Type=Folder Name=090213143024 Id=1286

>JF_well3_topband_3_jgfR Chromat_id=273606 Length=308 Type=Folder Name=090213143024 Id=1286
TGAGTGGACTCCAGCACGTAGCCCTGTGCCCAGGTTGGATGGGCAGGTGAGAACGTAGCCCAAGTGCTCATTCCACATGAATGAAGTGCCCTTATCTTTAAACAGGGTTTCAATCTTTGTGAGGCCAGTGCAGAAACGGTTGAACACCTCCTTCATGTTGCCAAGTAATACAAACACCATCGATTGATCATTGCAGCATGTTTTTACACAGCATTTTTAATATGGCAACAGCAAATTATCCTTATTTAAATTCTCAAAACCTTGAAGGTATTCCTCAGATATTCACTCACCTTTGTGAGGCCAGTGCA
>JF_well3_topband_4_jgfR Chromat_id=273618 Length=303 Type=Folder Name=090213143024 Id=1286
GAGTGGACTCCAGCACGTAGCCCTGTGCCCAGGTTGGATGGGCAGGTGAGAACGTAGCCCAAGTGCTCATTCCACATGAATGAAGTGCCCTTATCTTTAAACAGGGTTTCAATCTTTGTGAGGCCAGTGCAGAAACGGTTGAACACCTCCTTCATGTTGCCAAGTAATACAAACACCATCGATTGATCATTGCAGCATGTTTTTACACAGCATTTTTAATATGGCAACAGCAAATTATCCTTATTTAAATTCTCAAAACCTTGAAGGTATTCCTCAGATATTCACTCACCTTTGTGAGGCCAG
2/20/09
Developing a gene expression profile as a biomarker of exposure in juvenile Chinook salmon (Oncorhynchus tshawytsha) - Day 2
Completed RNA isolation and DNase treatment on control samples.
Followed protocol from Lab 2 - due to smaller tissue sample size and less TriReagent use, all reagents added at 1/2 volume from Lab 2 protocol.
Quantification of RNA using Nano Drop Spectrophotometer:
RNA control.bmp
Following RNA isolation and quantification, ran DNase treatment following protocol:
1. Add 0.1 volume (25uL) 10X TURBO DNase Buffer and 1uL TURBO DNase to the RNA, and mix gently.
2. Incubate at 37C for 20-30 min.
3. Add resuspended DNase Inactivation Reagent (2.5uL) and mix well.
4. Incubate 2 min. at room temp., mixing occasionally.
5. Centrifuge at 10K x g for 1.5 min. and transfer the RNA to a fresh tube.
Quantification of DNA-free RNA using Nano Drop Spcetrophotometer:
Sample 3 appears contaminated (I noted during transfer of aqueous phase following chloroform addition and centrifugation that I mistakenly transferred
some of the interphase). I will discard this sample from my set.
2/23/09
Developing a gene expression profile as a biomarker of exposure in juvenile Chinook salmon (Oncorhynchus tshawytsha) - Day 3
Extracted gill samples from 8 Chinook exposed to 2.8 ppm IMI for 6-hrs. and 8 Chinook exposed to 5.6 ppm IMI for 6-hrs. Treated with TriReagent as previous. Labeledsamples 2.8 - 1,8 and 5.6 - 1,8
RNA ISOLATION PROTOCOL (steps and materials adapted from Lab 1 protocol on 1/7/09)
1. Added 500uL of TriReagent to a 1.5mL snap cap tube. Store on ice.2. Added approx. 25 mg gill tissue to each tube.
3. Carefully homogenized the tissue using a disposable pestle.
4. Vortex vigorously for 15s.
Samples labeled 0-6A1-8. Stored in -80C until next step of RNA isolation.
3/2/09
Developing a gene expression profile as a biomarker of exposure in juvenile Chinook salmon (Oncorhynchus tshawytsha) - Day 4
Completed RNA isolation on 5.6 ppm samples. Quantified with NanoDrop:
3/4/09
Developing a gene expression profile as a biomarker of exposure in juvenile Chinook salmon (Oncorhynchus tshawytsha ) - Day 5
Ordered degenerate primers for examination of relative expression of two genes coding for transcription factors involved in osmoregulatory response in tillapia.
3/7/09
Developing a gene expression profile as a biomarker of exposure in juvenile Chinook salmon ( Oncorhynchus tshawytsha ) - Day 6
DNase treatment on 5.6 ppm samples. Quantified with NanoDrop:
5.6_DNase.bmp
Completed RNA isolation on 2,8 ppm samples. Quantified with NanoDrop:
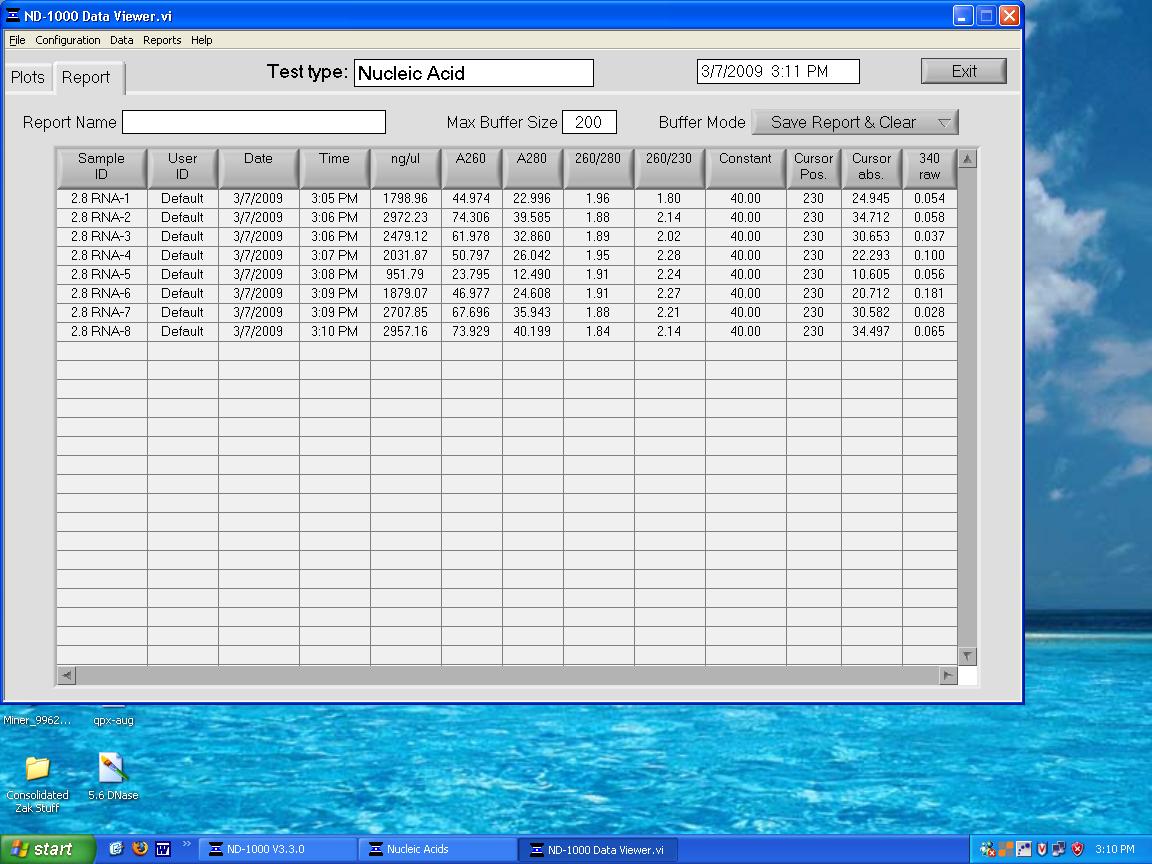
DNase treatment on 2.8 ppm samples. Quantified with NanoDrop:
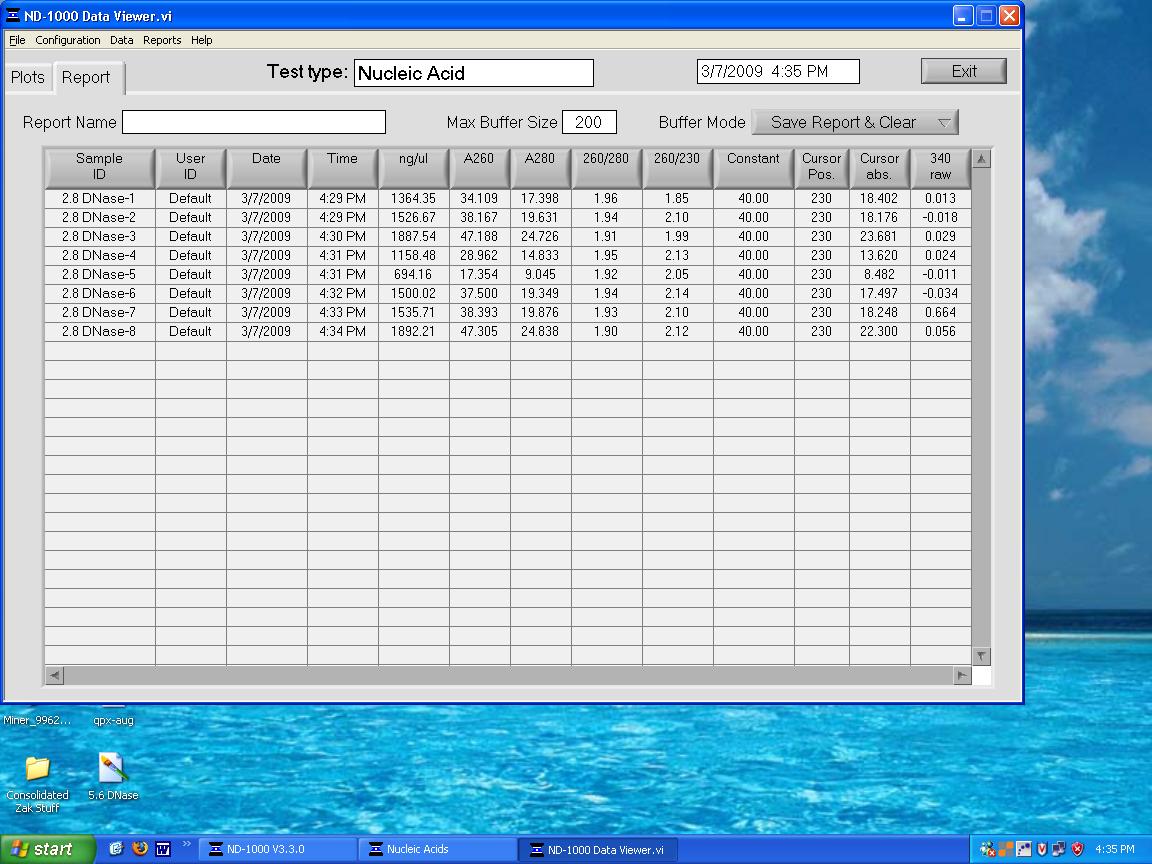
It appears all samples (except control #3) have adequate RNA for proceeding with RTqPCR.
3/9/09
Developing a gene expression profile as a biomarker of exposure in juvenile Chinook salmon (Oncorhynchus tshawytsha ) - Day 7
Created cDNA of all three sample groups. Followed RT protocol from lab 3, except used 1/2 amount of RNA and Master Mix reagents for reactions.
3/10/09
Developing a gene expression profile as a biomarker of exposure in juvenile Chinook salmon (Oncorhynchus tshawytsha ) - Day 8
Ran qPCR on all control samples for both primers. Followed protocol as per lab 5. Ran all samples in duplicate. Labeled qPCR strips as follows:
Primer EL 560600
JF-1 0-1A 0-1B NC NC 0-2A 0-2B NC NC JF-2
JF-3 0-3A 0-3B NC NC 0-4A 0-4B NC NC JF-4
JF-5 0-5A 0-5B NC NC 0-6A 0-6B NC NC JF-6
JF-7 0-7A 0-7B NC NC 0-8A 0-8B NC NC JF-8
Primer EV 377974
JF2-1 0-1A 0-1B NC NC 0-2A 0-2B NC NC JF2-2
JF2-3 0-3A 0-3B NC NC 0-4A 0-4B NC NC JF2-4
JF2-5 0-5A 0-5B NC NC 0-6A 0-6B NC NC JF2-6
JF2-7 0-7A 0-7B NC NC 0-8A 0-8B NC NC JF2-8
Began qPCR at 16:14.