The qPCR showed the second batch to have samples 0A, 0B, 1A, and 1B contain no genomic DNA while samples 2A, 2B, 3A, and 3B to have some amount of genomic DNA. Samples 2A, 2B, 3A, and 3B was DNAsed again, speced, and qPCR was run using the 18s gigas primer, JUST on those 4 samples.
6-1-09
Checked the qPCR results and noted that while the first batched (DNAsed) gave no signs of genomic DNA, the second batch all contained some quantity of genomic DNA. The second batch was DNAsed, speced and another plate of qPCR was set up and run using the 18s gigas primer on the second batch.
5-29-09
Spec-ed the extracted RNA from second batch of oyster hemocytes. Prepared and ran qPCR (real-time PCR) for both batches using 18s Primer. Will check up on results next time in lab.
5-26-09
Designed primers for oyster proliferation experiment. Put up primers to be ordered on PrimerDatabase (Google Docs).
5-22-09
Extracted RNA from the second batch of samples following the RNA extraction protocol at the RNA extraction acrea in Roberts Lab. Again, the only difference was rather than air drying the RNA, the samples were centrifuged at the highest speed for one minute and the supernatent was drawn and discarded. The RNA pellet was resuspended using 20uL of DEPC-treated water. The extracted RNA was stored in the -80 degrees celsius freezer.
5-21-09
The wells for the second batch were washed and pictures were taken. Hemocytes from the fifth and the sixth wells (last two samples) were lysed with Tri-Reagent and stored in the -80 degrees celsius freezer.
PICTURES ARE BEING UPDATED ON EXTERNAL DATABASE
The purified RNA samples were spec-ed and restored in the -80 degrees celsius freezer.
INSERT SPEC SHEET
The purified RNA samples will be used to create cDNA following the ProMega MMLV RT protocol (most likely on Monday).
5-20-09
The wells for the second batch were washed and pictures were taken. Hemocytes from the third and the fourth wells were lysed with Tri-Reagent and stored in the -80 degrees celsius freezer.
PICTURES ARE BEING UPDATED ON EXTERNAL DATABASE
The extracted RNA samples were spec-ed and purified from DNA using the Ambion Turbo DNA-free Kit protocol. The only changes/notes to the protocol was that 10ug of each samples were used and brought up to a volume of 50uL with DEPC-treated water except for samples Day 4 and Day 5; there were not enough samples (low concentration) so all 18uL of the samples were used and still brought up to a volume of 50uL with DEPC-treated water.
INSERT SPEC SHEET
5-19-09
The wells for the second batch were washed and pictures were taken. Hemocytes from the first two wells were lysed with Tri-Reagent and stored in the -80 degrees celsius freezer.
PICTURES ARE BEING UPDATED ON EXTERNAL DATABASE
RNA was extracted from the first batch of samples following the RNA extraction protocol at the RNA extraction acrea in Roberts Lab. The only difference was rather than air drying the RNA, the samples were centrifuged at the highest speed for one minute and the supernatent was drawn and discarded. The RNA pellet was resuspended using 20uL of DEPC-treated water. The extracted RNA was stored in the -80 degrees celsius freezer.
5-18-09
Three experiments (Hemocytes from Various Parts of Oyster, Four Bled Oysters, and Oyster K1-K6) were ended and the samples were discarded. The Proliferation of Hemocytes continued and pictures were taken of the last well containing hemocytes after washing with antibiotic-treated sterile seawater. The hemocytes in the last, fifth well were resuspended and lysed with Tri-Reagent and placed in the -80 degrees celsius freezer.
PICTURES ARE BEING UPDATED ON EXTERNAL DATABASE
Dr. Roberts advised me to start a second batch of samples for standardization and a backup. This was done by shucking four oysters and drawing hemolymph directly from the heart. A total of 6mL of hemolymph was obtained, and after adding antibiotic-treated sterile seawater, a total of 12mL of samples was obtained. Dr. Roberts advised me to plate two samples for each day for the sake of continuity and normality. Also, keeping a Day 0 sample was advised for comparison. Six samples, 1.5mL each, were plated (for Day 1, Day 2, and Day 3) and two samples, 1.5mL each, were lysed using the Tri-Reagent and stored in the -80 degrees celsius.
INSERT PICTURES OF OYSTERS
5-15-09
All four different experiments (Proliferation of Hemocyte experiment, Hemocytes from Various Parts of Oyster, Four Bled Oysters, and Oysters K1-K6) were documented through photos.
PICTURES ARE BEING UPDATED ON EXTERNAL DATABASE
The fourth well containing hemocytes from the plated hemocytes from the Proliferation of Hemocyte experiment was lysed and stored in the -80 degrees Celsius freezer with the other samples. Next Monday will be the last day to lyse and collect the hemocyte. A powerpoint presentation will be prepared for each of the four experiments including all the pictures. Gene expression will be studied more deeply to determind what genes would be expressed regarding proliferation.
5-14-09
Again, took pictures of plated hemocytes from Proliferation of Hemocyte experiment, Hemocytes from Various Part of Oyster, Four Bled Oysters, and Oysters K1-K6.
Note that from the Four Bled Oysters, there are now no visible hemocytes from Oyster #1 and #2.
PICTURES ARE BEING UPDATED ON EXTERNAL DATABASE
The third well containing hemocytes from the plated hemocytes from the Proliferation of Hemocyte experiment was lysed and stored in the -80 degrees Celsius freezer with the other samples.
5-13-09
Again, took pictures of plated hemocytes from Proliferation of Hemocyte experiment, Hemocytes from Various Part of Oyster, Four Bled Oysters, and Oysters K1-K6.
PICTURES ARE BEING UPDATED ON EXTERNAL DATABASE
The second batch of hemocytes in the second of the five plated hemocytes from the Proliferation of Hemocyte experiment was lysed and stored in the -80 degrees Celsius freezer with the first sample obtained yesterday.
Also, gene expressions regarding hemocyte proliferation and differentiation will be continuously looked at and documented.
5-12-09
Took pictures of plated hemocytes from Proliferation of Hemocyte experiment, Hemocytes from Various Part of Oyster, Four Bled Oysters, and Oysters K1-K6.
PICTURES ARE BEING UPDATED ON EXTERNAL DATABASE
Proliferation of Hemocyte Experiment:
From the five plated hemocytes, one well was washed and cells were lysed using 1mL of Tri-Reagent (which included phenol) and stored in the -80 degrees Celsius freezer in a snap-cap tube. This will continue until hemocytes from all five wells have been lysed and stored.
5-11-09
Began a new segment of research to study proliferation of cells (hemocytes).
Five oysters (K1, K2, K3, K4, K6) were shucked and hemolymph was directly obtained from the heart. However, it was pysically difficult to obtain hemolymph directly from heart (it was difficult to draw liquid using syringe) and so "cloudy liquid" was drawn from around heart after obtaining as much liquid as possible for all oysters.
Amount of liquid drawn:
K1 - 1.25mL
K2 - 2.75mL
K3 - 1.0mL
K4 - 1.25mL
K6 - .75mL
The hemolymph obtained was pooled and suspended with antibiotic-treated sterile seawater. There was a total of 15mL of liquid so with five days to determind proliferation using gene expression, 3mL of liquid was equally distributed on Poly-D-Lysine treated wells (total of 5 wells filled). A control well was also filled, consisting of antibiotic-treated sterile seawater.
The previously plated hemocytes (K1-K6, Various parts of oyster, and the four oysters previously bled) were all washed but, due to time strains, pictures were unable to be taken. They will be photo-documented tomorrow.
5-08-09
*There was not enough time to begin testing whether the obtained cells proliferated or not.
Pictures were taken of the plated hemocytes (drawn from oysters K1-K6) at 200x and 400x 48 hours after plating.
| K1 Muscle |
||
200x |
400x |
|
| K2 Muscle |
||
200x |
400x |
|
| K3 Muscle |
||
200x |
400x |
|
| K4 Heart |
||
200x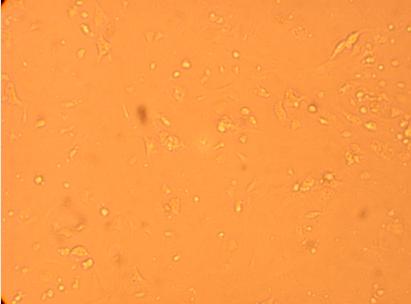 |
400x |
|
| K4 Muscle |
||
200x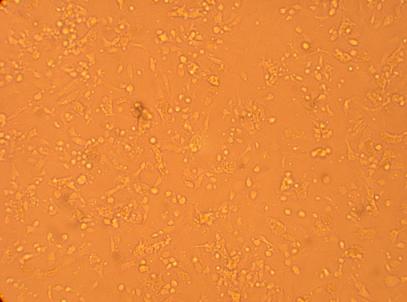 |
400x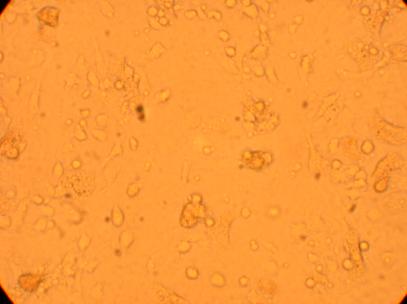 |
|
| K5 Heart |
||
200x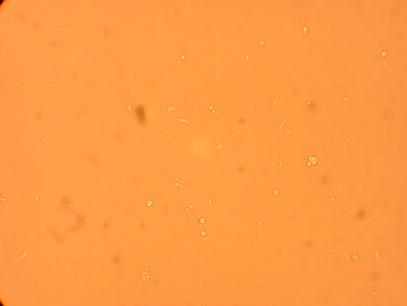 |
400x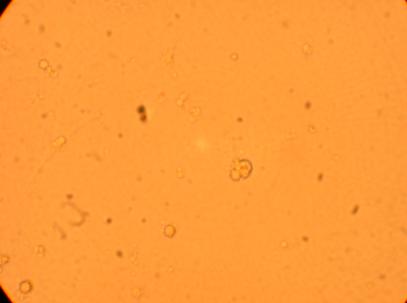 |
|
| K5 Muscle |
||
200x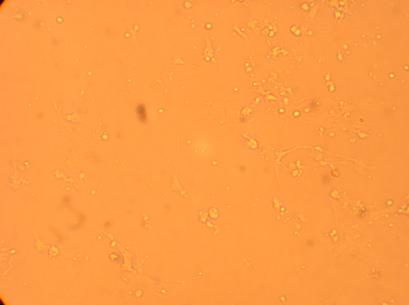 |
400x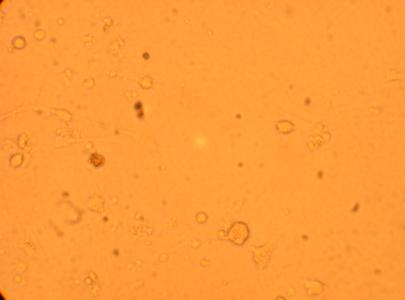 |
|
| K6 Heart |
||
200x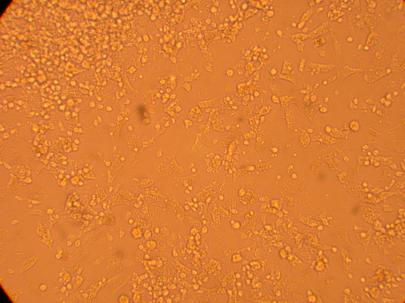 |
400x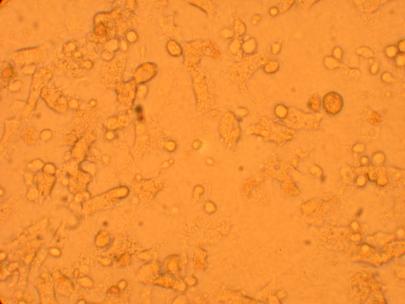 |
|
| K6 Muscle |
||
200x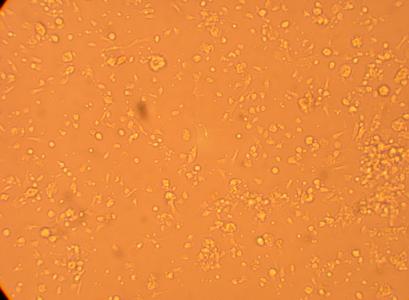 |
400x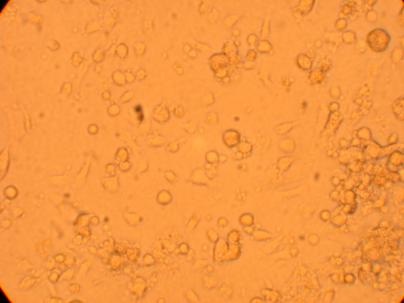 |
|
The four oyster which had been bled on 4/29/09 were also washed with antibiotic treated sterile seawater and documented through pictures 192 hours after plating. However, the hemocytes on oyster #1 were non-existent after washing so no photos were taken.
| Oyster #2 |
||
200x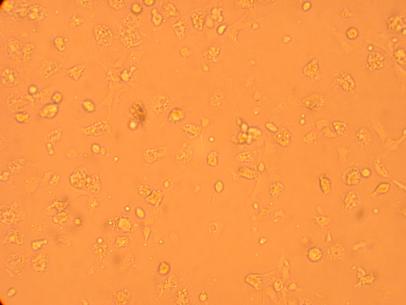 |
400x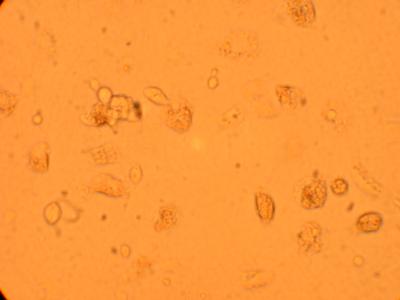 |
|
| Oyster #3 |
||
200x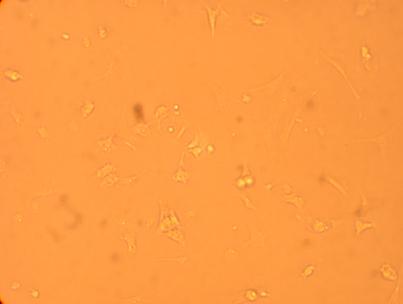 |
400x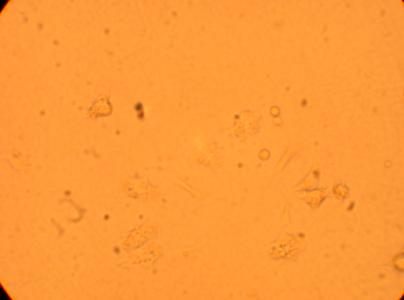 |
|
| Oyster #4 |
||
200x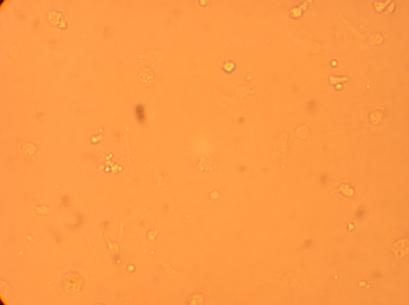 |
400x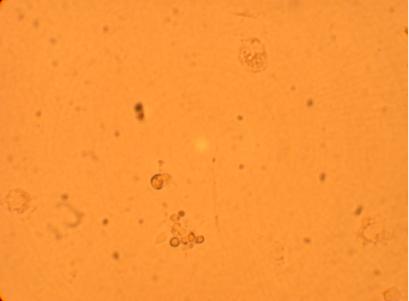 |
|
Pictures of the hemocytes from various parts of the oysters (heart, muscle, stomach) which were plated on 5/1/09 were also taken, 168 hours after being plated.
| Hemocyte from Heart |
||
200x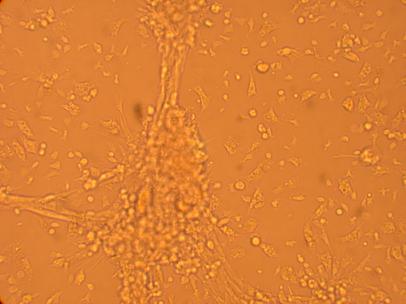 |
400x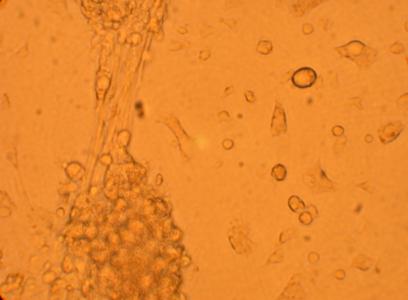 |
|
| Hemocyte from Muscle |
||
200x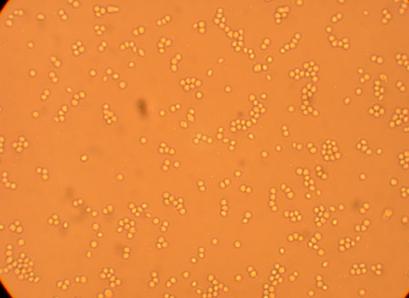 |
400x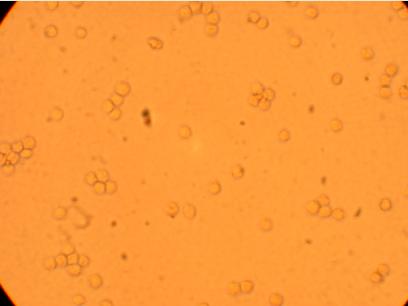 |
|
| Hemocyte from Stomach |
||
200x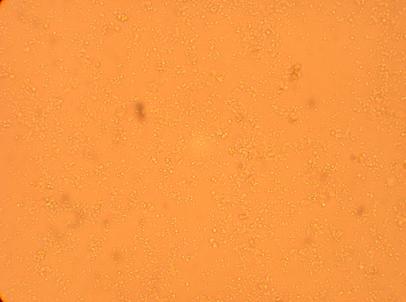 |
400x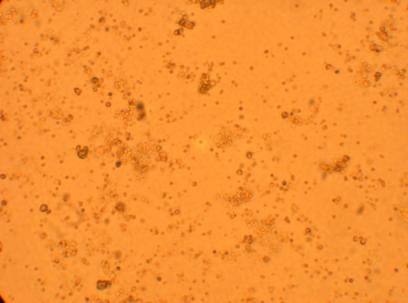 |
|
5-07-09
Pictures were taken of the plated hemocytes (drawn from oysters K1-K6) at 200x and 400x 24 hours after plating.
| K1 Muscle |
||
200x |
400x |
|
| K2 Muscle |
||
200x |
400x |
|
| K3 Muscle |
||
200x |
400x |
|
| K4 Heart |
||
200x |
400x |
|
| K4 Muscle |
||
200x |
400x |
|
| K5 Heart |
||
200x |
400x |
|
| K5 Muscle |
||
200x |
400x |
|
| K6 Heart |
||
200x |
400x |
|
| K6 Muscle |
||
200x |
400x |
|
Hemocytes which were plated on 5/1/09 were also washed with sterile seawater and observed under in inverted microscope 144 hours after plating:
| Hemocyte from Heart |
|
200x |
400x |
| Hemocyte from Muscle |
|
200x |
400x |
| Hemocyte from Stomach |
|
200x |
400x |
5-06-09
Took pictures of previously plated hemocytes from 5/1/09 (various parts of oyster) 120 hours after plating without washing with sterile seawater.
The following photos were taken at a magnification of 200x:
Hemocyte from Heart

Hemocyte from Muscle

*There were some sort of amoebas rapidly moving around this well. Interestingly enough, they seemed very similar to hemocytes and could only be identified by their movements.
Hemocyte from Stomach

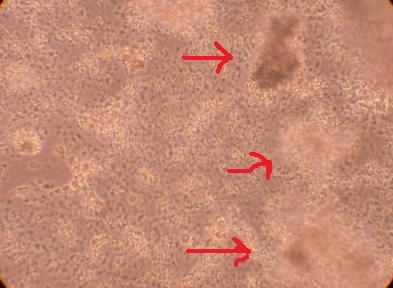
*I am inclined to believe the tiny cell-like objects are not hemocytes but perhaps bacteria? They are much smaller than a typical hemocyte or a hyalinocyte. On the second picture, the arrows point to blobs of cells suspended above the rest of the cell colony. This brings up the suggestion that perhaps the cells in this plate are, in fact, proliferating. This will be studied in more detail in the future.
The same oysters were magnified at 400x for a more detailed observation:
Hemocyte from Heart

Hemocyte from Muscle

Hemocyte from Stomach

*There seems to be a significant amount of bacteria in the hemocyte sample drawn from the heart.
In order to see changes in oyster hemocytes, a standard must be set on how the oyster is bled, along with what the plated hemocytes look like after plating. Because of this, six oysters which did not have notches (sign of previous bleeding) were bled while various observations were noted during the process. The hemolymph which was drawn was plated on Poly-D-Lysine coated plates after mixing with sterile seawater on a 1:1 ratio. The sterile seawater had been treated with Pen-Strep antibiotics with procedures from previous days (1:100 dilution with final volume).
Of the six oysters picked, they were marked with a "K" to show that I, Kevin, have bled them. They were also numbered for organization's sake. Note that the oyster shells needed to be dried with a napkin before writing on with a felt-tip marker. I initially had intended on drawing two hemolymph samples from each oyster--one from the muscle (which is easy to locate due to it's dense, rubbery tissue), and one from the heart, or what I thought was the heart. However, as my observations show, it was easy to draw hemolymph from the muscle consistently, but due to the difficulty in locating the heart, only some oysters had samples drawn from the heart (or what I thought was the heart).
Pictures of oysters which were selected to be bled:
INSERT PICTURES
The following are the documented observations I made while bleeding the oysters:
| Oyster Name and Body Part Which Hemolymph was Drawn |
Observations While Bleeding |
Amount of Liquid Drawn |
| K1 Muscle |
Muscle was easy to locate since the needle had some difficulty penetrating it. The first .75mL was easy to draw but for the second .75mL, I had to poke around different parts of the muscle.* |
1.5mL |
| K1 Heart |
I could not locate the heart. In fact, while trying to locate the heart, the oyster began to pop open and close repeatedly. The oyster was then placed in a bucket of salt water from the secondary stock room, which stopped the process. |
0mL |
| K2 Muscle |
Again, it was easy to locate the muscle of the oyster. However, it seemed very easy to draw hemolymph from the muscle so I placed the needle in another part of the muscle, at which point, it became very difficult to draw any liquid. Perhaps I hit the stomach initially?* |
1.5mL |
| K2 Heart |
Could not locate--it is difficult to find the heart by feeling around with the needle. |
0mL |
| K3 Muscle |
It seems as though I hit some sort of blob of tissue, which I hope is muscle. It was fairly easy to draw hemolymph (compared to drawing hemolymph from muscle of previous oysters) so I placed the needle in different parts of the oyster tissue. It was then I poked something more dense than what I had initially hit. At that point, it became very difficult to draw any liquid. |
1.5mL |
| K3 Heart |
Could not locate. |
0mL |
| K4 Muscle |
I am now starting to realize when I am drawing from the muscle. It seems to be the most physically difficult place to draw the any liquid. |
1.5mL |
| K4 Heart |
I went in a second time (after drawing liquid from the muscle) and ended up drawing some clear liquid initially. Noting the position of the muscle, I placed the needle directly under the entire adductor muscle and pushed in slightly deeper. I slowly withdrew some very cloudy liquid. After about .5-1mL, it beecame very difficult to keep drawing liquid.* |
2.0mL |
| K5 Muscle |
It was very difficult to draw liquid from the muscle but I managed to get a decent amount. |
1.0mL |
| K5 Heart |
I placed the needle a bit ower than the muscle and pushed in slighty. I obtained about 1/2mL of liquid but could not draw any more so I placed it in another part of the muscle.* |
1.0mL |
| K6 Muscle |
There was almost no liquid but lots of bubbles. |
1.0mL |
| K6 Heart |
It seemed as though I was getting a lot of liquid wherever I drew (excluding the muscle. There were also a lot of bubbles. Perhaps I entirely missed the heart?* |
2.5mL |
5-05-09
Looked for potential gene expressions on the NCBI website.
PUT IN TABLE
5-04-09
Plated hemocytes obtained from various parts of the oyster were washed twice with 1mL of sterile seawater (room temperature) and observed through the inverted microscope after it had been sitting for 72 hours in the secondary stockroom (9-12 degrees celsius). Hemocytes obtained from the heart was the most densely populated and contained several types of granulocytes and hyalinocytes. Hemocytes obtained from the stomach contained the most bacteria (which was logical) but was not as densly populated as the well containing hemocytes from the heart. The least populated well was the one containing hemocytes obtained from the muscle. The hemocyte composition (granulocytes and hyalinocytes) seemed similar within each of the wells but will be looked at in detail with pictures.
5-01-09
Observed the four plated hemocytes through inverted microscope 48 hours after initial plating (washed with antibiotics-treated sterile seawater after 24 hours) through inverted microscope.
(These pictures are at 400x for consistency with last set of pictures)
Oyster #1
INSERT CORRECT PICTURE
Oyster #2

Oyster #3

Oyster #4

The following pictures are at 200x for a more broad perspective of the oyster hemocytes 48 hours after plating.
Oyster #1

Oyster #2

Oyster #3

Oyster #4

An oyster was shucked and hemolymph was obtained from different parts of the oyster (heart, muscle, hemolymph).

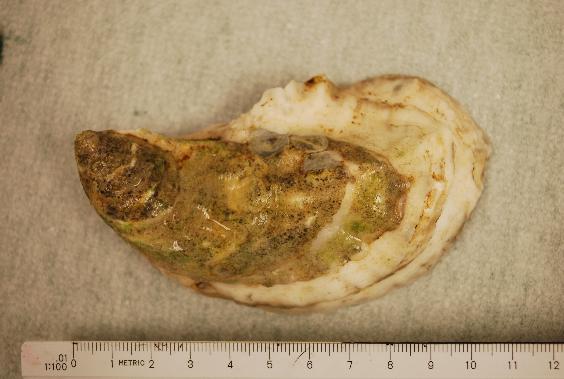
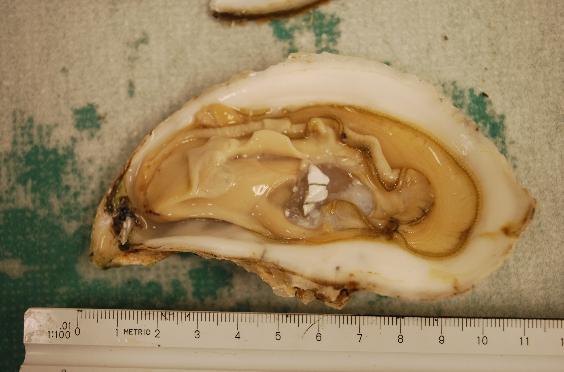
They were then mixed with sterile sea water (room temperature) at a 1:1 ratio, which had been previously prepared with antibiotics (Pen-Strep) at a 1:100 dilution to total volume which would be obtained upon mixing. The three mixtures were plated in Poly-D-Lysine wells and left in the secondary stock room (9-12 degrees celsius).
4-30-09
Observed plated cells through inverted microscope 24 hours after plating and took pictures at 400x before washing.
INSERT PICTURES
Oyster #1

Oyster #2
As you can observe, ther were a lot of "bacteria," noted by Sam. Because this was so, when the wells were washed with 1mL of sterile seawater, antibiotics was added again at a 1:100 dilution to the total volume of the samples.
Oyster #3
Oyster #4
Note that there are many types of cells in the pictures, such as granular leukocyte, hyaline keukocyte, and a signet-ring cell.
4-29-09
Bled and plated four oyster hemocytes (oyster was obtained from the stockroom in Fisheries and Aquatics building). Each of the four oysters which were chosen randomly had a different "feel" when bleeding and gave a varying cloudiness:
| Oyster |
Clarity of Obtained Sample |
Other Observations While Bleeding |
| #1 |
Clear |
Very easy to draw hemolymph |
| #2 |
Cloudy |
Difficult to find heart but eventually withdrew some hemolymph |
| #3 |
Semi-Cloudy |
Somewhat difficult to draw hemolymph |
| #4 |
Semi-Cloudy |
Perhaps I may have been trying to draw hemolymph from the muscle, but it was very difficult to draw the hemolymph from this oyster. |
Four oysters which were bled which varied in size:

Oyster #1

Oyster #2

Oyster #3

Oyster #4

The obtained hemocytes received a 1:1 ratio of room-temperature sterile seawater containing 1:100 dilution of thawed stock antibiotics (Pen-Strep). After mixing each of the four sample mixtures in separate tubes, 1mL of each sample mixture was plated onto a Poly-D-Lysine treated plate. They were then left overnight (24 hours) at the secondary oyster stock room (9-12 degrees Celsius).
4-23-09
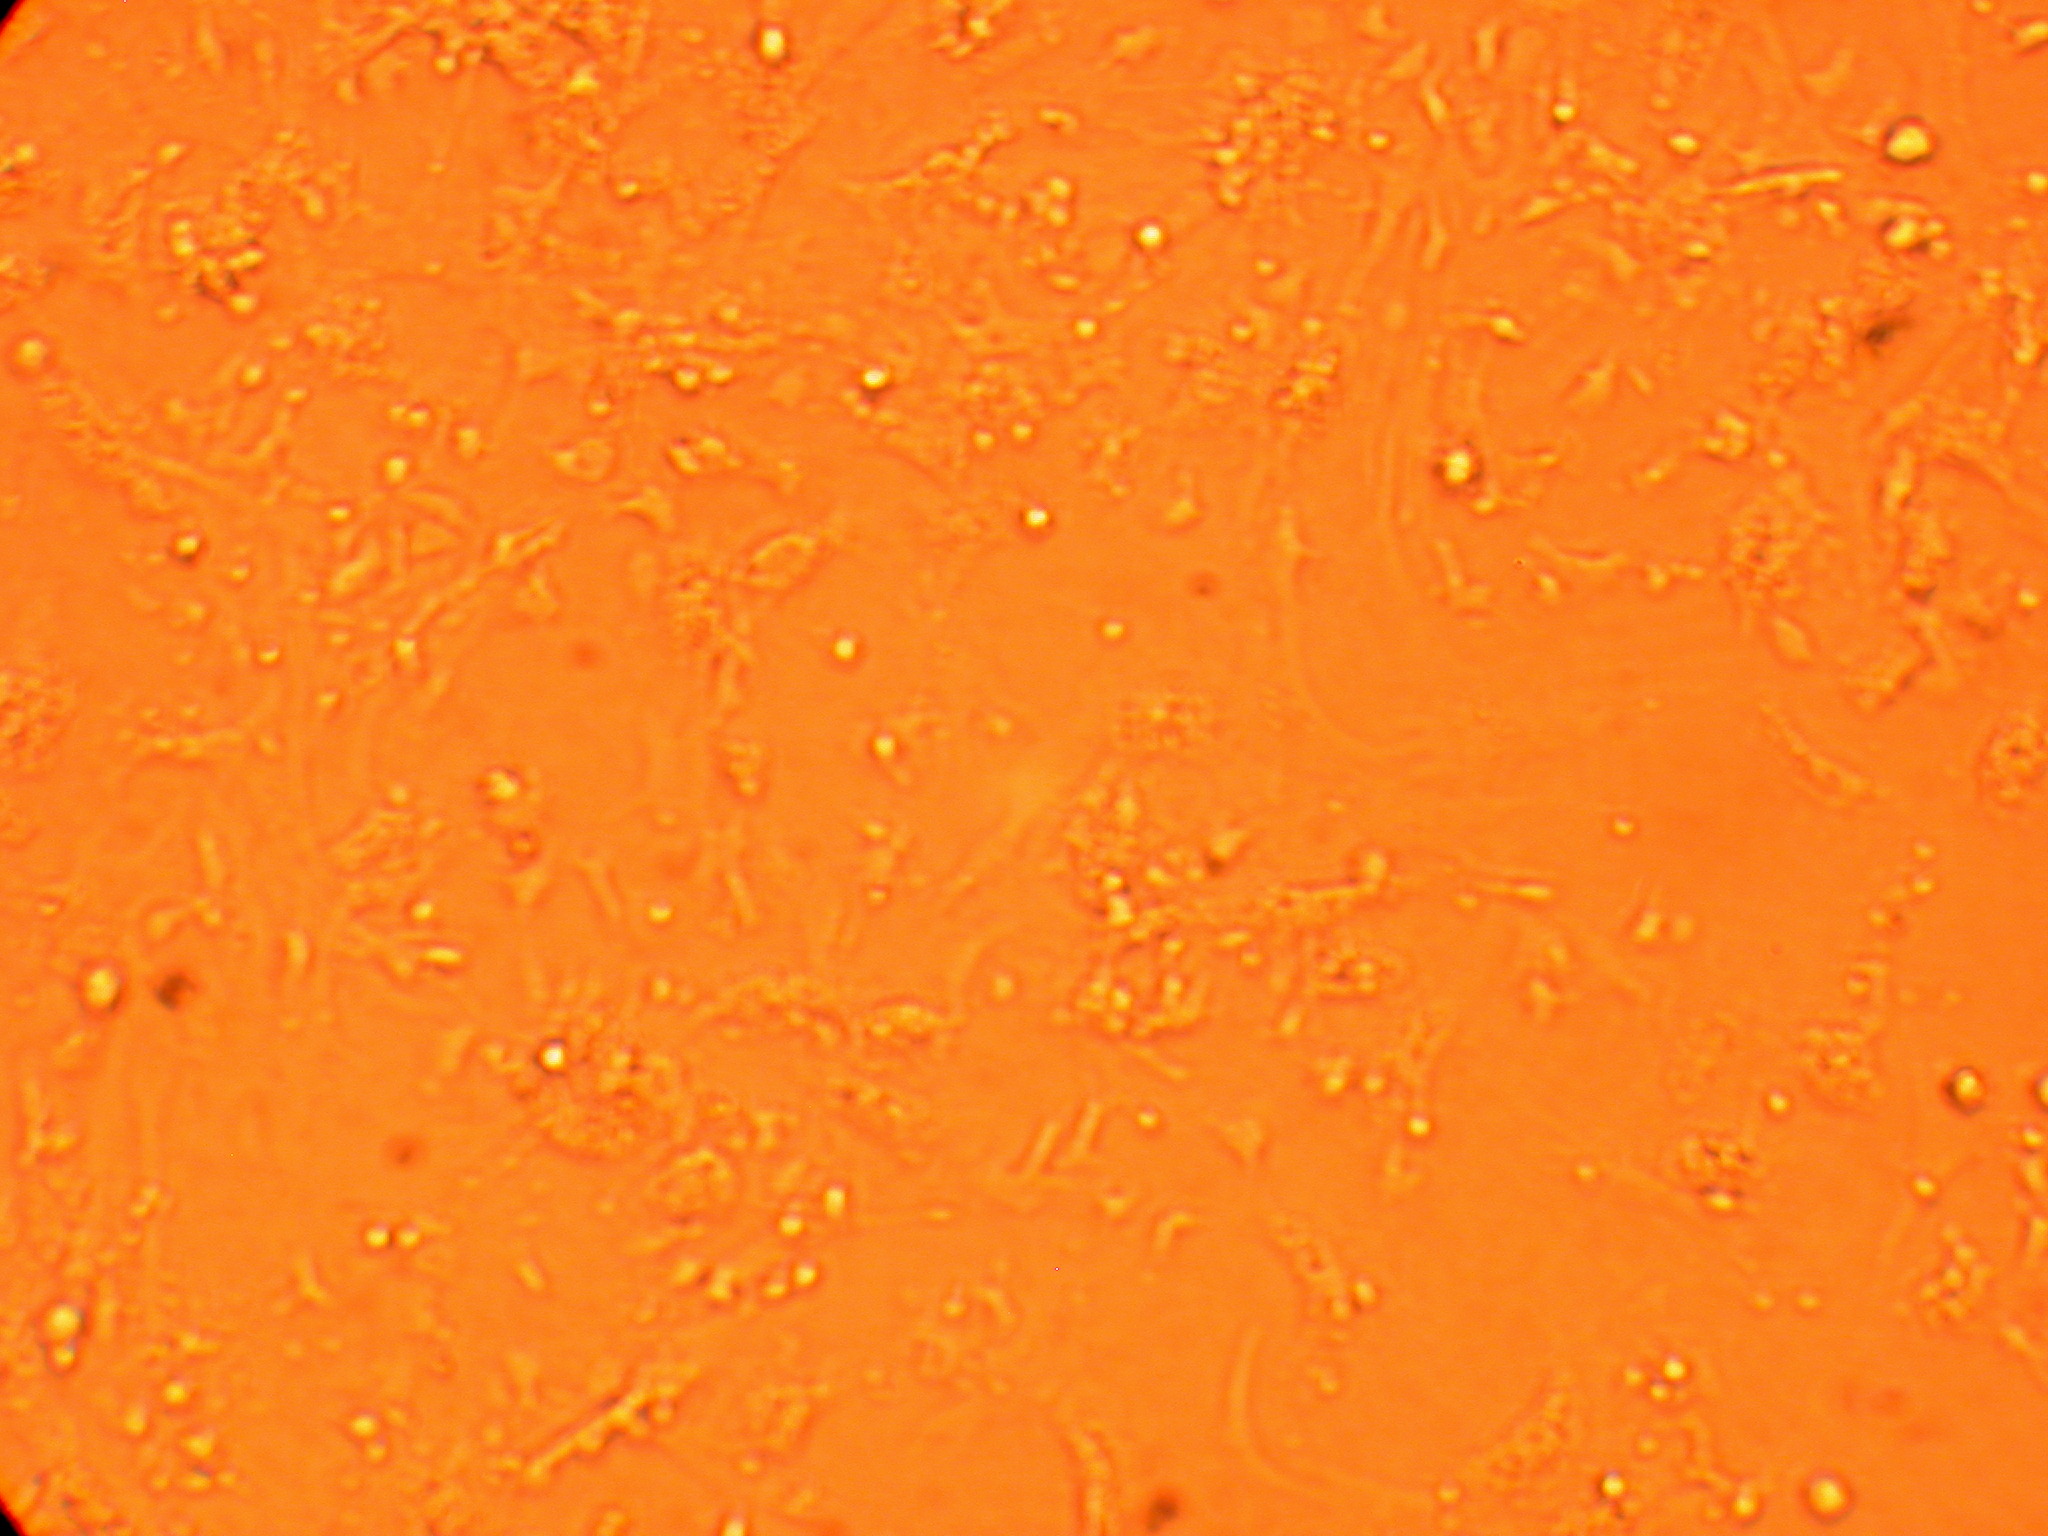
Again, observed hemocytes under inverted microscope at 200x and, this time, took pictures of the eight wells (4 washed and 4 unwashed). The pictures were edited (varied contrast, brightness, color levels, etc.) to obtain a picture where various cells could be seen more clearly.
| Washed Wells (1 hour after plating) |
Unwashed Wells |
 |
|
After pictures were taken, the wells were washed and another set of pictures were taken under the inverted microscope at 400x and edited as well.
| Initially Washed Plates |
Initially Unwashed Plates |
4-22-09
Observed hemocytes under inverted microscope and saw them adhering well, both washed and unwashed plates. Read several articles regarding hemocytes and had many questions raised from it.
4-21-09
Learned to bleed oysters and obtained hemocyte. This batch was then examined under a microscope to verify that there actually were hemocyte cells (alive). After verification, sterile seawater was added to the batch of samples following a .4mL sterile seawater for 1mL of obtained sample (antibiotics were supposed to have been added to the sterile sea water beforehand but was disregarded this time). the sterile sea water treated samples were placed in Poly-D-Lysine treated wells (out of the 12 wells, 9 were filled). They were left for an hour to adhere to the bottom of the plate and were observed under an inverted microscope. After observing the cells were adhereing, four of the wells were washed with sterile seawater and left in the fridge overnight (the optimal temperature is about 12 degrees celsius but the fridge was the only available container close to that temperature).
4-17-09
Looked at the oyster tissue PCR ran by Sam and Dr. Roberts in the morning. Compiled a spreadsheet containing the results of Dermo PCR, oyster PCR, and DNA Quanting regarding Plate 6 from column 1 through 6. The results obtained were a irregular. Perhaps a rerunning of DNA quanting via Standards in Layout would solidify our results of uncertainty.
4-16-09
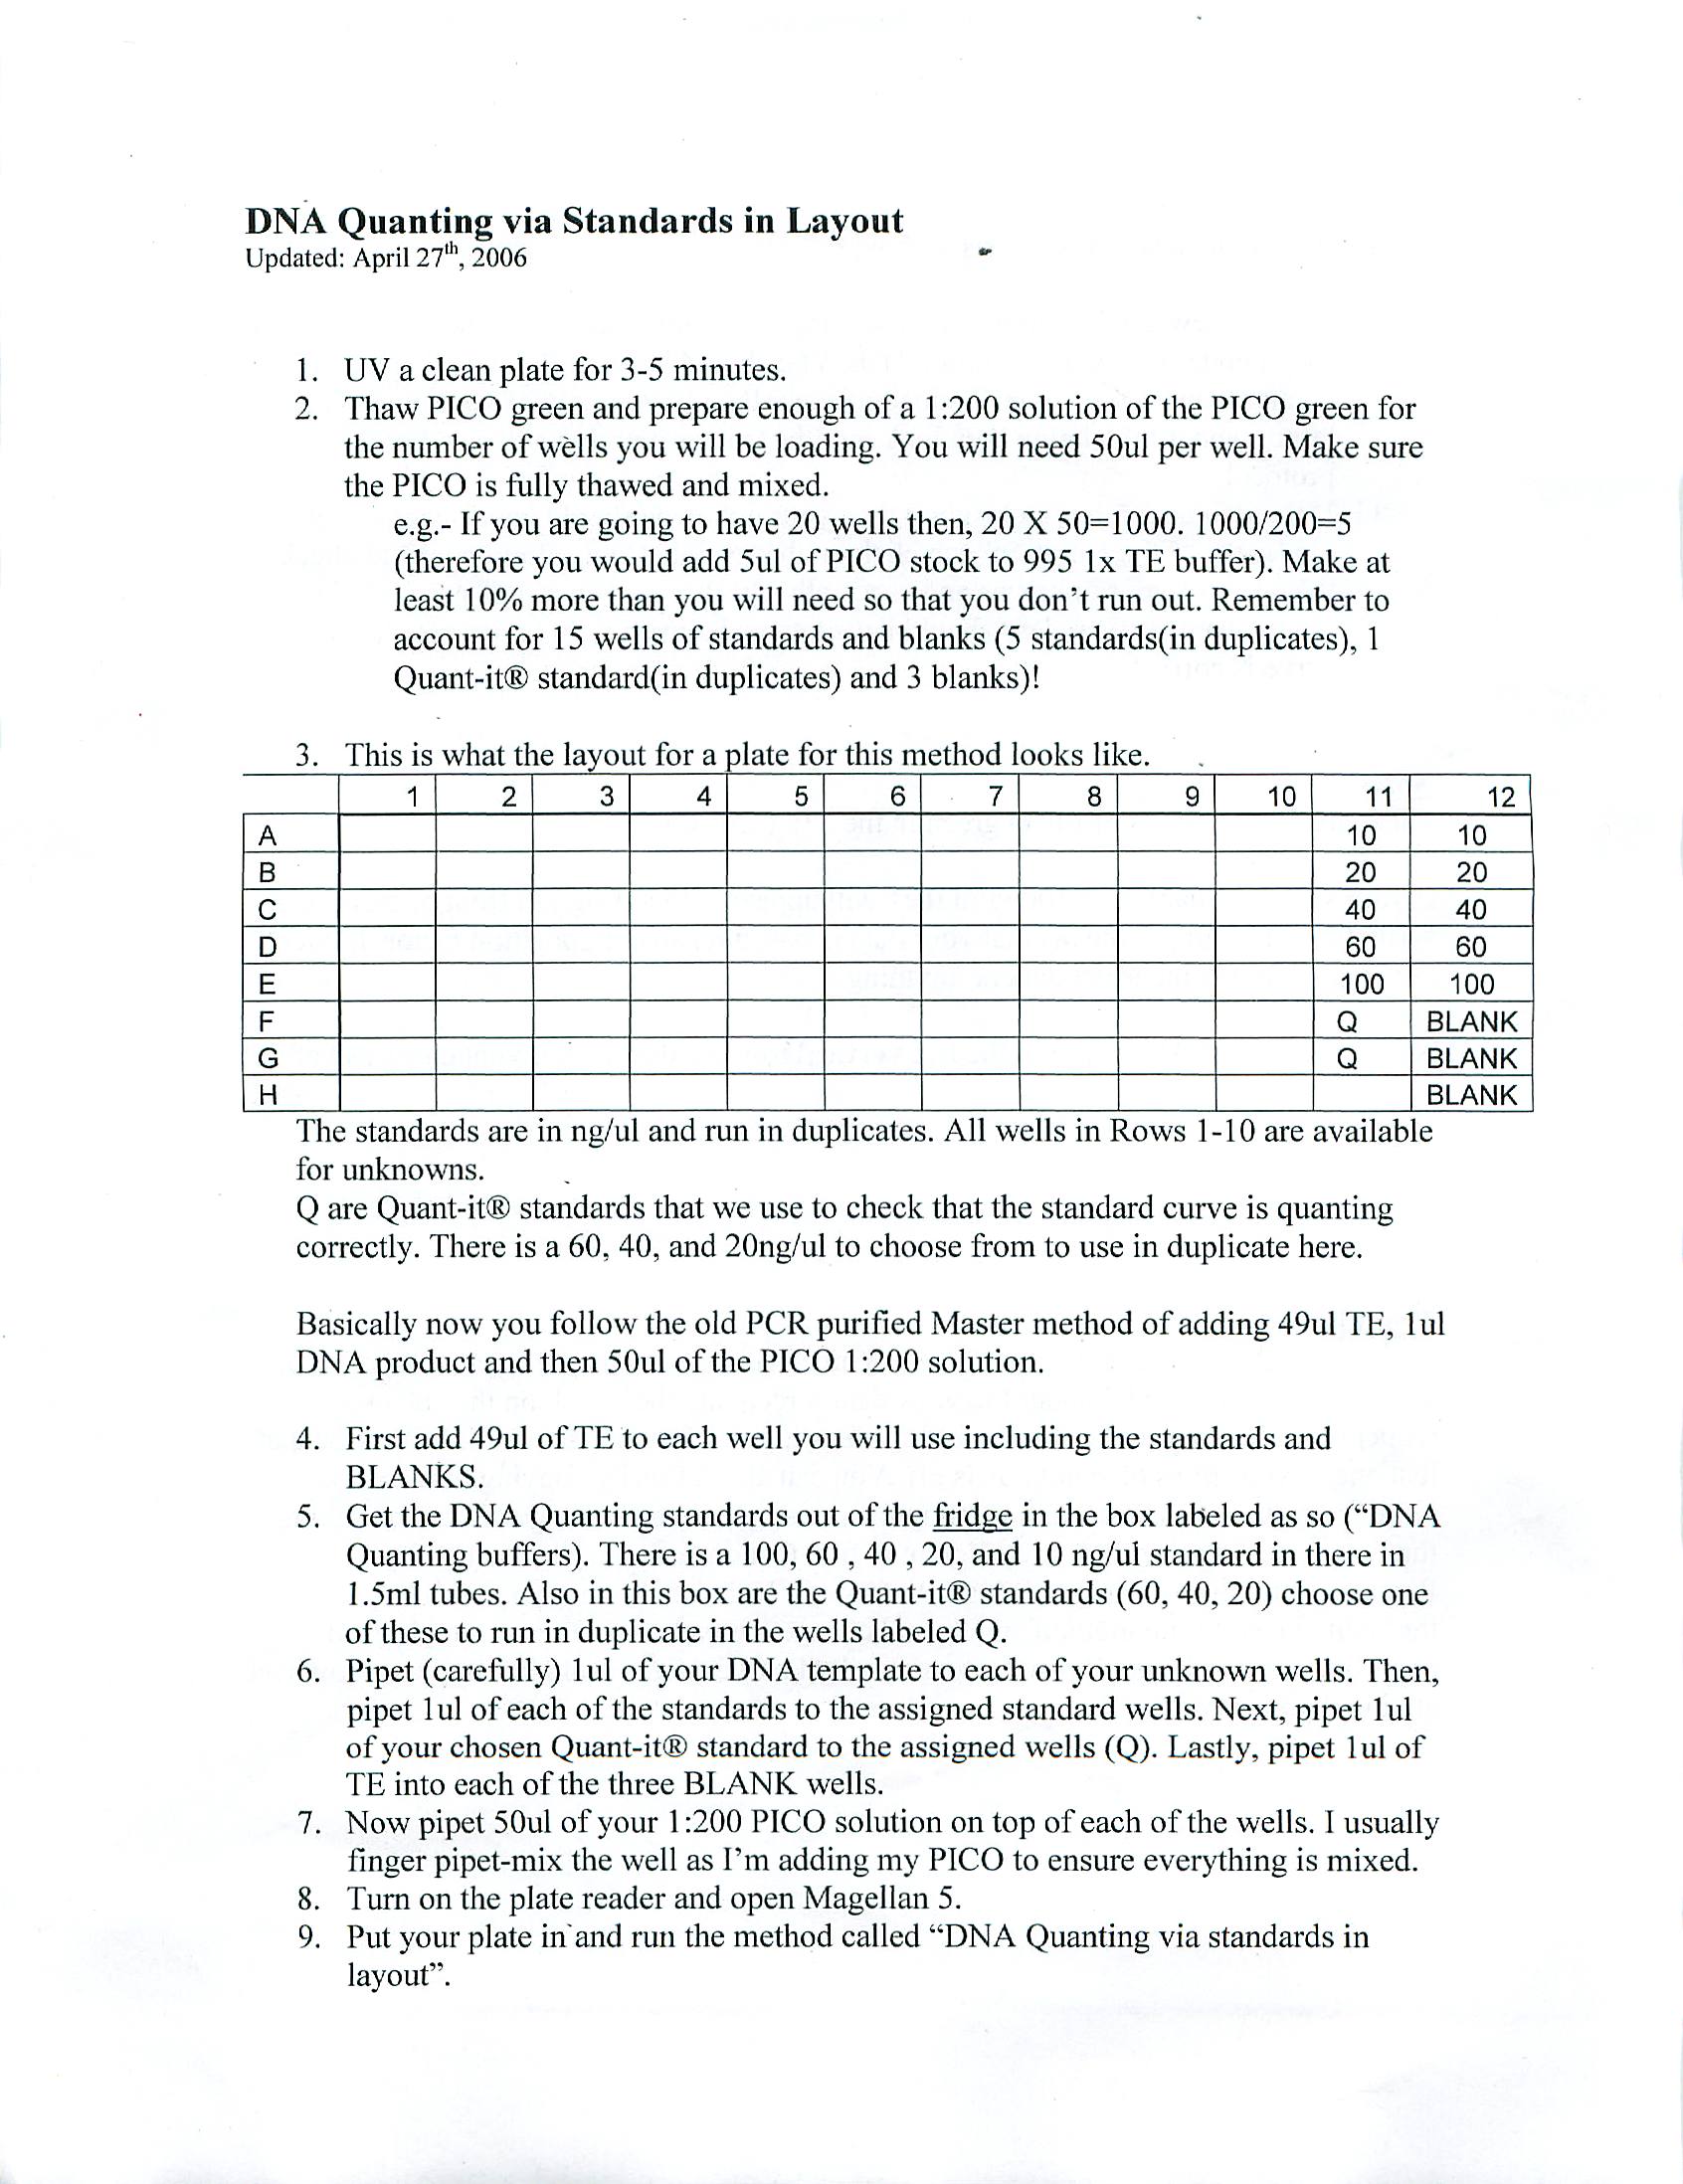
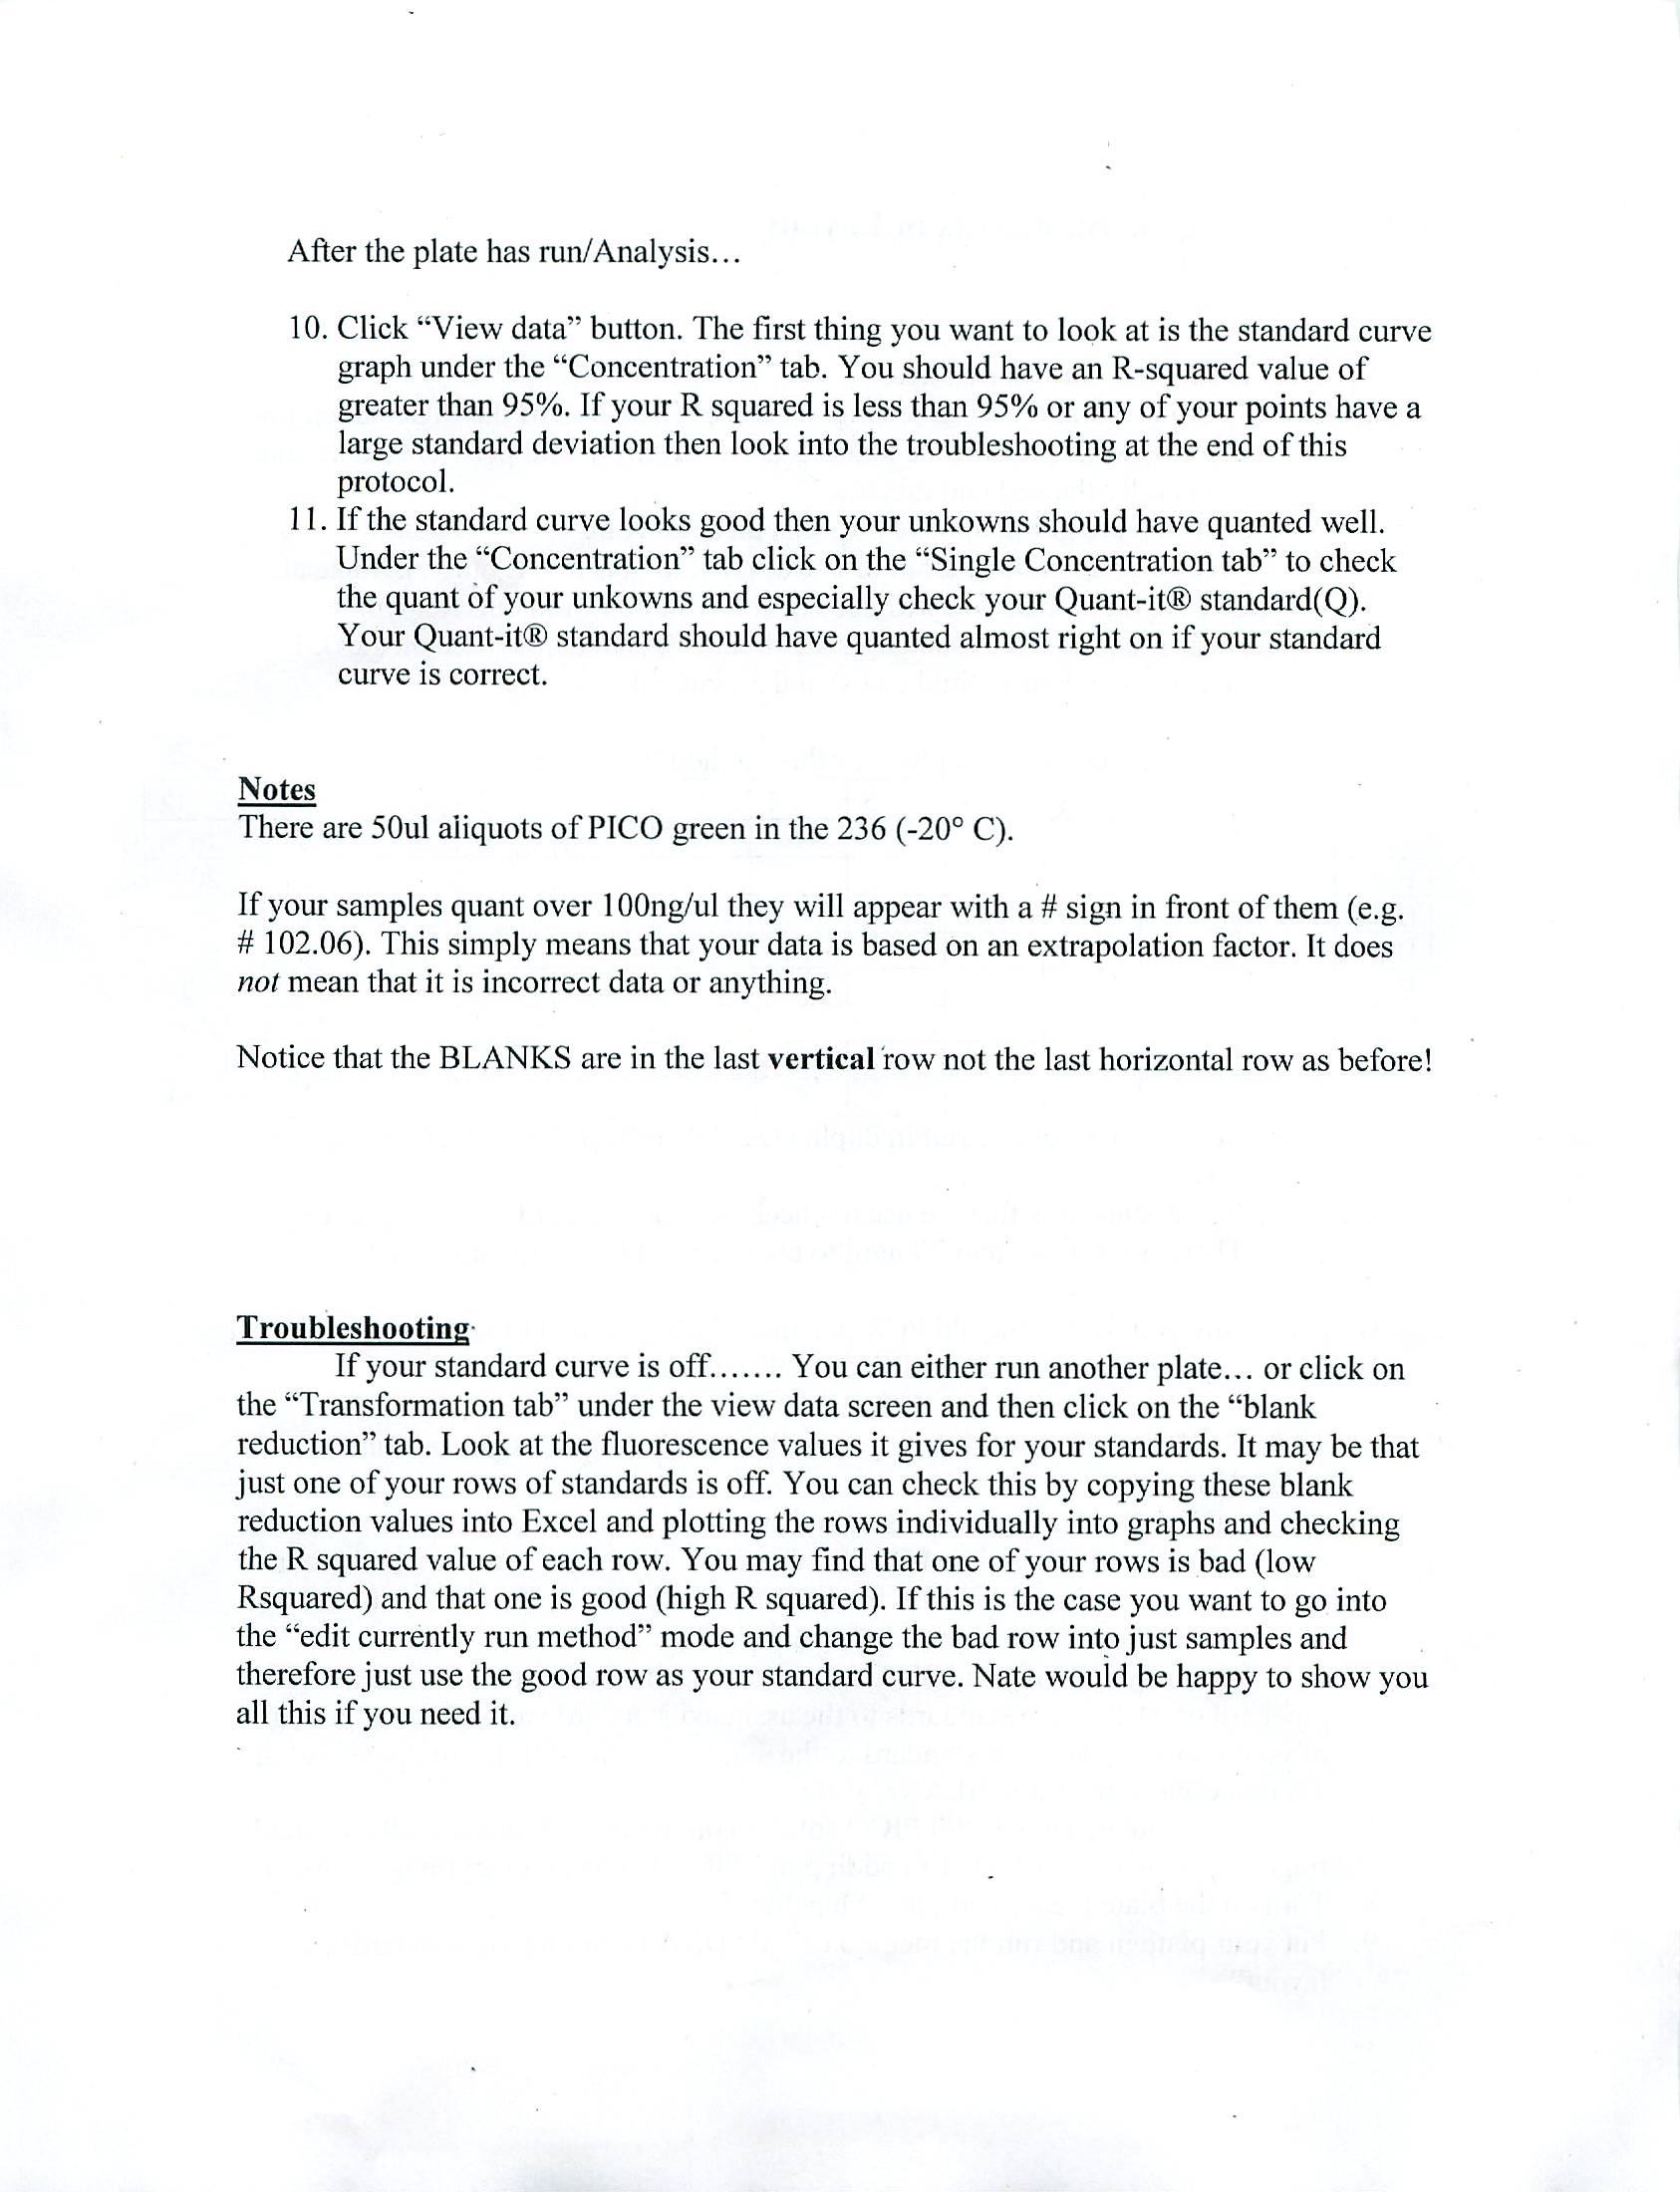
Proceeded the Dermo experiment with DNA Quanting via Standards in Layout (see protocol below) due to irregularities in real-time PCR data; there were some outliers regarding C(t) number and copy number. A graph was produced and outliers were noted and discussed. For similar C(t) numbers, the range in copy numbers varied greatly and raised questions. DNA Quanting via Standards in Layout was actually used to determine whether there were even any DNA in the samples, for there was a concern among the positive samples and negative samples--it would show if any DNA was present at all.
The two plates selected were Plate 6 (20 positive samples as stated by real-time PCR) and Plate 14 (0 to one samples as stated by real-time PCR). We noted 80 samples for each plate and used 160 plates for samples. However, we also needed to consider 15 extra wells for each plate, as well as an extra 10% for safety. However, the results were frustrating as Magellan 5 (program for DNA quanting) stated there were only 3 samples in Plate 6. Real-time PCR will be run by Sam/Dr. Roberts tomorrow using different primers to amplify oyster genes.
3-09-09
Prepared salmon samples for mRNA isolation by following MicroPoly(A)Purist: Small Scale mRNA Purification Kit manual. Left the samples to precipitate overnight.
Was notified of arrival of new scallop reverse primer and proceeded with Scallop experiment. Prepared Bay, Sea, Bay (male) Sea (female) Hybrid, Bay (female) Sea (male) Hybrid samples for PCR reaction. Note that there was one forward primer for both scallops but two reverse primers--one for each scallop; this was the only difference between the samples besides the template. There were a total of 8 samples:
1. Bay Scallop
2. Sea Scallop
3. Bay (male) Sea (female) Hybrid w/ Bay Reverse Primer
4. Bay (male) Sea (female) Hybrid w/ Sea Reverse Primer
5. Bay (female) Sea (male) Hybrid w/ Bay Reverse Primer
6. Bay (female) Sea (male) Hybrid w/ Sea Reverse Primer
7. Water Control w/ Bay Reverse Primer
8. Water Control w/ Sea Reverse Primer
They were left in the thermal cycler to go through the reactions using the following steps:
1. 95 degrees Celsius for 10:00 minutes
2. 40 Cycles of:
a. 95 degrees Celsius 00:45 seconds
b. 53 degrees Celsius 00:45 seconds
c. 72 degrees Celsius 01:00 minutes
3.72 degrees Celsius for 10:00 minutes
4. 4 degrees Celsius forever
5. End
The samples were left in the thermal cycler to run through the reactions.
3-06-09
Used the spectrophotometer to determine concentration of RNA in the thirty salmon samples (Salmon Experiment). Was informed that mRNA were to be isolated from the samples would go through differential display. The samples were pooled according to the three different sites/stages they were collected in (Hansen Creek Entering, Hansen Creek Senescent, Iliamna Ponds Senescent).
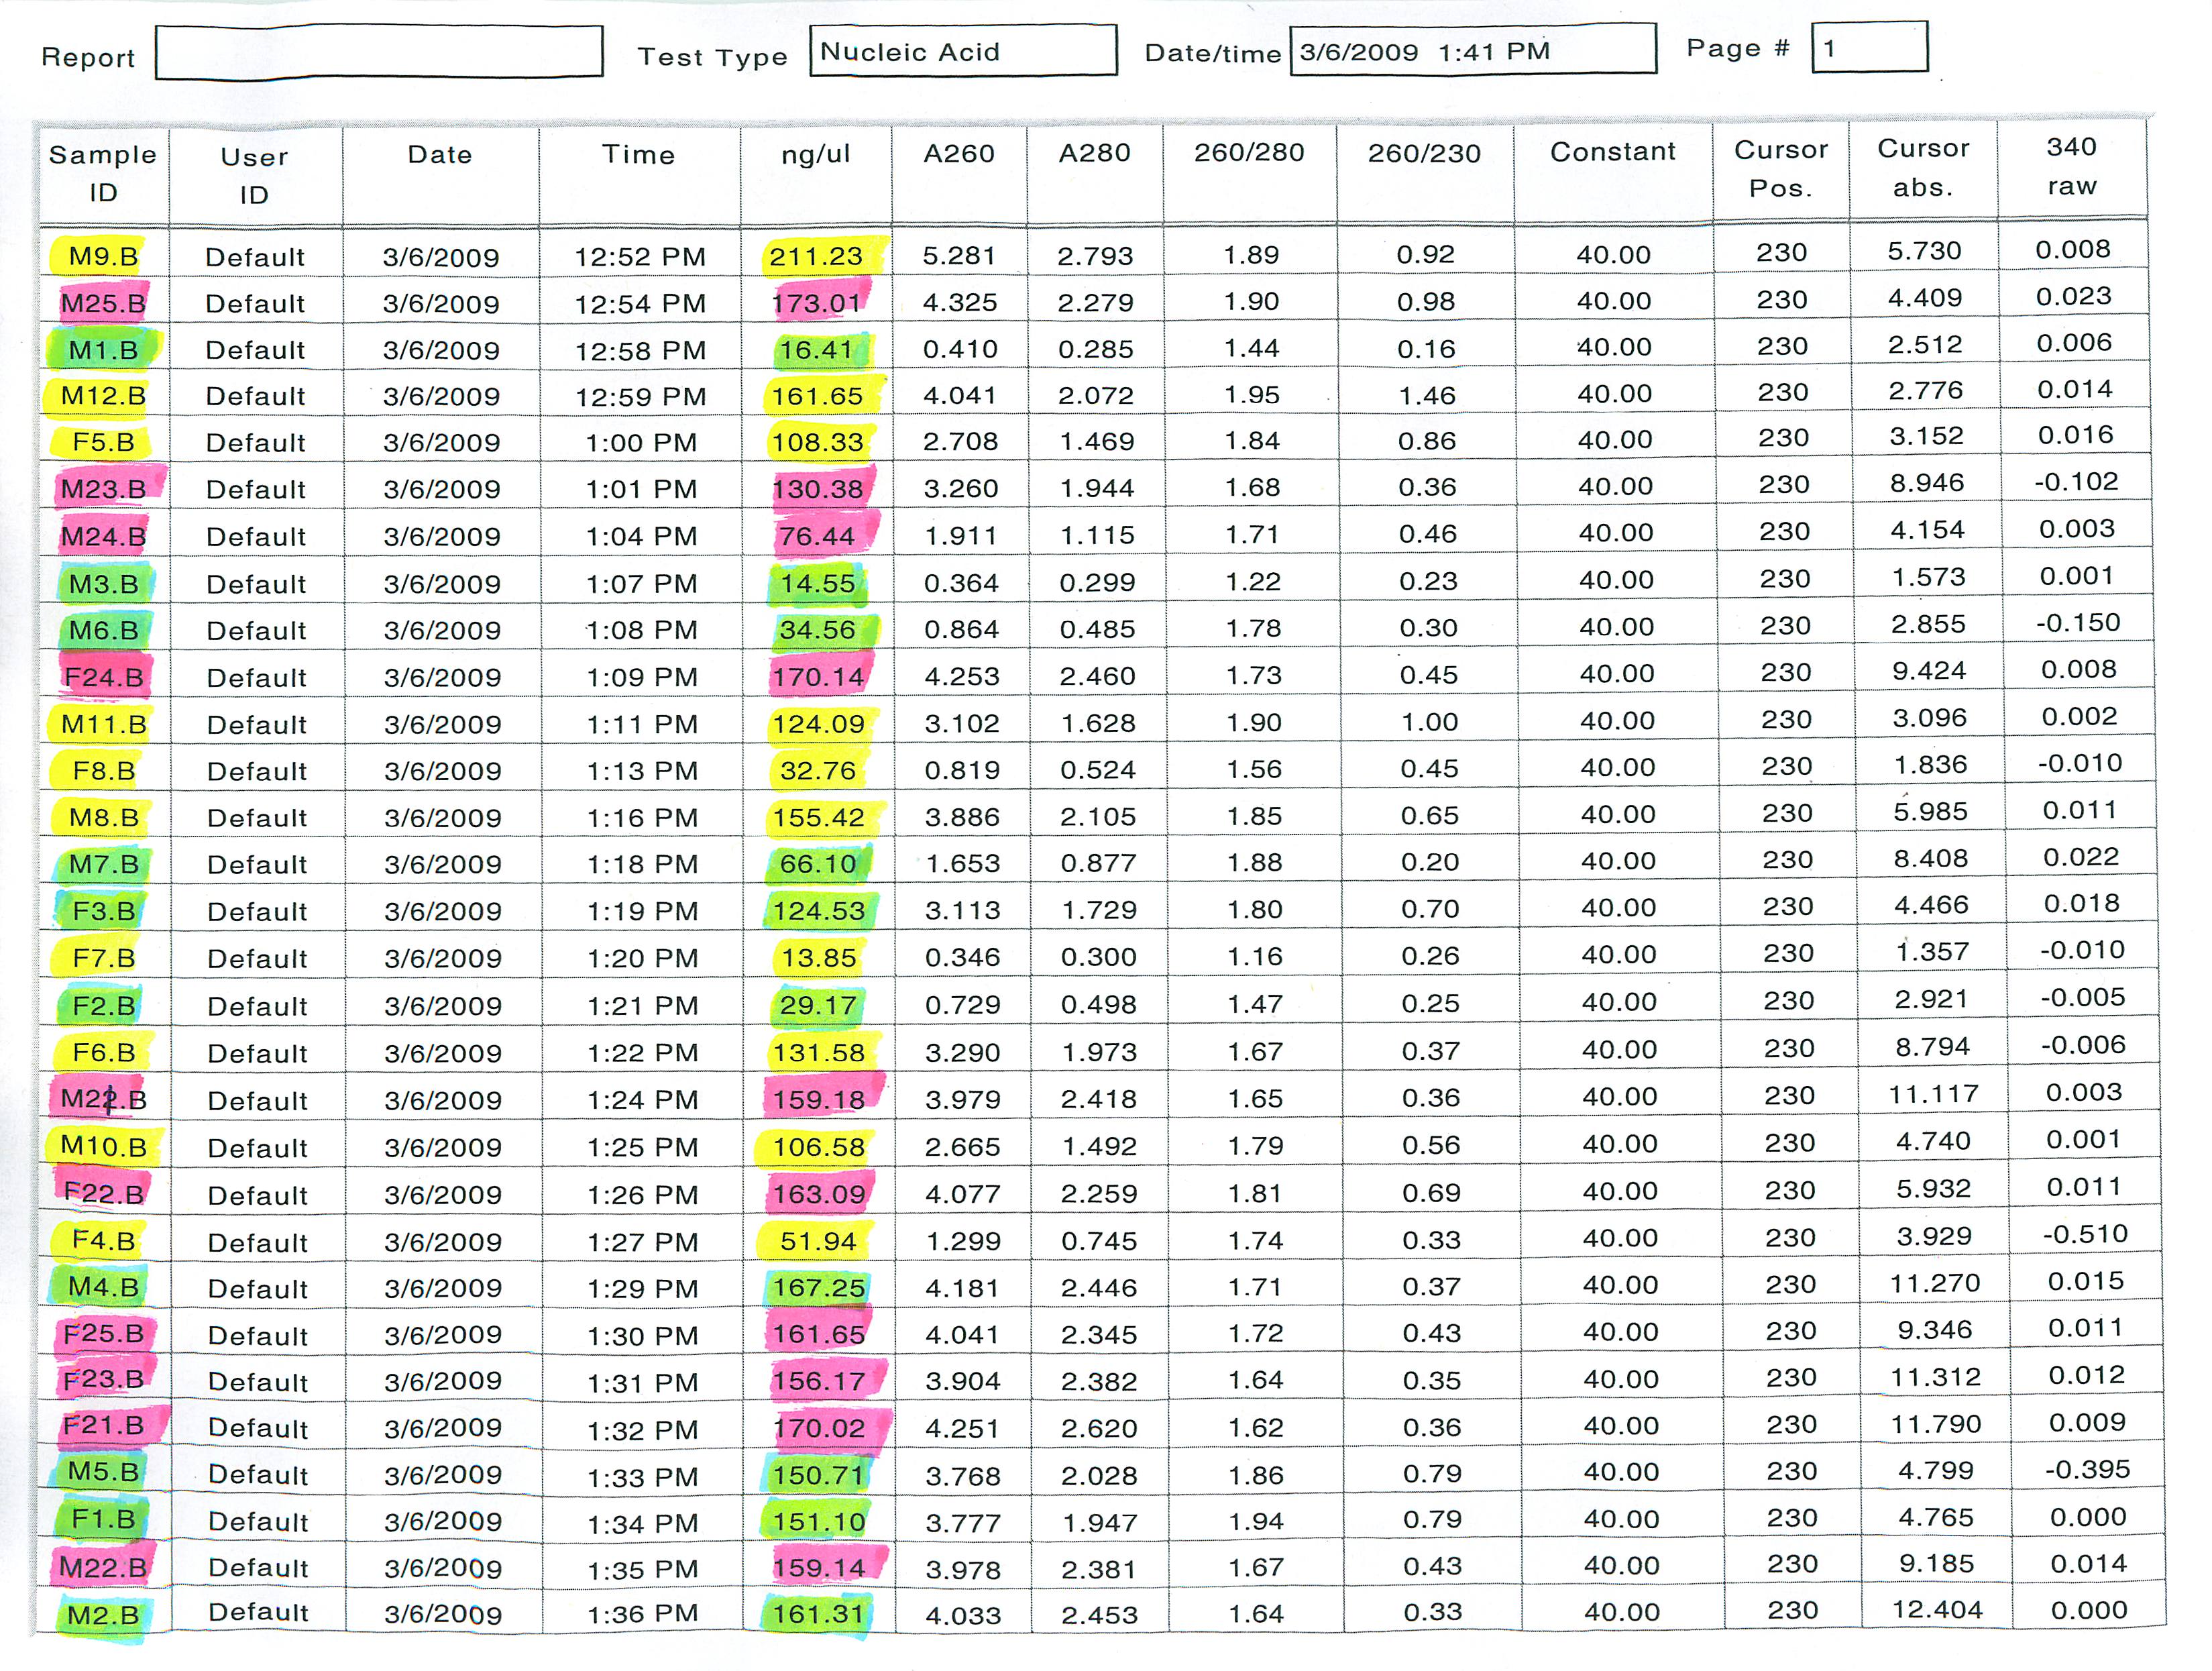
Yellow - Hansen Creek Senescent
Green - Hansen Creek Entering
Pink - Iliamna Ponds Senescent
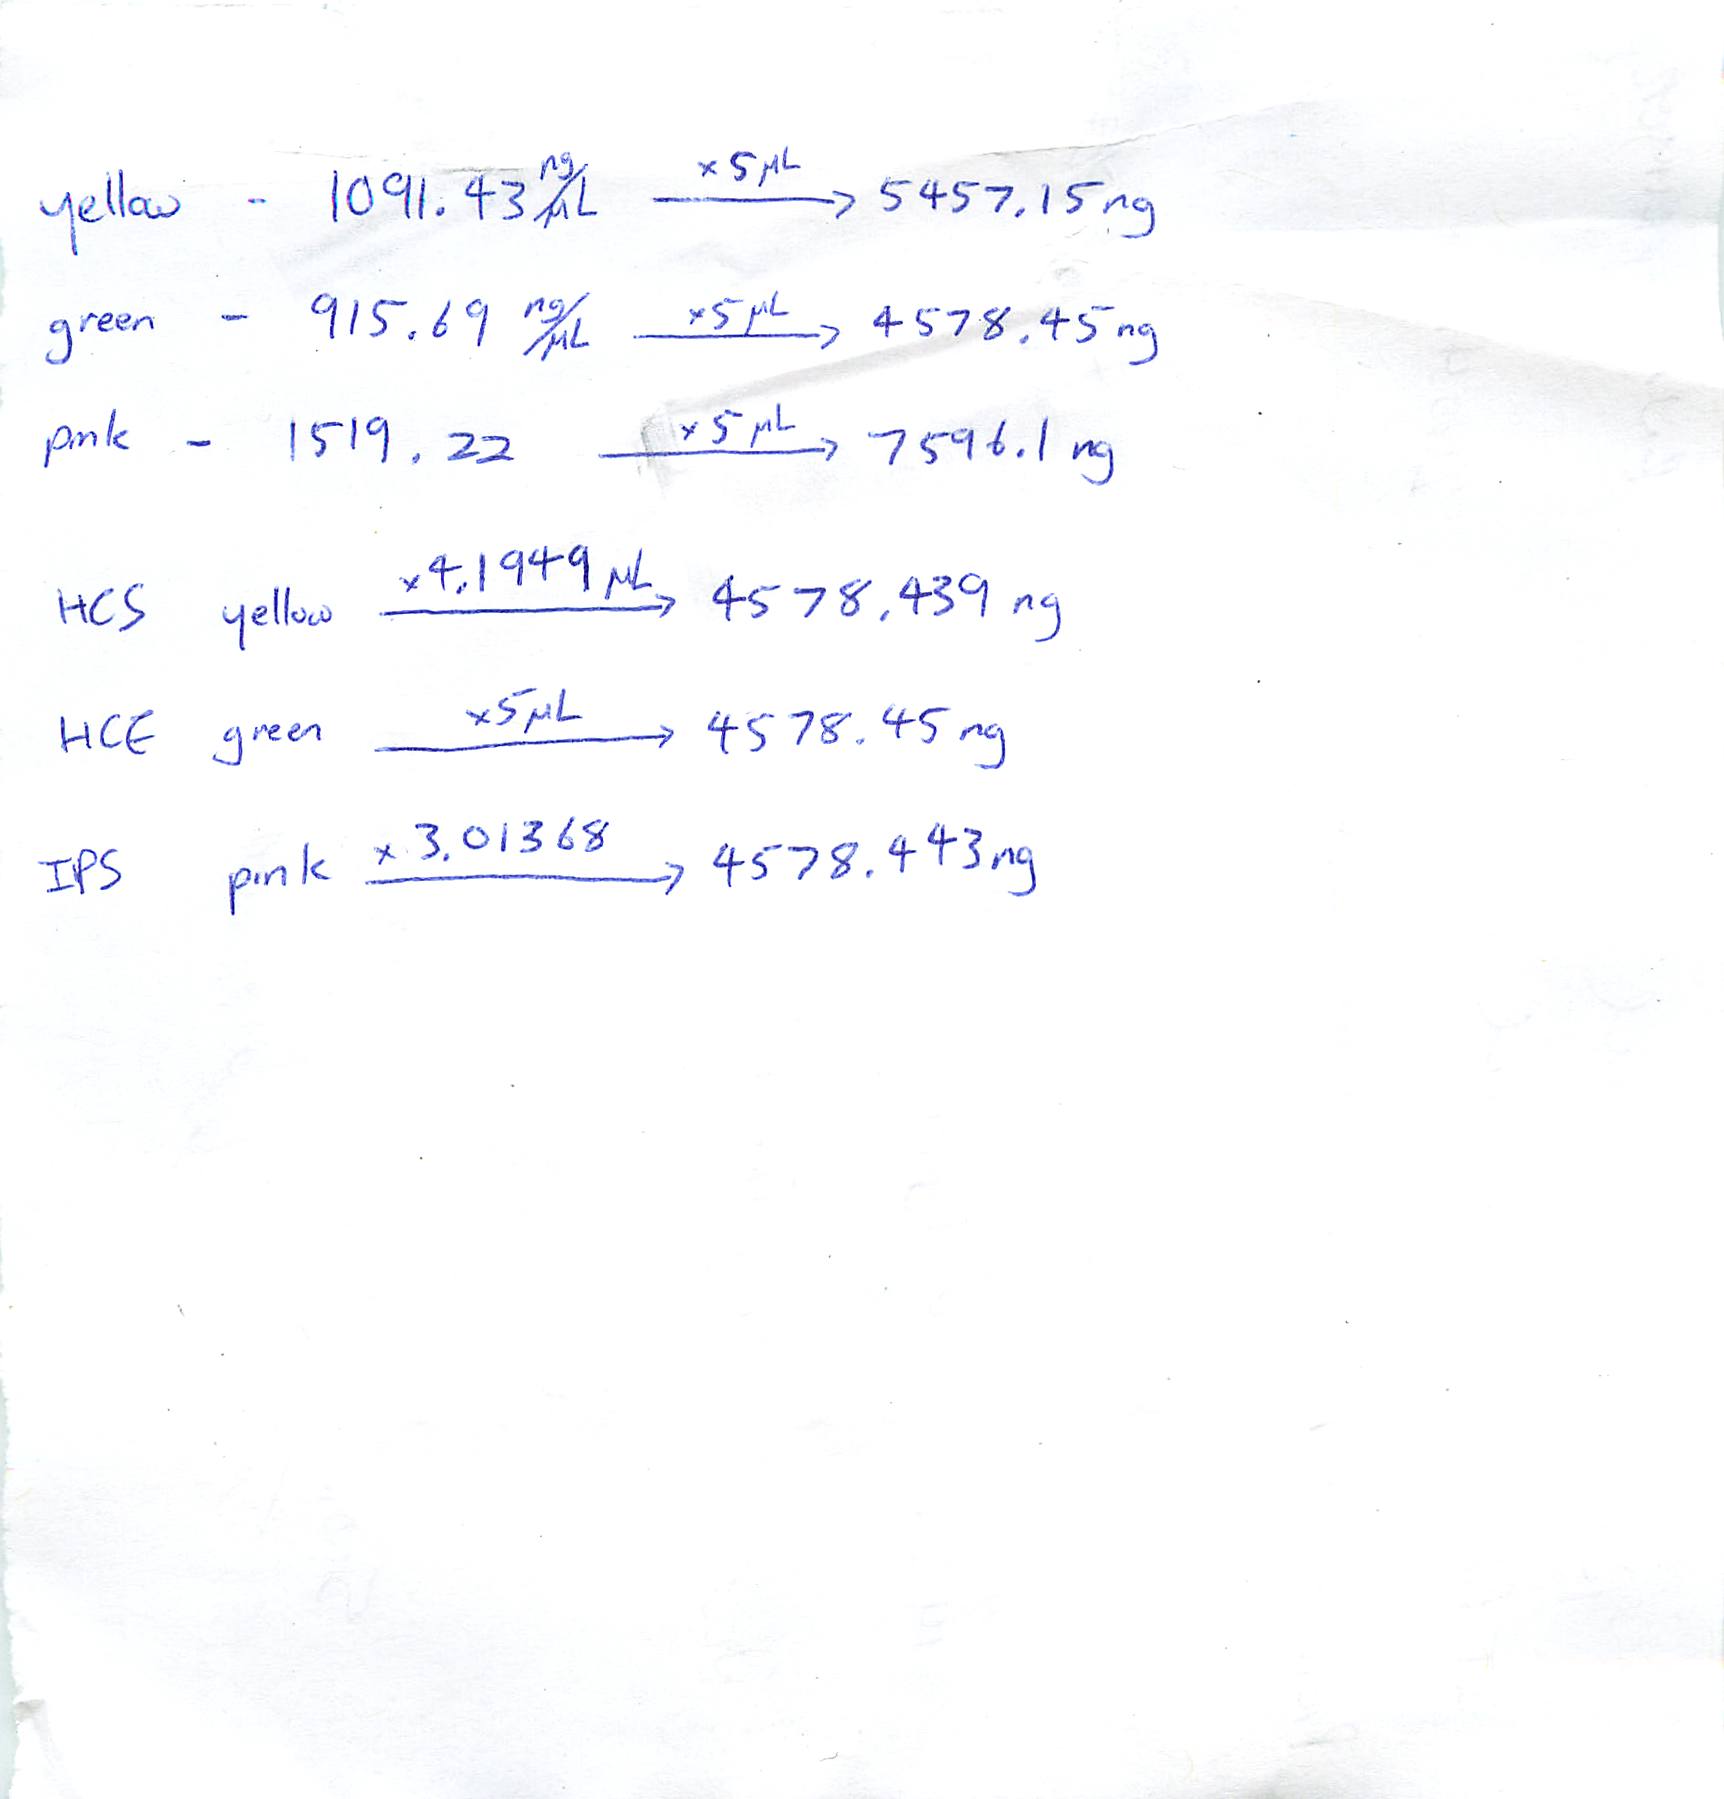
In order to pool them correctly, we had to make sure the same amount of RNA ended up in each of the pools (nanograms). With the known concentrations, the following calculations were made:
Combined Concentration of yellow - 1091.43 ng/microL
Combined Concentration of green - 915.69 ng/microL
Combined Concentration of pink - 1519.22 ng/microL
We decided to go with a total amount of ~4578.45 ng in each of the pools because that meant 5 microliters of each sample from the green batch could be added to one pool (915.69 ng/microL * 5microL = 4578.45 ng--> 50microL total). The amount of samples to be added by each of the batches were calculated:
Yellow: (4578.45 ng) / (1091.43 ng/microL) = ~4.193 microliters of each sample--> 41.93microL total
Pink: (4578.45 ng) / (1519.22 ng/microL) = ~3.014 microliters of each sample--> 30.14microL total
3-05-09
Prepared to order new Reverse Primers for Bay Scallop actin gene with Sam using Geneious.
3-2-09
Went through Real-Time PCR data with Sam and Dr. Roberts. Some of the threshold values were changed based on Dr. Roberts and Sam's perspective of each plate. The following threshold values were changed:
Plate 5 - 0.009
Plate 6 - 0.013
Plate 10 - 0.016
Plate 12 - 0.005
Plate 14 - 0.020
Also plate 8 contained a sample which had a weird curve. The Real-Time PCR sheet was looked at and the well which was supposed to contain the weird sample was empty. It must have been some unknown condensation build up from the pipetting process.
2-27-09
Created a spreadsheet (Dermo Experiment - Positive Samples) of positive samples from Dermo experiment and shared it on googledoc with Sam and Dr. Roberts. Note that the threshold values of all the plates were manually set at 0.025. A solution was found to Plate 13 (see previous entree): the equation to determine the copy number from Plate 14, which was run on the same day, was used to determine the copy number of positive samples.
2-26-09
Looked at Plate 13 and saw that the standards were missing. I believe this is most likely because I did not put in the standards in the well before putting the plate in the PCR machine. I will find out what Dr. Roberts would like me to do about this. Prepared and ran Real-Time PCR Plates 14 and 15.
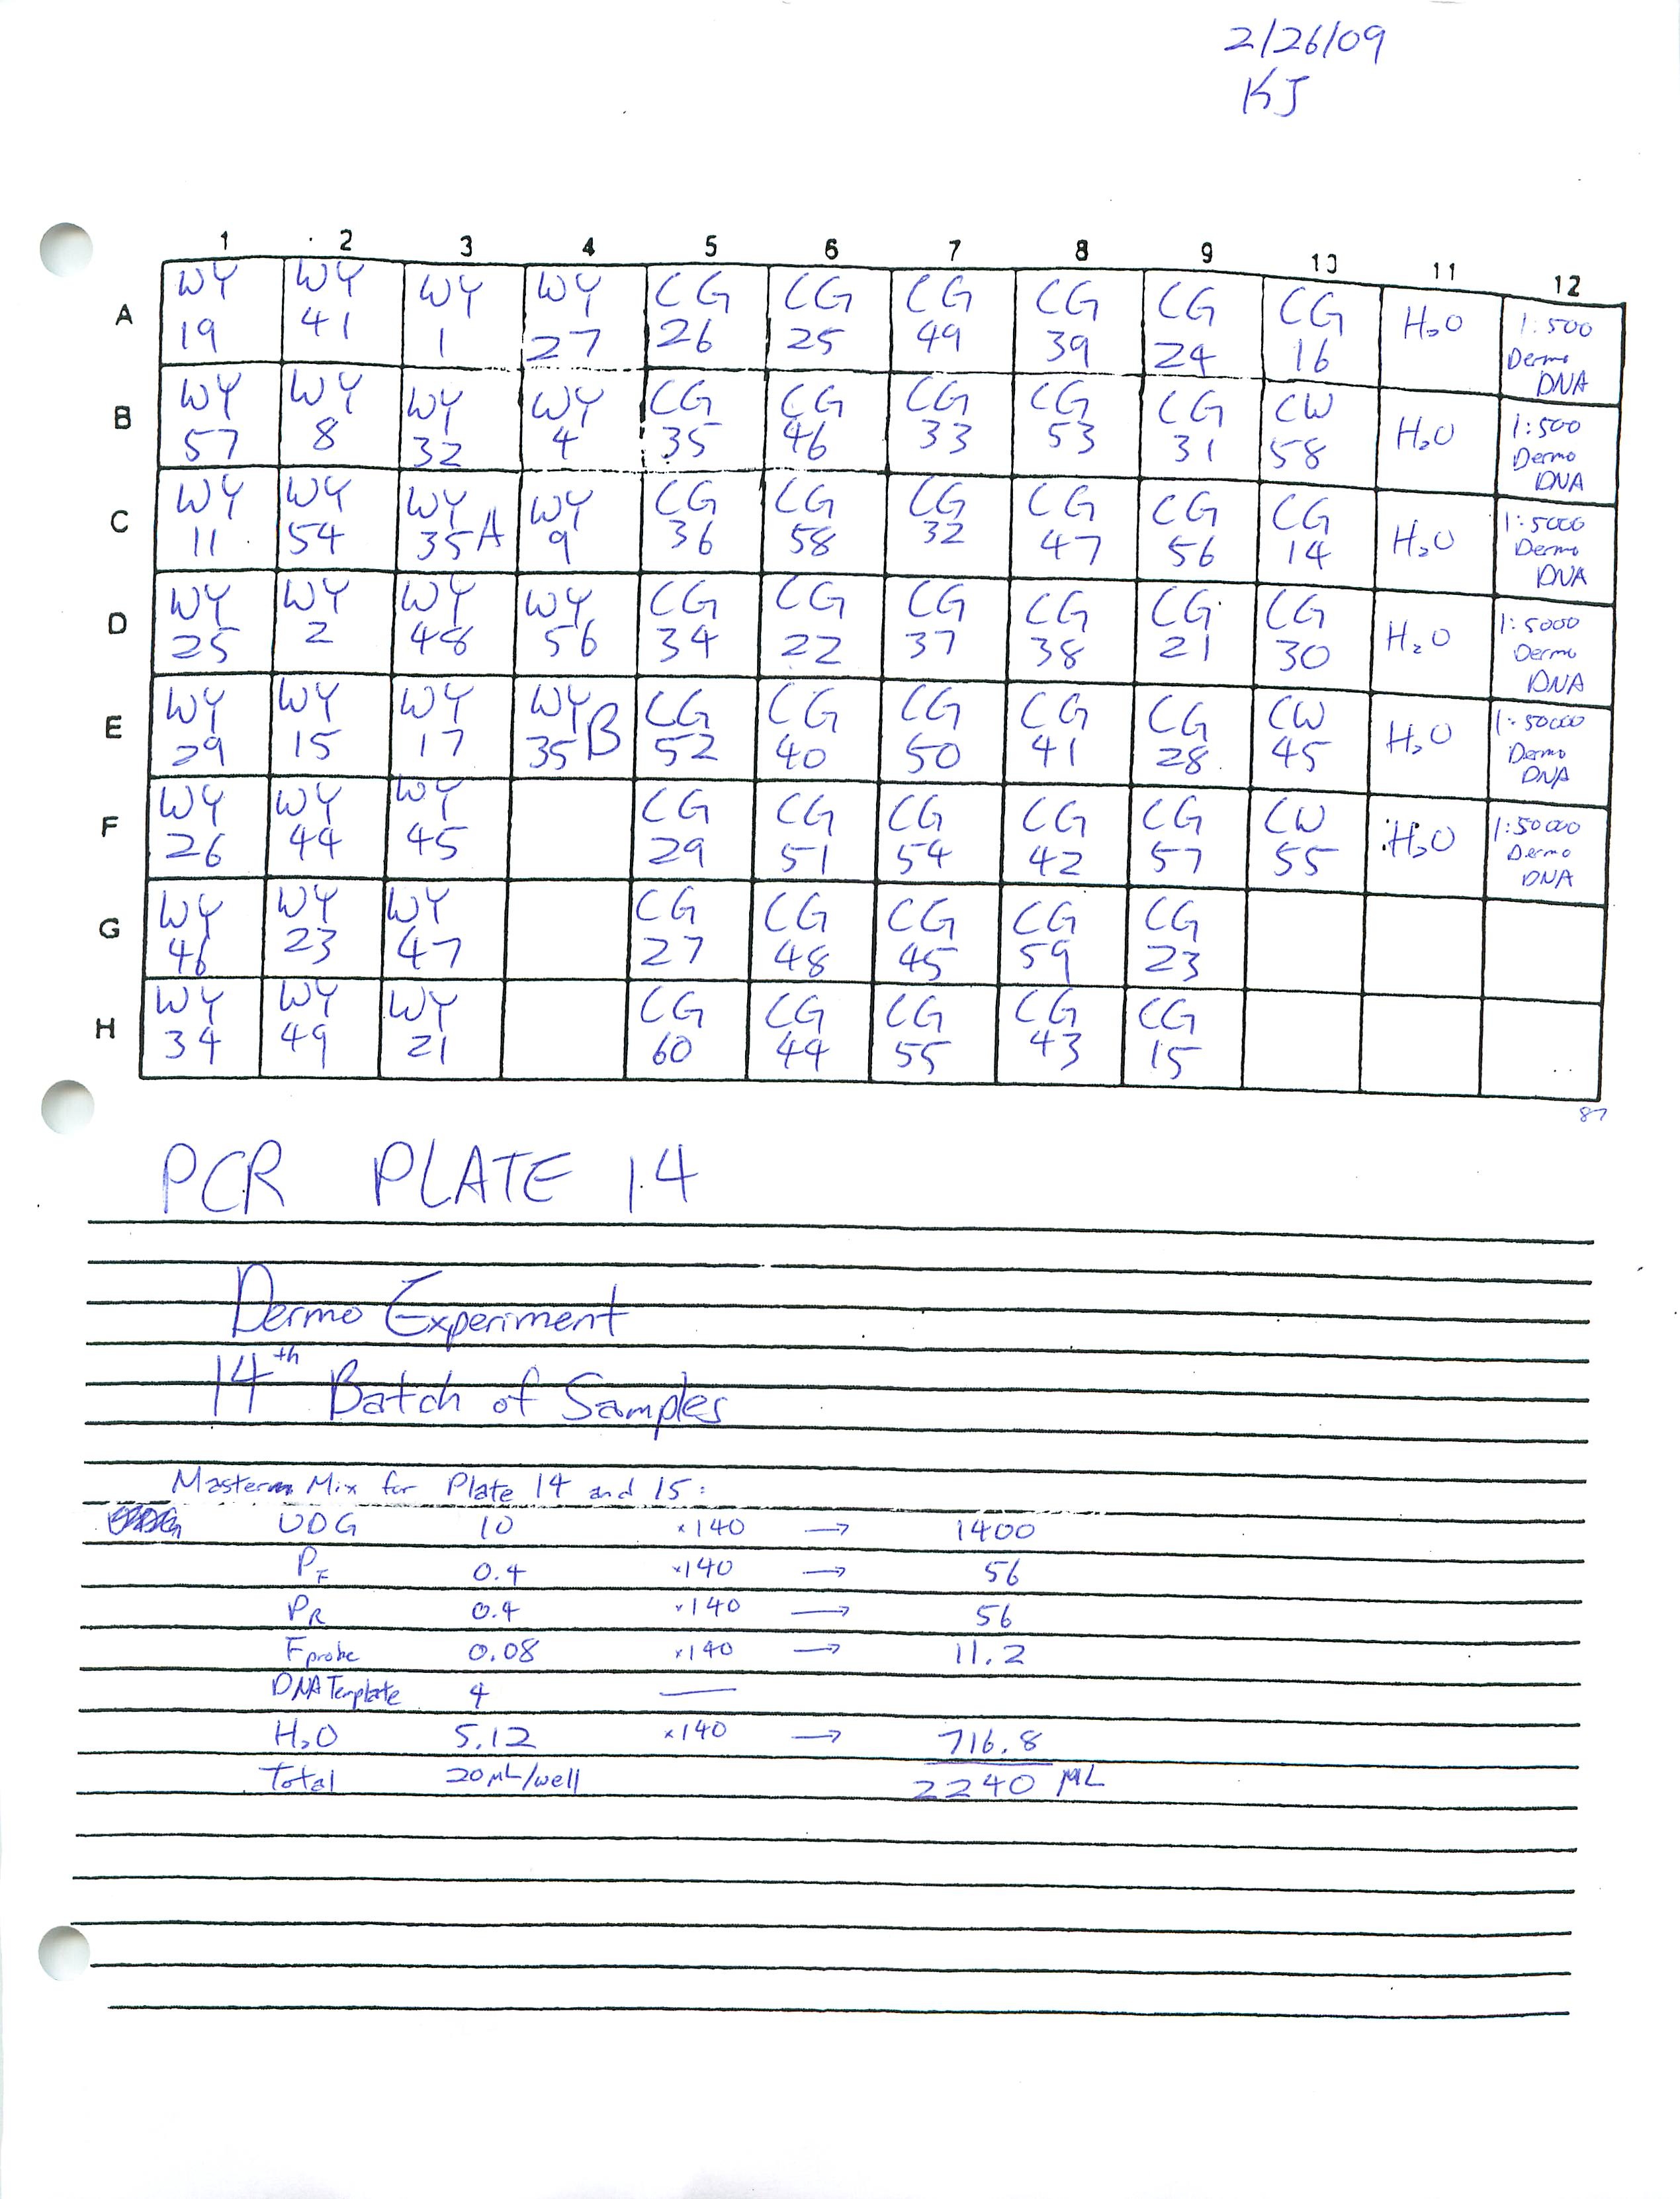
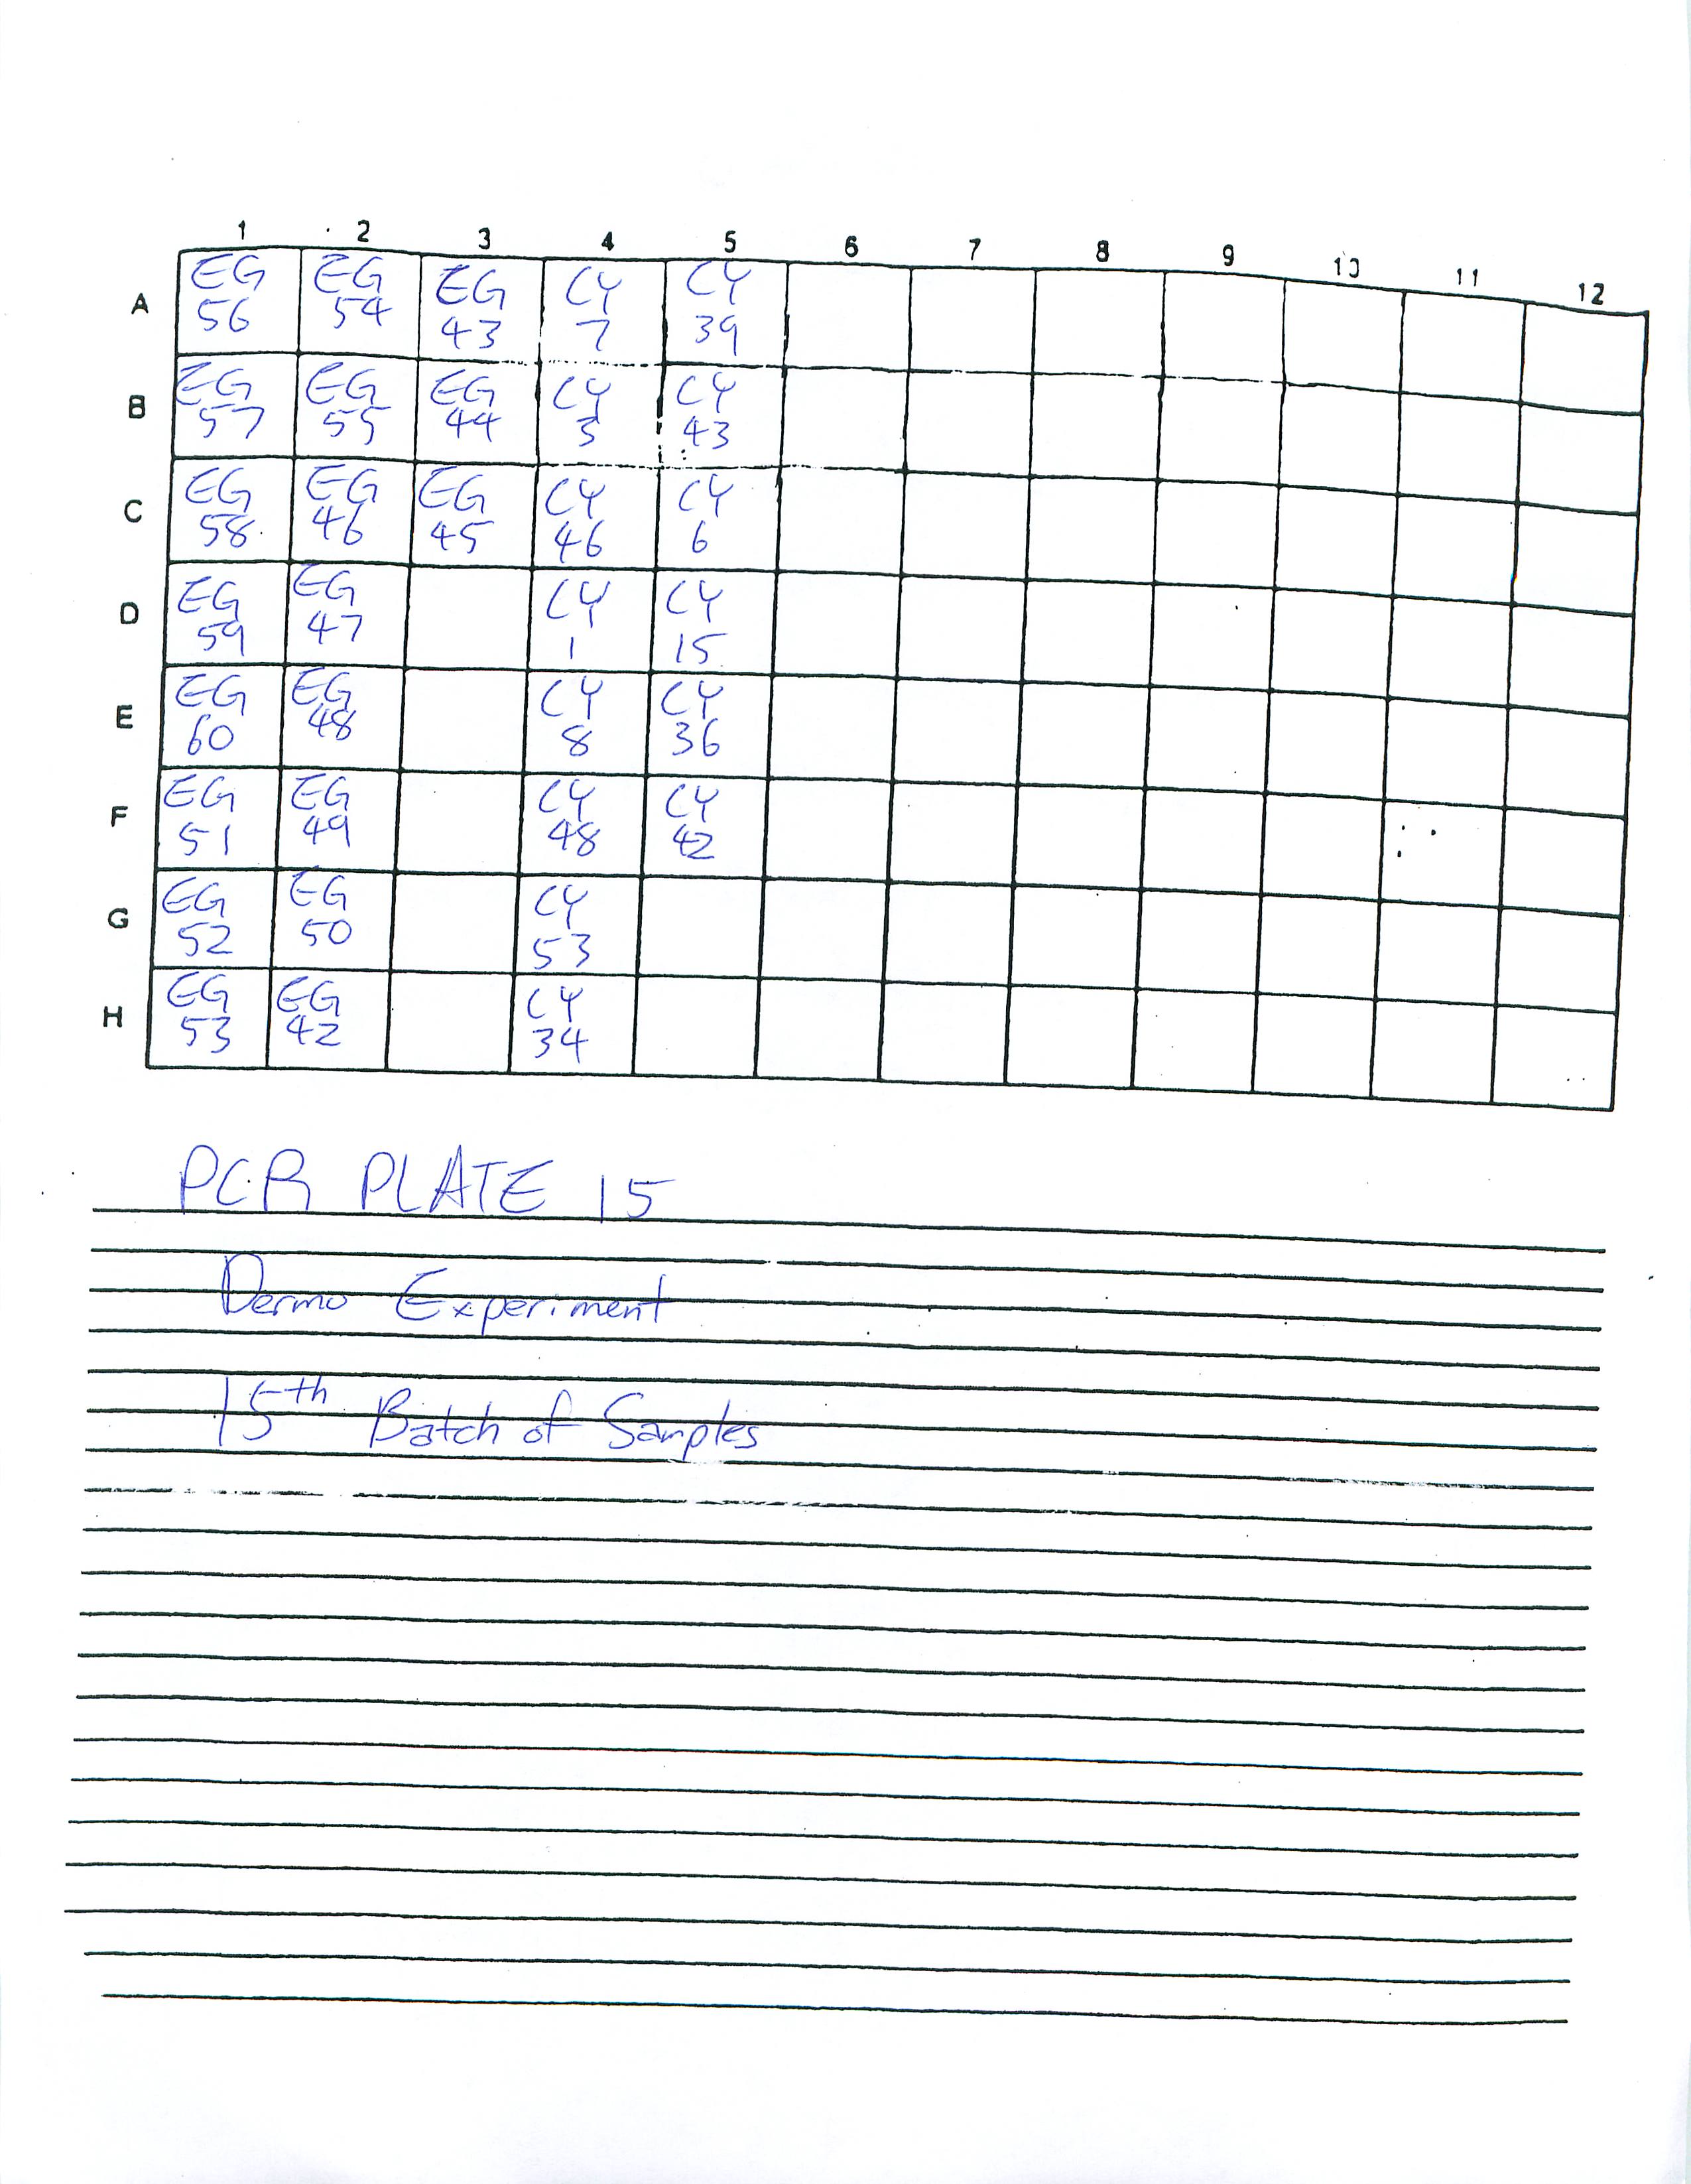
2-25-09
Prepared Real-Time PCR Plates 12 and 13 for Dermo Experiment and ran plate 12.
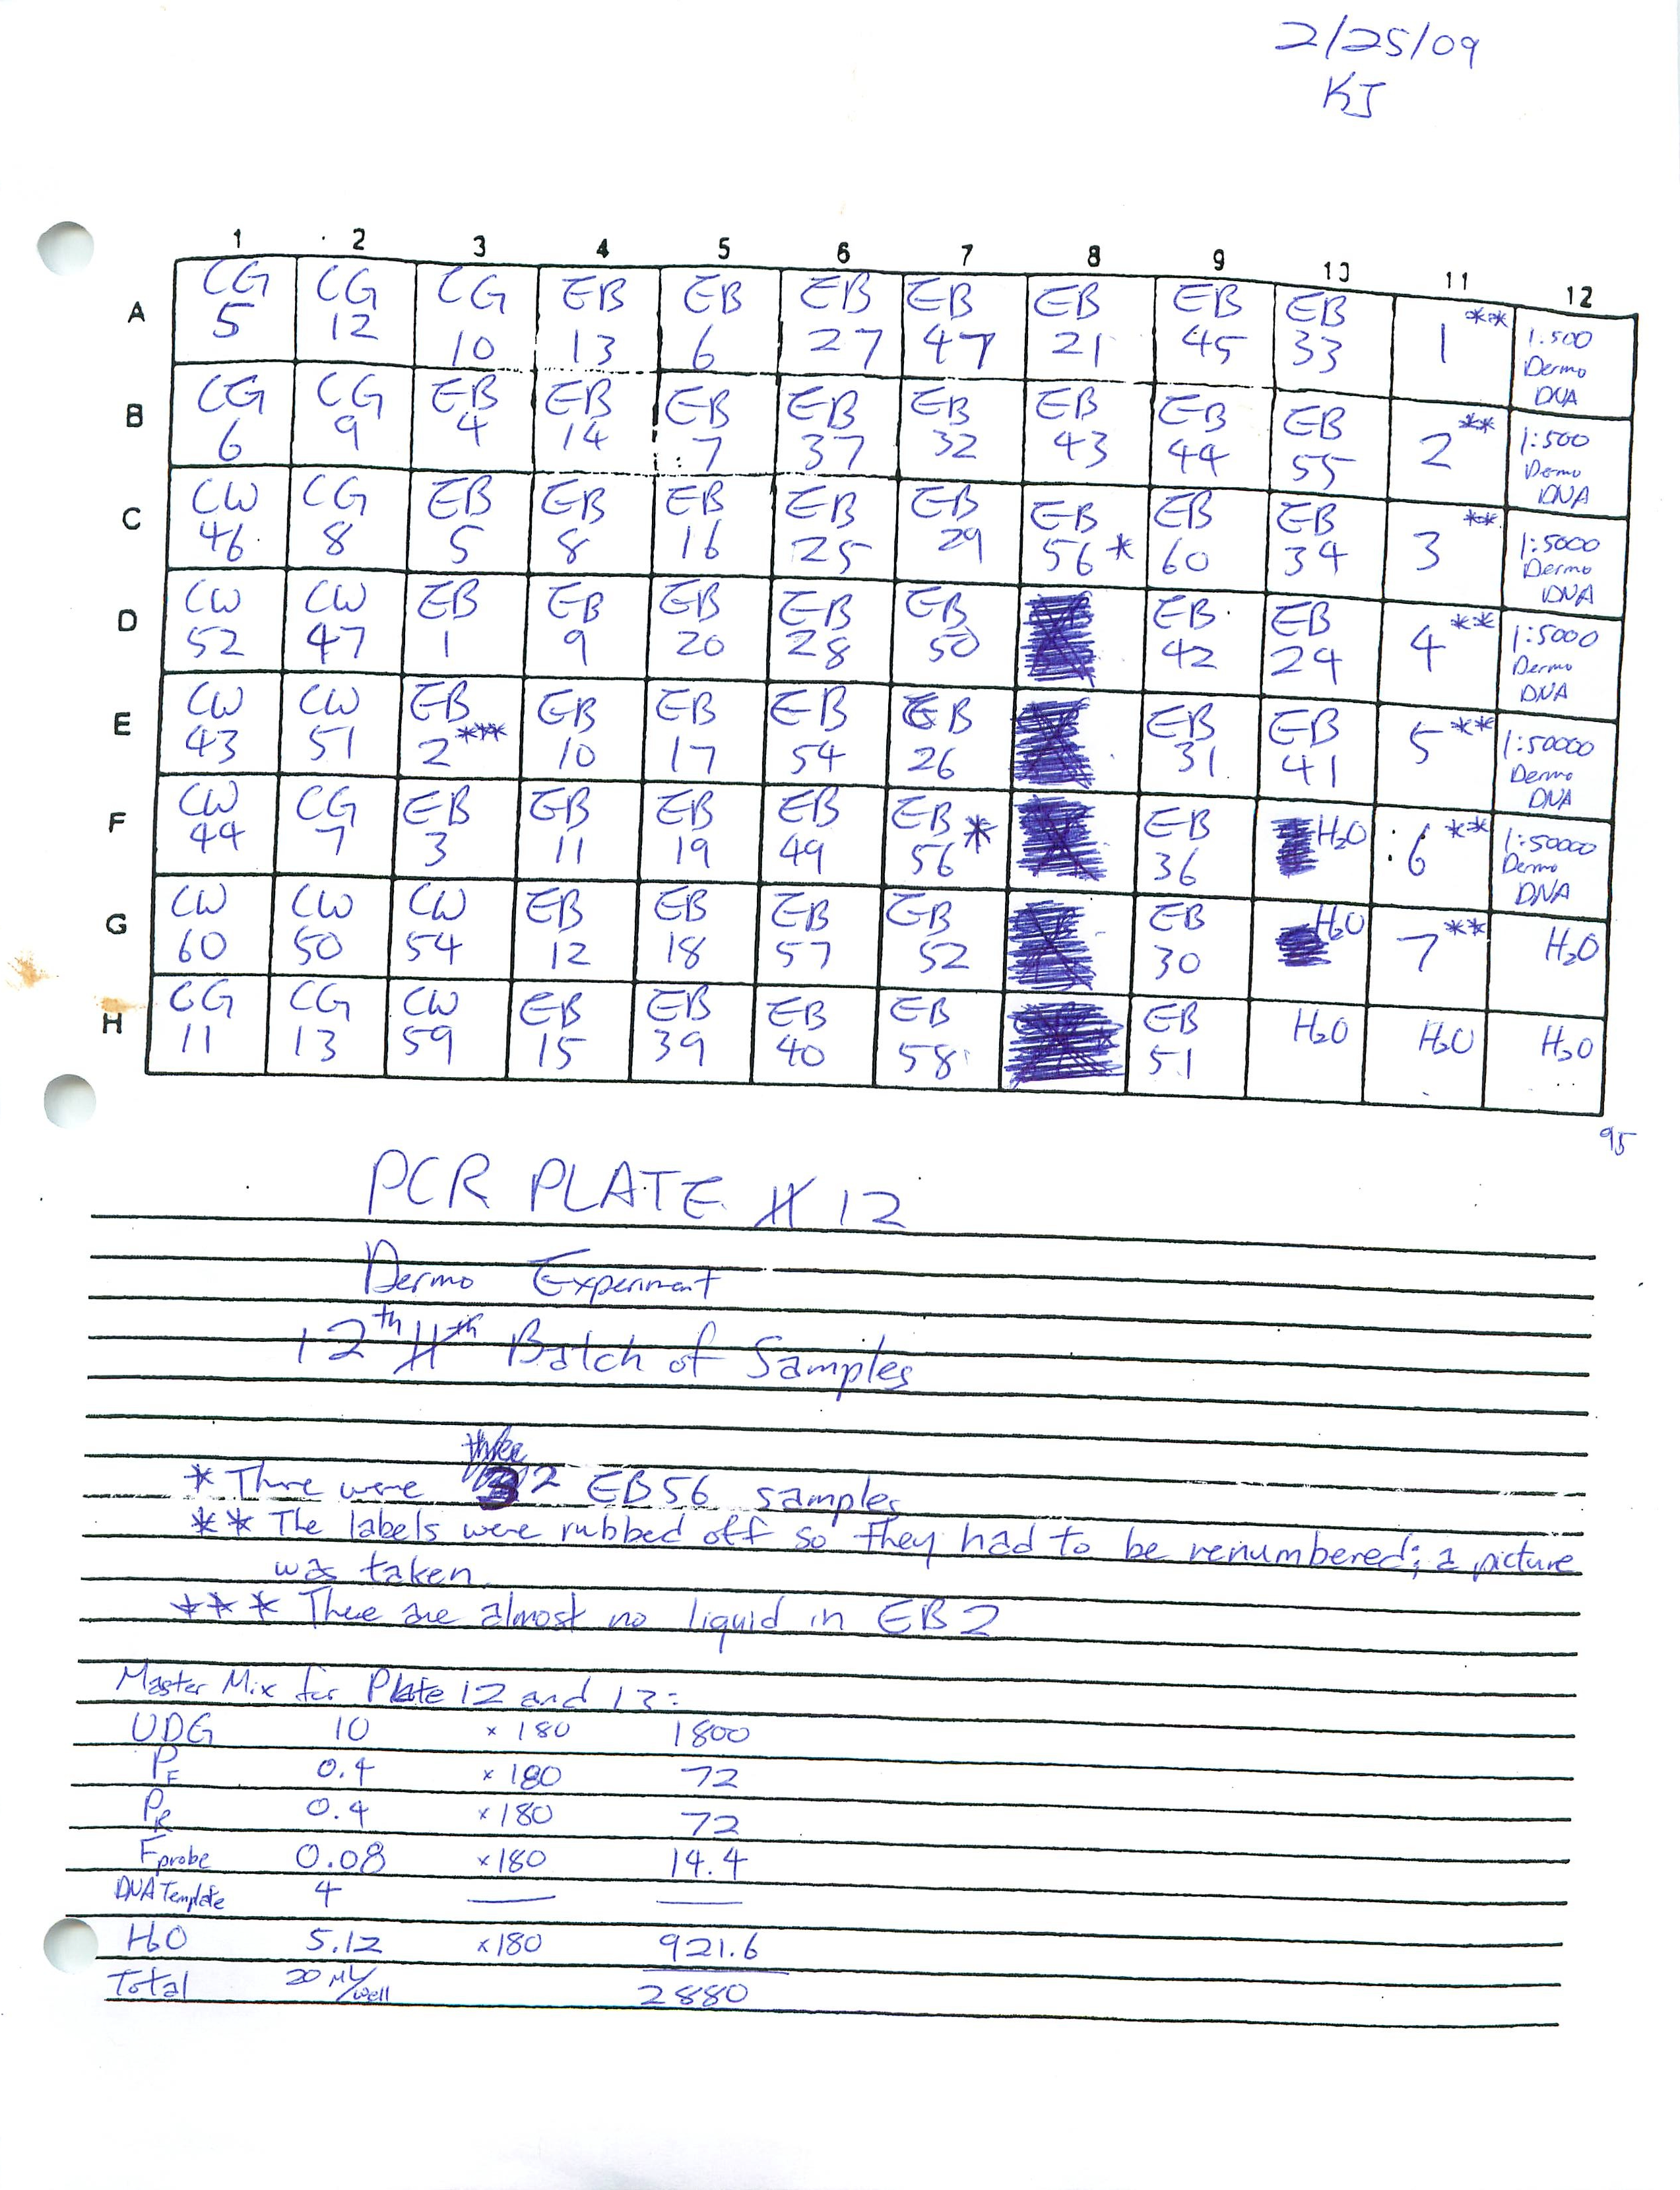
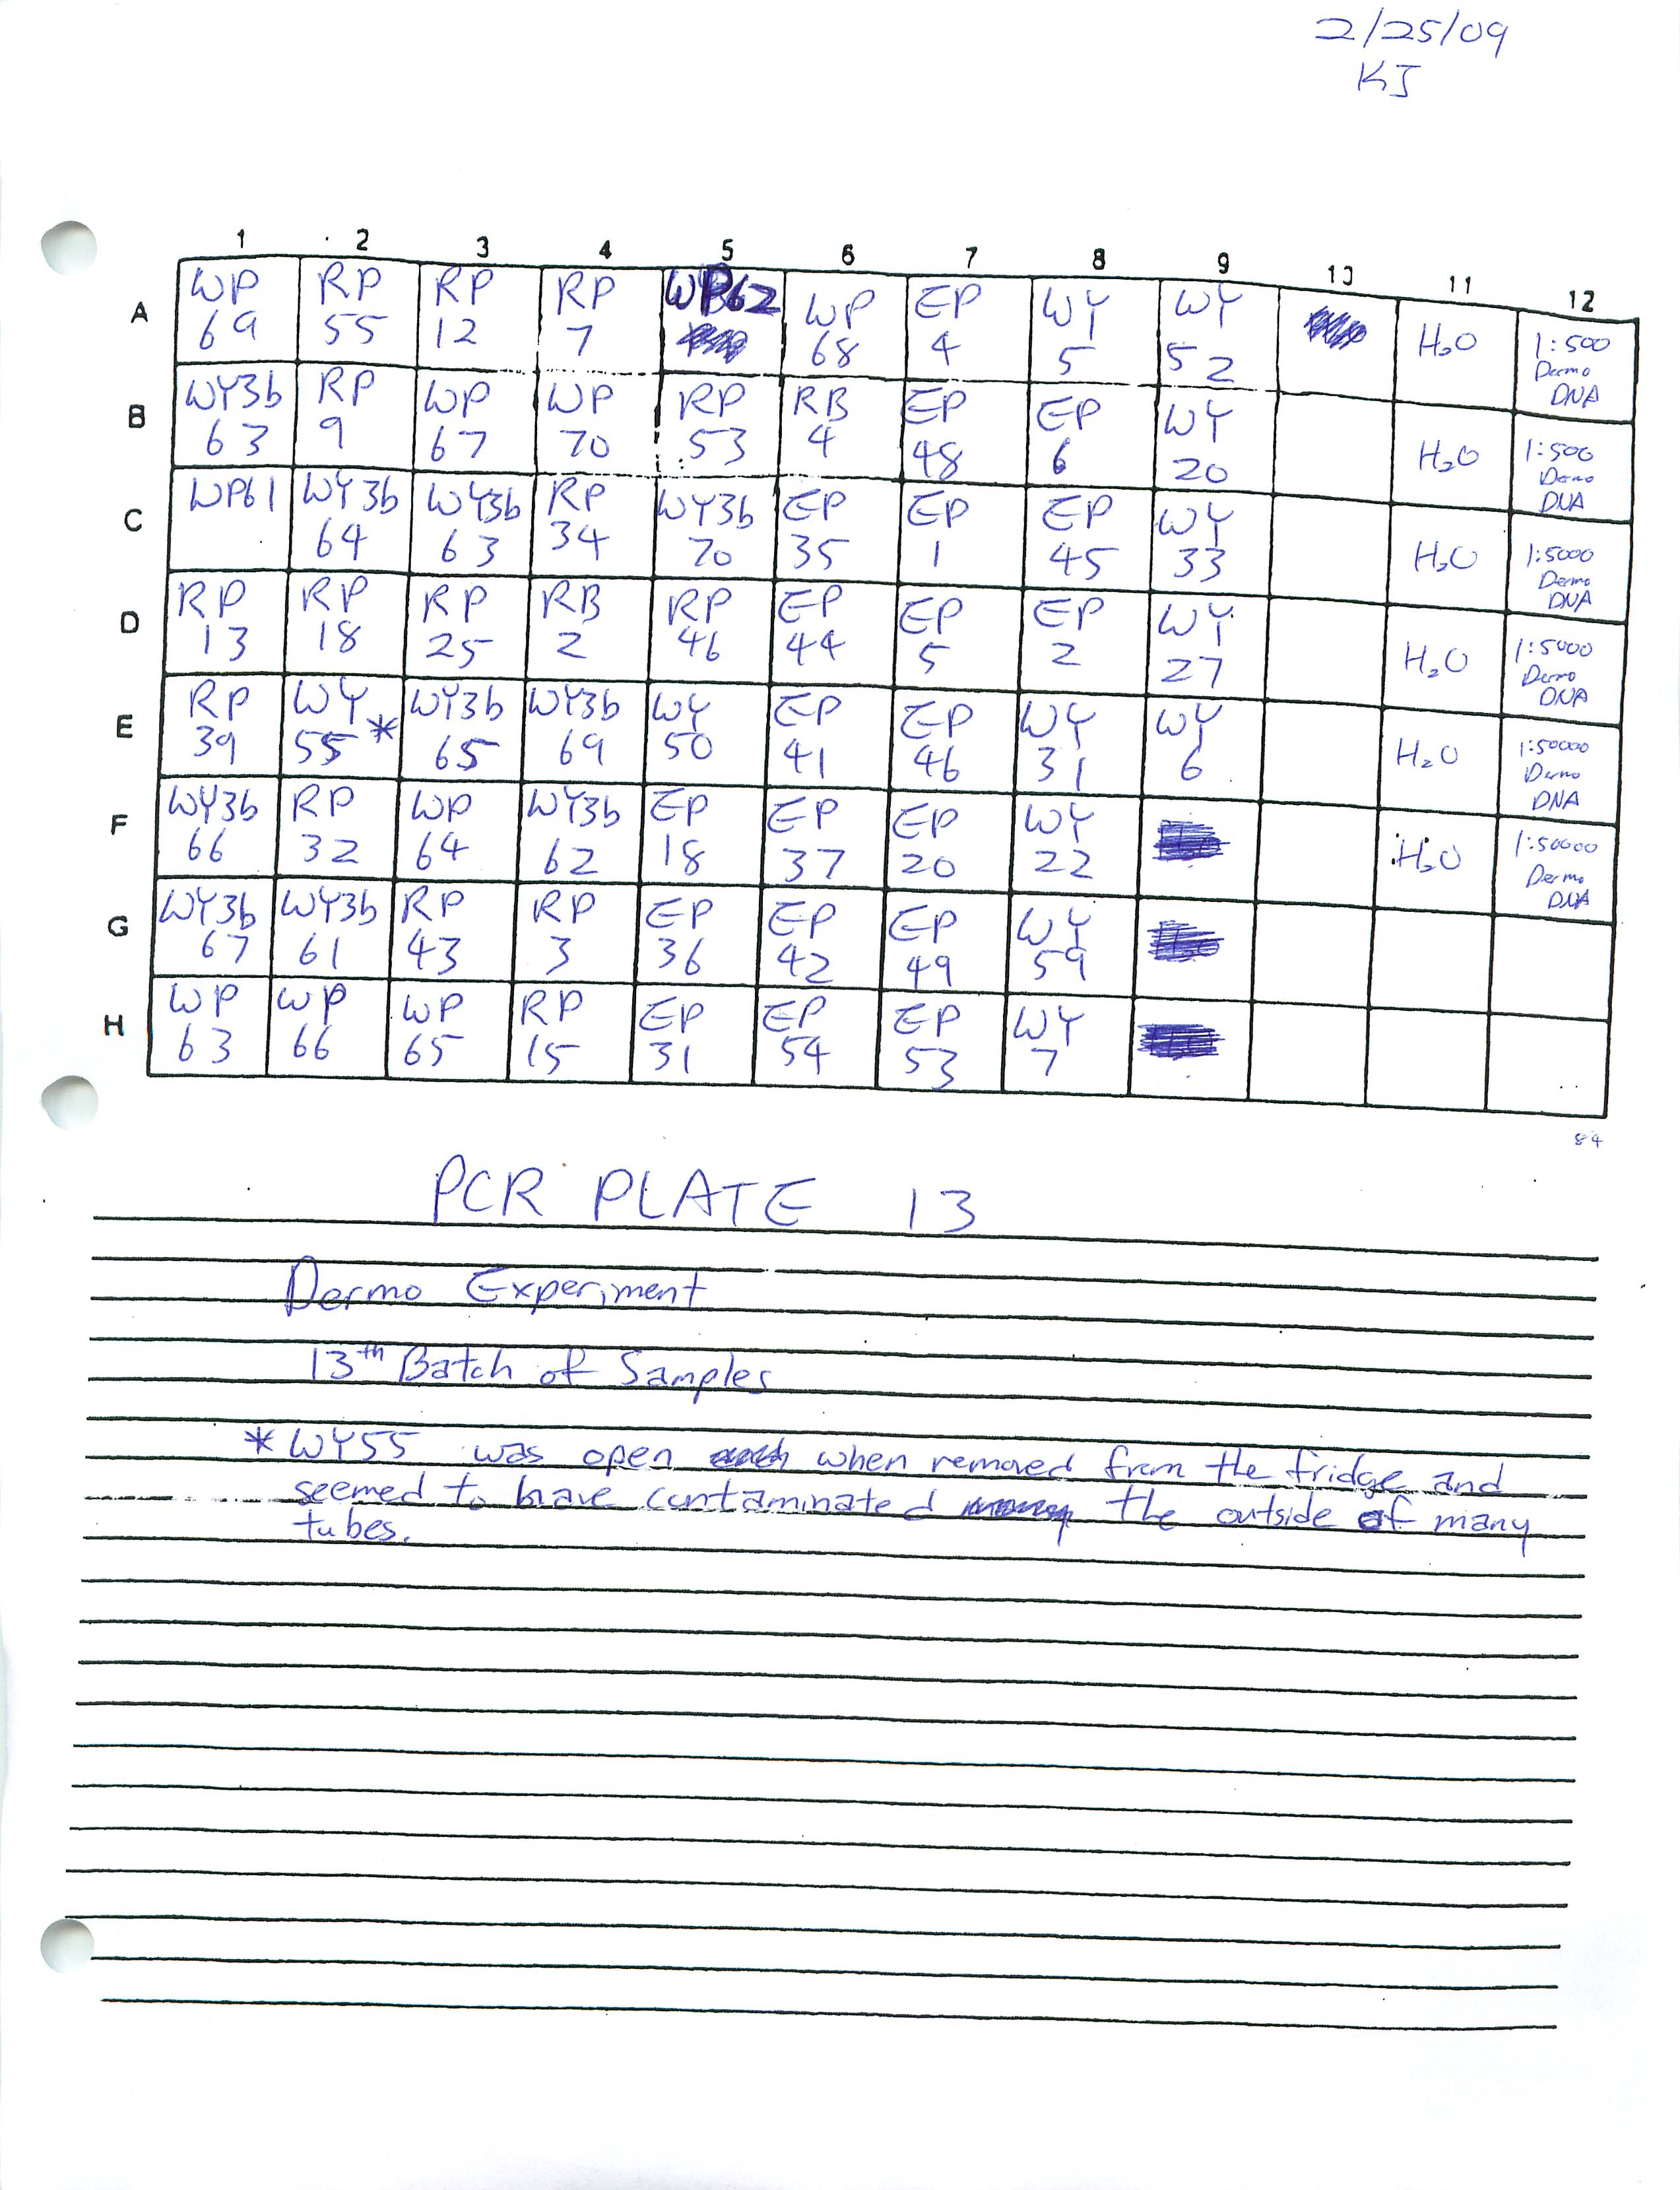
2-20-09
Prepared and ran Real-Time PCR Plates 9, 10, and 11 for Dermo Experiment.
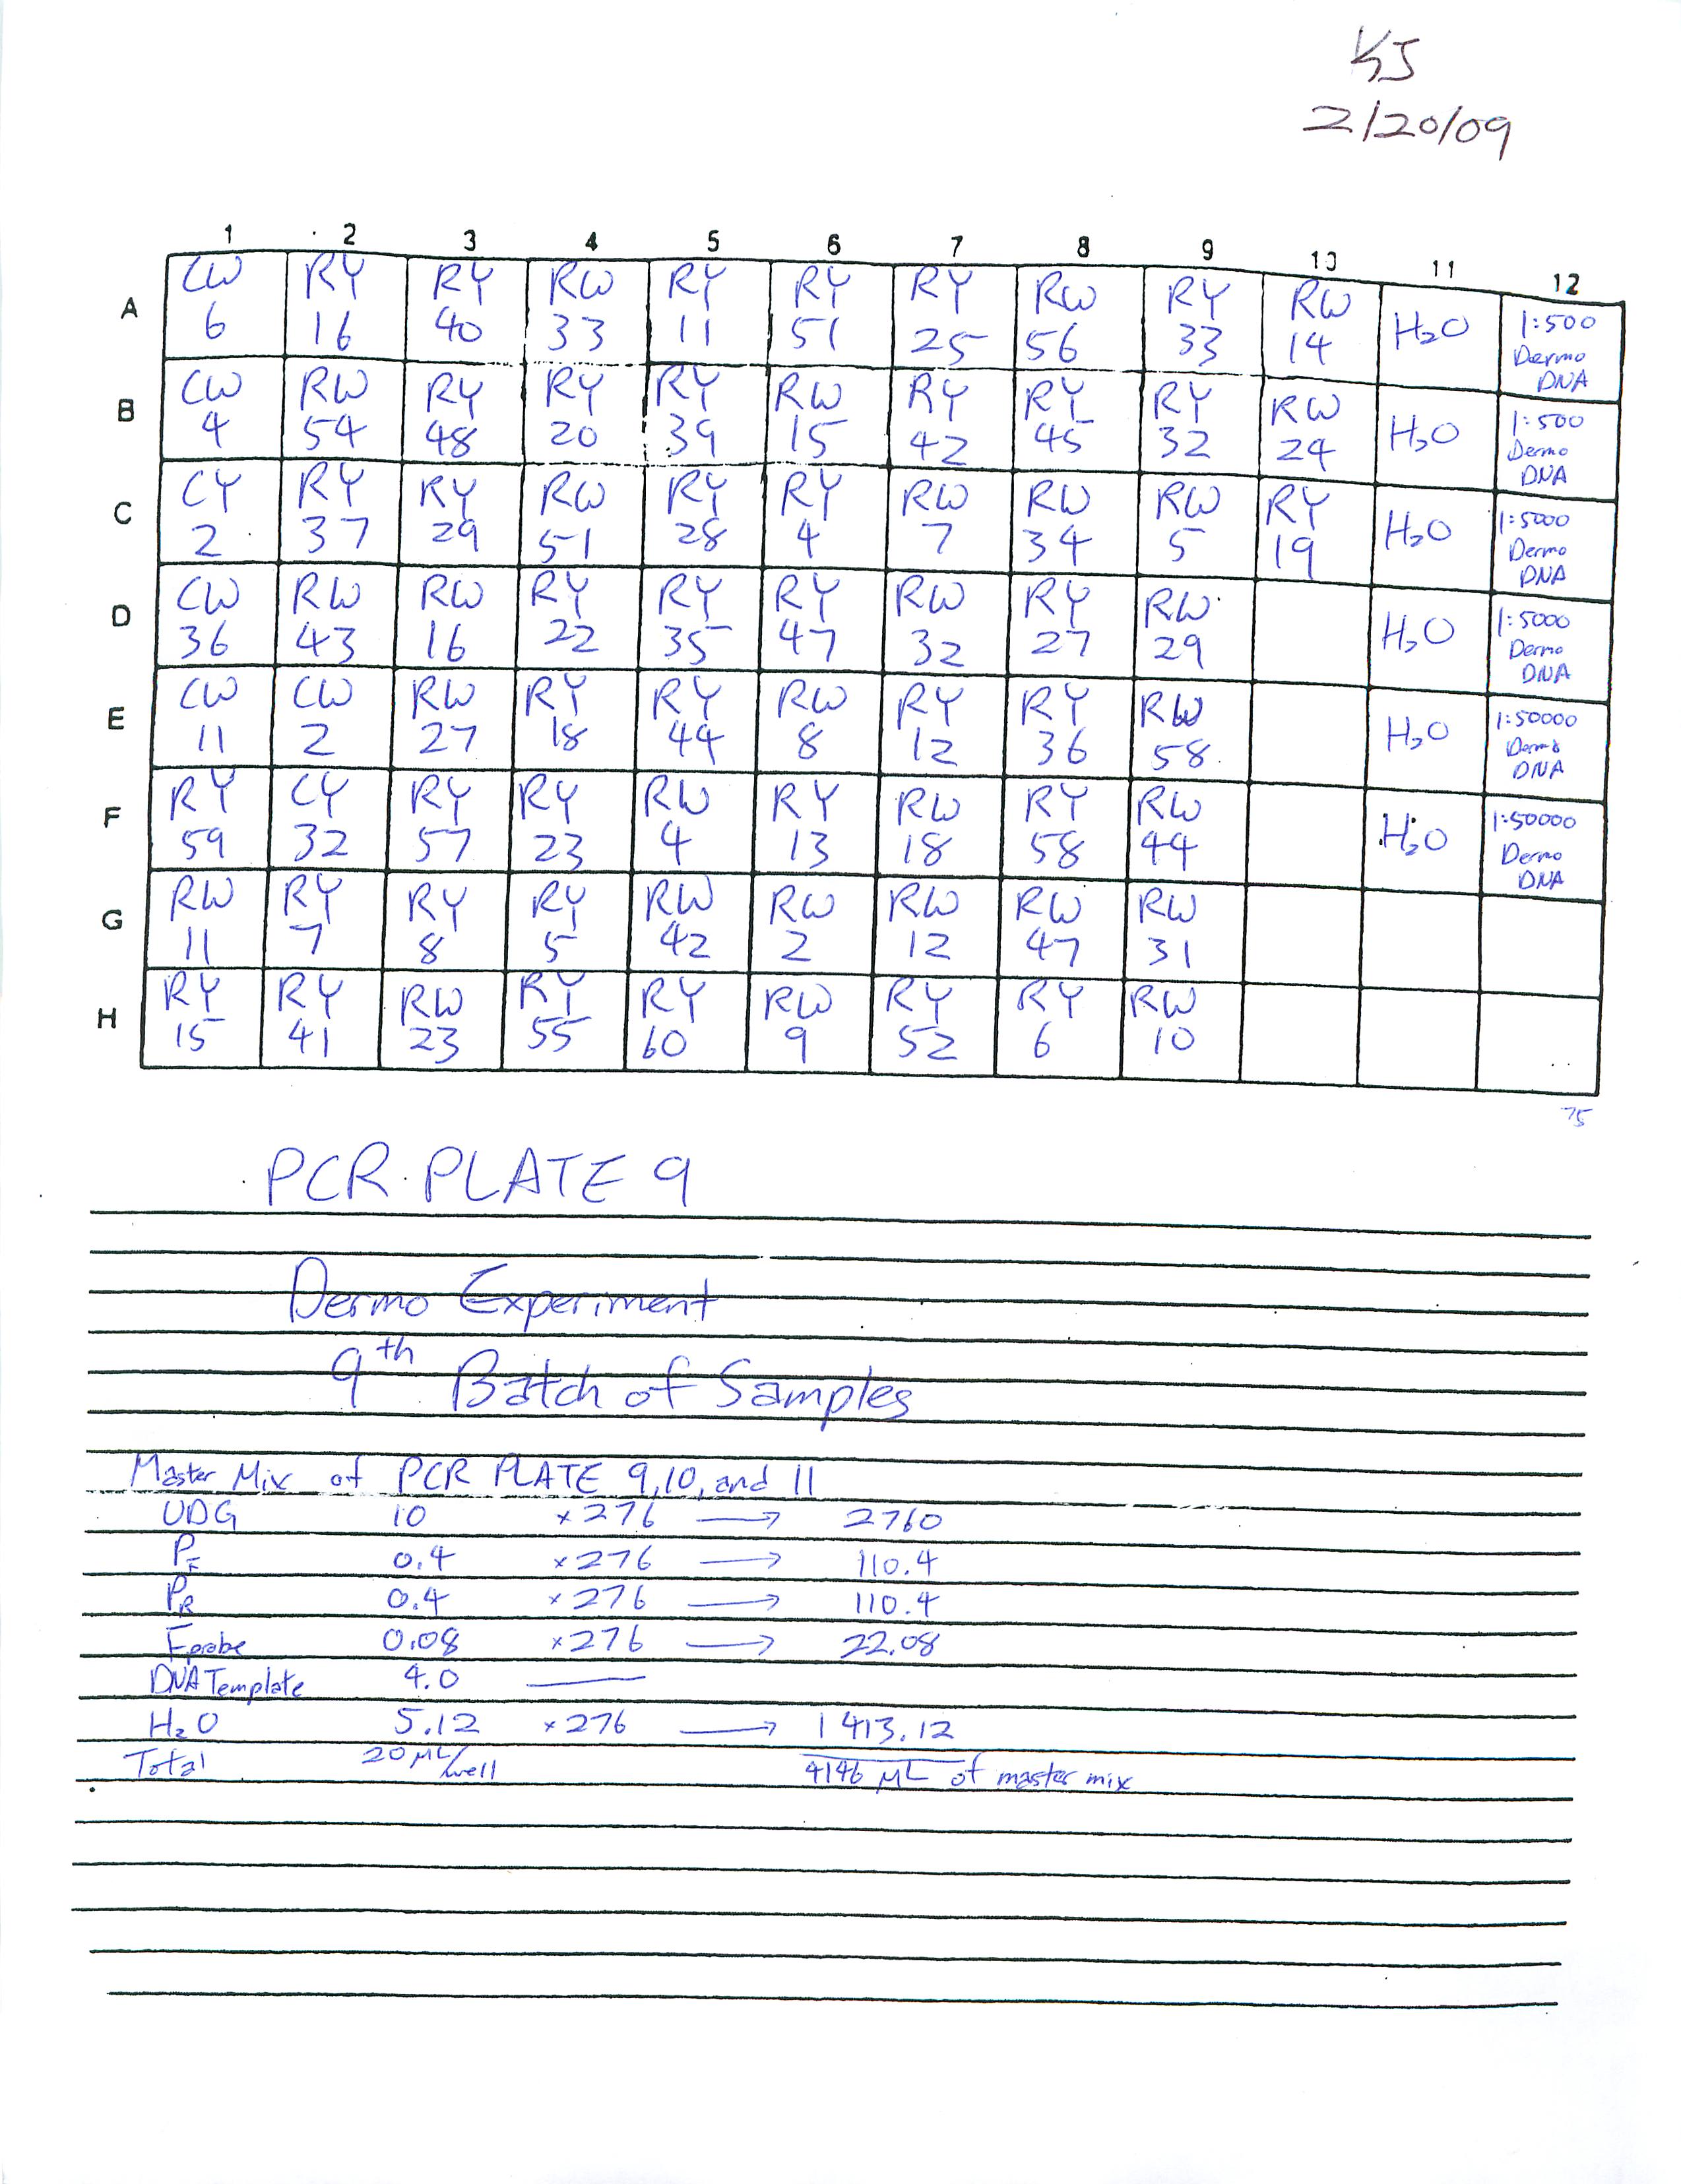
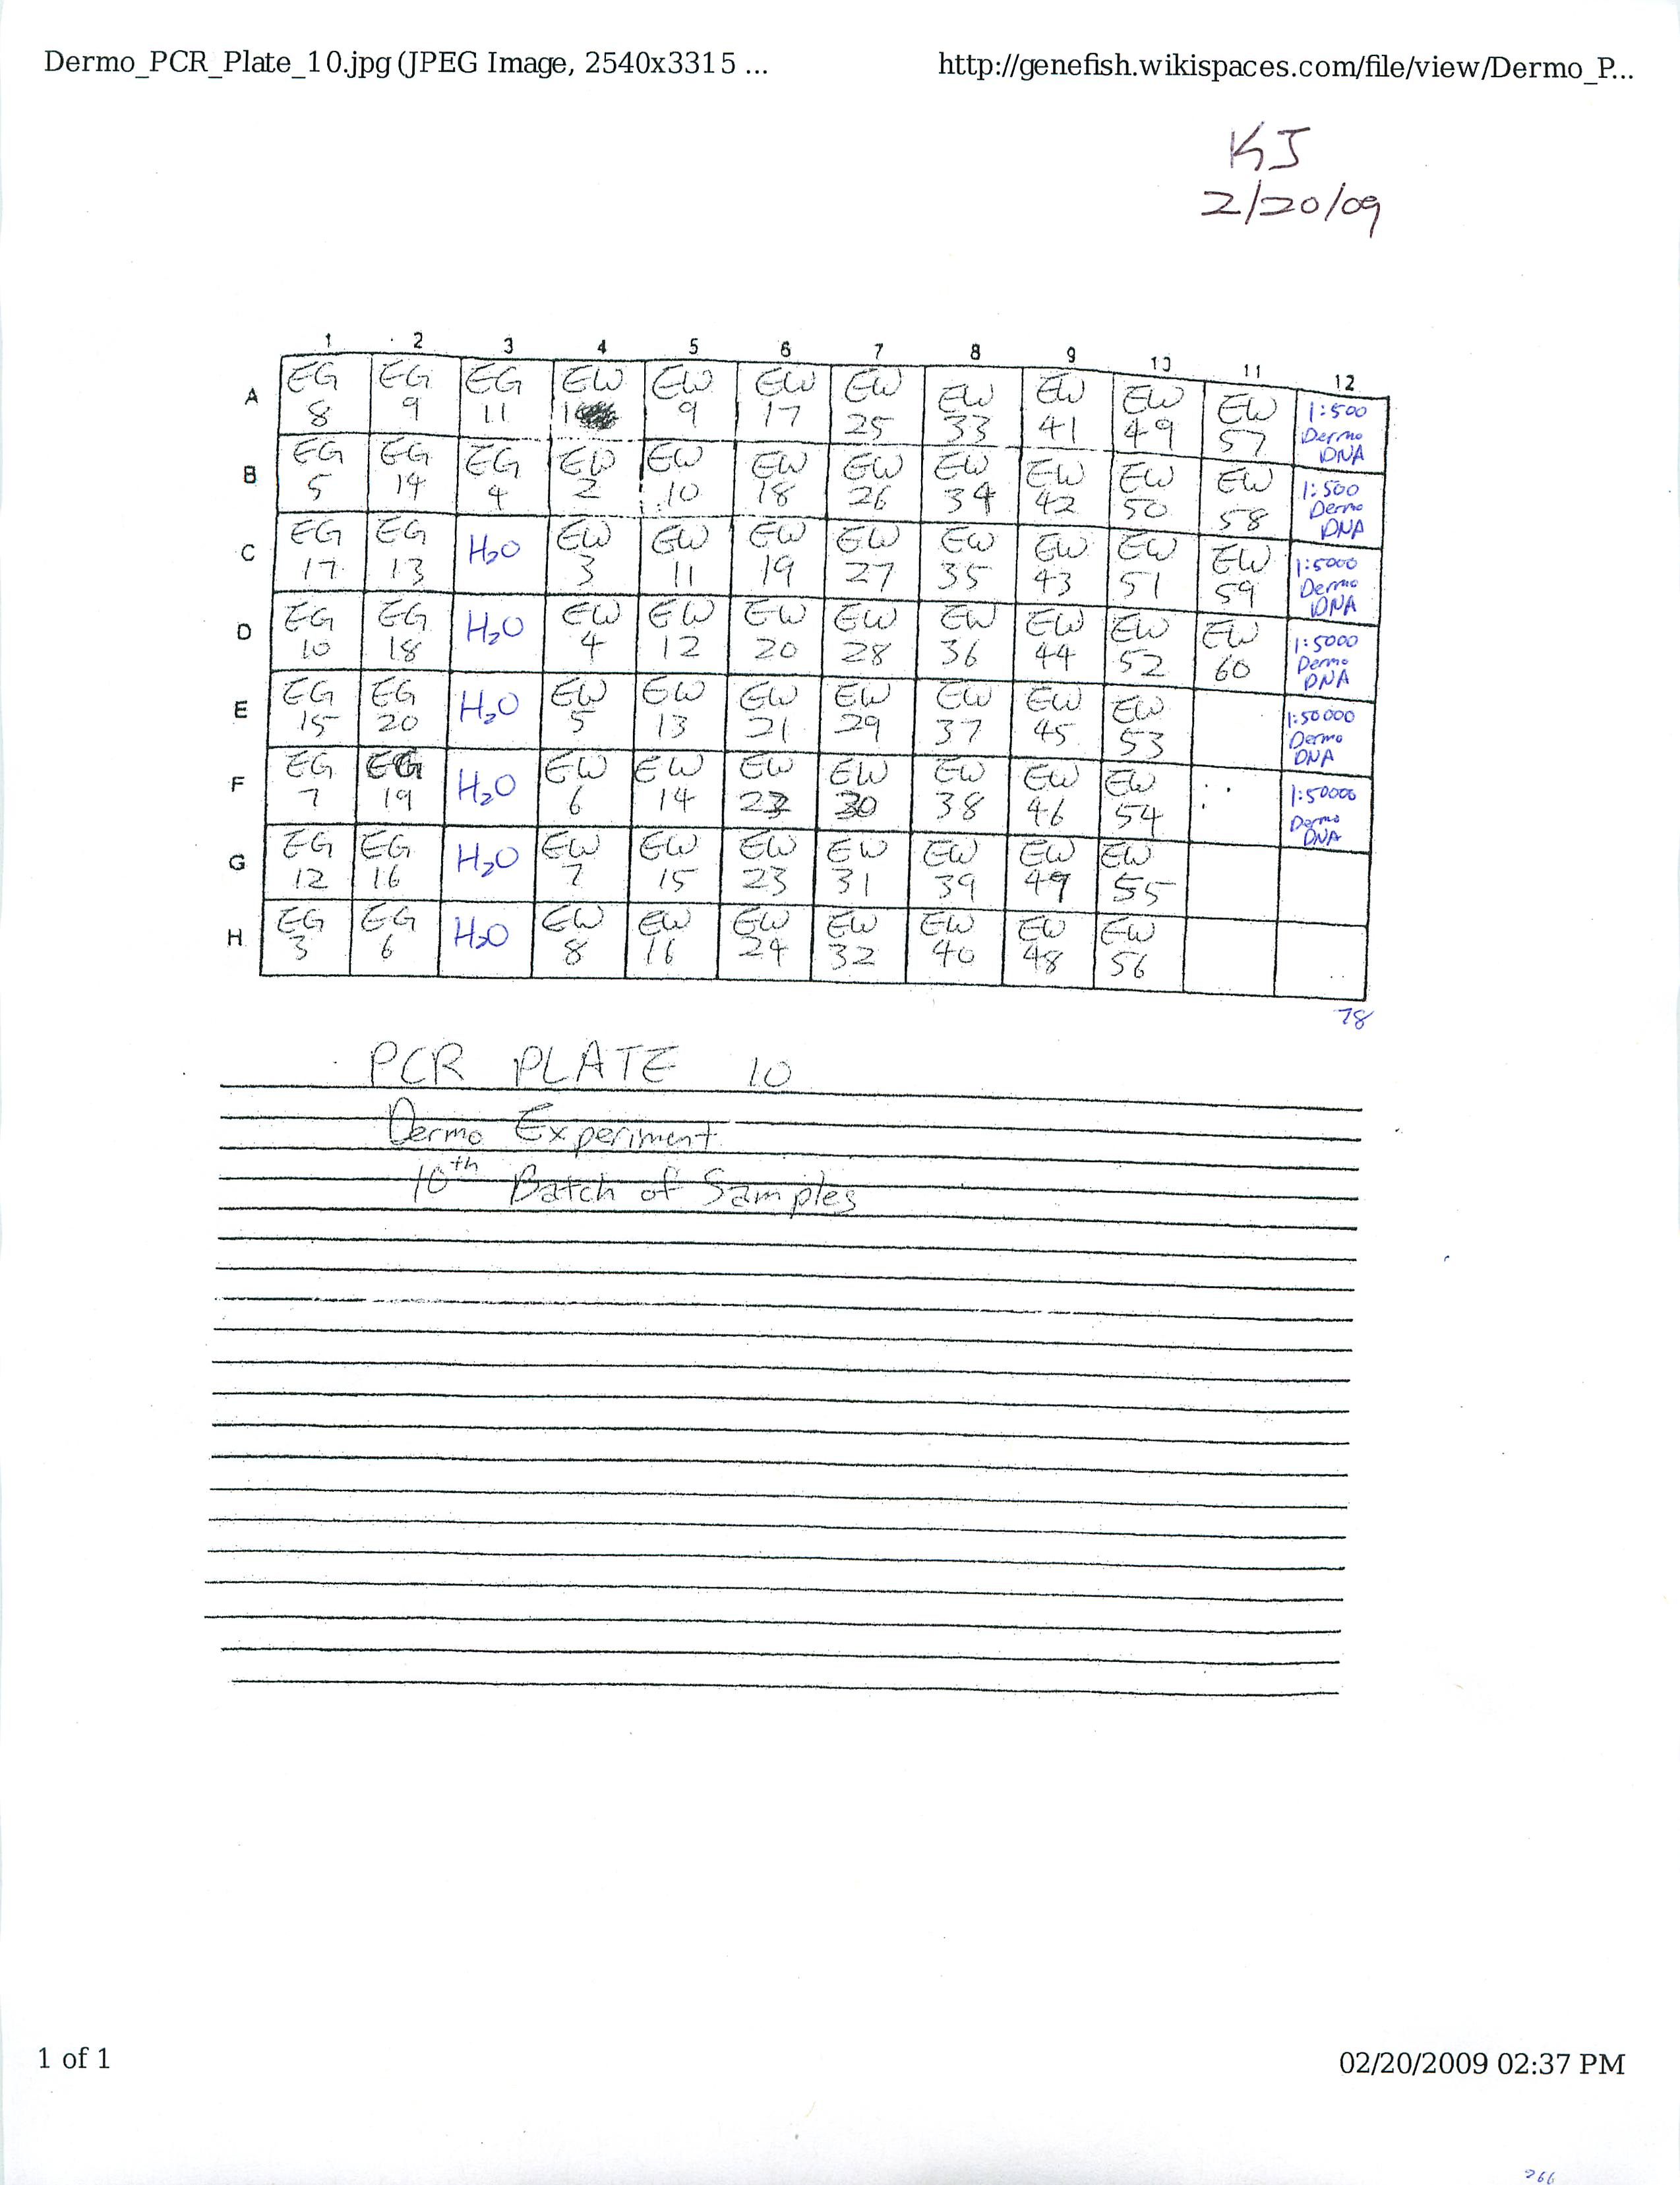
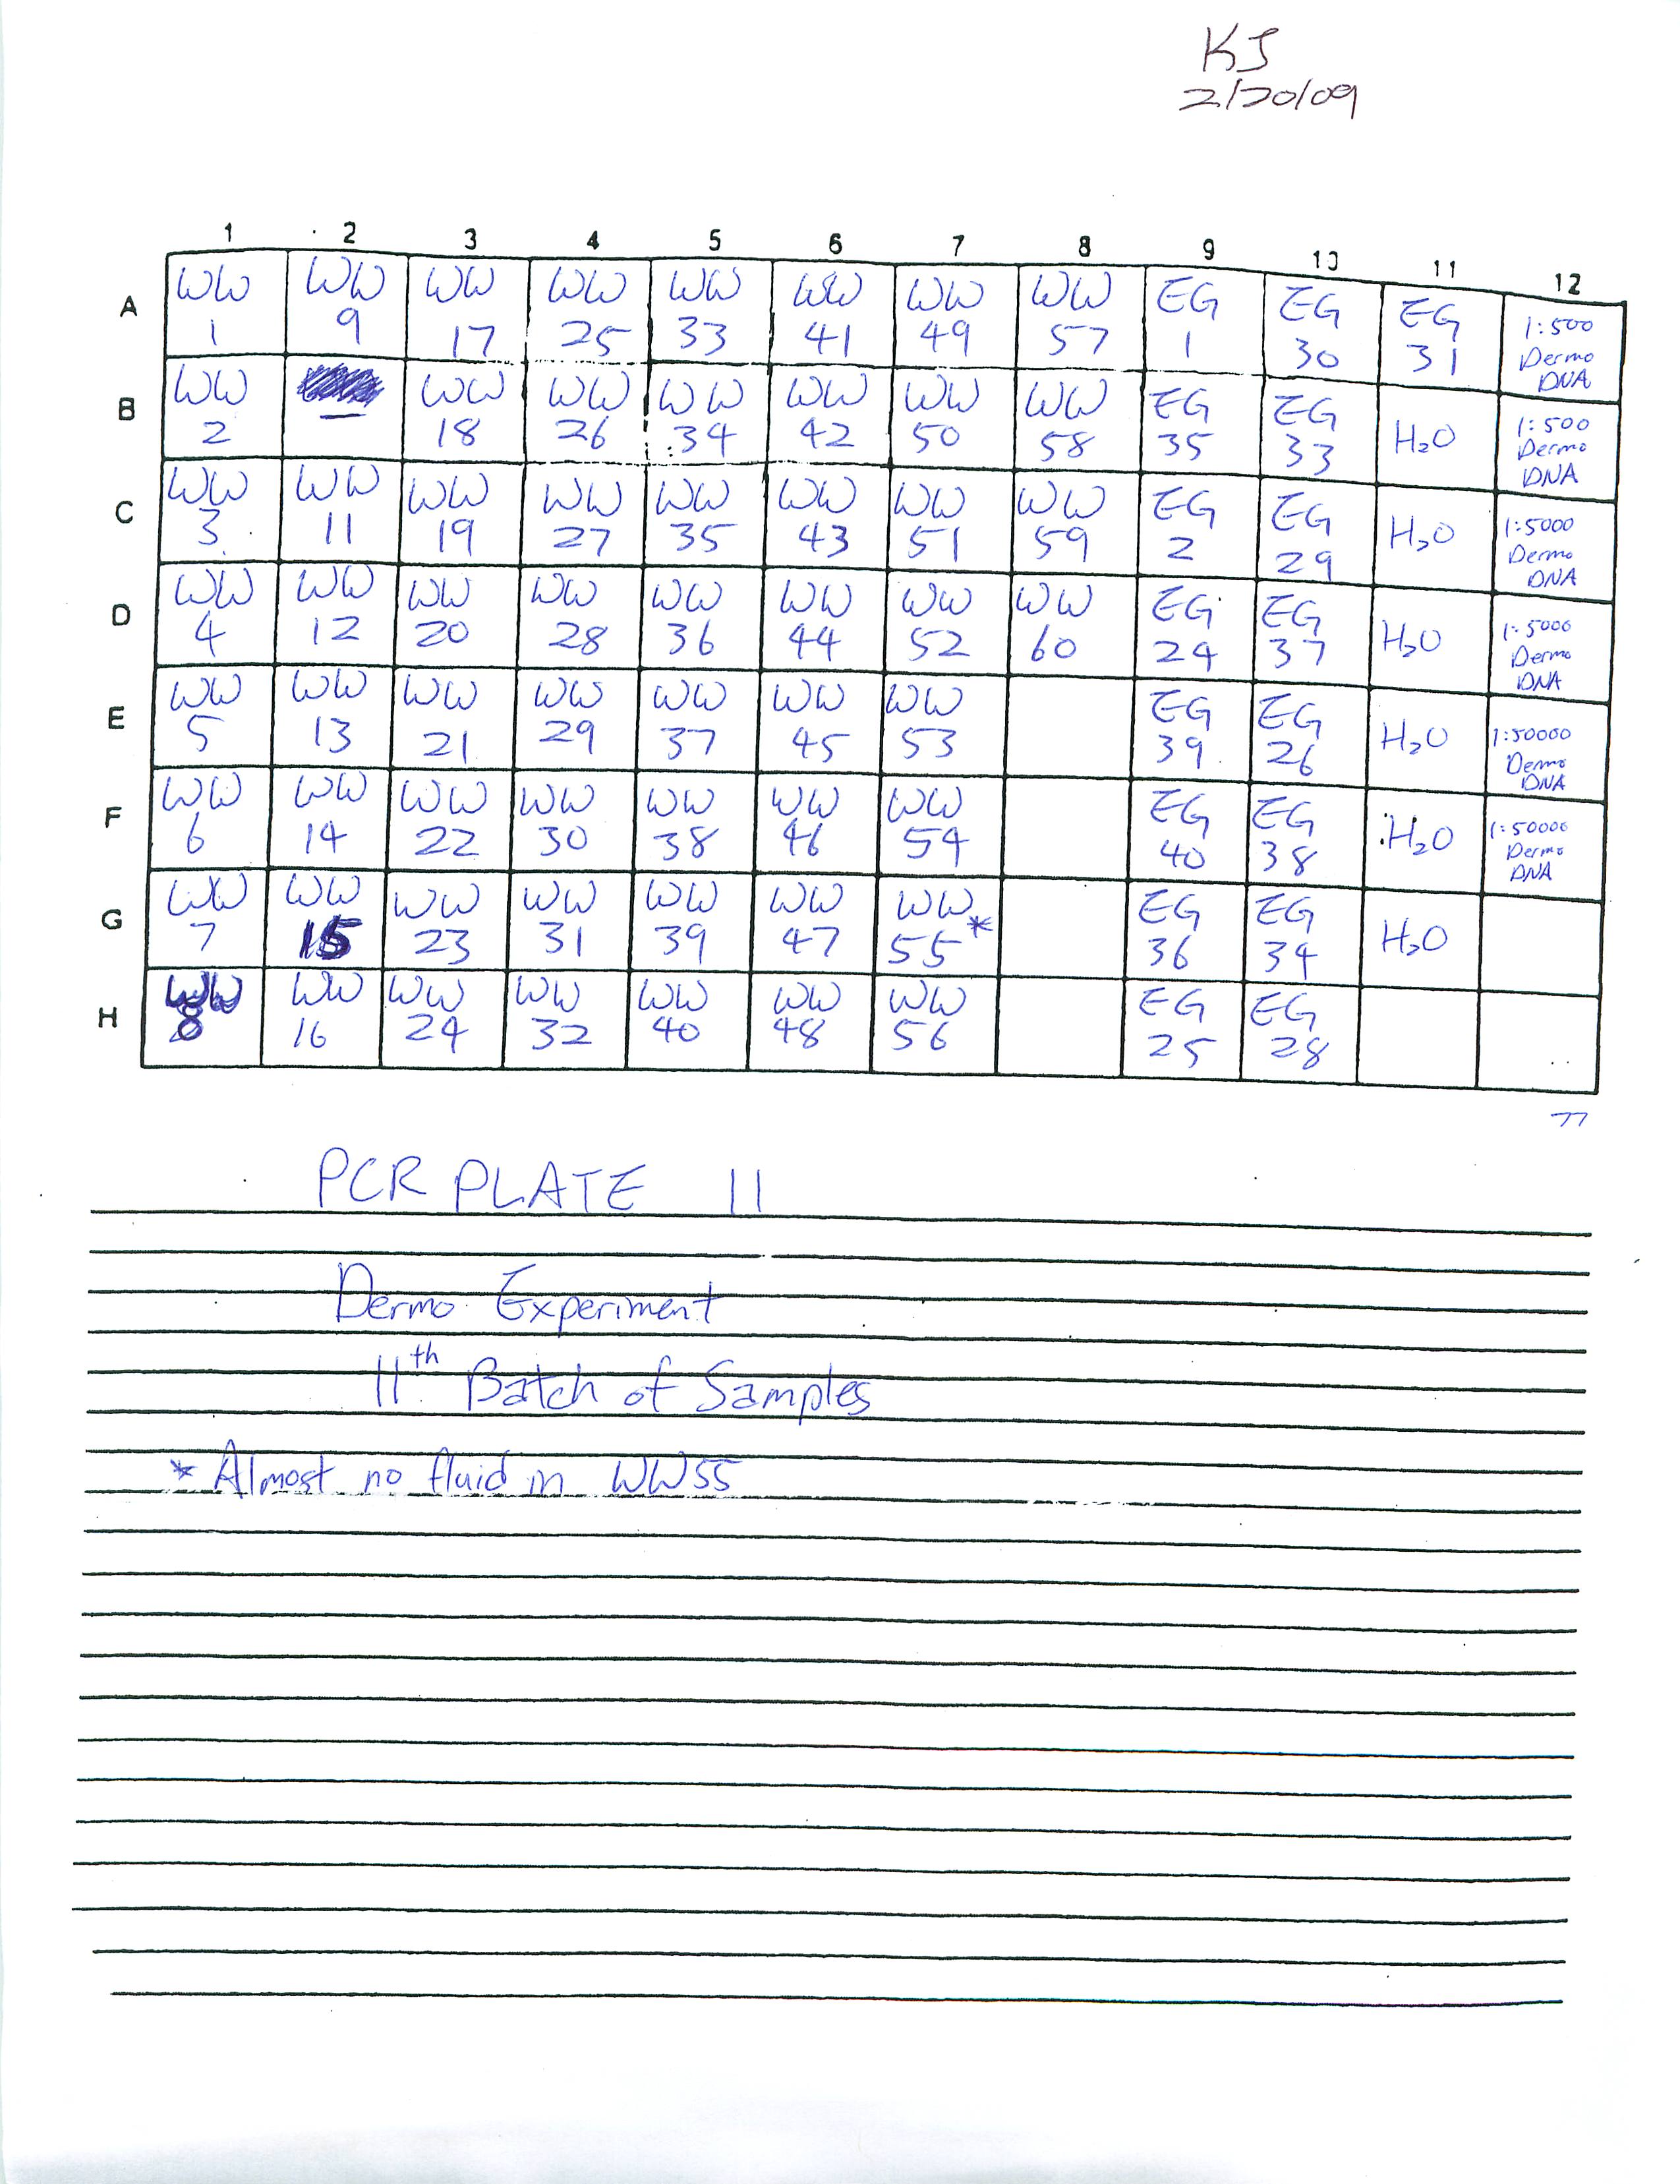
Also learned how to estimate gene copy number using the Opticon program on the computer. Will transfer all data once all fifteen plates have run through.
2-19-09
Prepared Real-Time PCR plate 7 and 8 for Dermo Experiment and ran Plate 7. Plate 8 is in the fridge for someone else to run at a later time.
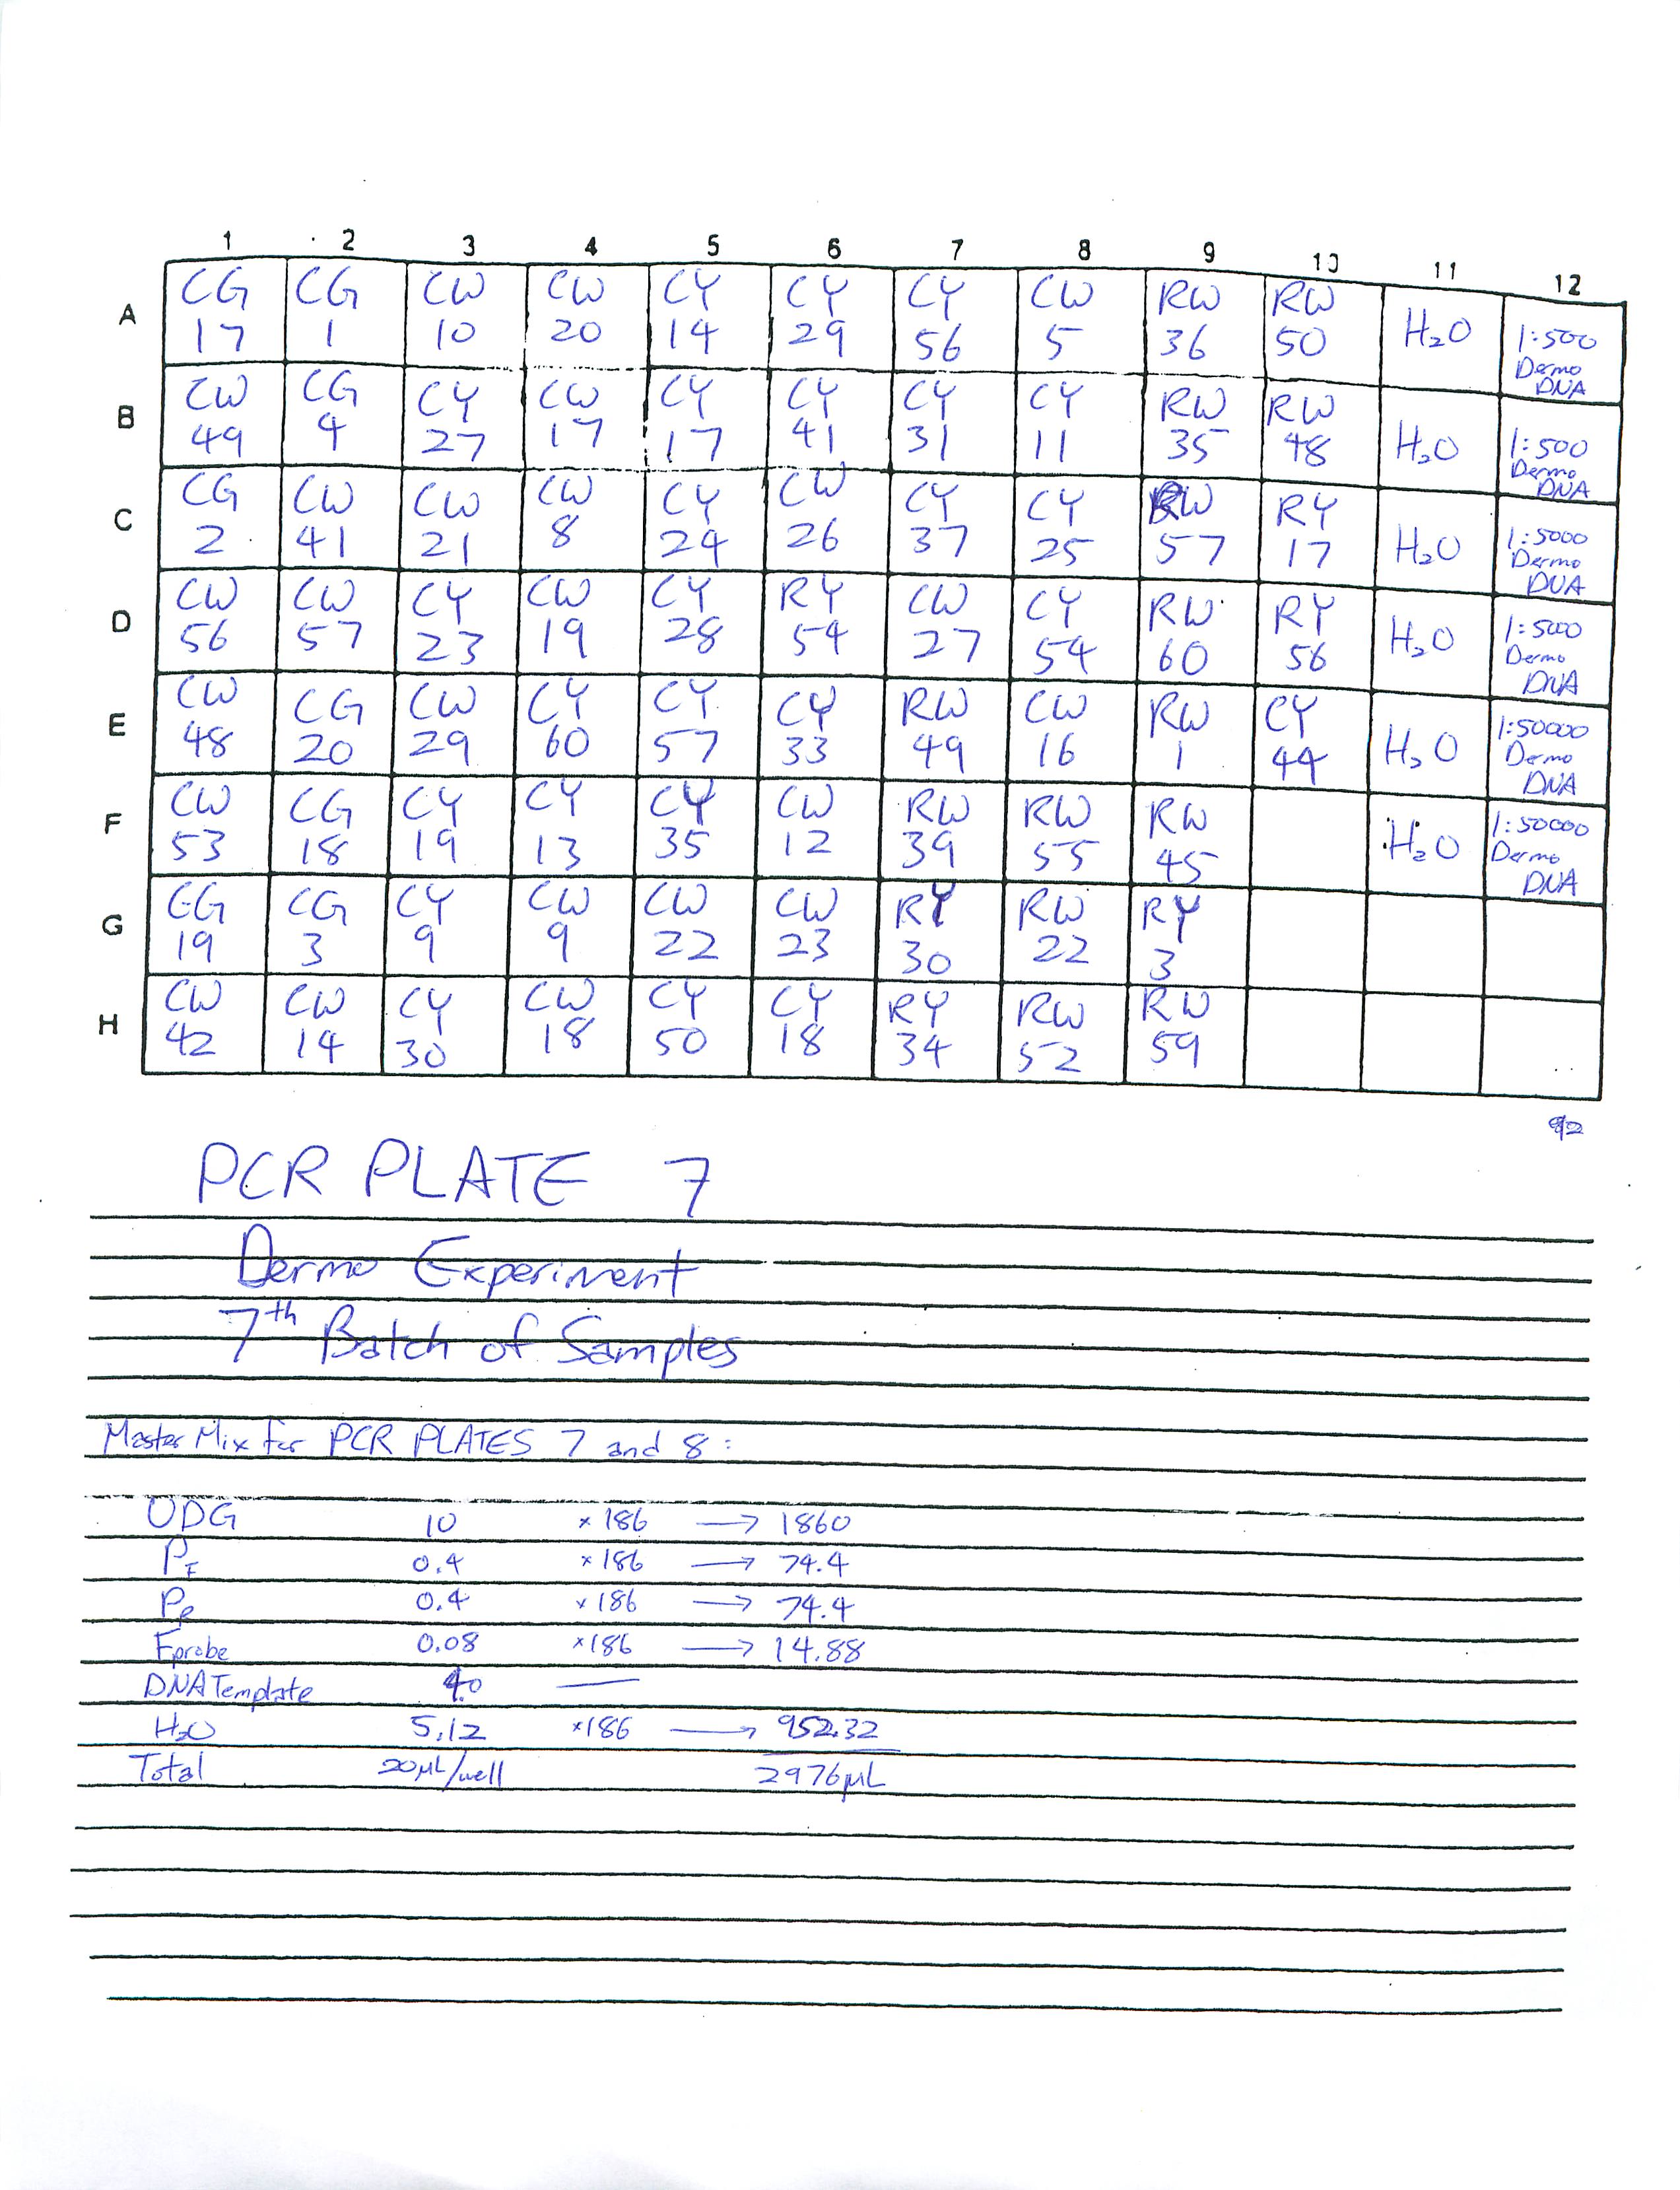
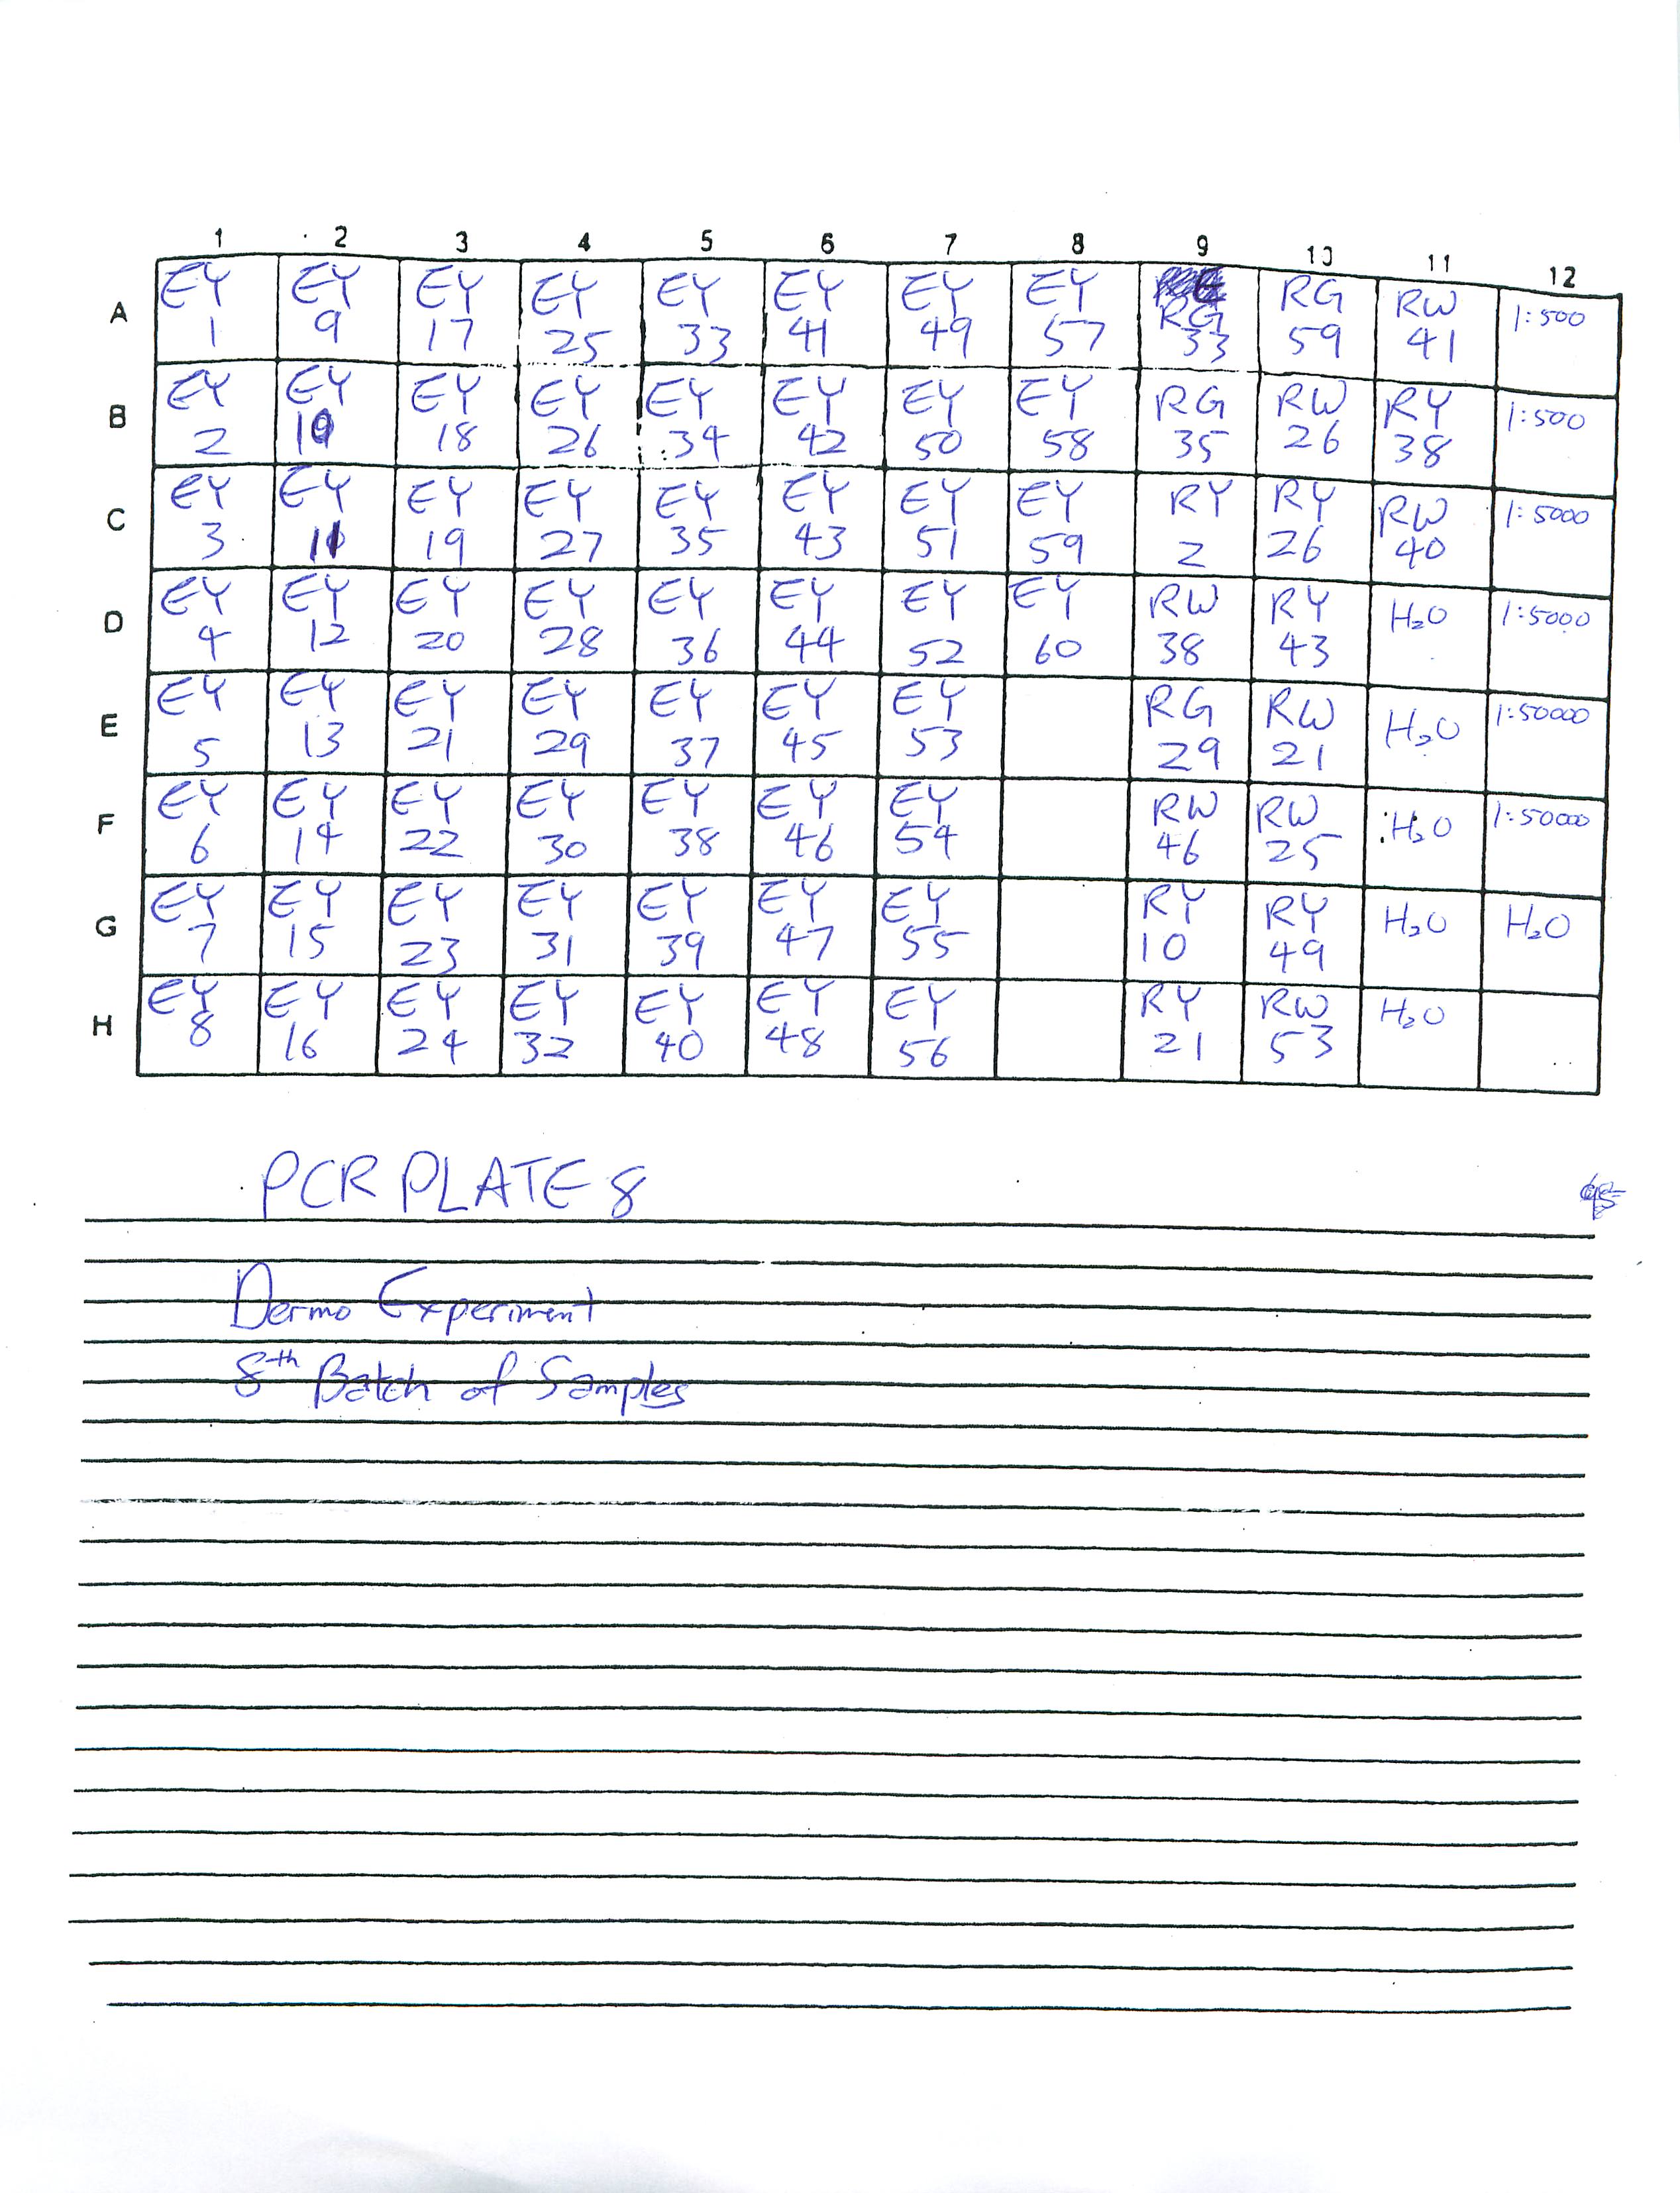
2-18-09
Prepared Real-Time PCR Plate 6 and 5 for Dermo Experiment and ran Real-Time PCR for Plate 6. Plate 5 will be in the fridge for someone to run at a later time.
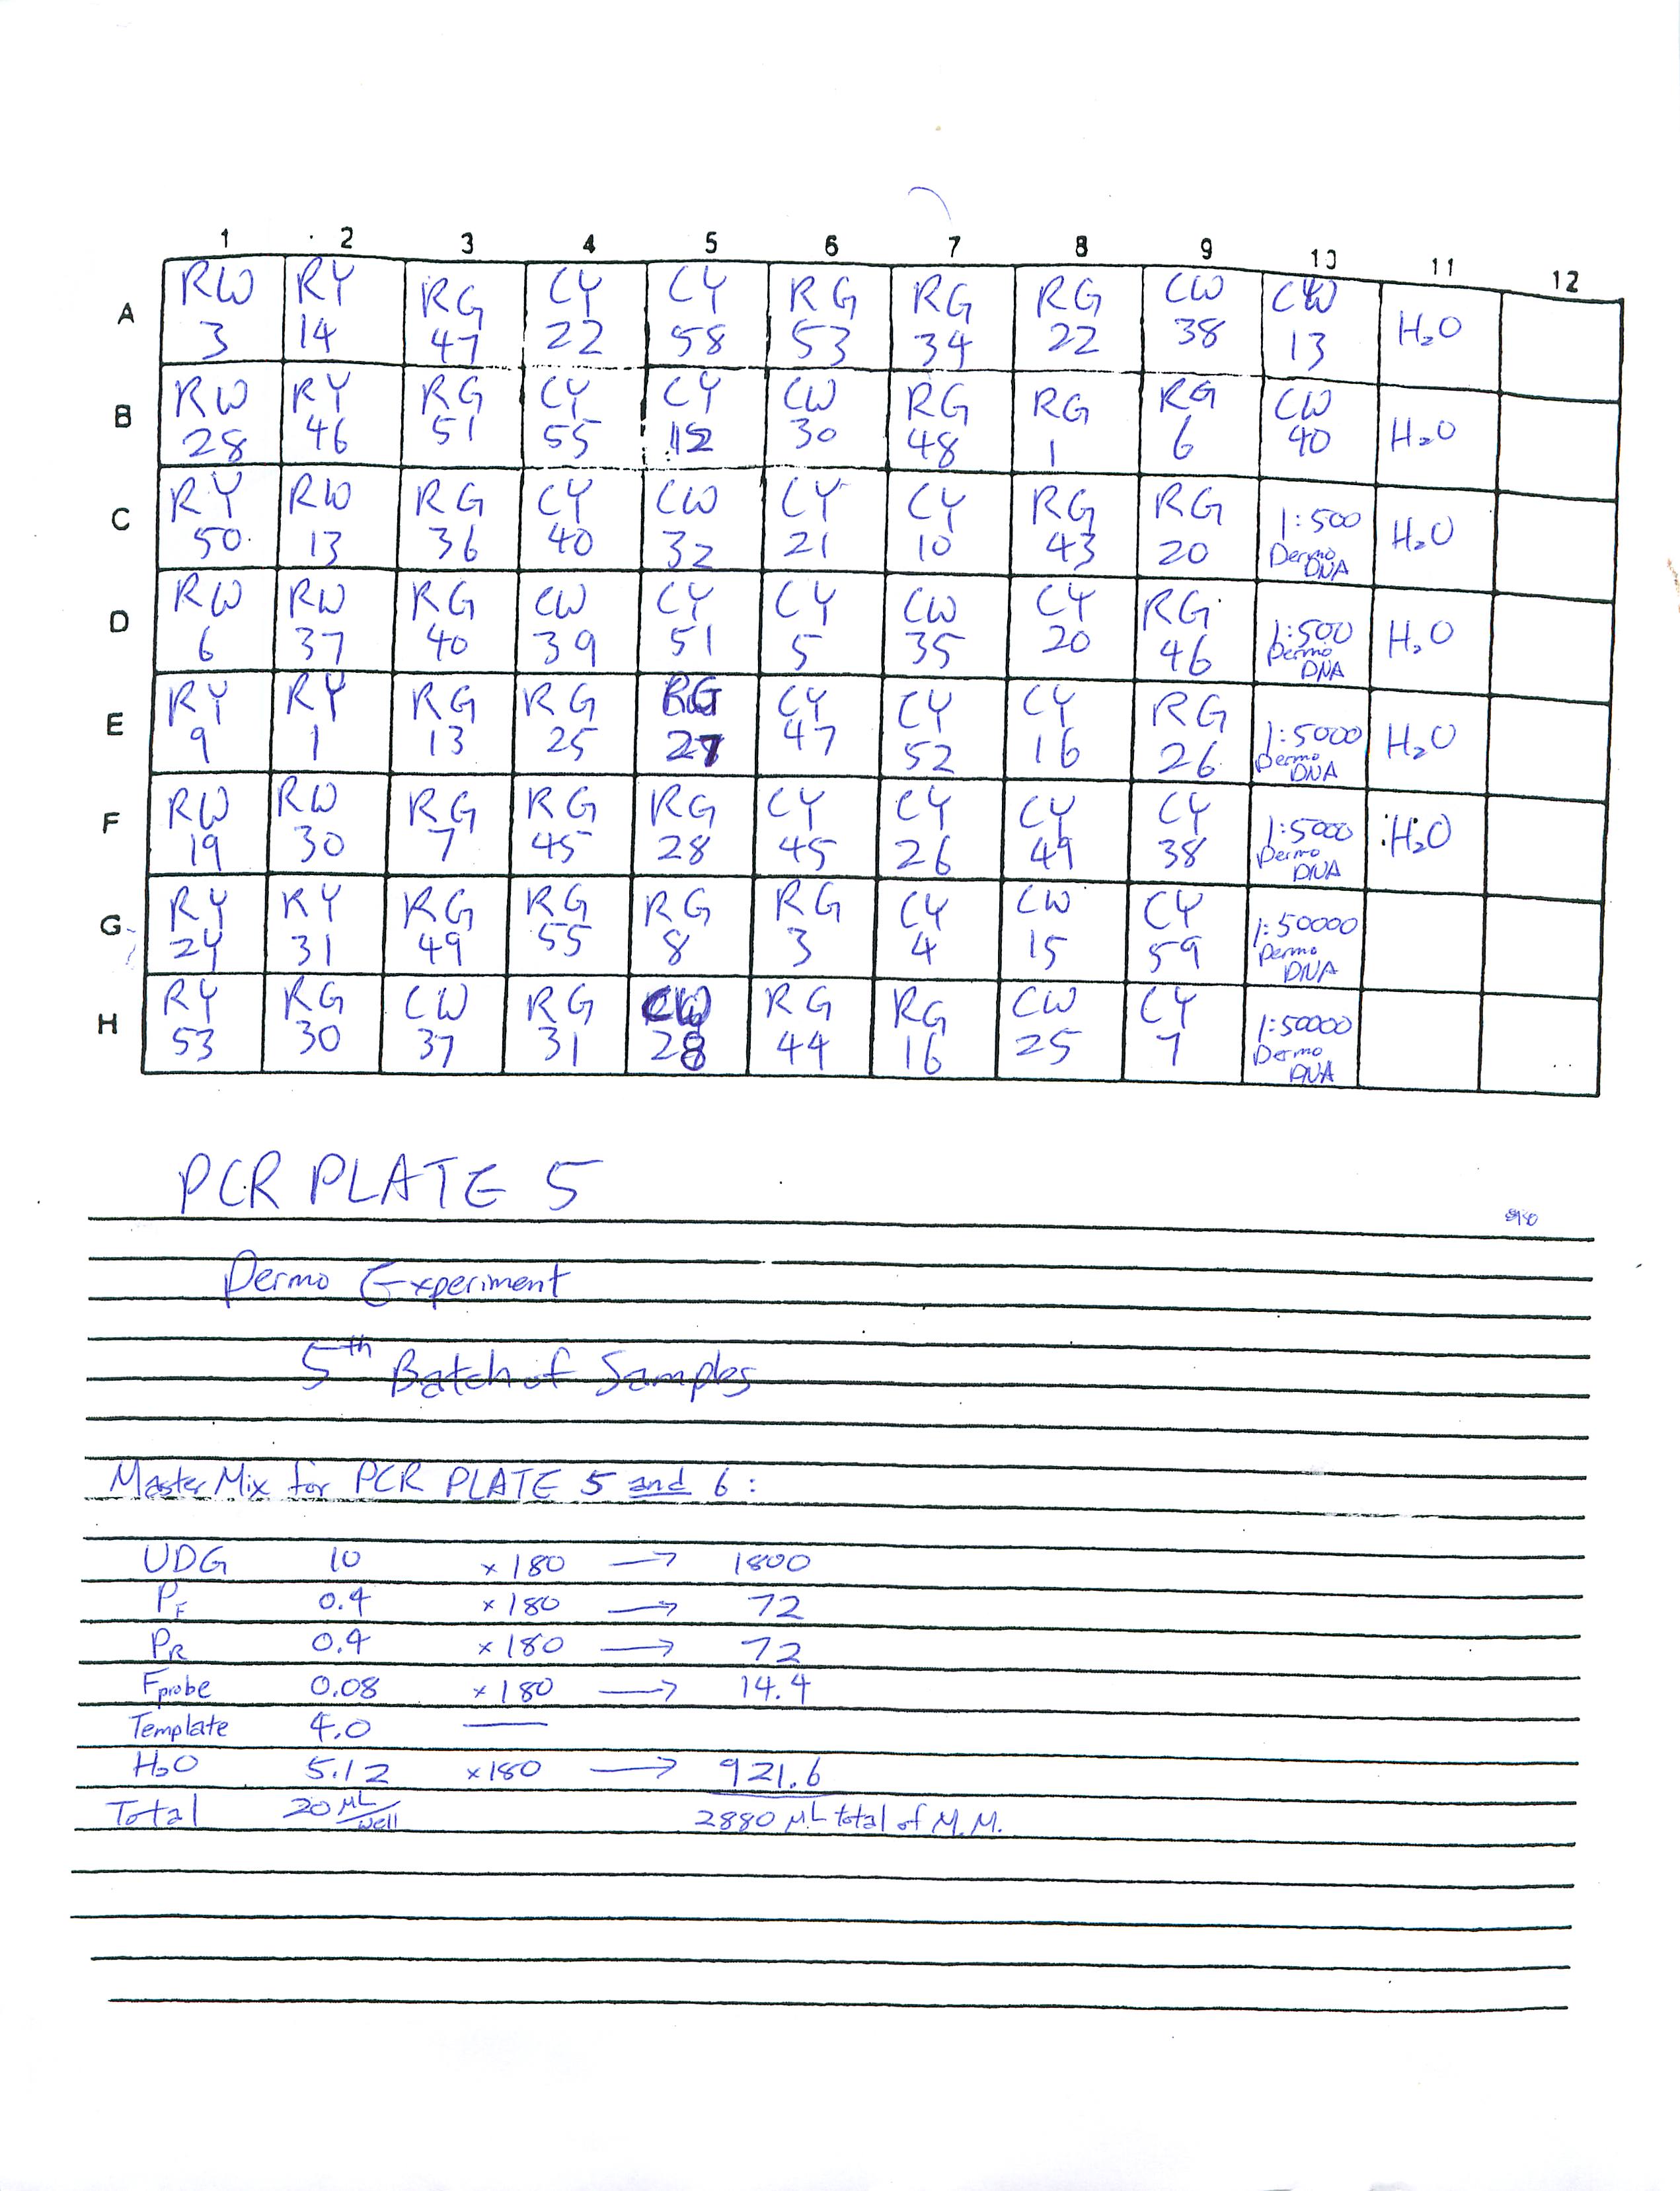
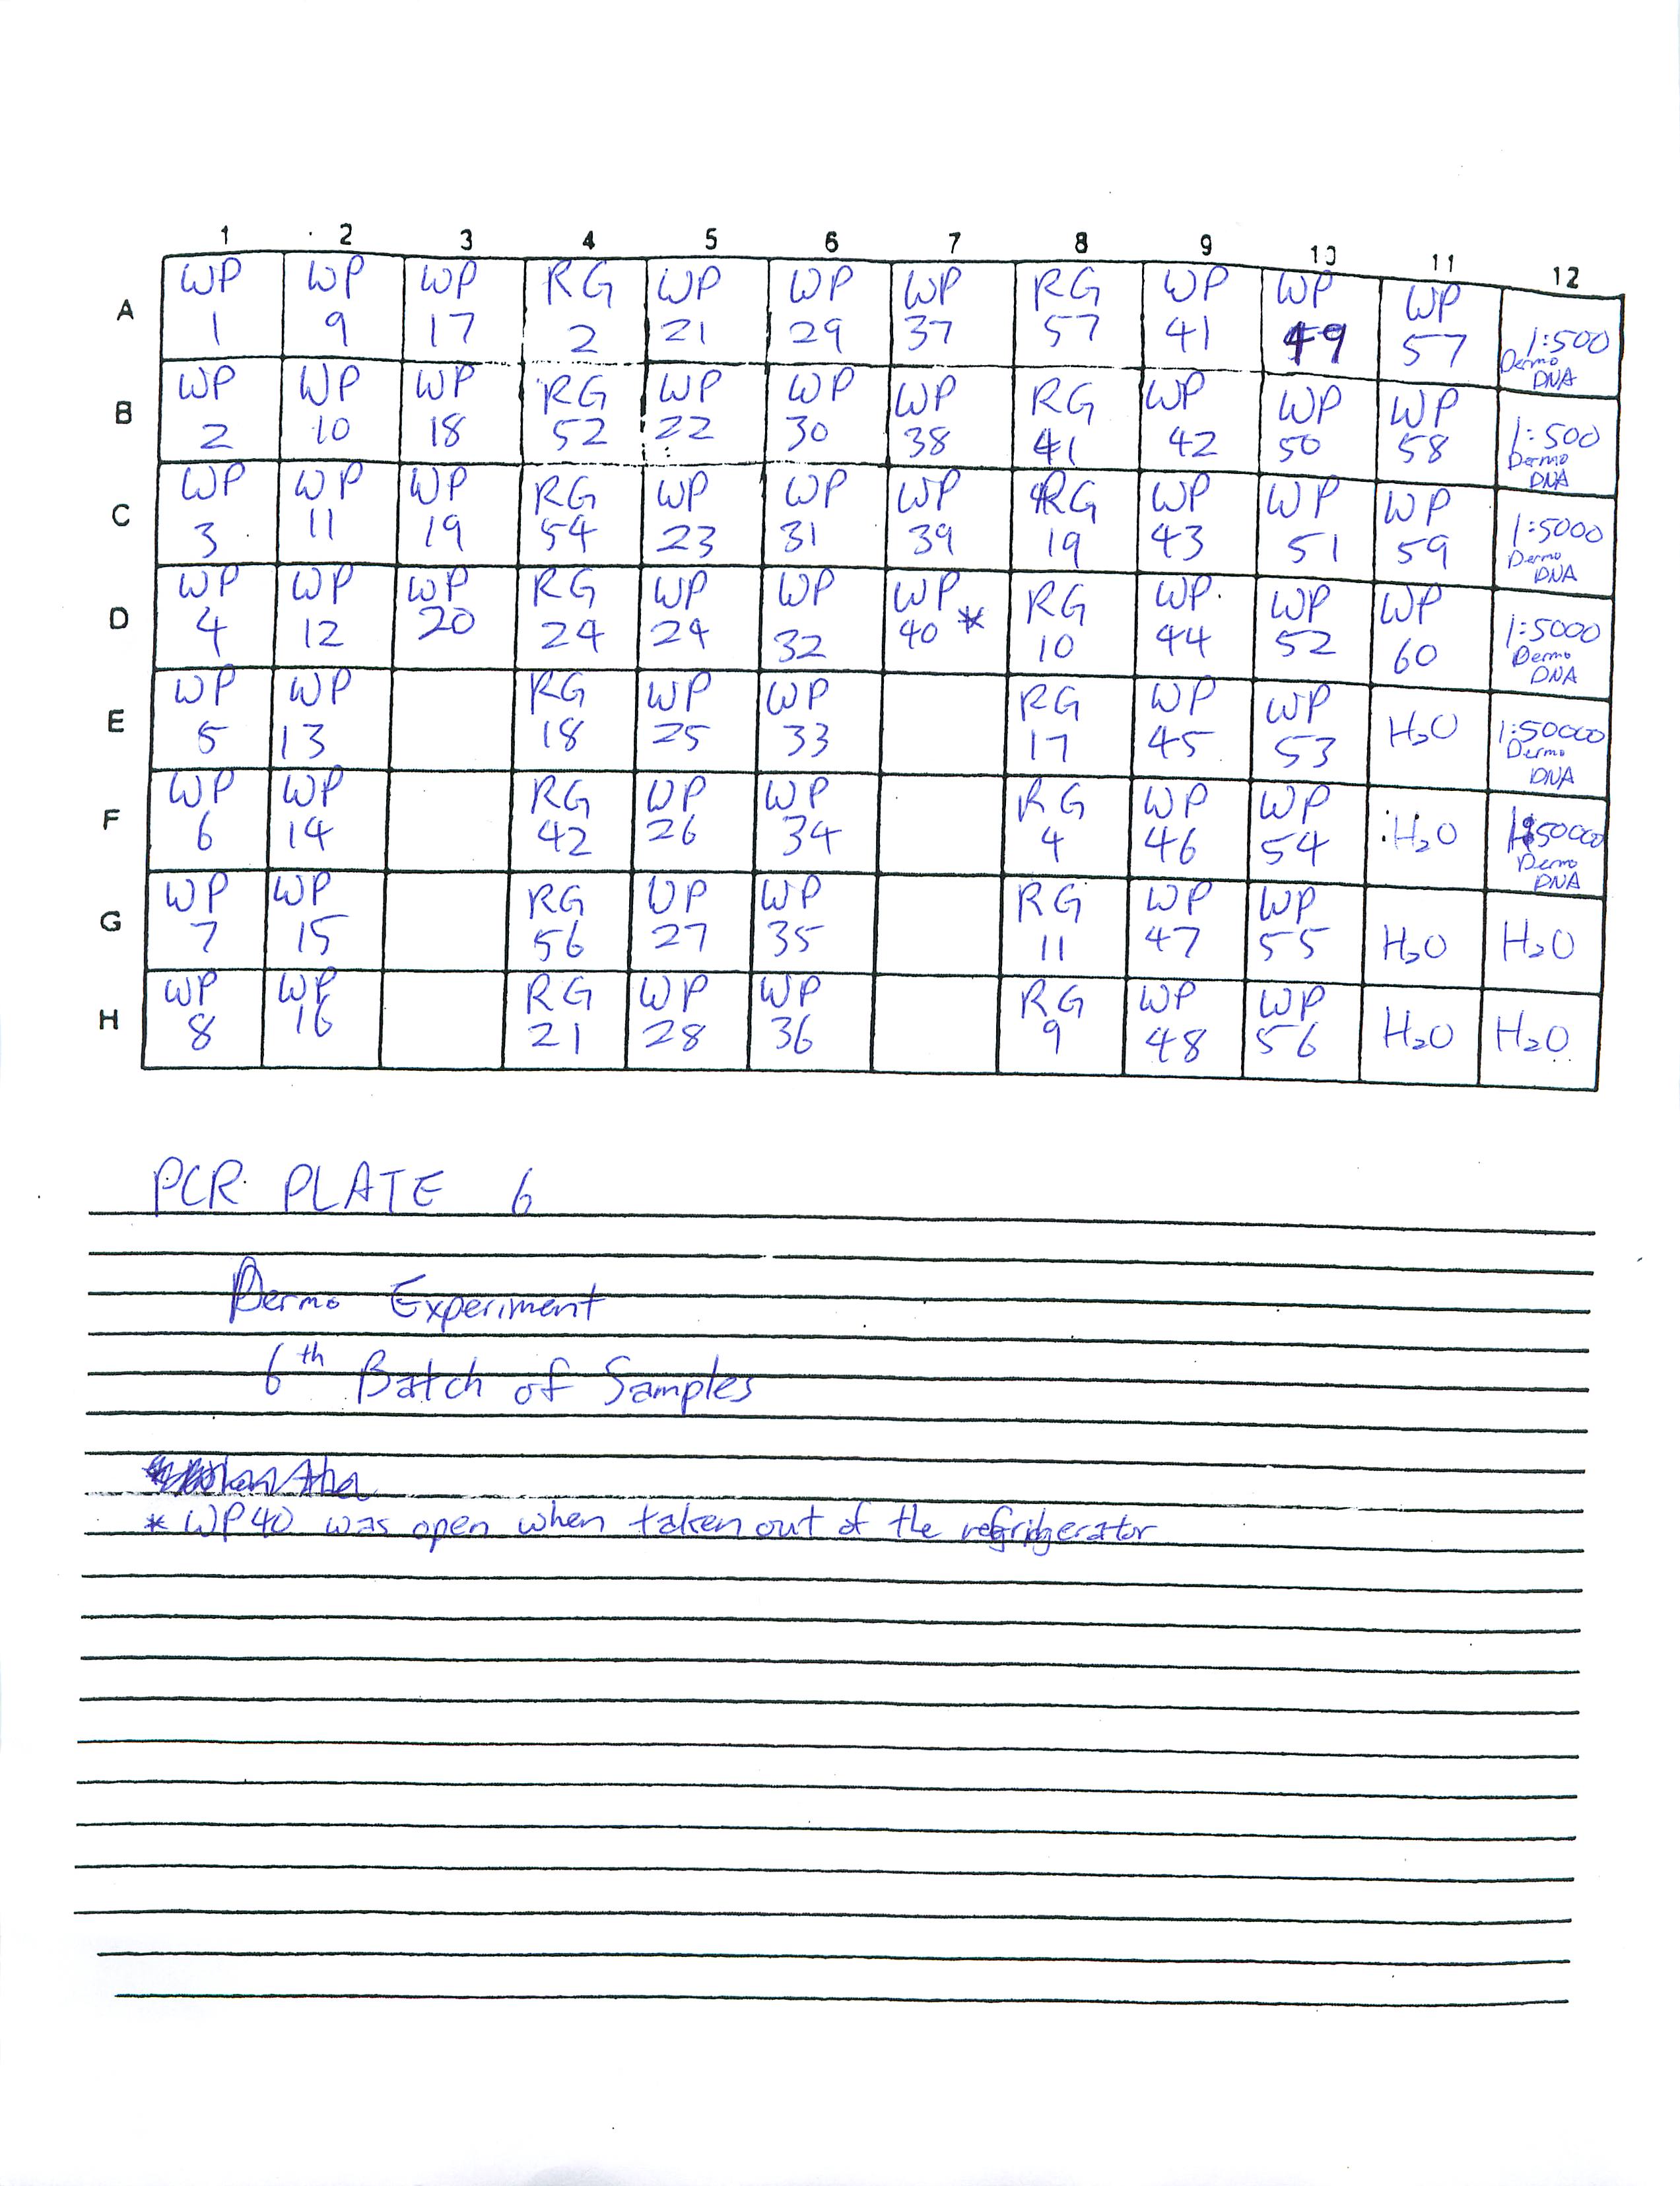
2-13-09
Prepared Real-Time PCR Plate 4 for Dermo Experiment and ran Real-Time PCR. Researched how to find the copy number for DNA and found a plethora of articles online.
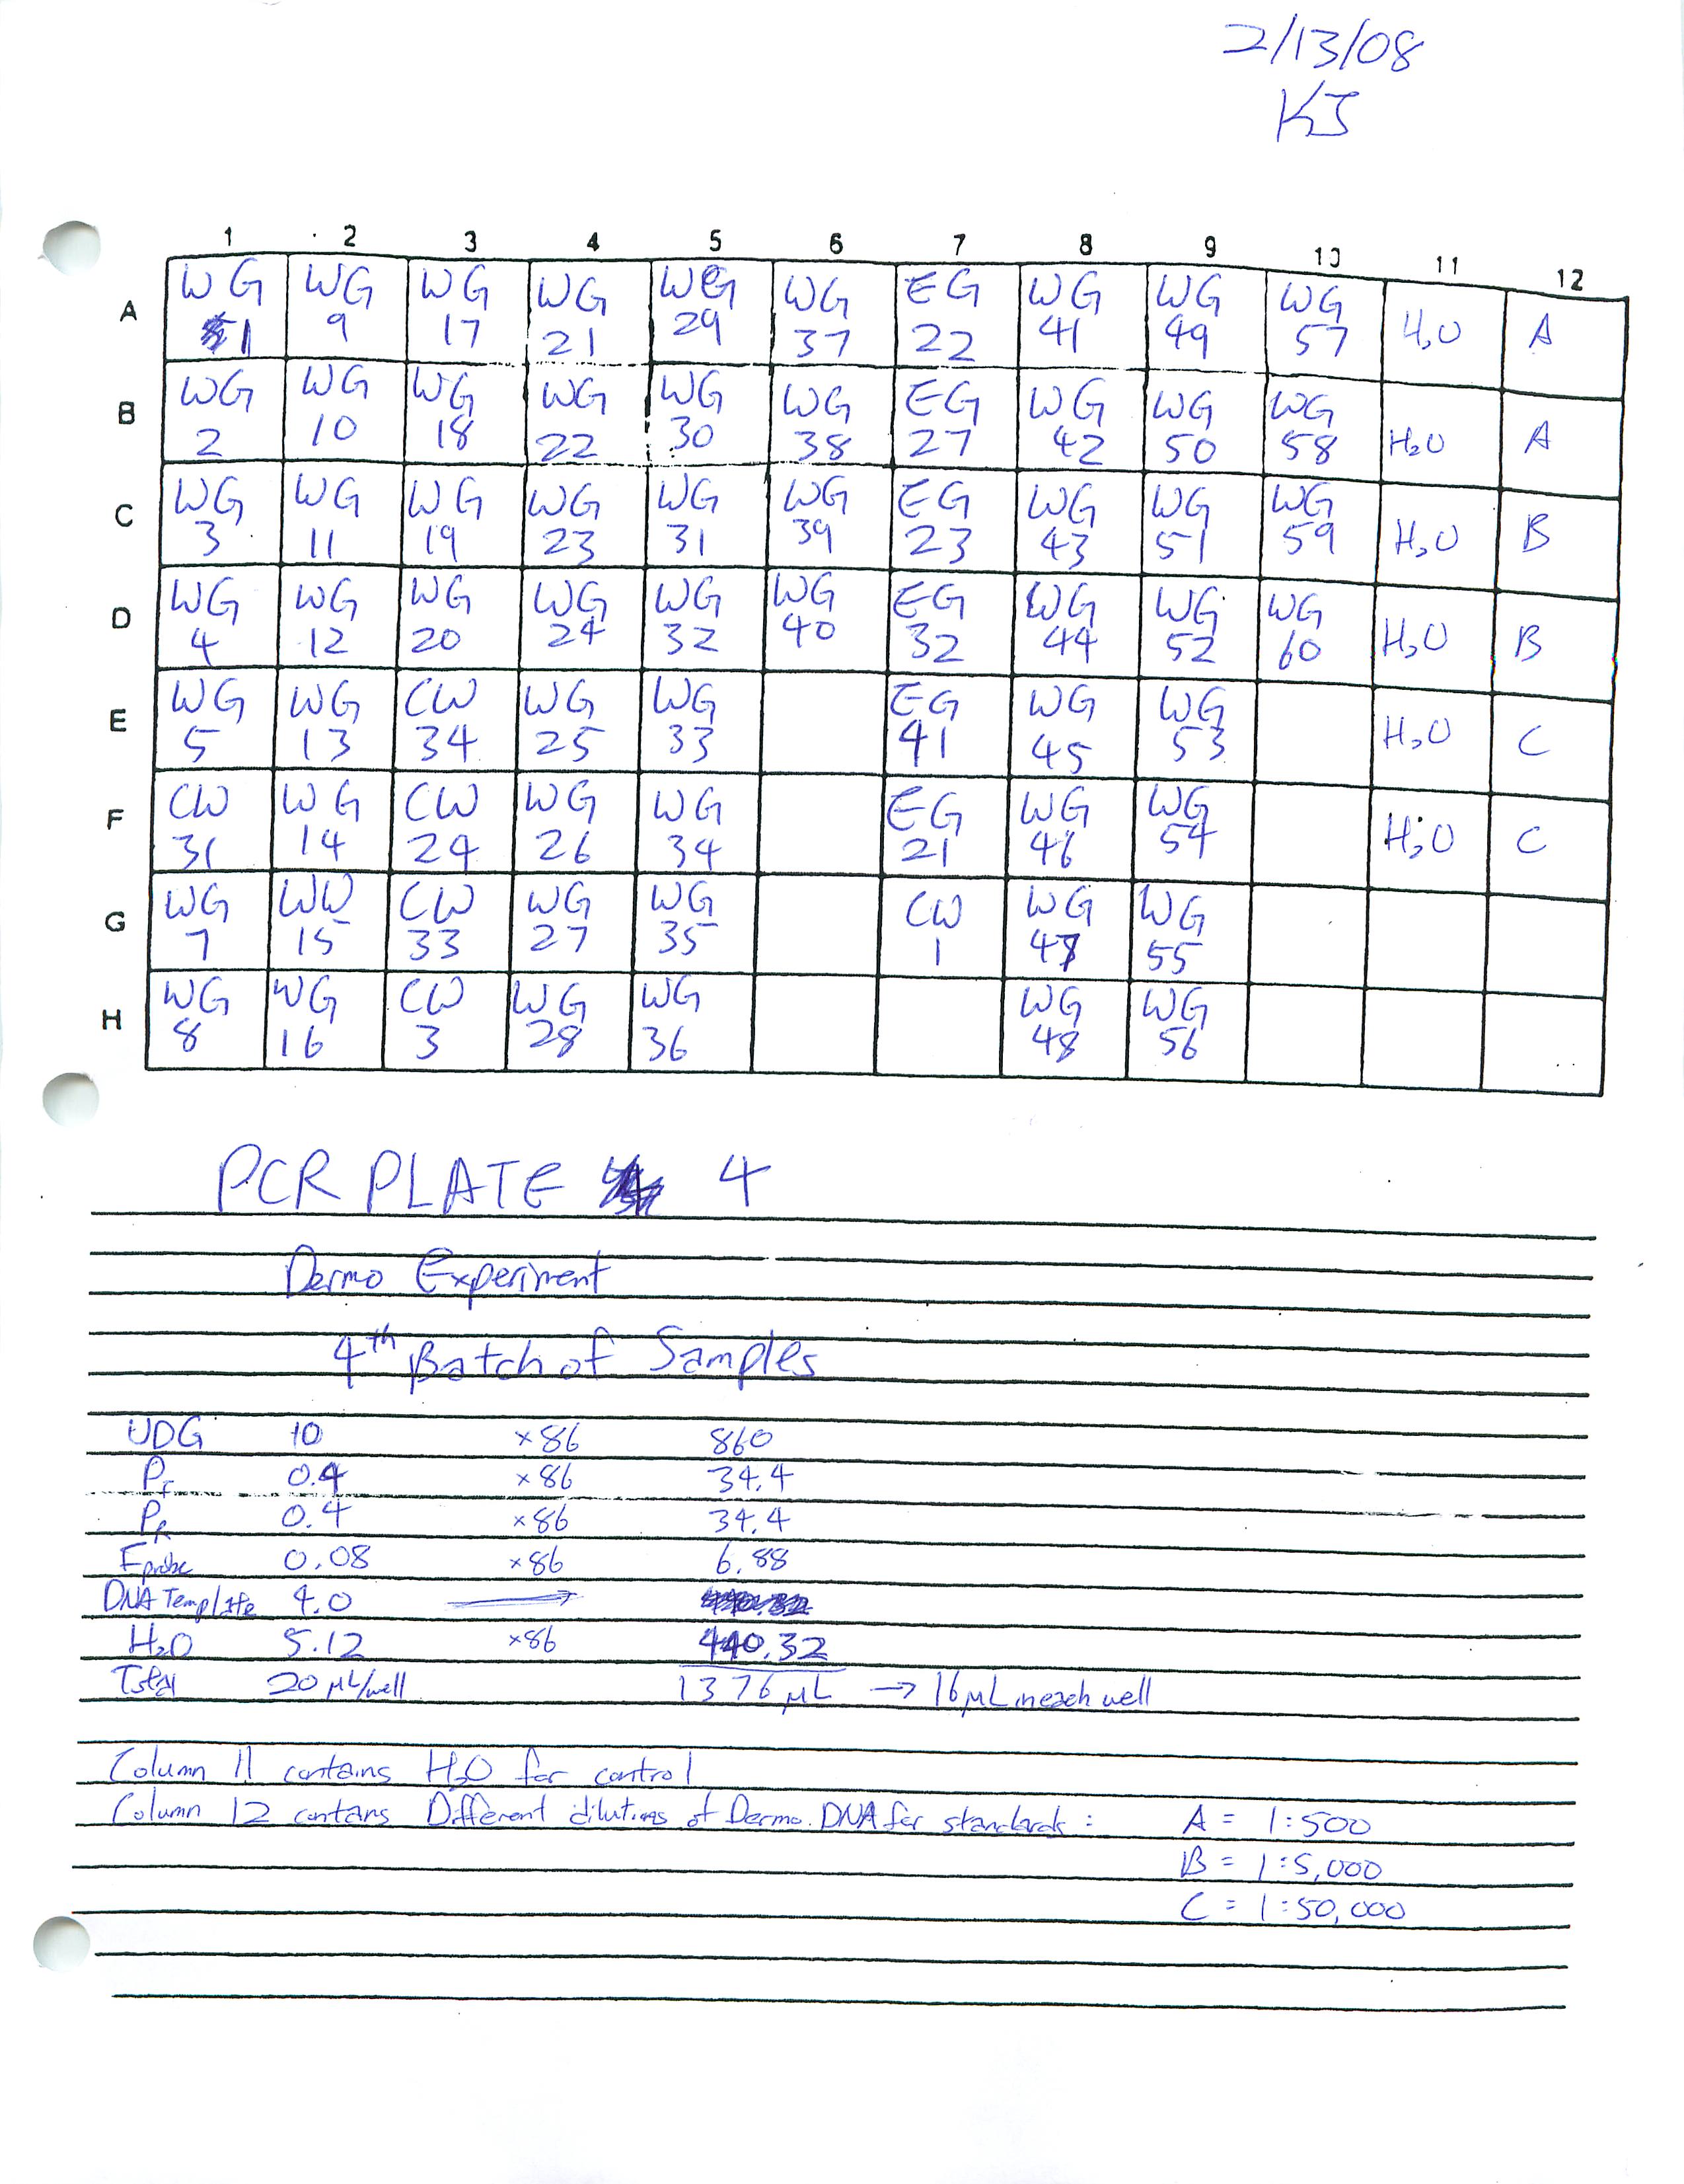
2-12-09 ]]
-
PCRs of Dungan isolates run yesterday were run on a 1% modified-TAE gel w/EtBr.
Lane 1 - 100bp Ladder
Lane 2 - VATm 1.2T
Lane 3 - VNTc 1.3T
Lane 4 - xCvC 11T
Lane 5 - xCvC 12T
Lane 6 - xCvE 13T
Lane 7 - xCvC17T
Lane 8 - xCvC19T
Lane 9 - BC05Ca-18t/H5
Lane 10 - H2O
Bands were excised from lanes 2, 3, 6, & 9. The band in Lane 9 appears to be of slightly higher molecular weeight than any of the other bands. Purified with Millipore Ultrafree-DA spin columns and submitted for sequencing on 2/13/2009.
2-11-09
Prepared Dungan isolates for PCR using 2XGotaq master mix. 4 microliters of template was used in a total of 20 microliters of PCR sample. The 8 samples were then put through the thermal cycler with the following cycle:
1) 95 degrees celsius for 10 minutes
2) 40 cycles of:
1. 95 degrees celsius for 45 seconds
2. 53 degrees celsius for 45 seconds
3. 72 degrees celsius for 1:00 minute
3) 72 degrees celsius for 10 minutes
Continued Dermo experiment with the third batch of samples using the protocol outlined on entree 2-05-09.
(Image of Real-Time PCR will be scanned soon)
2-9-09
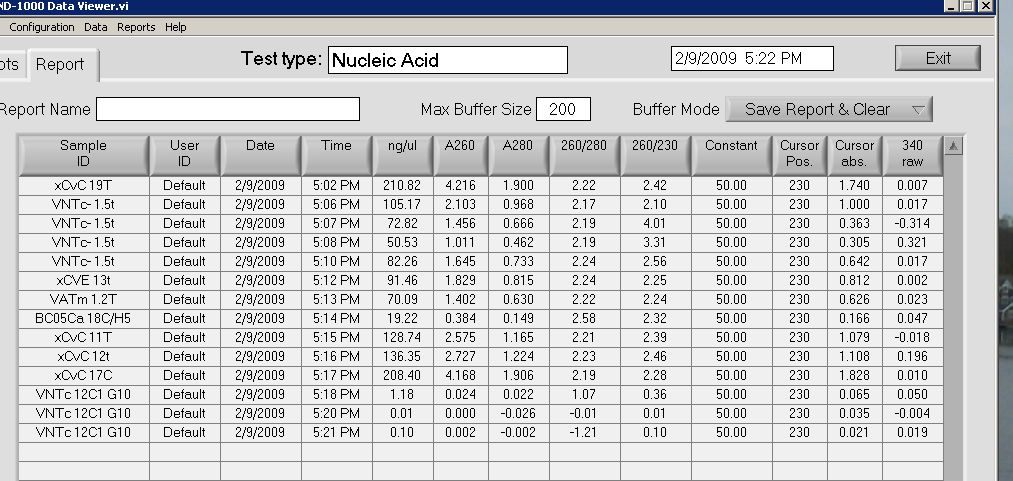
After Sam prepared the samples, DNeasy Tissue Handbook's protocol was followed with the following configurations:
Rather than pipeting 200 microliters of Buffer AE, only 100 microliters was pipetted. Step 9 was excluded from the procedure. Used a spectrophotometer to quantitate the amount of DNA in solution. For one of the samples, no DNA was present.
-
Isolation of gDNA from 9 Dungan isolates was performed uinsg the Qiagen DNEasy Kit. The samples stored in EtOH were well mixed and 200uL were transferred to fresh 1.5mL snap-cap tubes. These new tubes were spun @ RT, max speed for 5 mins. Supernatant was removed from pellets and the tubes were incubated @ 37C to evaporate remaining EtOH. Pellets were resuspended in 180uL of Buffer ATL. 20uL of Proteinase K was added to each sample. Tubes were vortexed and incubated at 55C for 1hr and 41mins with periodic mixing. Kevin took over at this point.
2-5-09
Took a look at the real-time PCR data for first PCR plate and it turned out well.
Prepared PCR Plate 2 for real-time PCR by creating a master mix like last time with 12 extra samples (6 water controls and 6 dilutions of dermo DNA). Note that we have been using a 1:10 dilution of fluorogenic probe for the reactions. We have been using the following process:
1) Create master mix for a 20 microliter sample with 4 microliters of DNA template using:
Platinum Quantitative PCR SuperMIx-UDG
Forward Primer
Reverse Primer
Florogenic Probe 1:10 dilution
Water2) Heat DNA at 95 degrees celsius for 30 minutes 3) Centrifuge the samples for 10 minutes.4) Add samples and master mix appropriately to PCR plate.
5) Cap with a flat-top cap.
6) Run real-time PCR as following: 1. 50 degrees celsius for 2 minutes.
2. 95 degrees celsius for 2 minutes.
3. 40 cycles of:
95 degrees celsius for 30 seconds
60 degrees celsius for 45 seconds
4. 21 degrees celsius for 10 minutes.
For more data on PCR Plate 2, refer to the PCR data graph on computer.
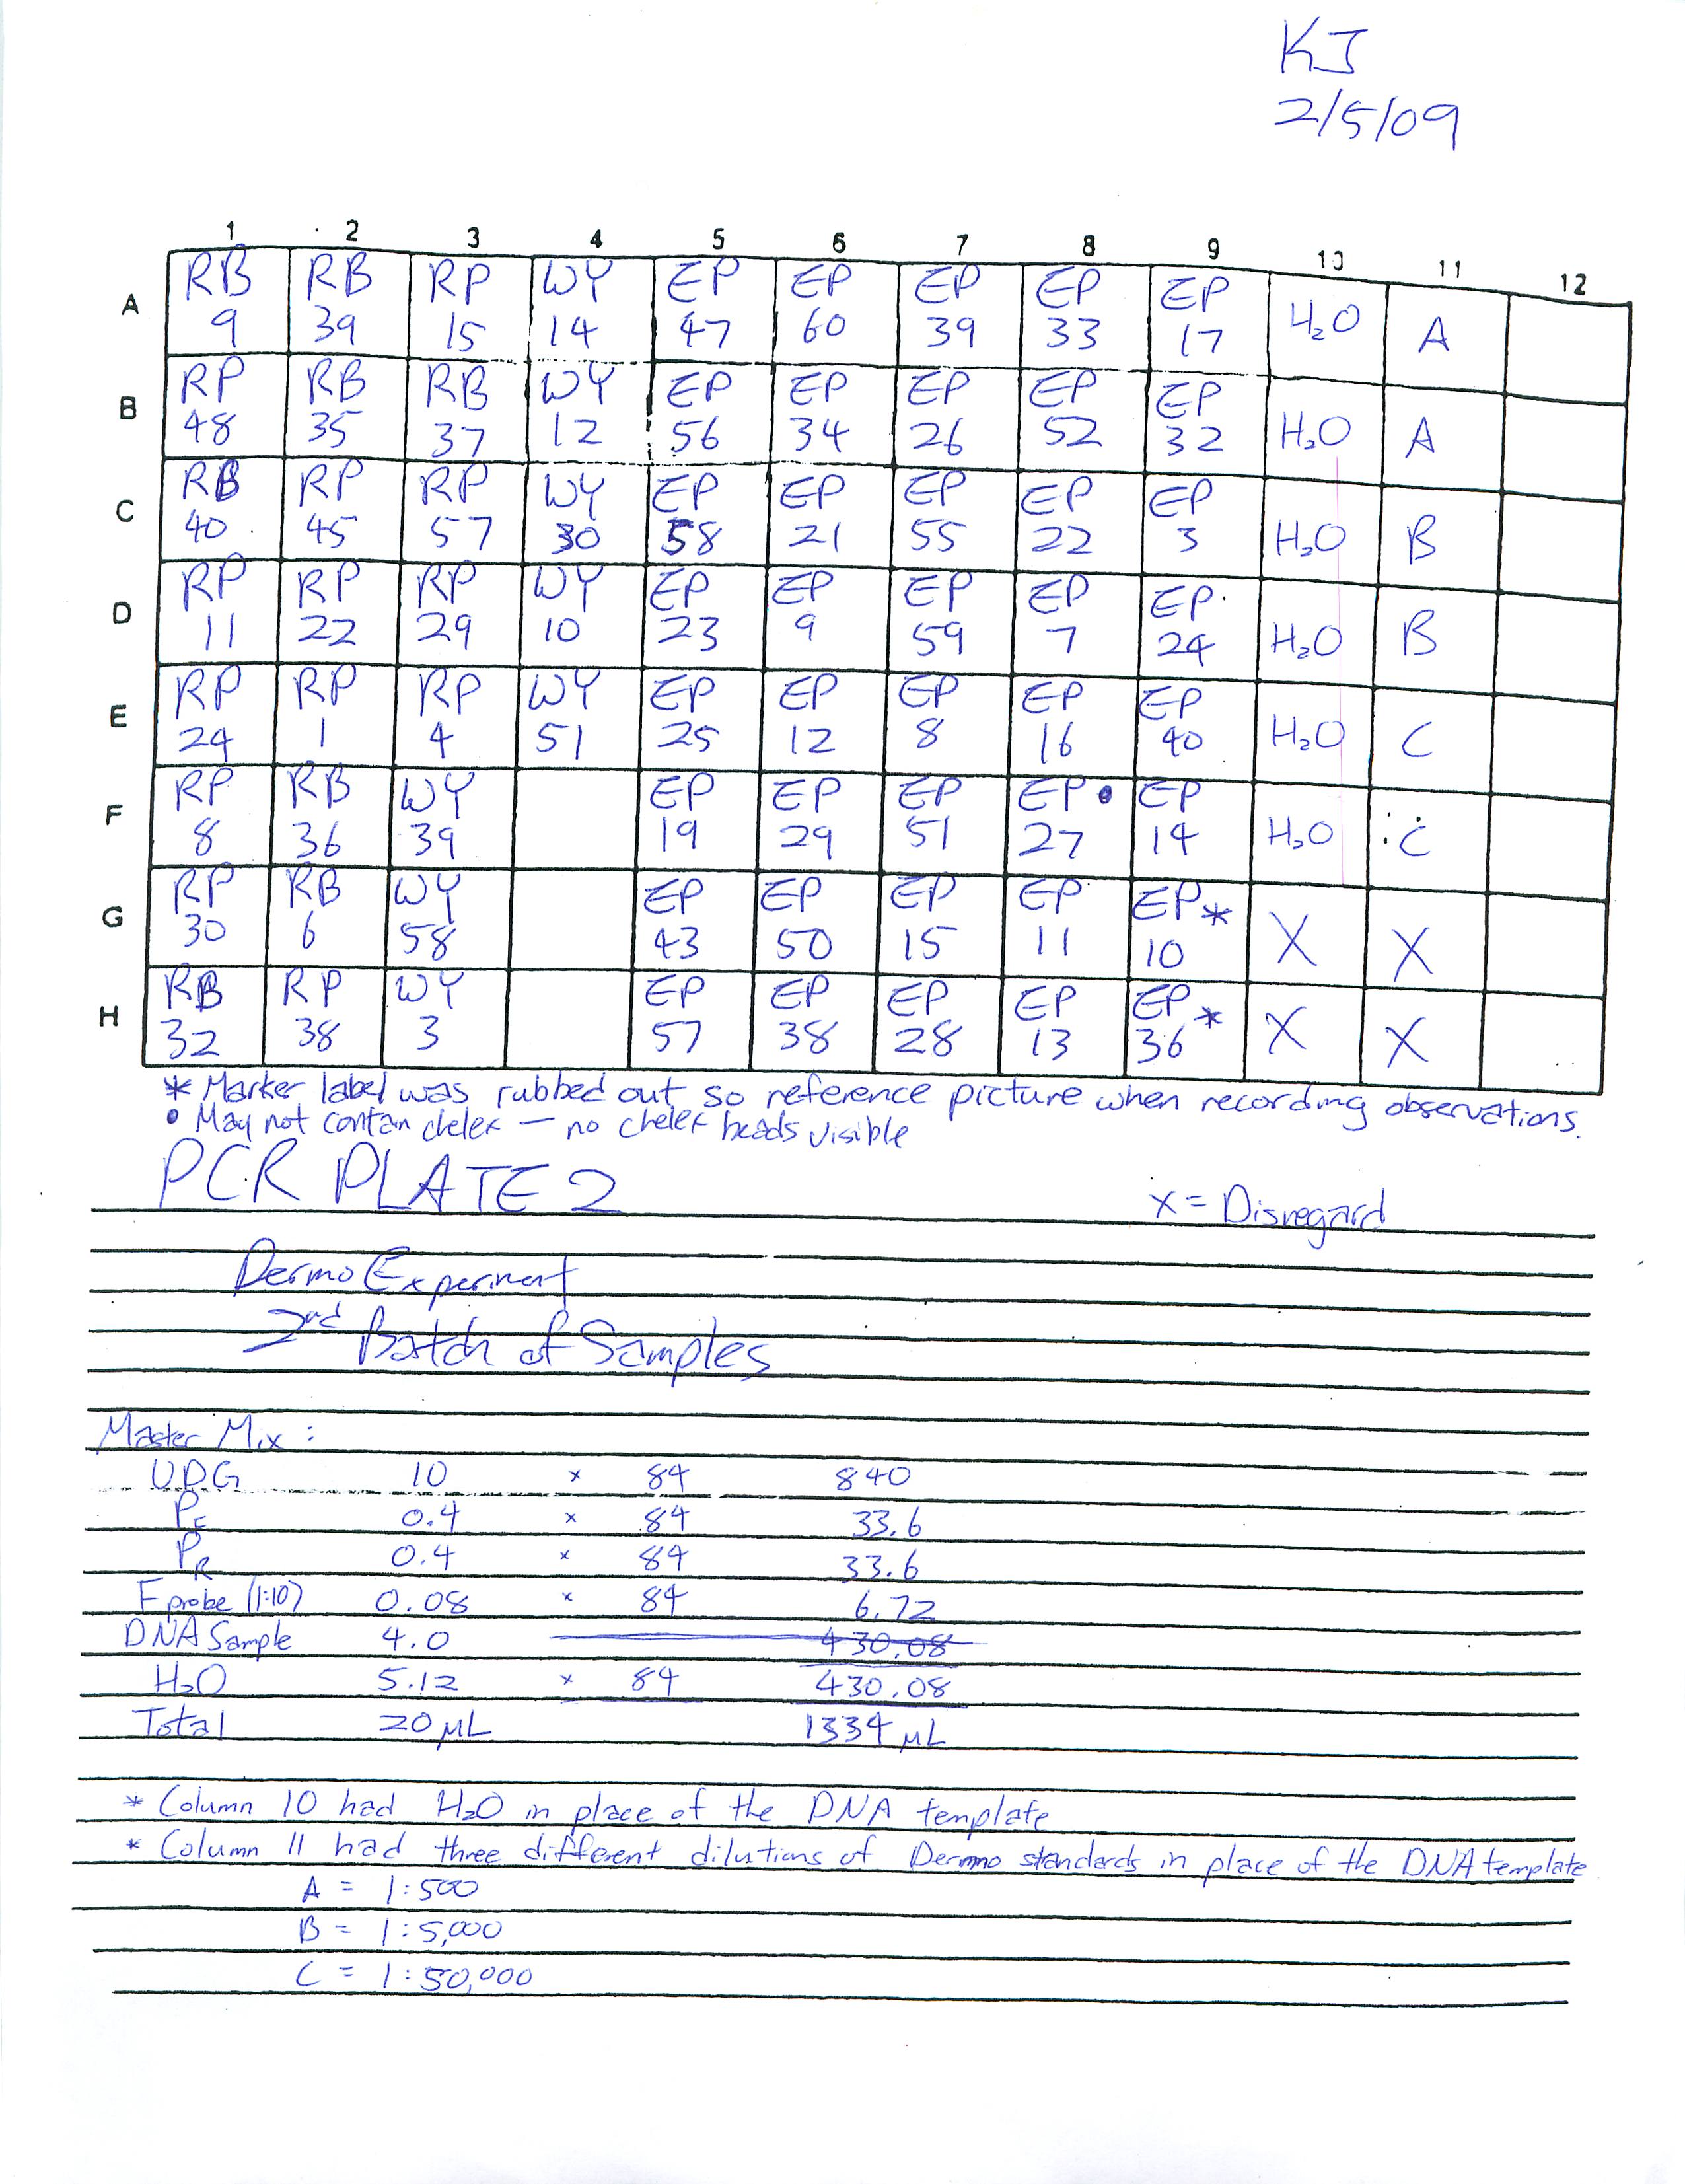
Also, the Scallop PCR from yesterday was continued. A 1% agarose gel was made by mixing solid agarose with TAE and heating until solids were dissolved. The mixture was then brought back up to volume to make up for the liquid lost as vapor. The mixture was allowed to cool for about 30 minutes and poured into the mold (while Ethidium bromide was supposed to be added, I accidentally skipped ahead and poured the mixture into the mold. EtBr was added after the gel had run and, thus, took longer than was necessary). The twelve samples made from yesterday were run and the following is a picture of the result.
Starting from left:Lane 1: Bay Scallop with Bay Actin Reverse PrimerLane 2: Sea Scallop with Bay Actin Reverse PrimerLane 3: Bay (male) and Sea (female) Hybrid with Bay Actin Reverse PrimerLane 4: Bay (female) and Sea (male) Hybrid with Bay Actin Reverse PrimerLane 5: Water Control with Bay Actin Reverse PrimerLane 6: Bay Scallop with Sea Actin Reverse Primer 2Lane 7: Sea Scallop with Sea Actin Reverse Primer 2Lane 8: Bay (male) and Sea (female) Hybrid with Sea Actin Reverse Primer 2Lane 9: Bay (female) and Sea (male) Hybrid with Sea Actin Reverse Primer 2Lane 10: Wate Control with Sea Actin Reverse Primer 2Lane 11: 100 bp Ladder
*Sea Actin Reverse Primer 1 was not tested.
Note that we had the same forward primer for both the scallops but two reverse primers pertaining to the specific scallop. However the last time they ran, we noticed there were something wrong so this time, we created two different sets of samples to also test the two reverse primers. The following is a picture of the gel after being run:
There are some bands on lane 1, 2, and 11. Logically, we should have gotten either a band on 1 OR 2 (preferably 1), not 1 AND 2. In theory, we should have gotten some bands on land 1, 3, 4, 7, 8, 9, and 11. Lanes 1 and 7 would have been logical for bands to appear since the proper forward and reverse primers were matched up. Lanes 3, 4, 8, and 9 should have shown some band since it was a hybrid of Sea and Bay scallops. I am not too sure what happened during the experiment but we will have to see what the next step is.
2-4-09
Unfortunately, I was unable to look at the Real-Time PCR data because the machine was being used. However, I was told the graph turned out well.
Went back to Scallop Experiment and prepared to run another PCR of the Bay, Sea, and two "Hybrid" (Bay male and Sea female, Bay female and Sea male) scallops. Prepared the reactions following previous calculations (refer to entree on 1-15-2009) but for 10 samples. There were two reverse primers so there had to be two reactions of each samples as well as the water control--four samples and one water control for each set of primers (there were two sets of primers). The PCR reactions were set to run as following:
1) 95 degrees celsius for 10 minutes
2) 95 degrees celsius for 45 seconds
3) 53 degrees celsius for 45 seconds
4) 72 degrees celsius for 1 minute
5) go back to step 2, 39 more times
6) 72 degrees celsius for 10 minutes
An electrophoresis gel will be run next time.
2-2-09
Prepared and ran Real Time PCR plate for first batch of Dermo Experiment Sample. A master mix was made using the previous ratios but with a total volume of 20 microliters. On the same plate, 6 water samples were used and 3 different dilutions of the Dermo DNA standards were used (2 of each dilutions were used, creating a total of 6 Dermo DNA standards). For data, refer to the Real Time PCR sheet and file. Data will be looked at during next session.
1-30-09
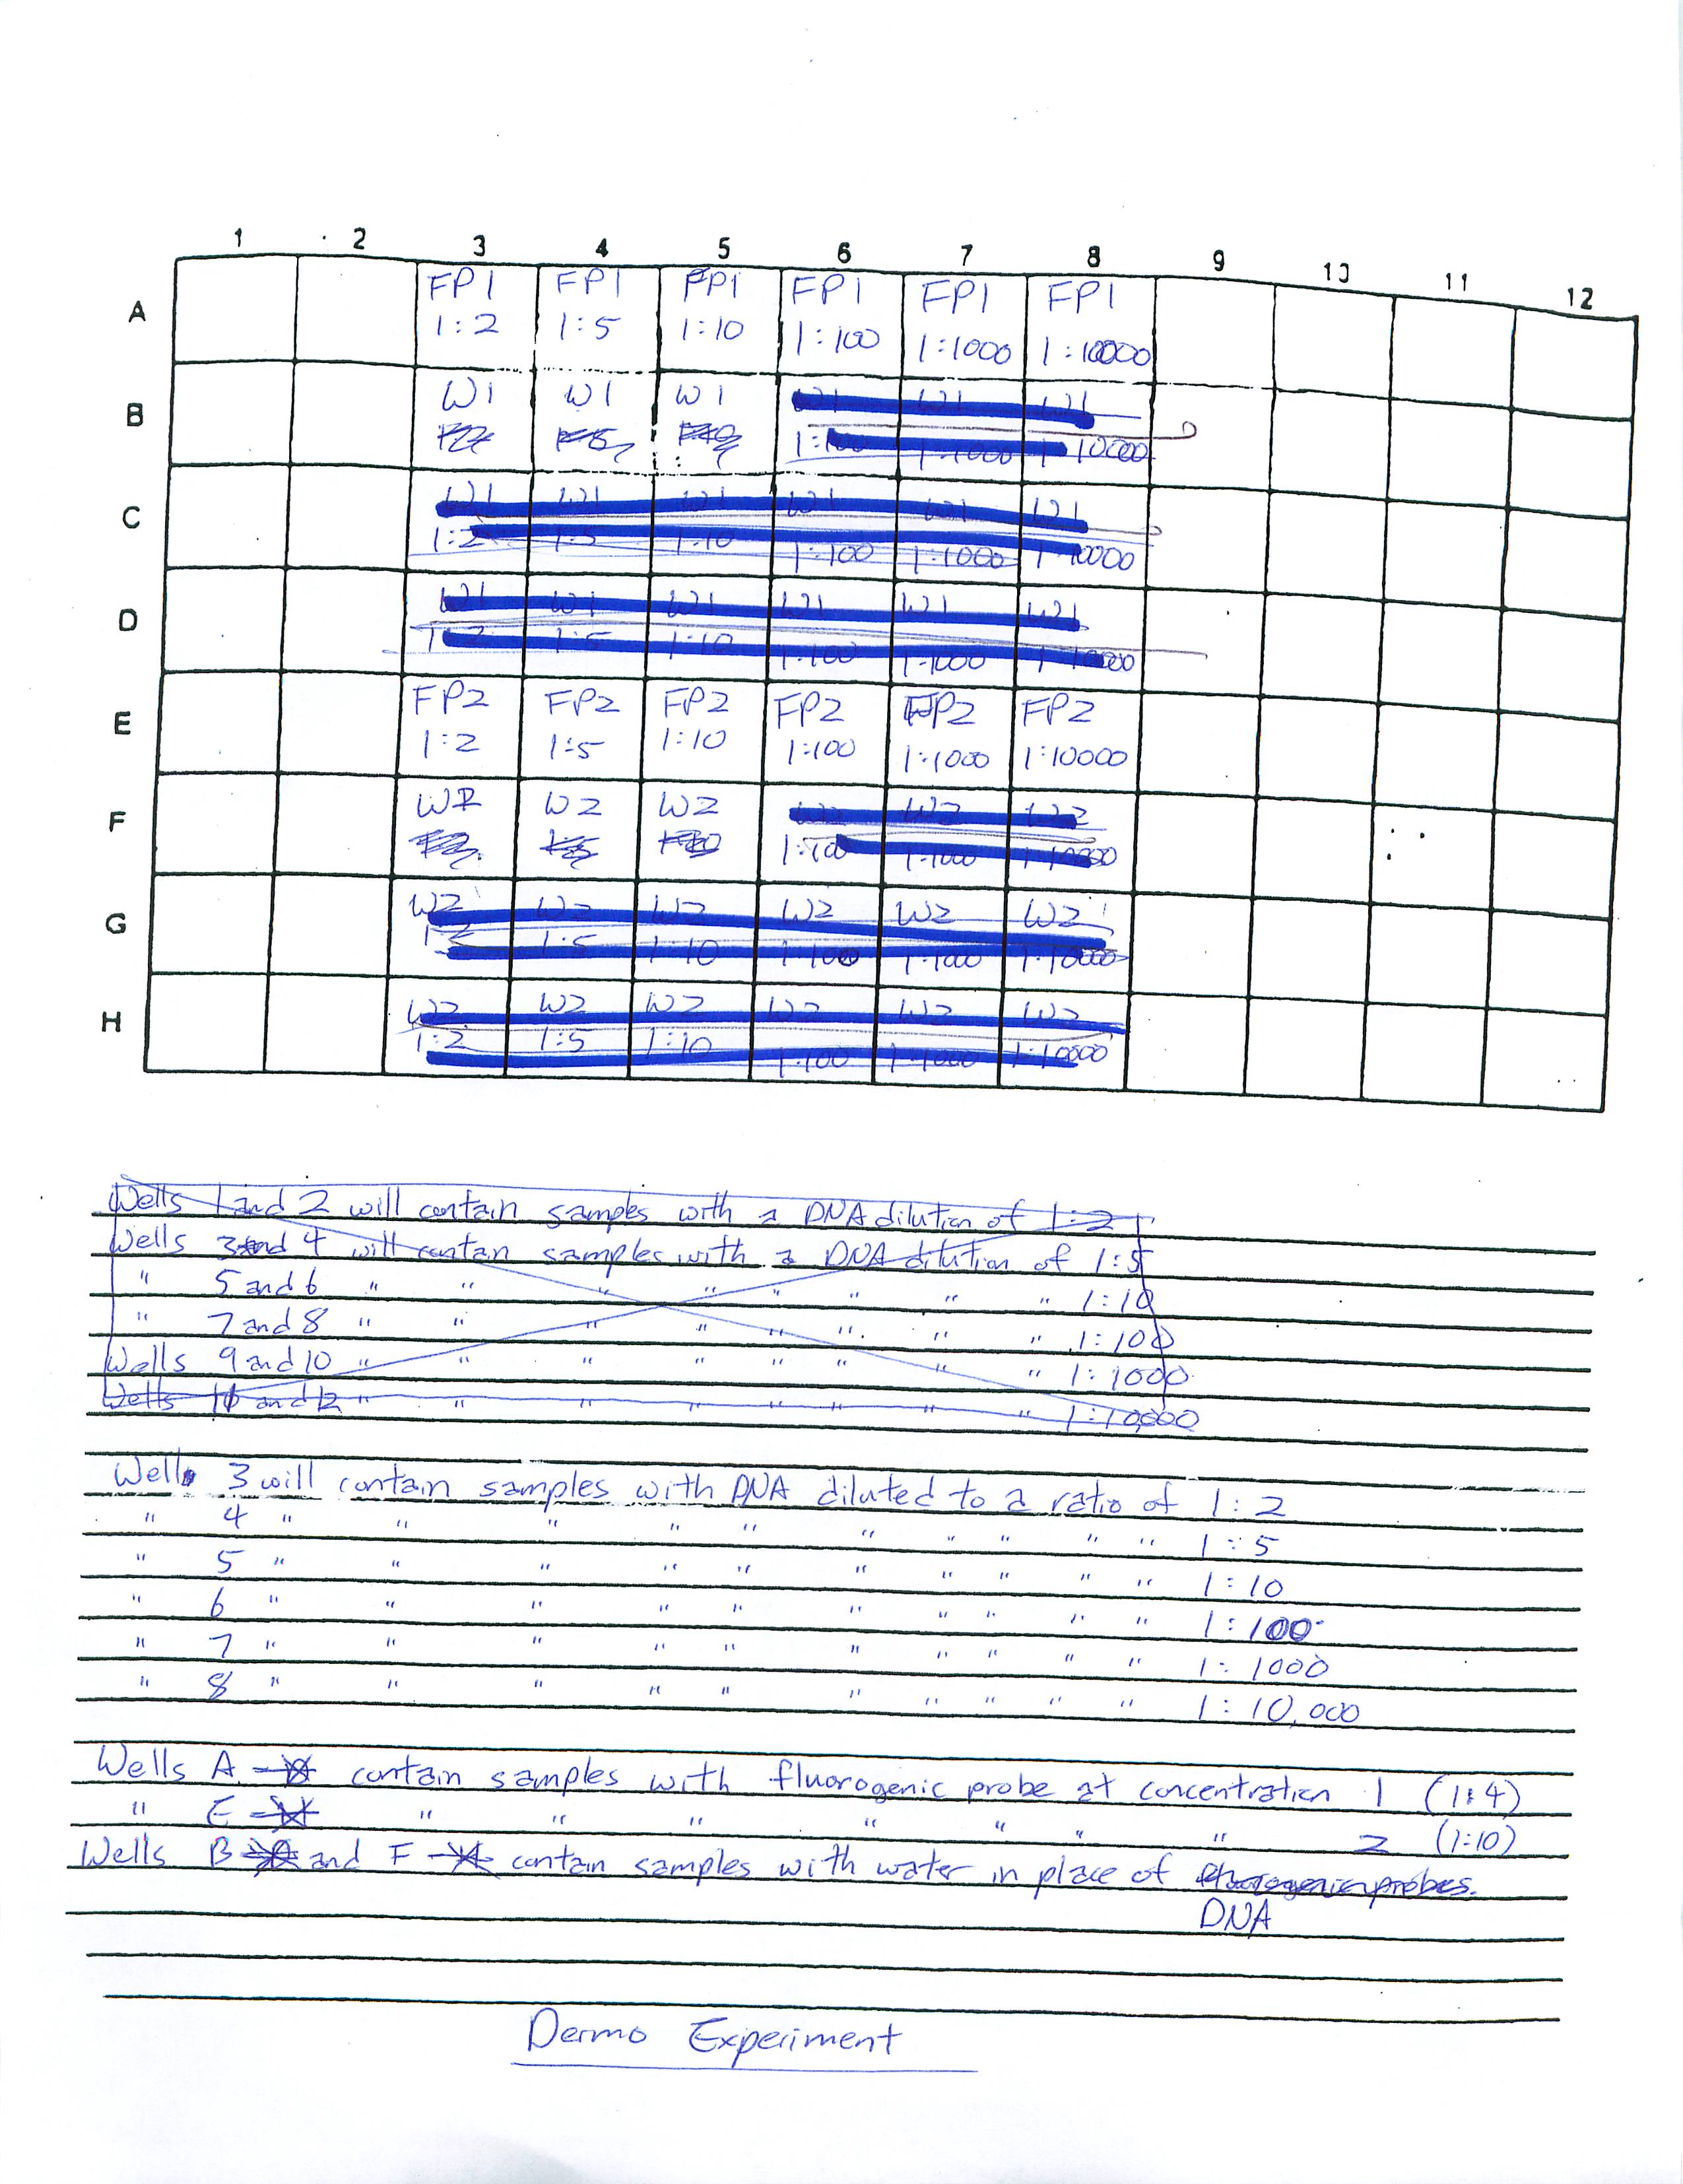
Prepared a Real Time PCR plate for Dermo control. We are going to try to find the optimum dilution for the DNA (1:2, 1:5, 1:10, 1:100, 1:1000, 1:10000) and, at the same time, see what concentration the Fluorgenic probe is (a 1:4 and 1:10 mixture of the Fluorogenic probe was used).
Each slot was to hold a total of 25 microliters of a given mixture. One mixture would include the following:
| Platinum Quantitative PCR SuperMix-UDG |
12.5 microliters |
| Forward Primer |
0.5 microliters |
| Reverse Primer |
0.5 microliters |
| Various Dilutions of Fluorogenic Probe |
0.25 microliters |
| Various Dilutions of Dermo DNA Sample |
1 microliters |
| Water |
10.25 microliters |
| Total |
25 microliters |
Two master mixes were made consisting of the Platinum Quantitative PCR Supermix-UDG, Forward Primer, Reverse Primer, Fluorogenic Probe, and Water:
| Platinum Quantitative PCR SuperMIx-UDG |
12.5 microliters *10 |
125 microliters |
| Forward Primer |
0.5 microliters *10 |
5 microliters |
| Reverse Primer |
0.5 microliters *10 |
5 microliters |
| Fluorogenic Probe (1:4 or 1:10 dilution) |
.25 microliters *10 |
2.5 microliters |
| Water |
10.25 microliters *10 |
102.5 microliters |
| Total volume of each Master Mix |
240 microliters |
Six samples of the six different DNA dilution using the Fluorogenic probe dilution of 1:4, six samples of the six different DNA dilution using the Fluorogenic probe dilution of 1:10, 3 samples using water as control in place of DNA using Fluorogenic proble dilution 1:4, and 3 samples using water as control in place of DNA using Fluorogenic proble dilution 1:10 were loaded as shown:
The PCR cycle is as following:
1. 50 degrees celsius for 2 minutes.
2. 95 degrees celsius for 2 minutes.
3. 40 cycles of:
95 degrees celsius for 30 seconds
60 degrees celsius for 45 seconds
4. 21 degrees celsius for 10 minutes.
With 40 minutes left on the machine, the data being produced looks promising. I will check back next week.
1-29-09
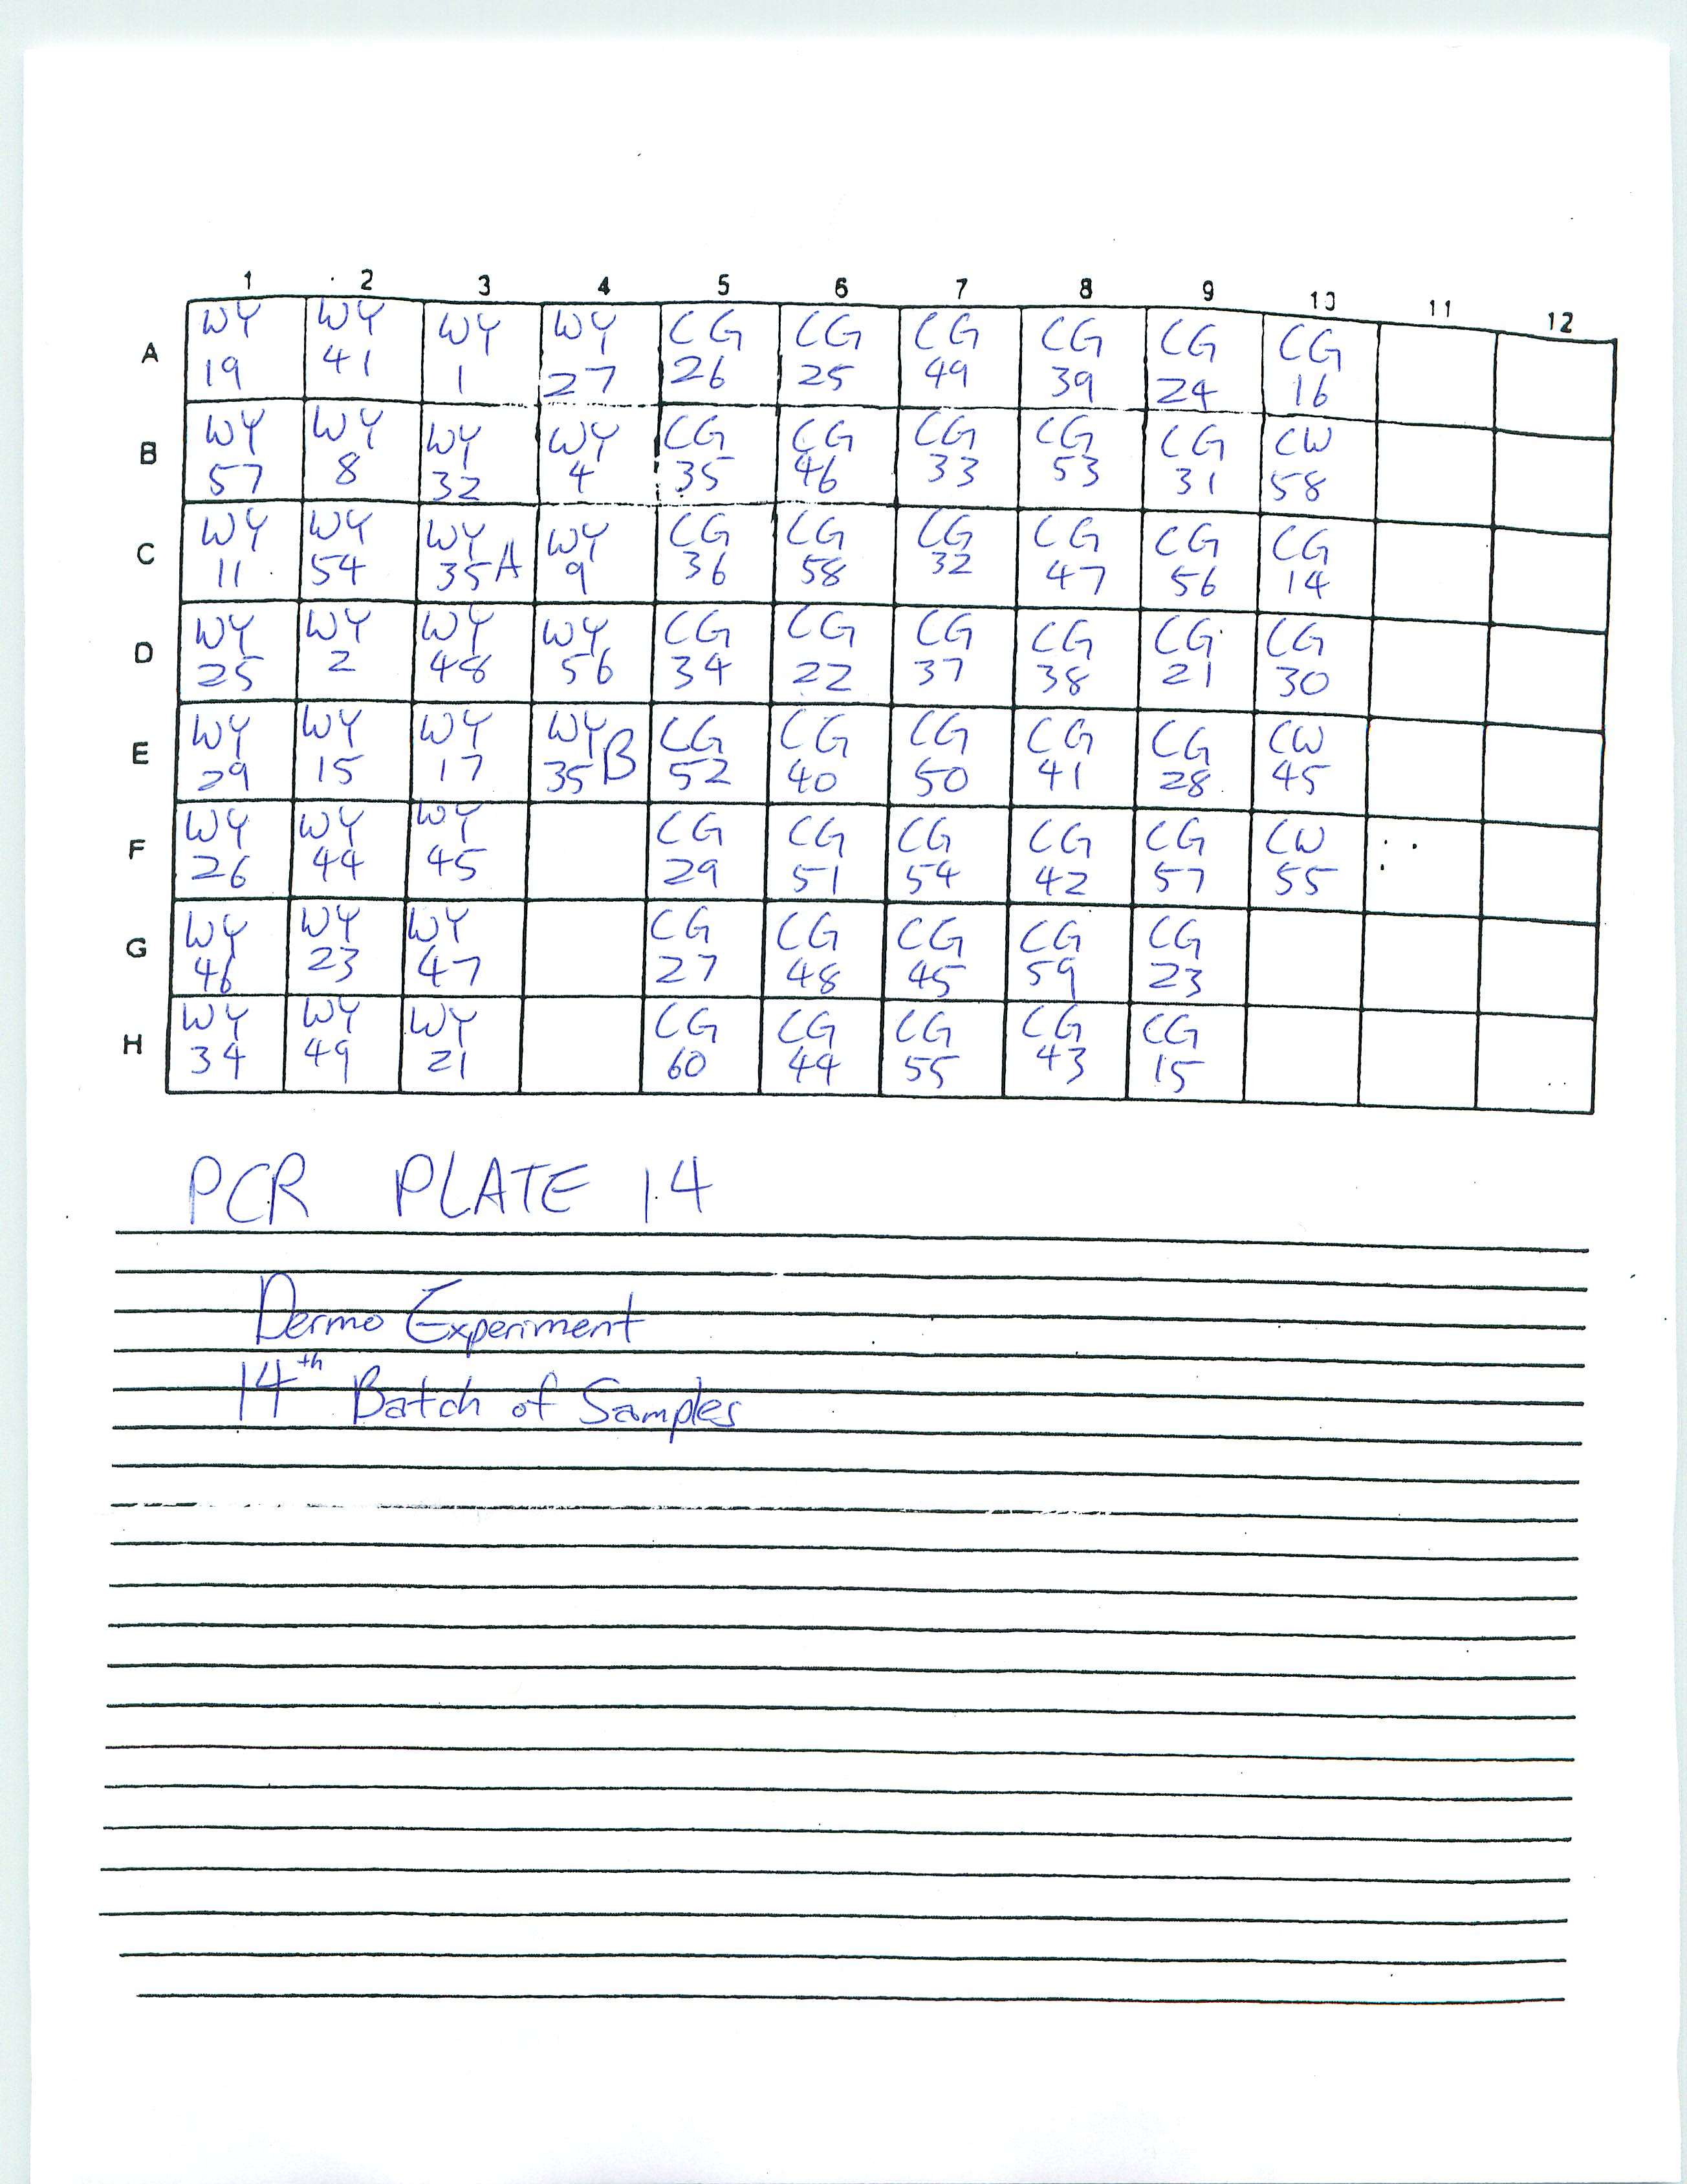
Finished preparing PCR Plates 14 and 15.

1-26-09
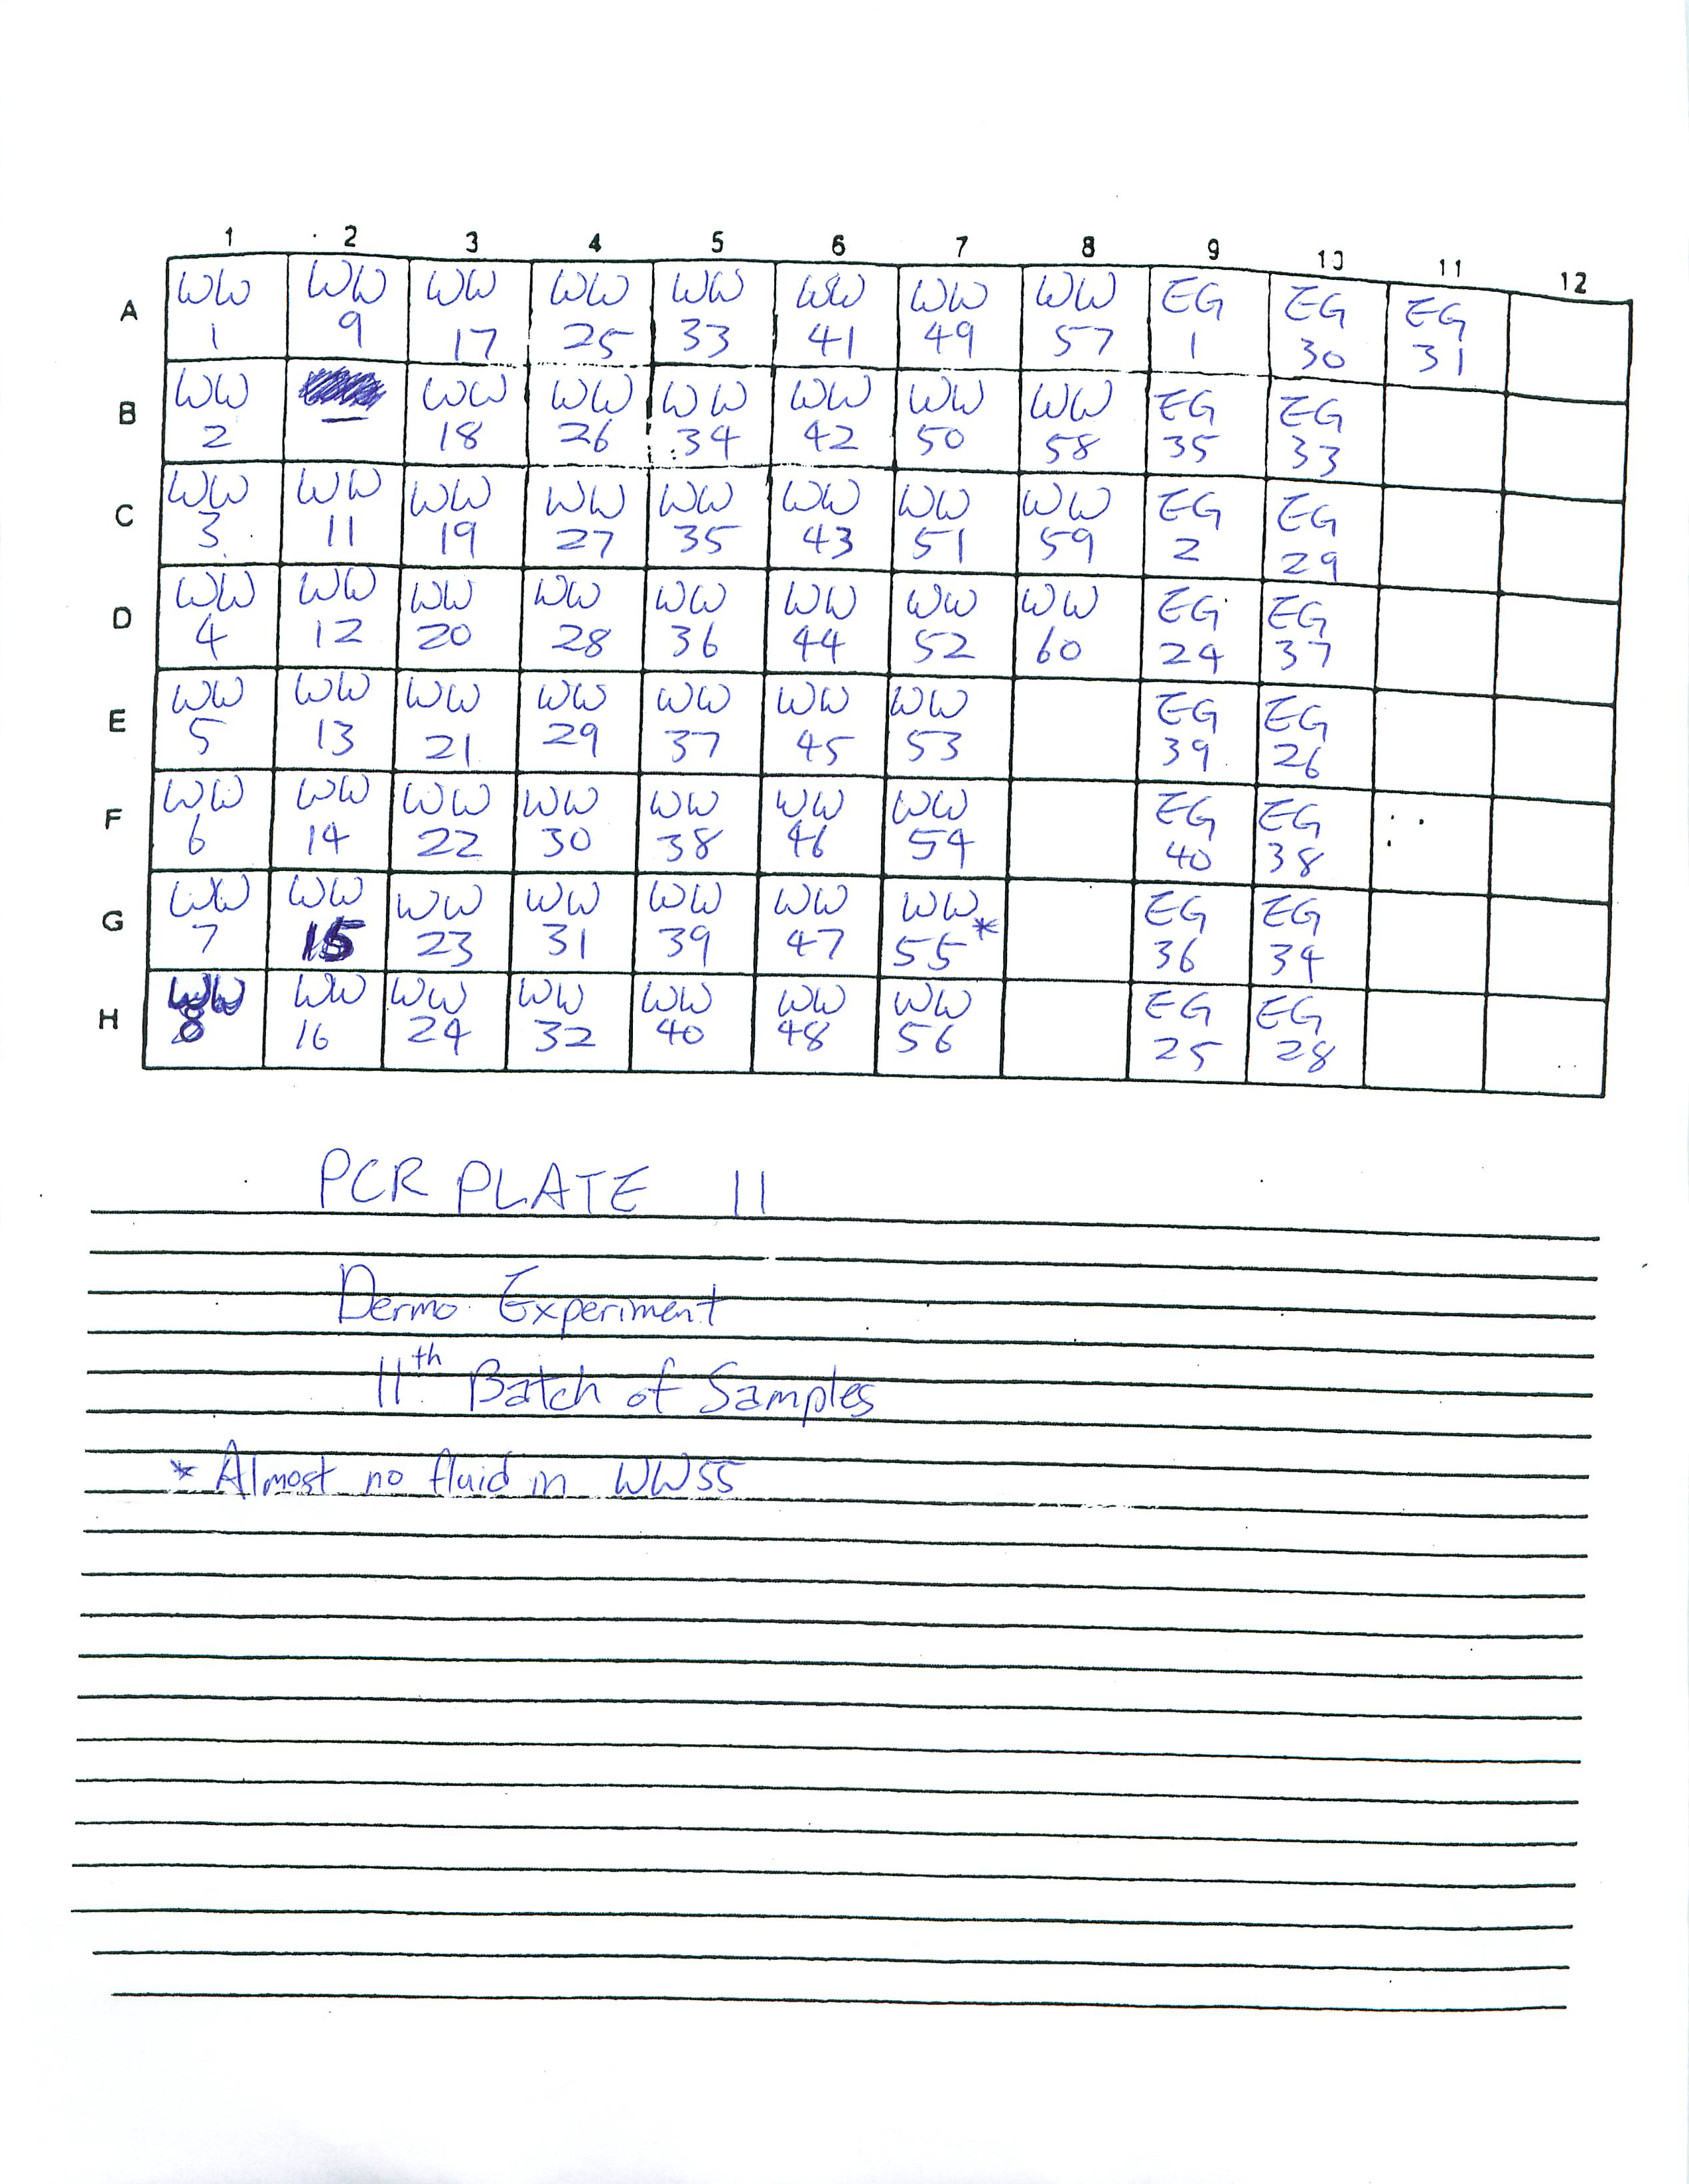
Finished preparing PCR Plates 11, 12, and 13.
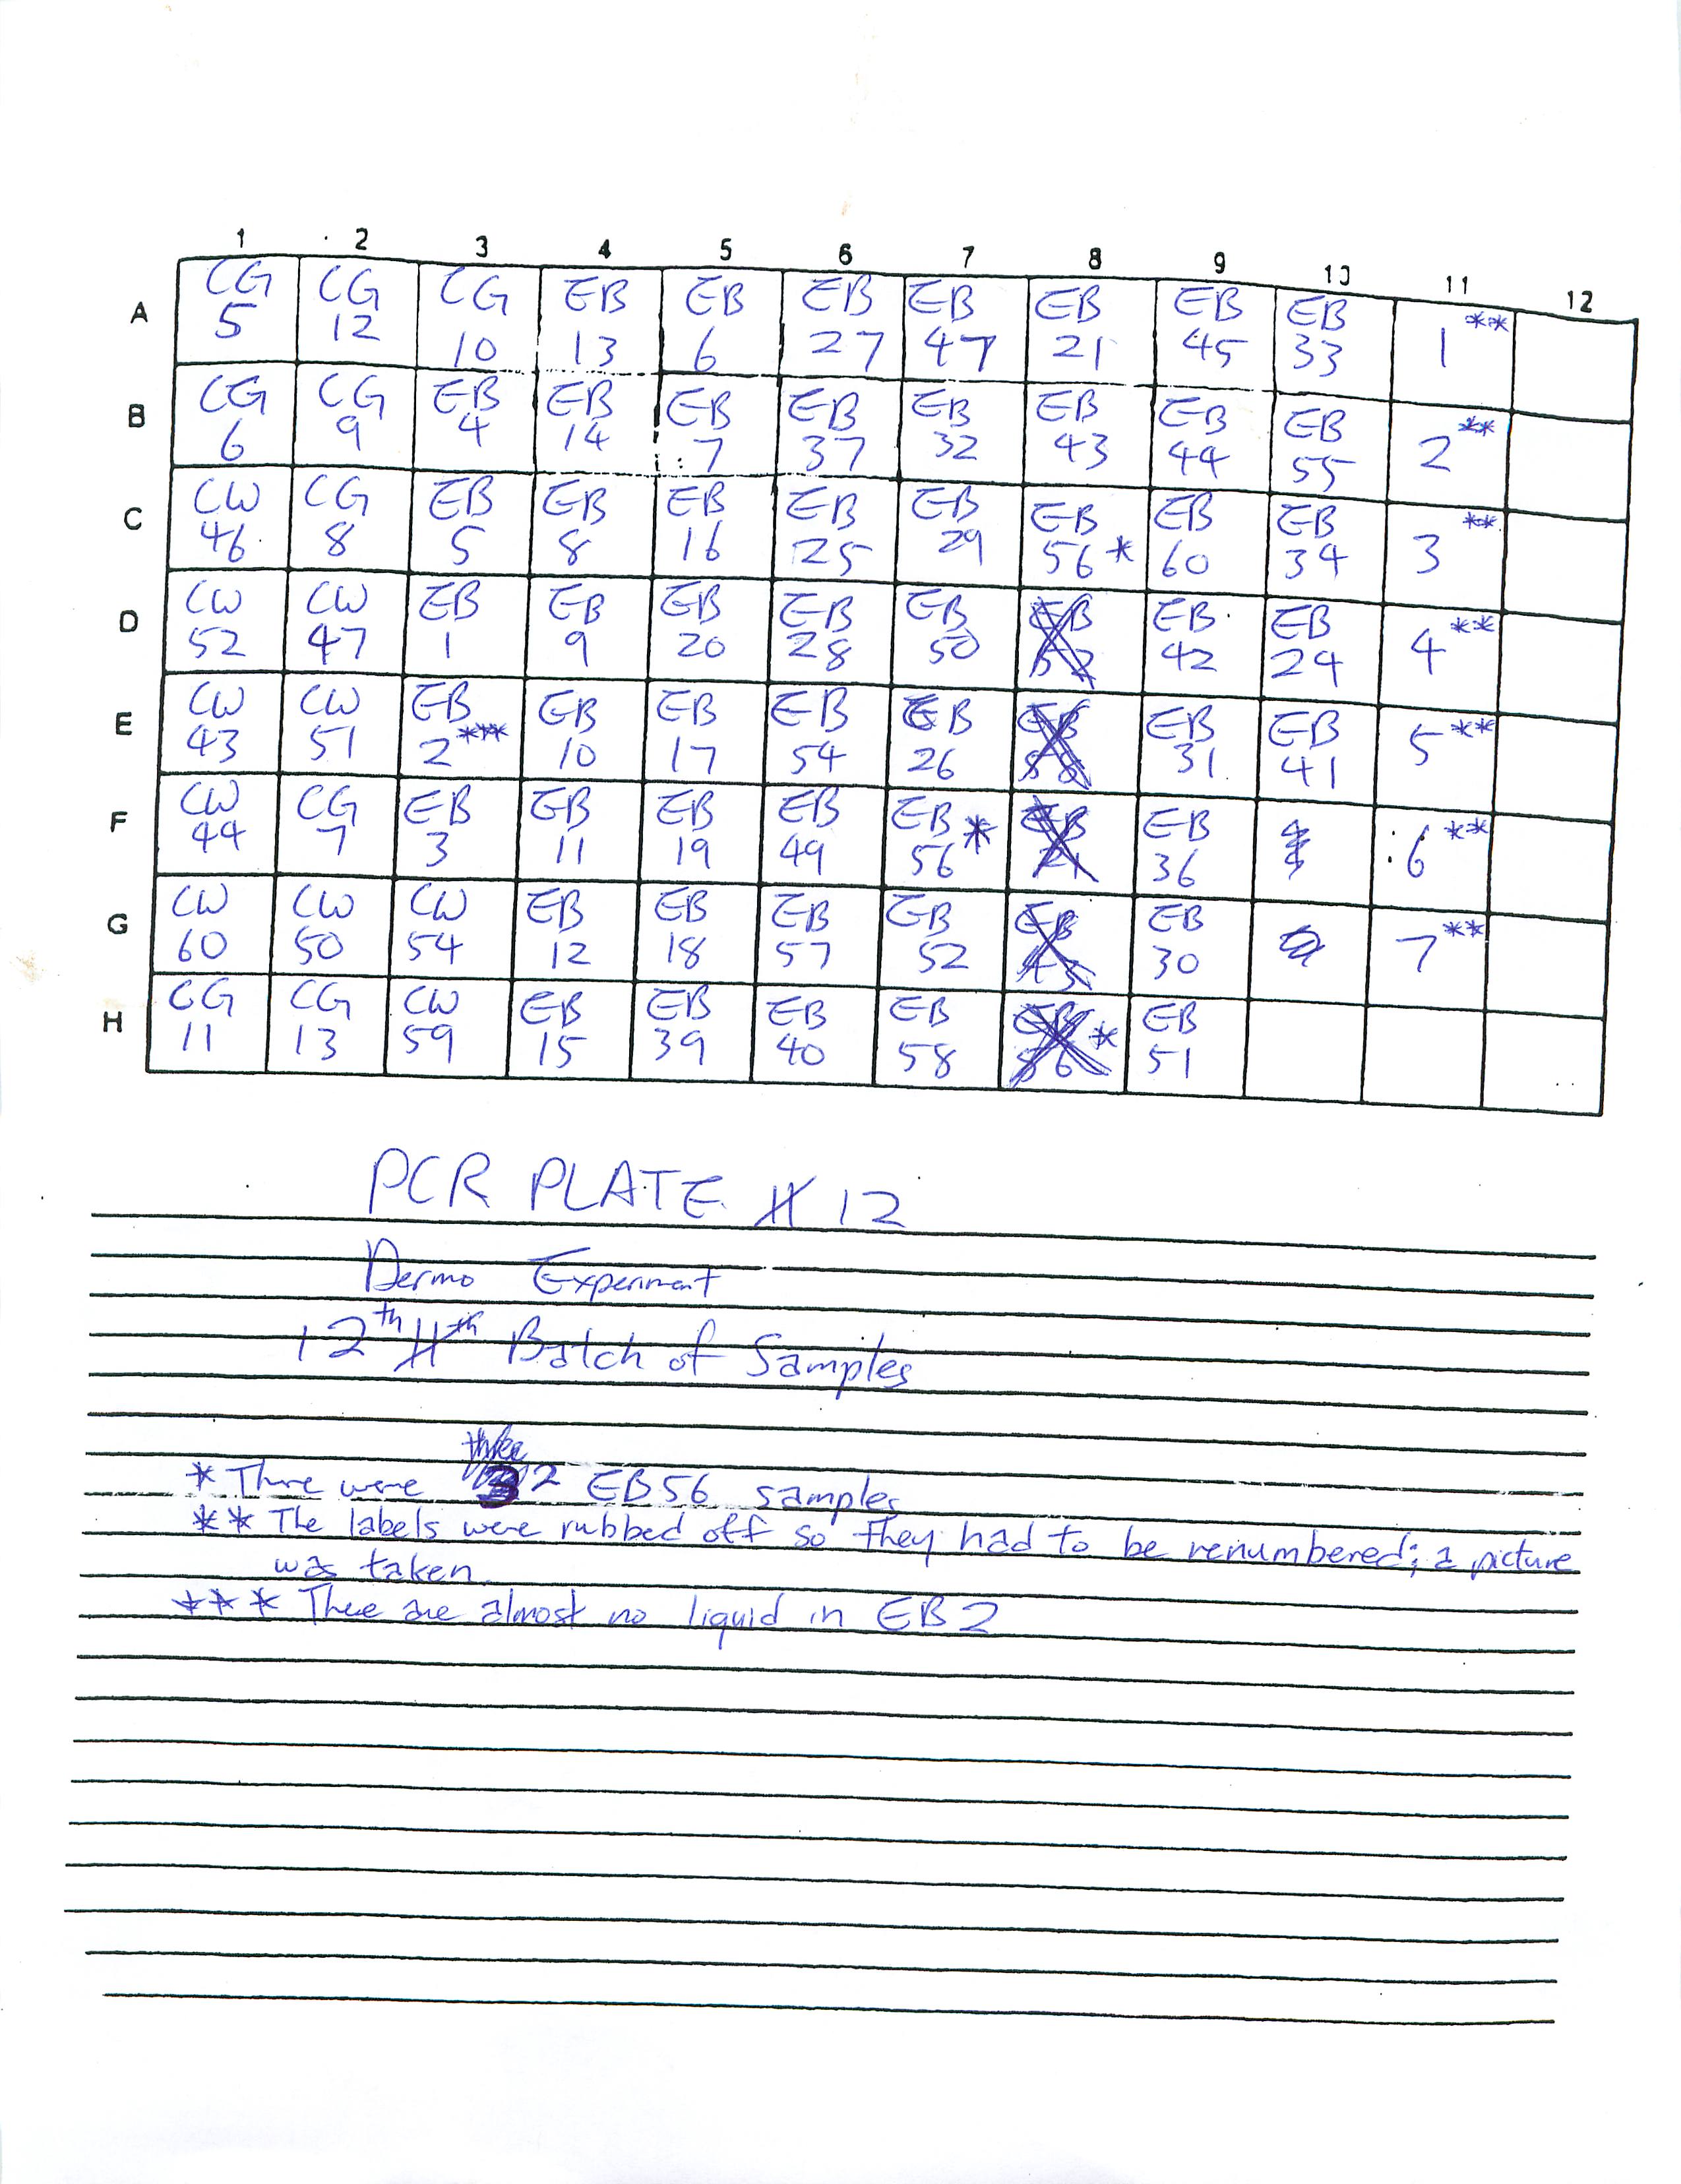
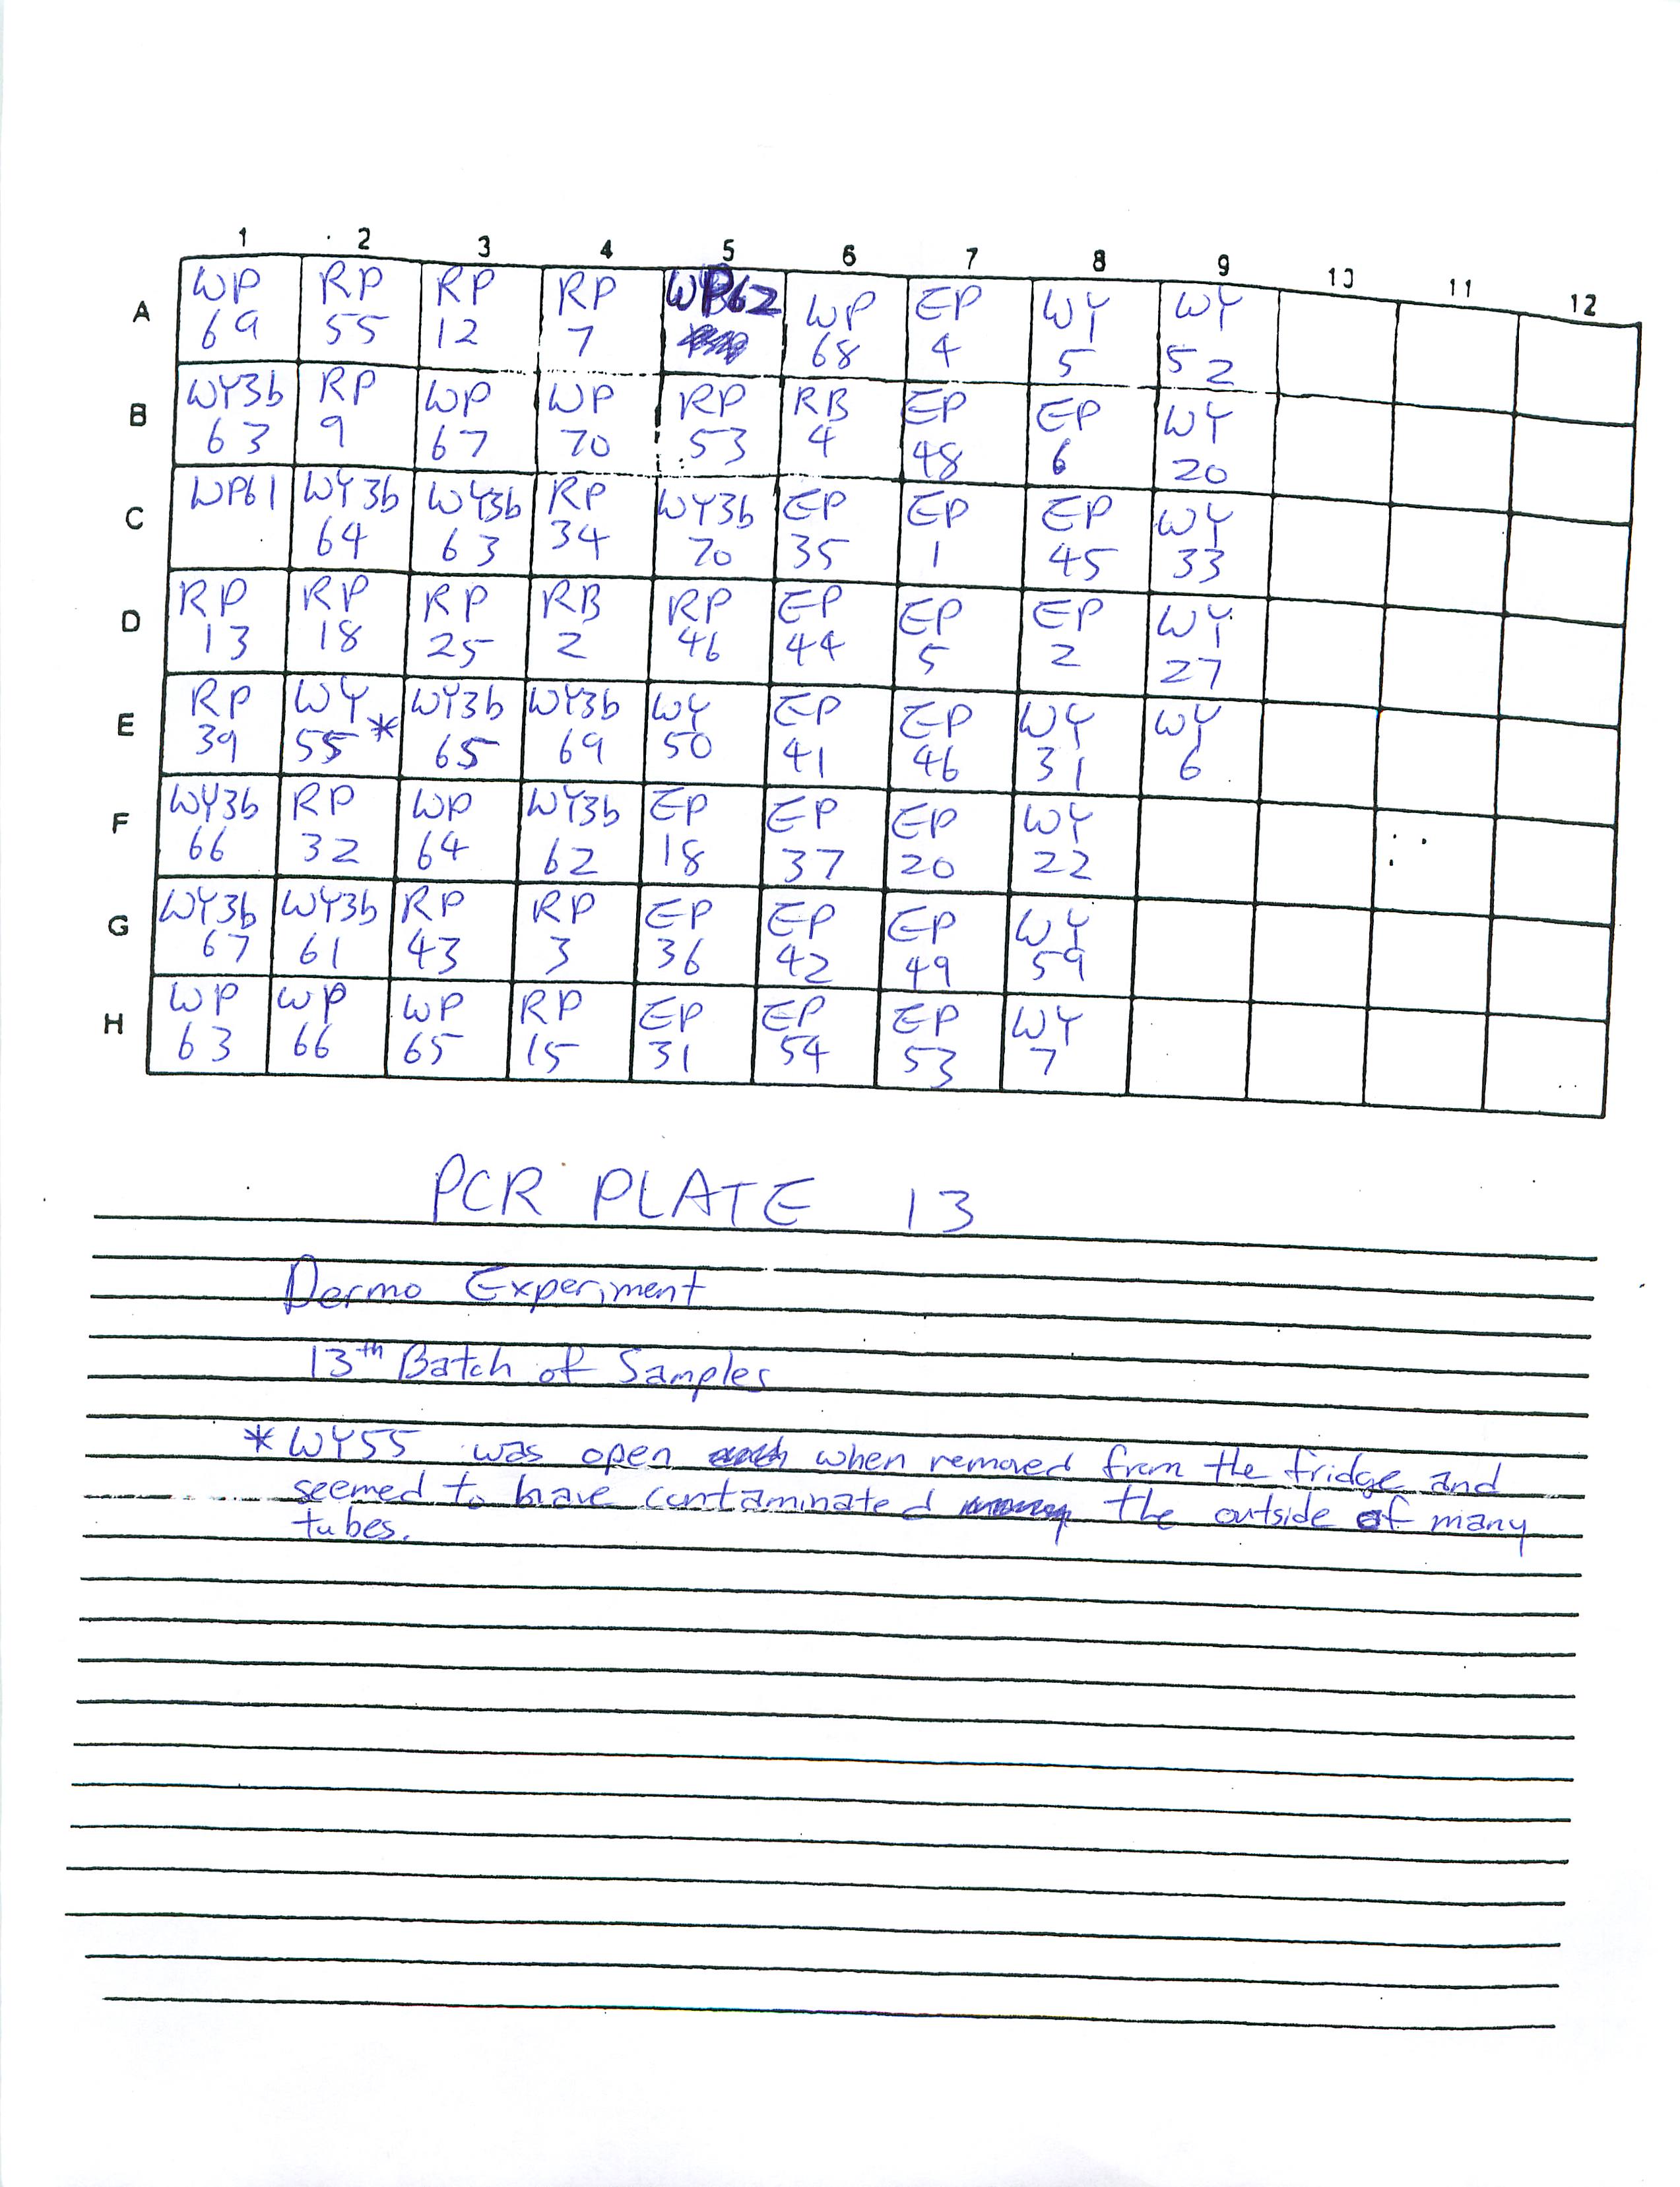
1-22-09
Finished preparing PCR Plates 9 and 10.
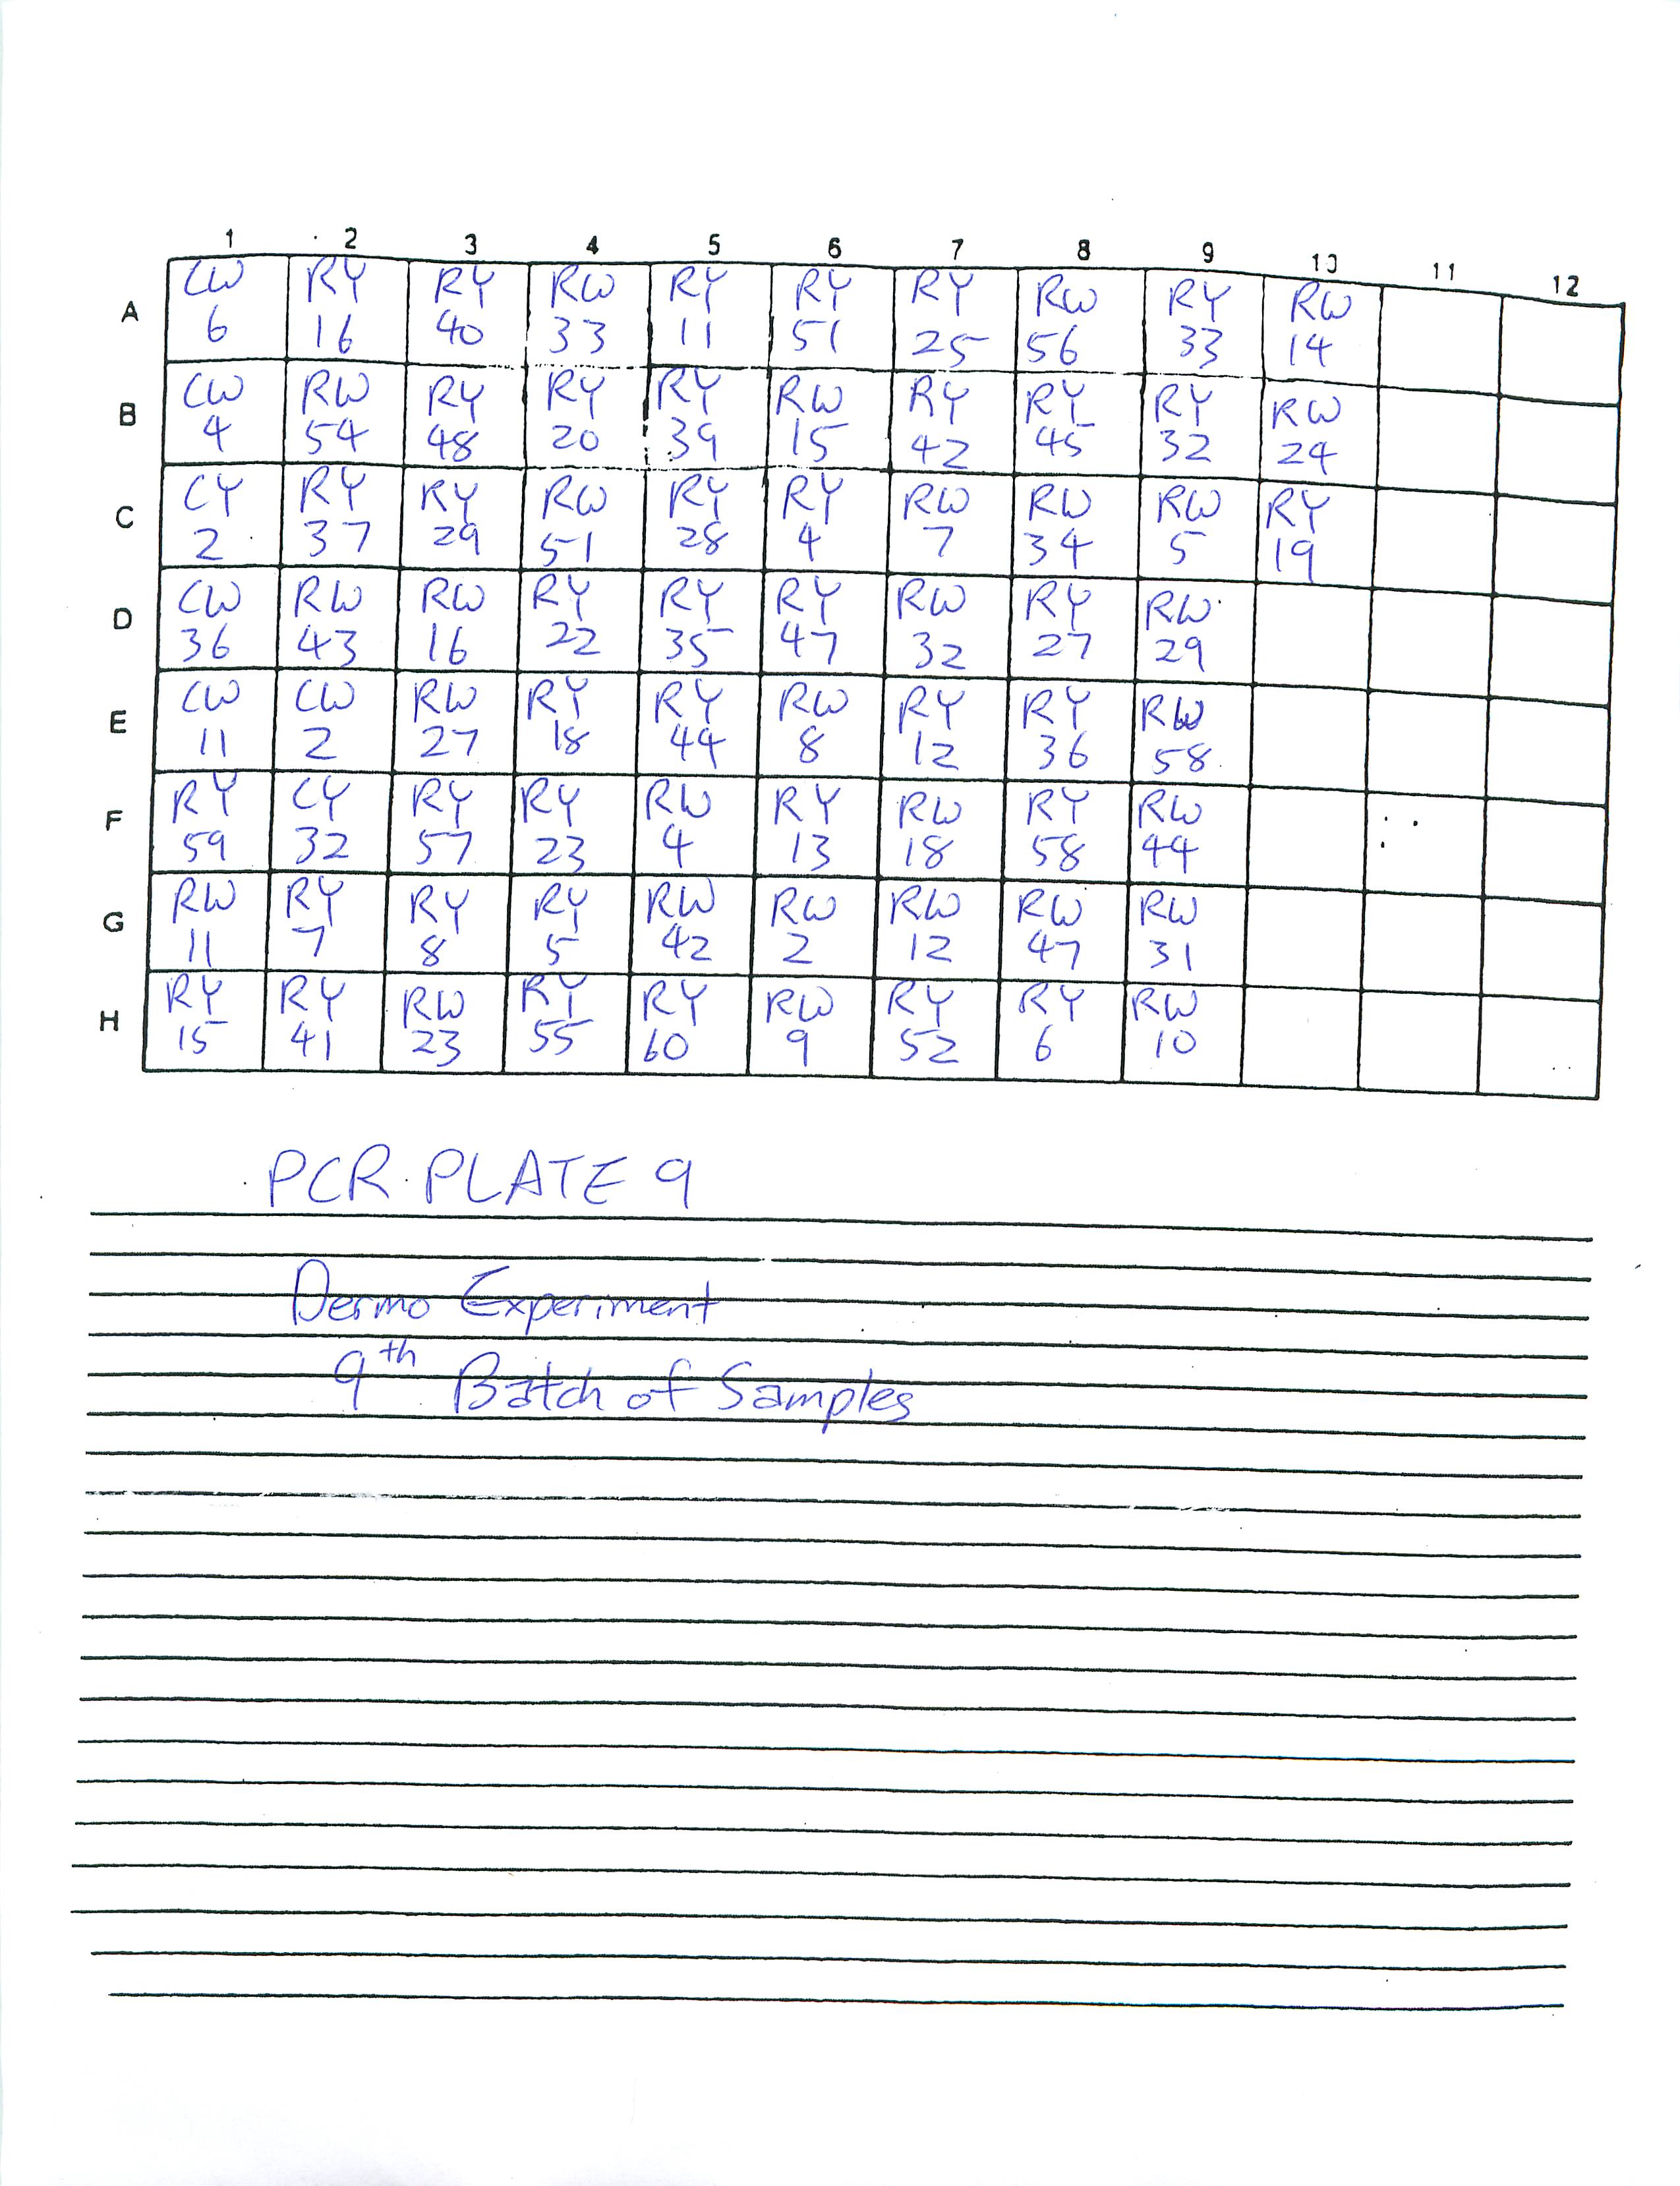
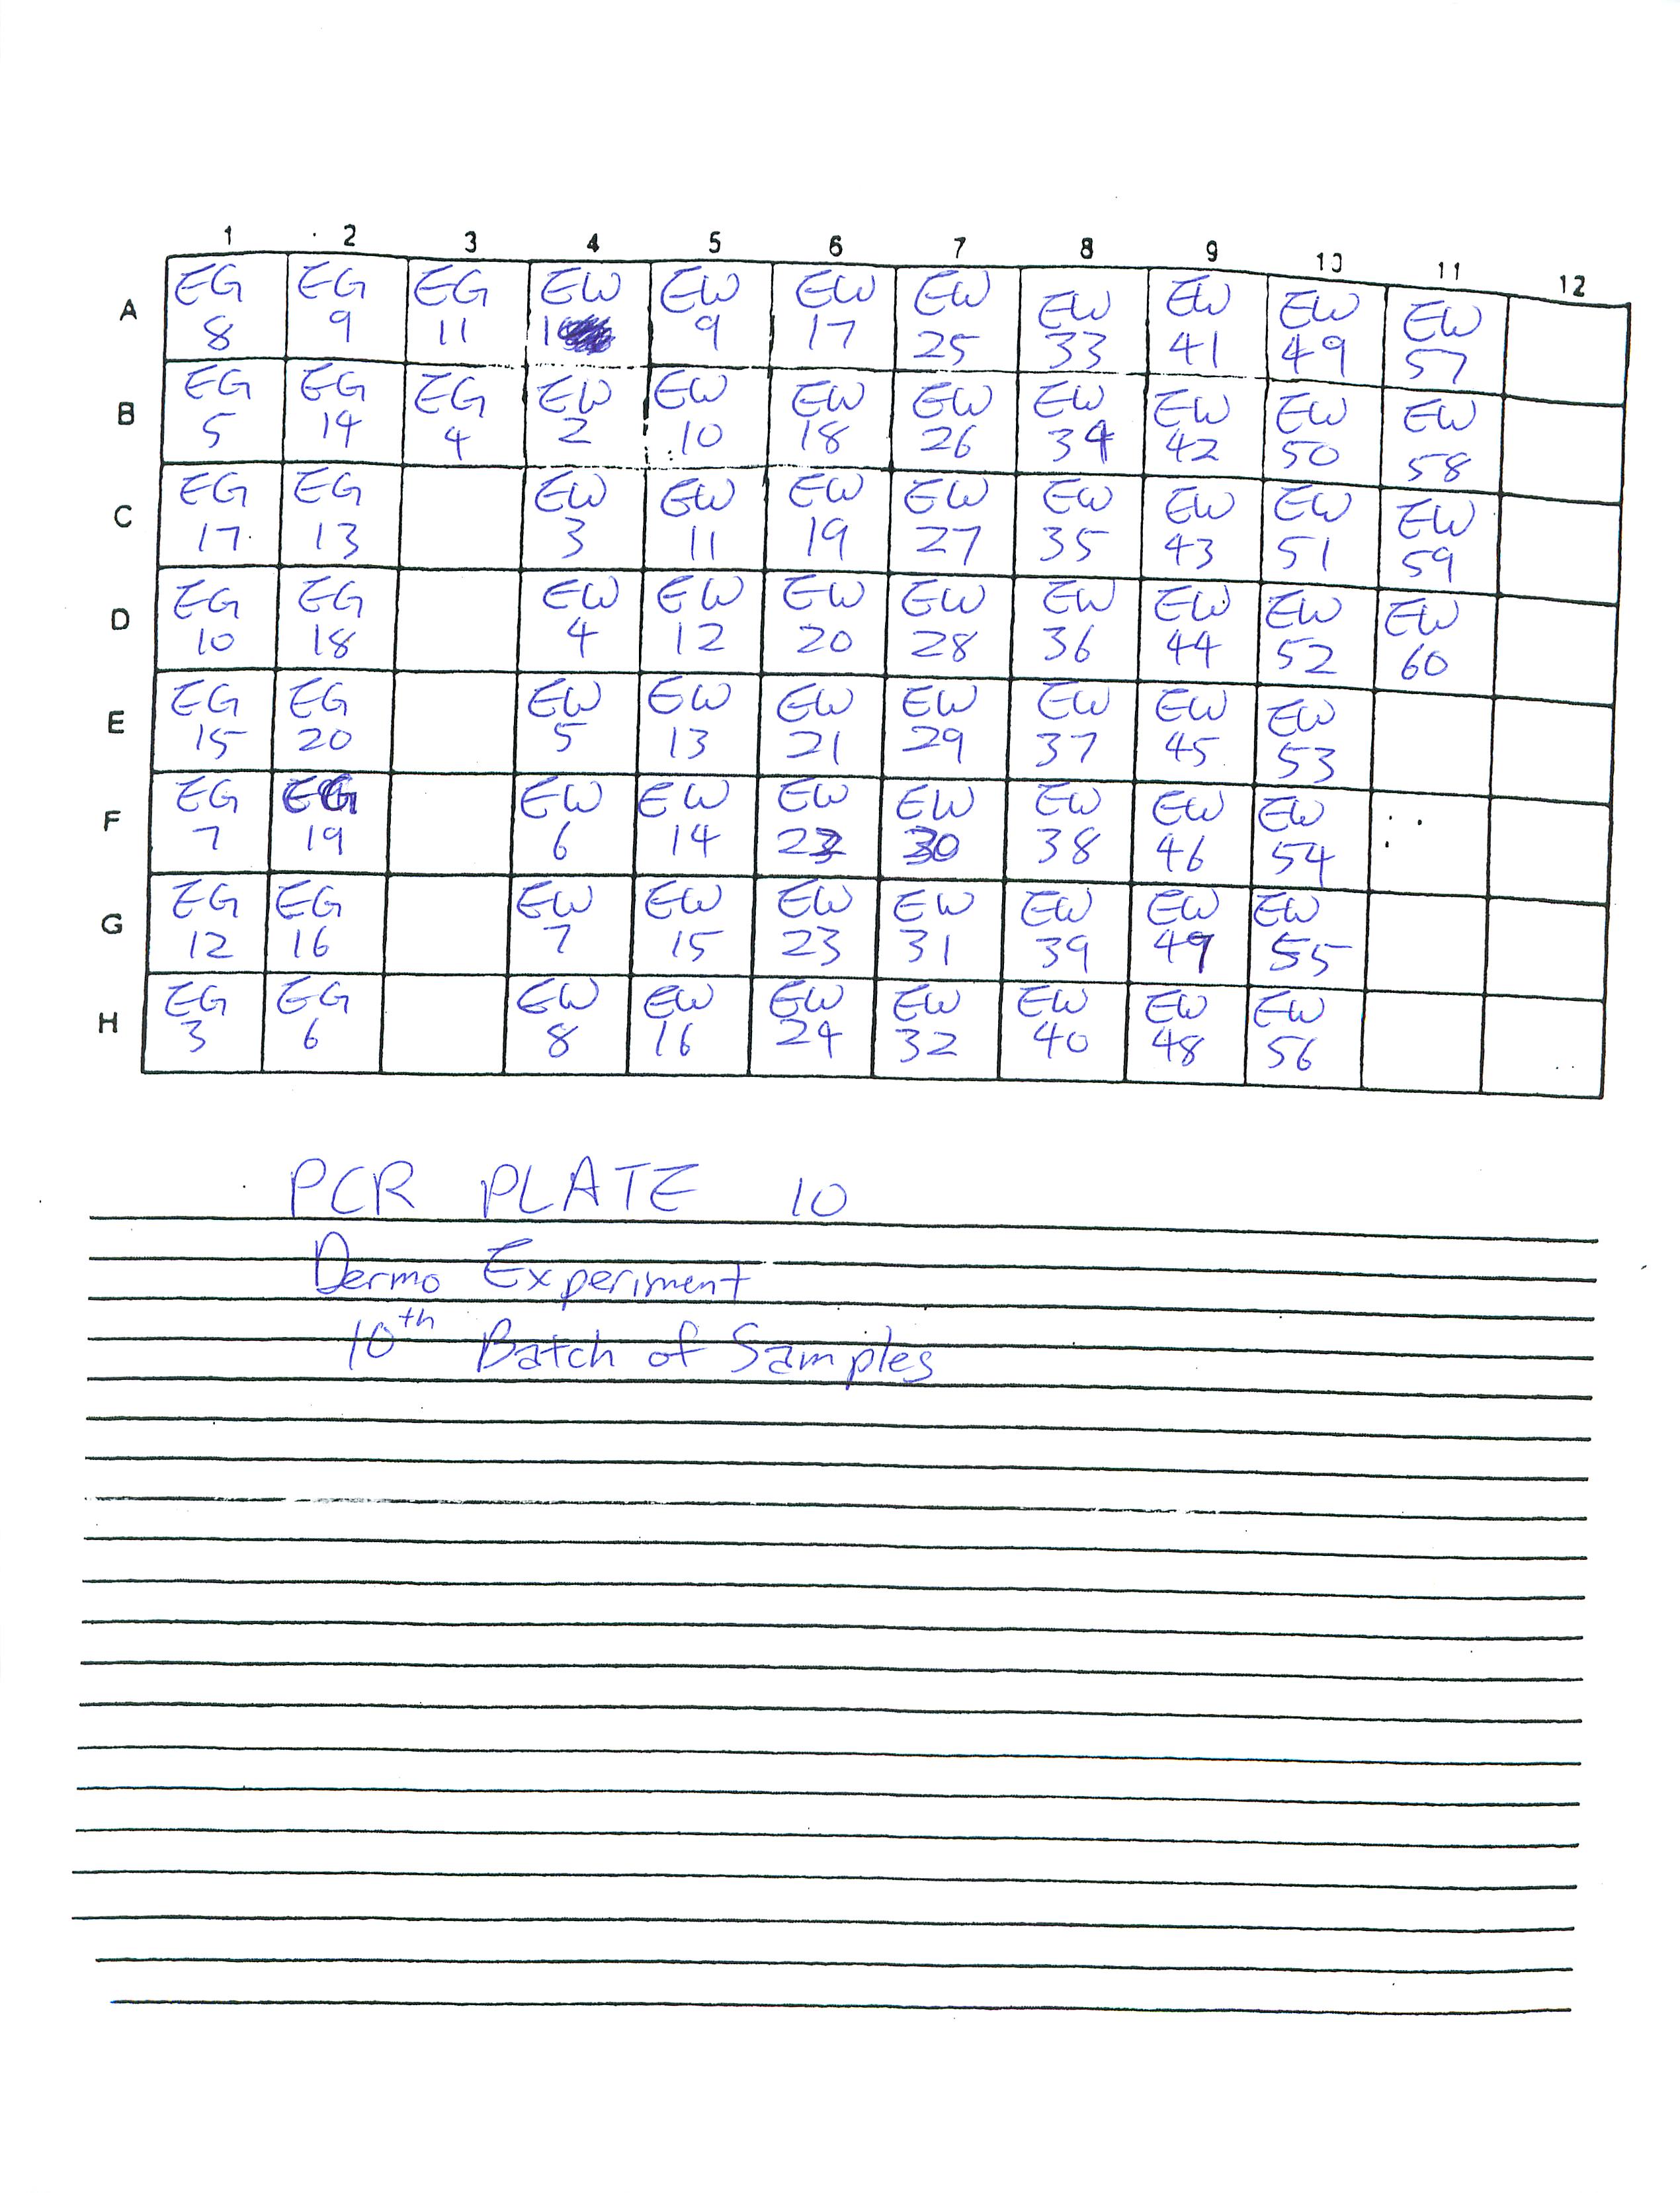
1-21-09
Finished preparing PCR Plates 7 and 8. Am hoping to finish preparing all of the PCR Plates by this week.
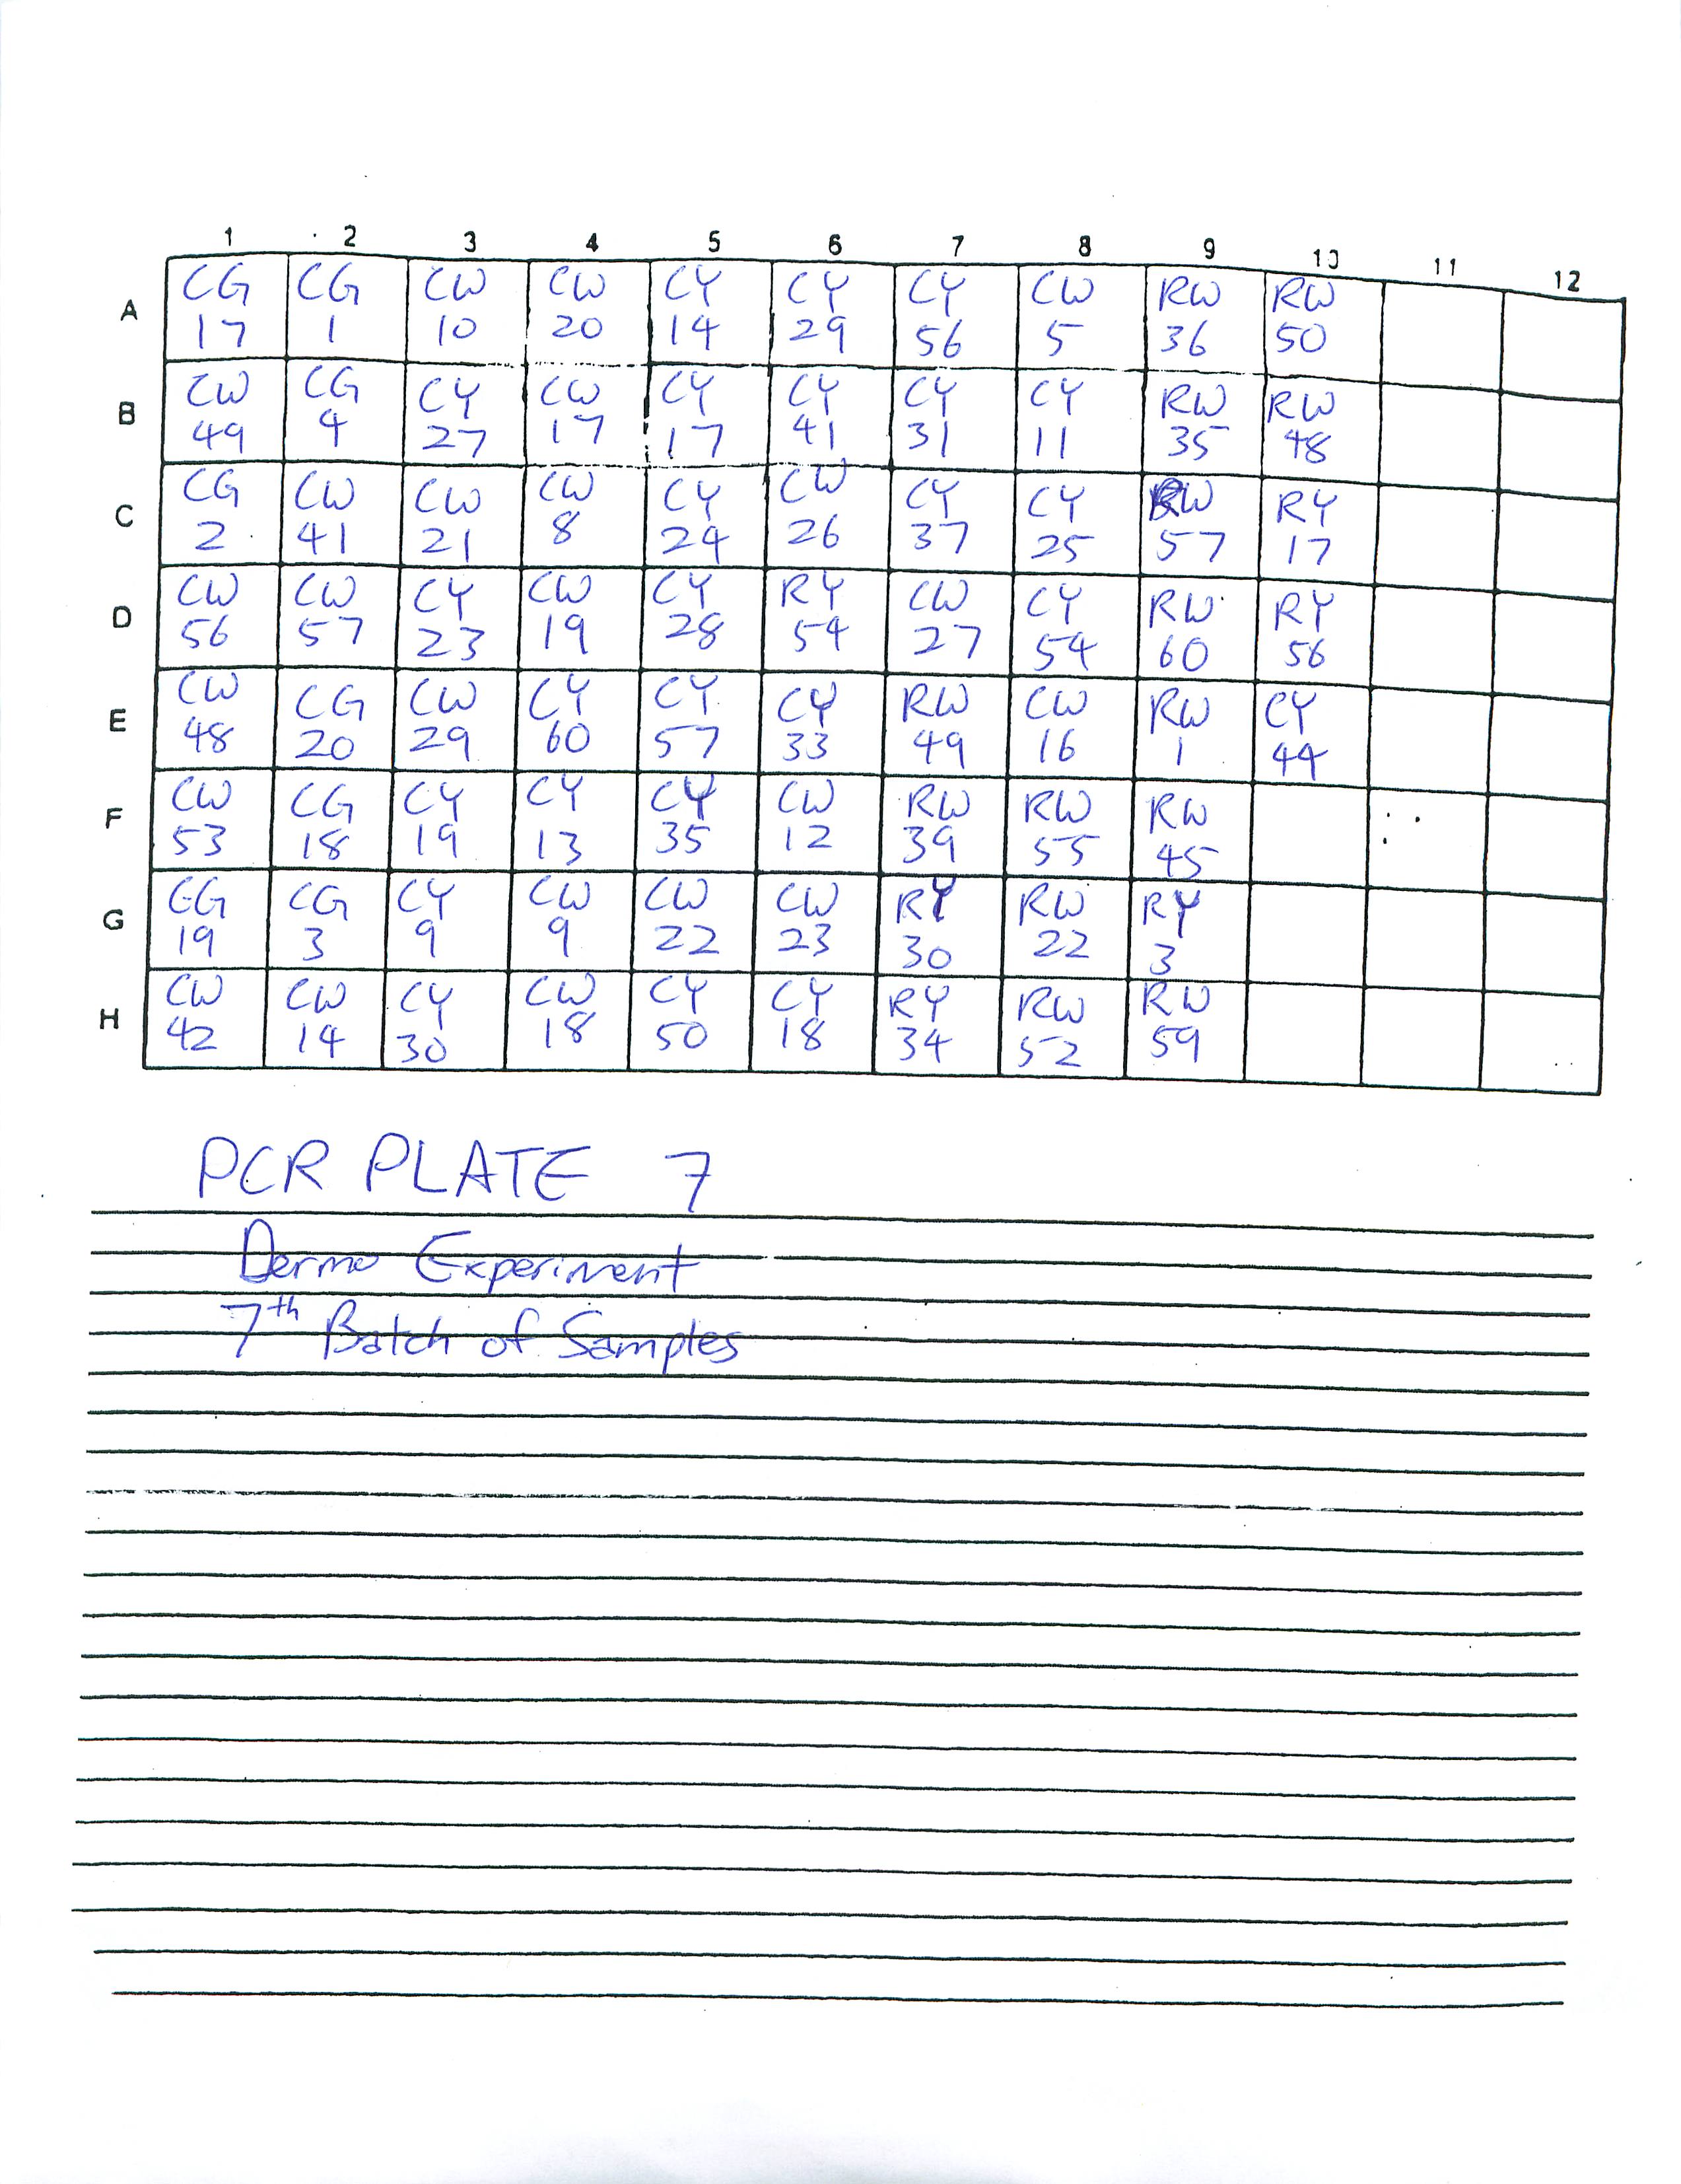
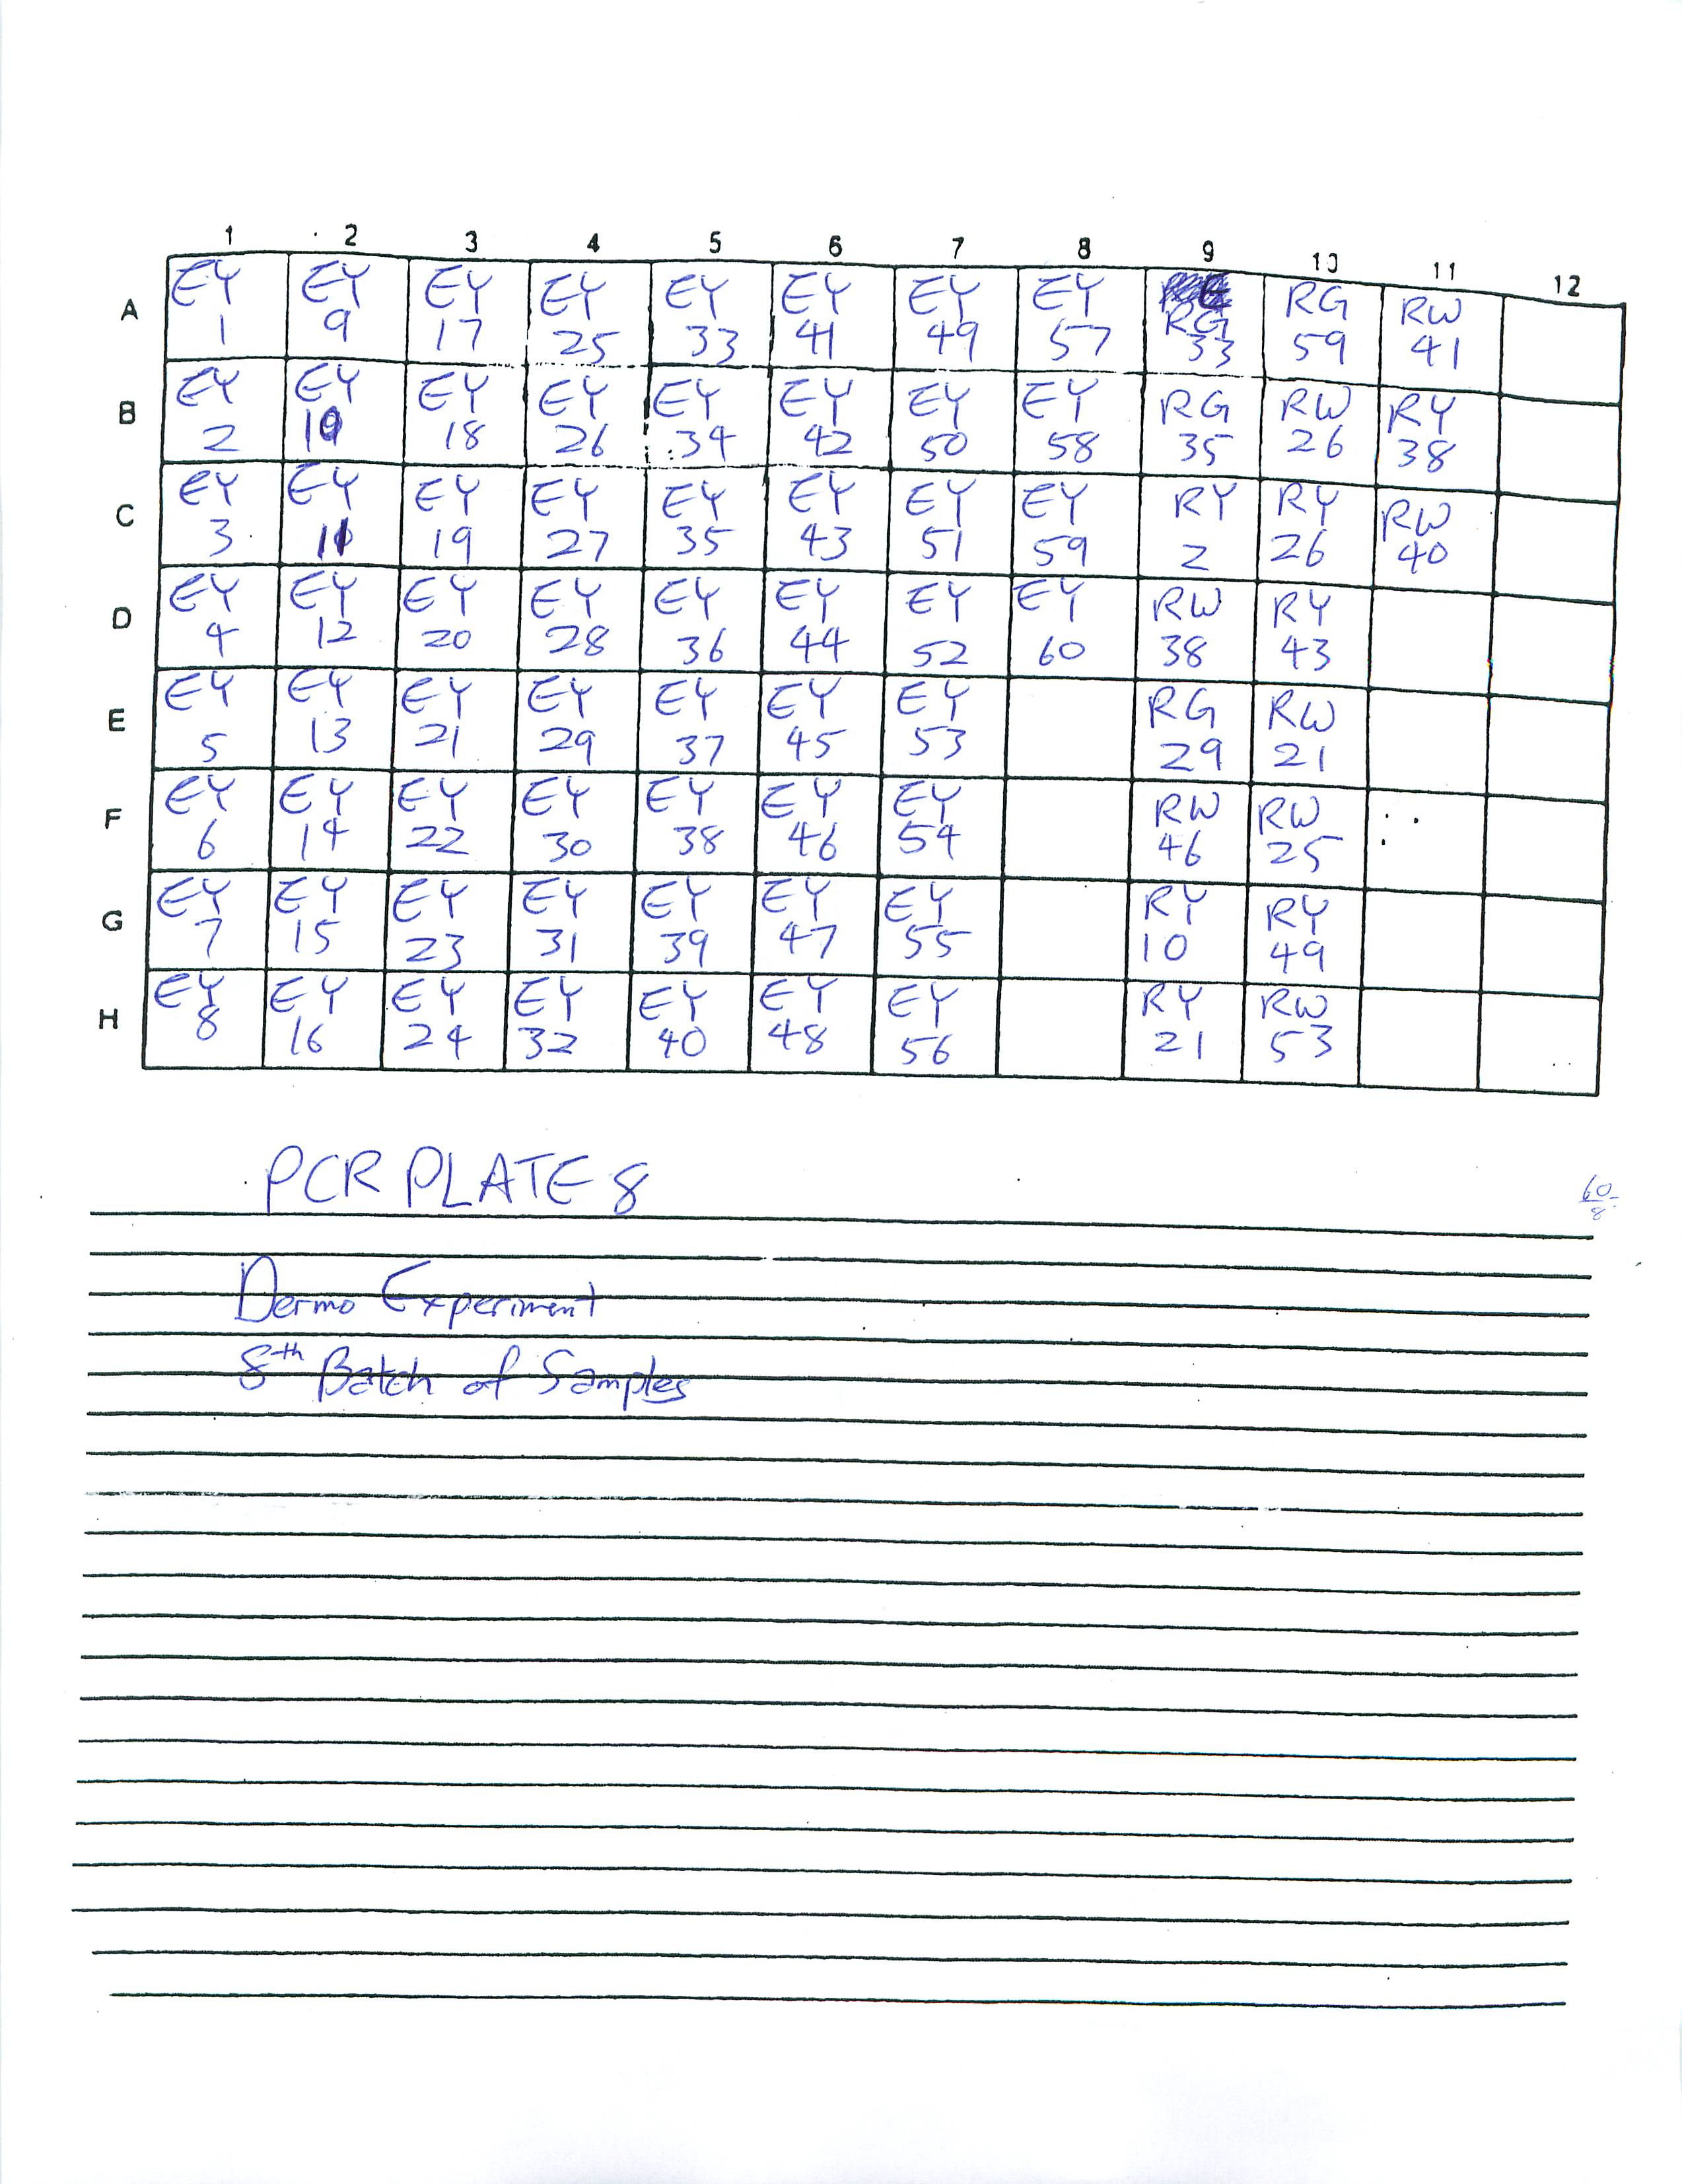
1-16-09
Finished preparing PCR Plates 3-6. Determined to finish preparing the rest of PCR Plates by the next two lab periods.
A few of the labels on the tubes were rubbed off and had to be re-labled:
1-15-09
Finished preparing PCR Plate 2.
I found out I had to prepare 15 batches of PCR Plates!! HOLY SMOKES!
I organized four extra PCR sheets (total of six PCR sheets):
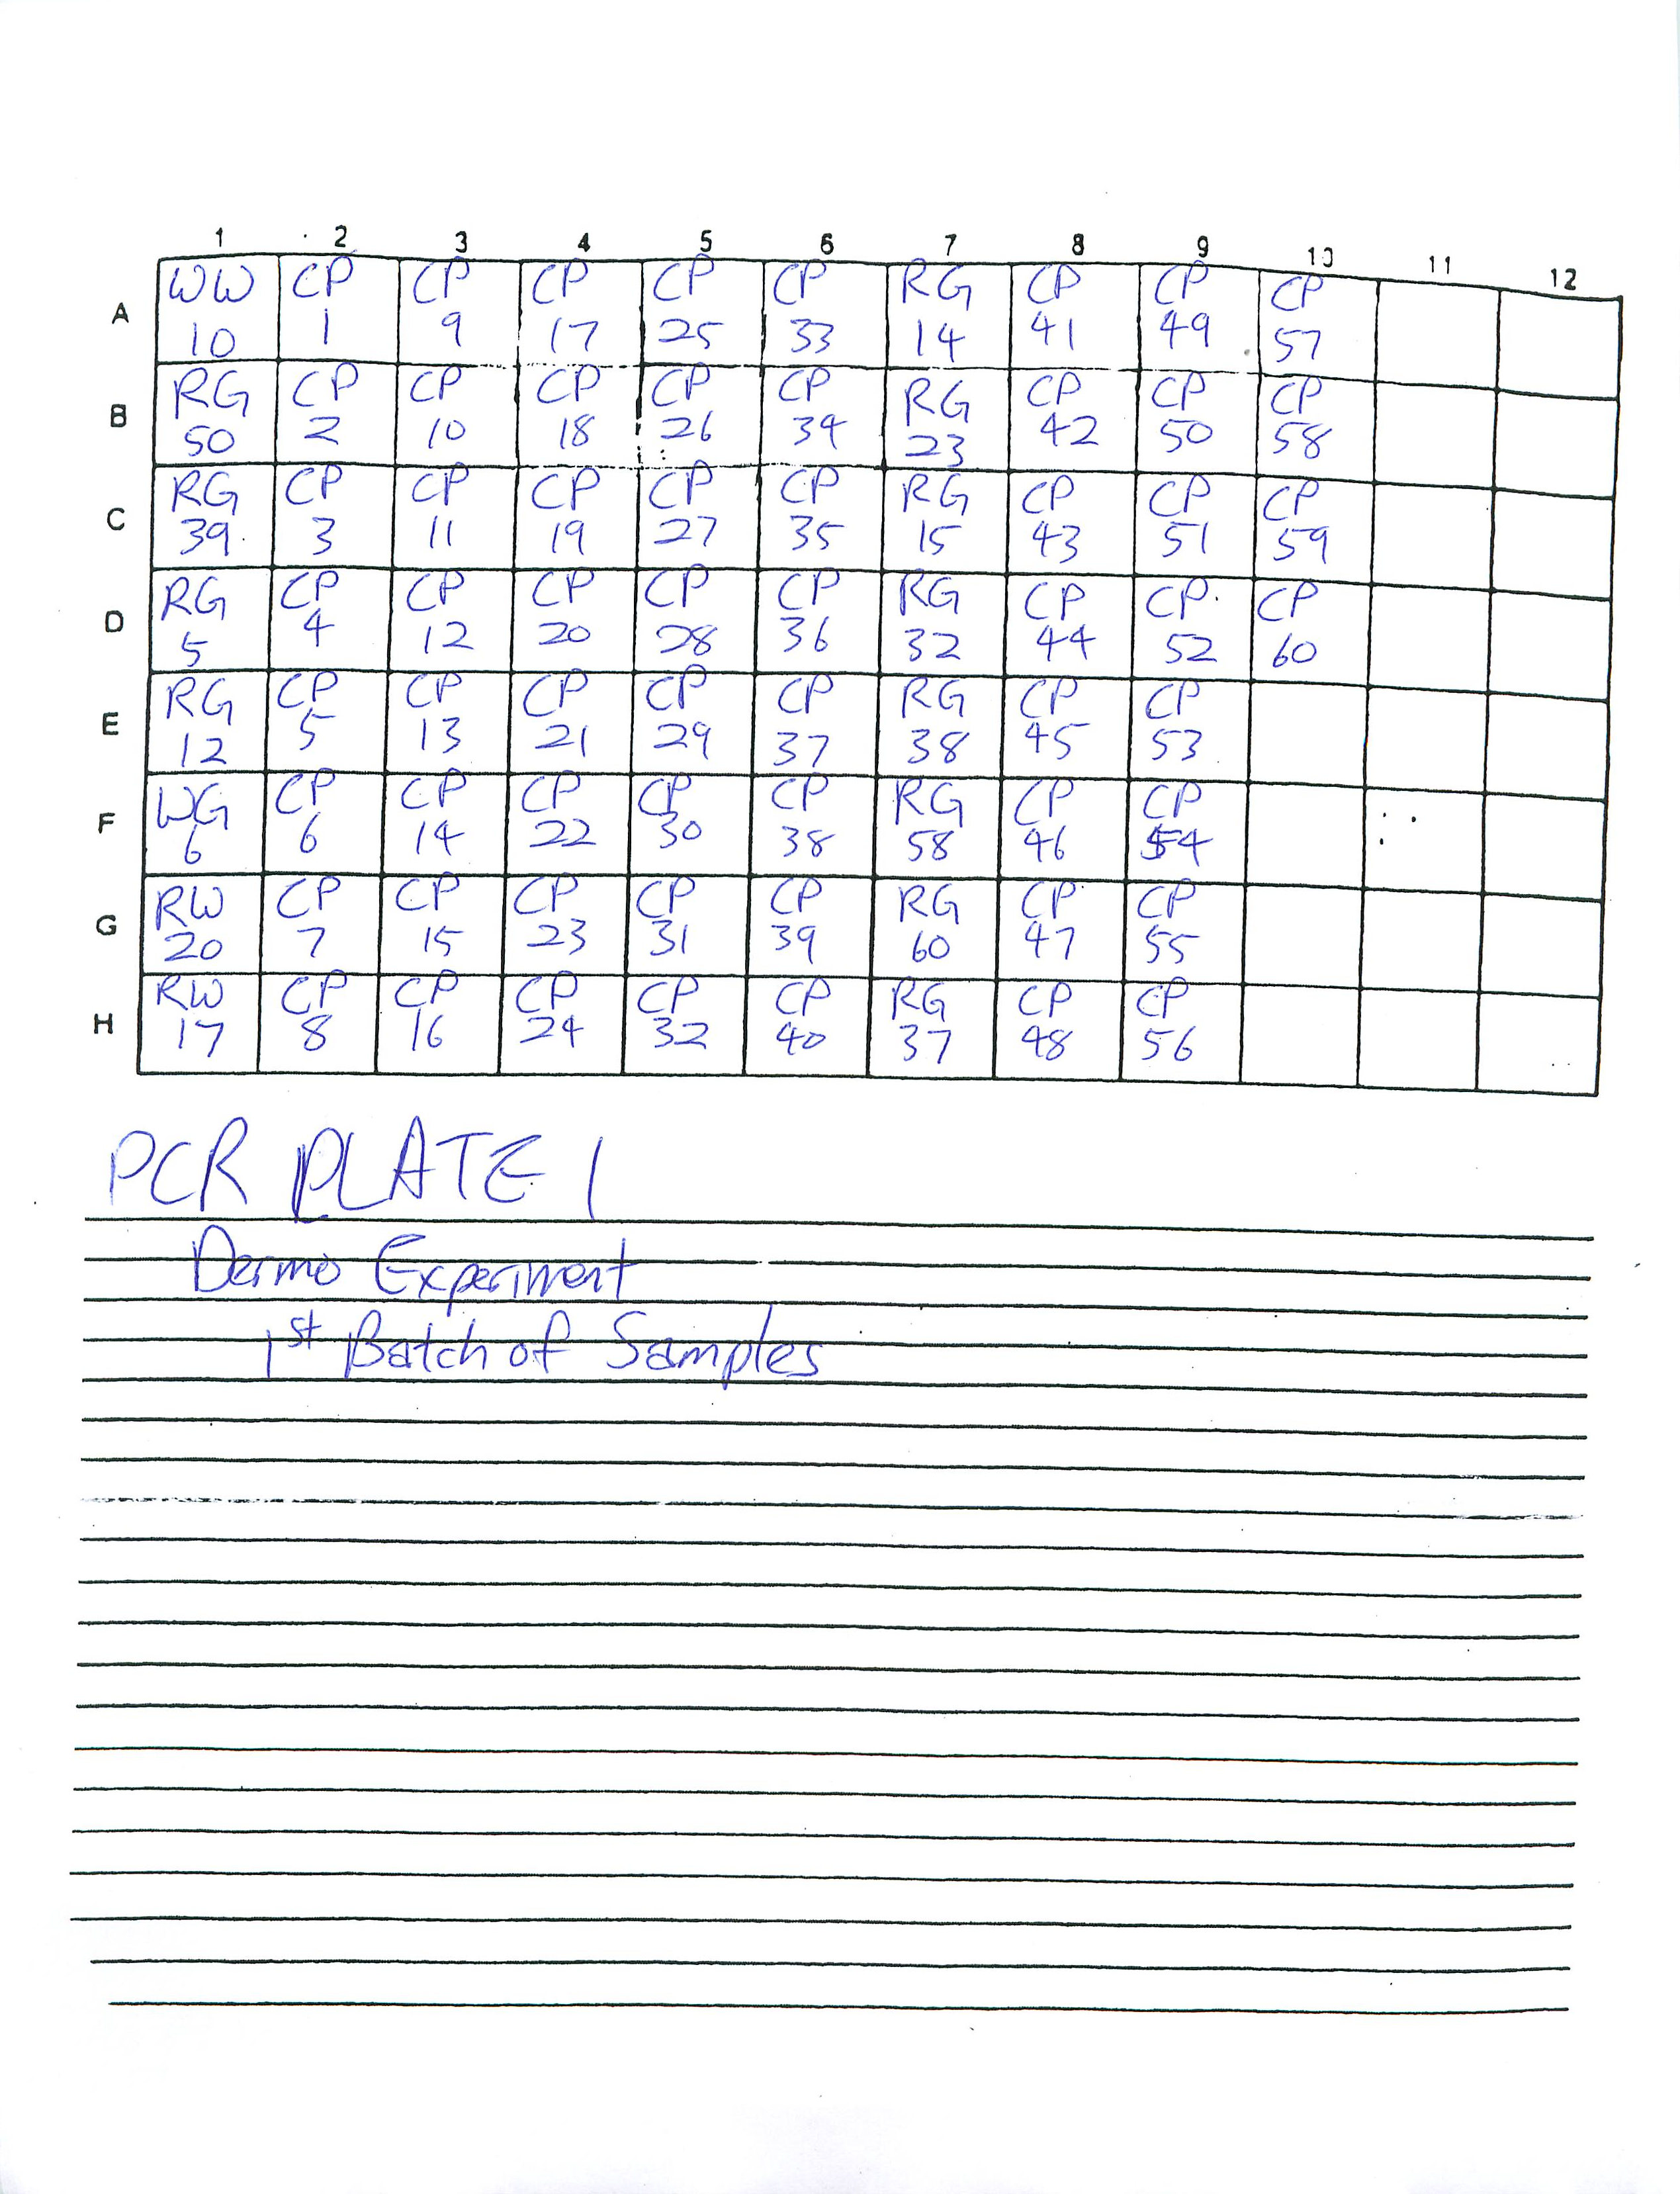
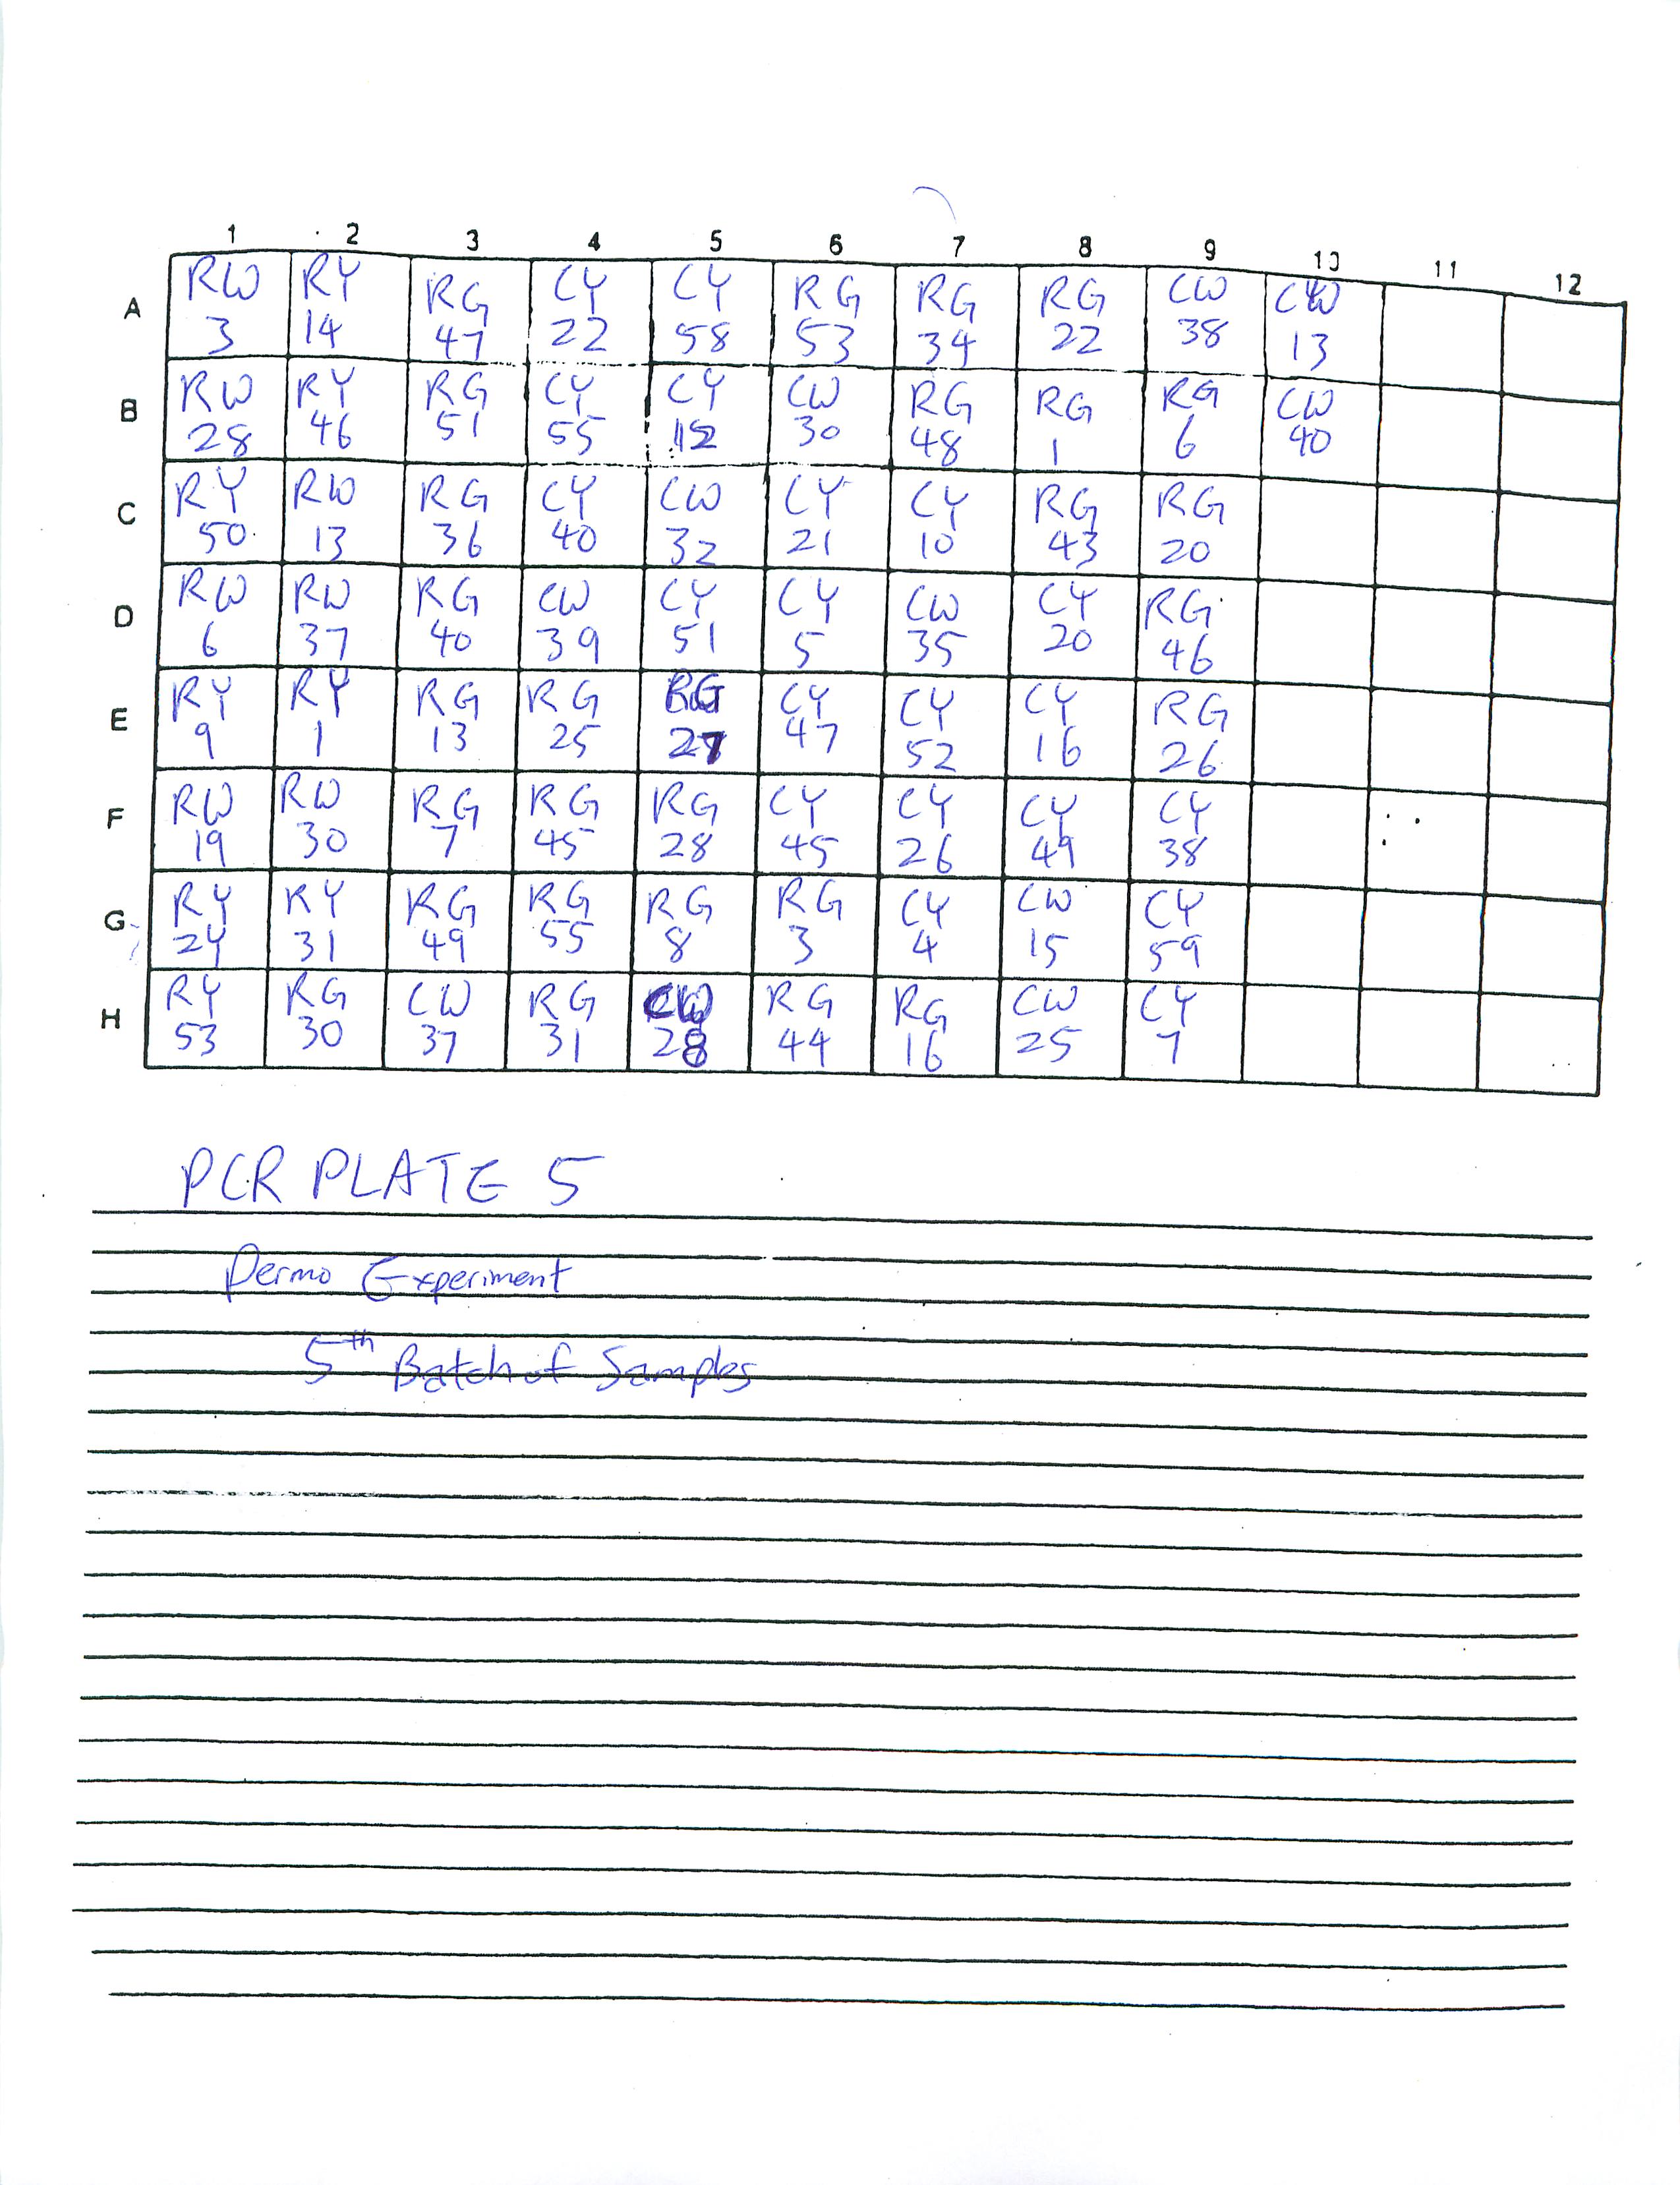
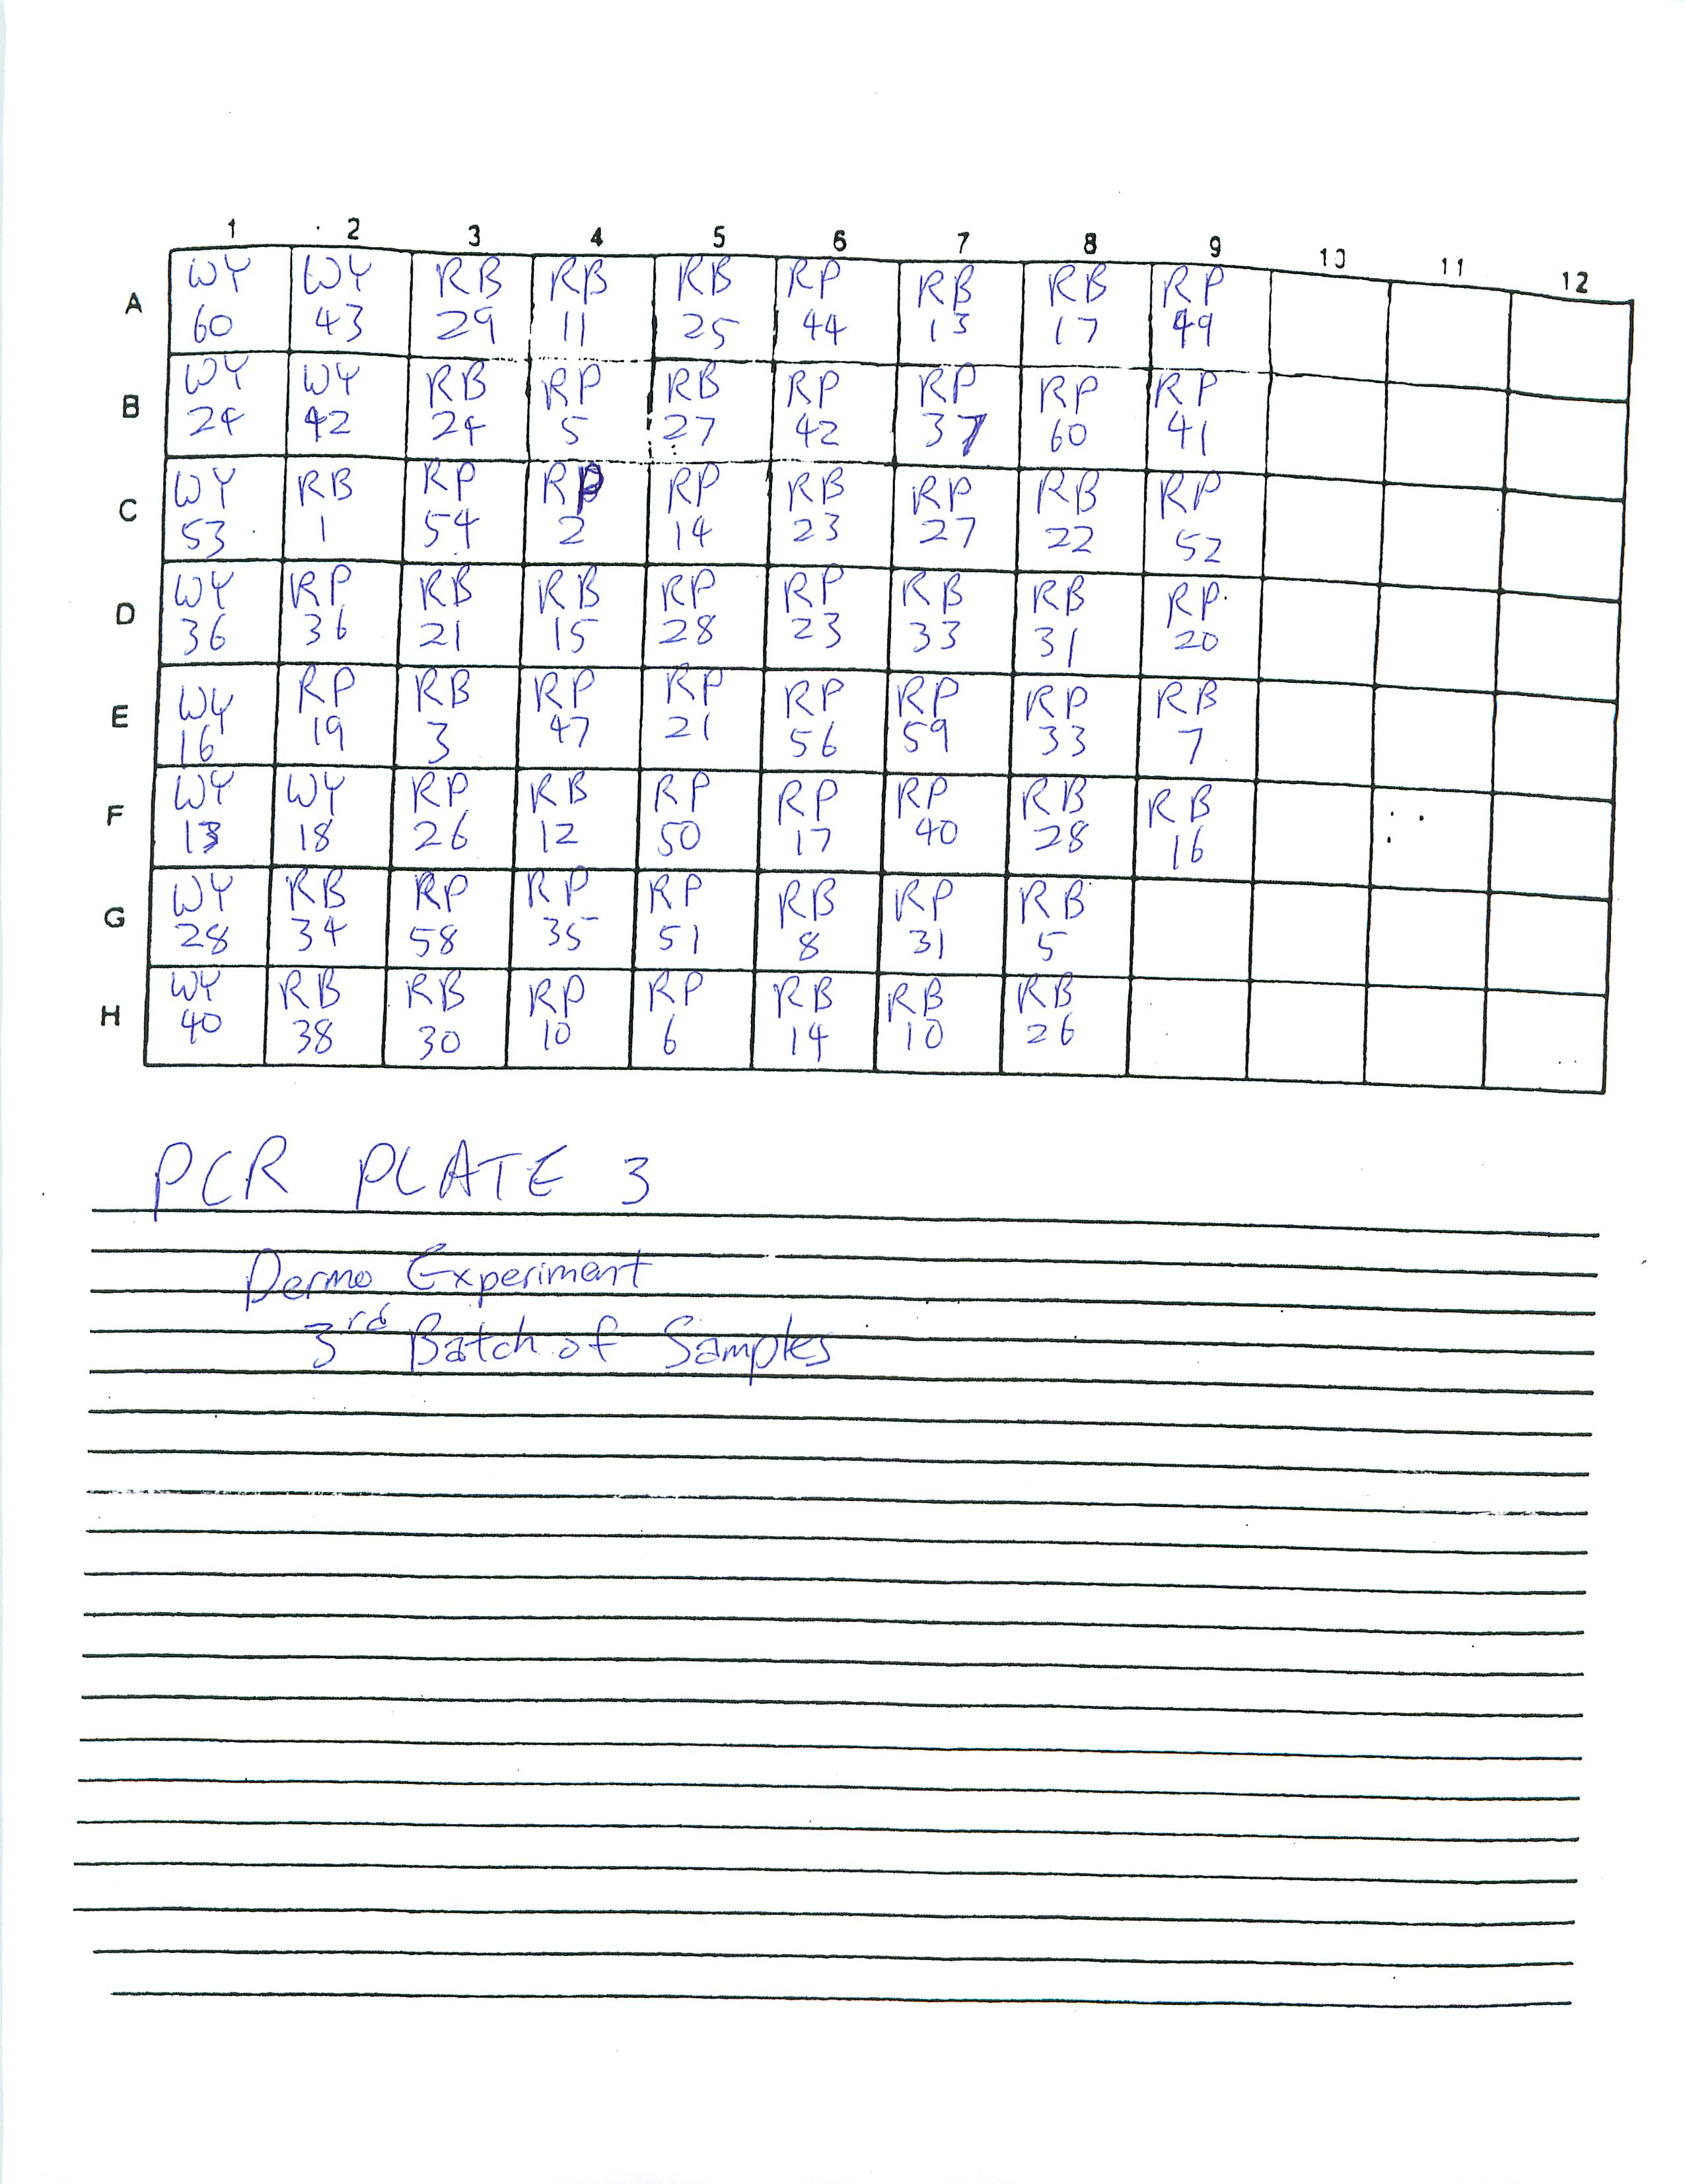
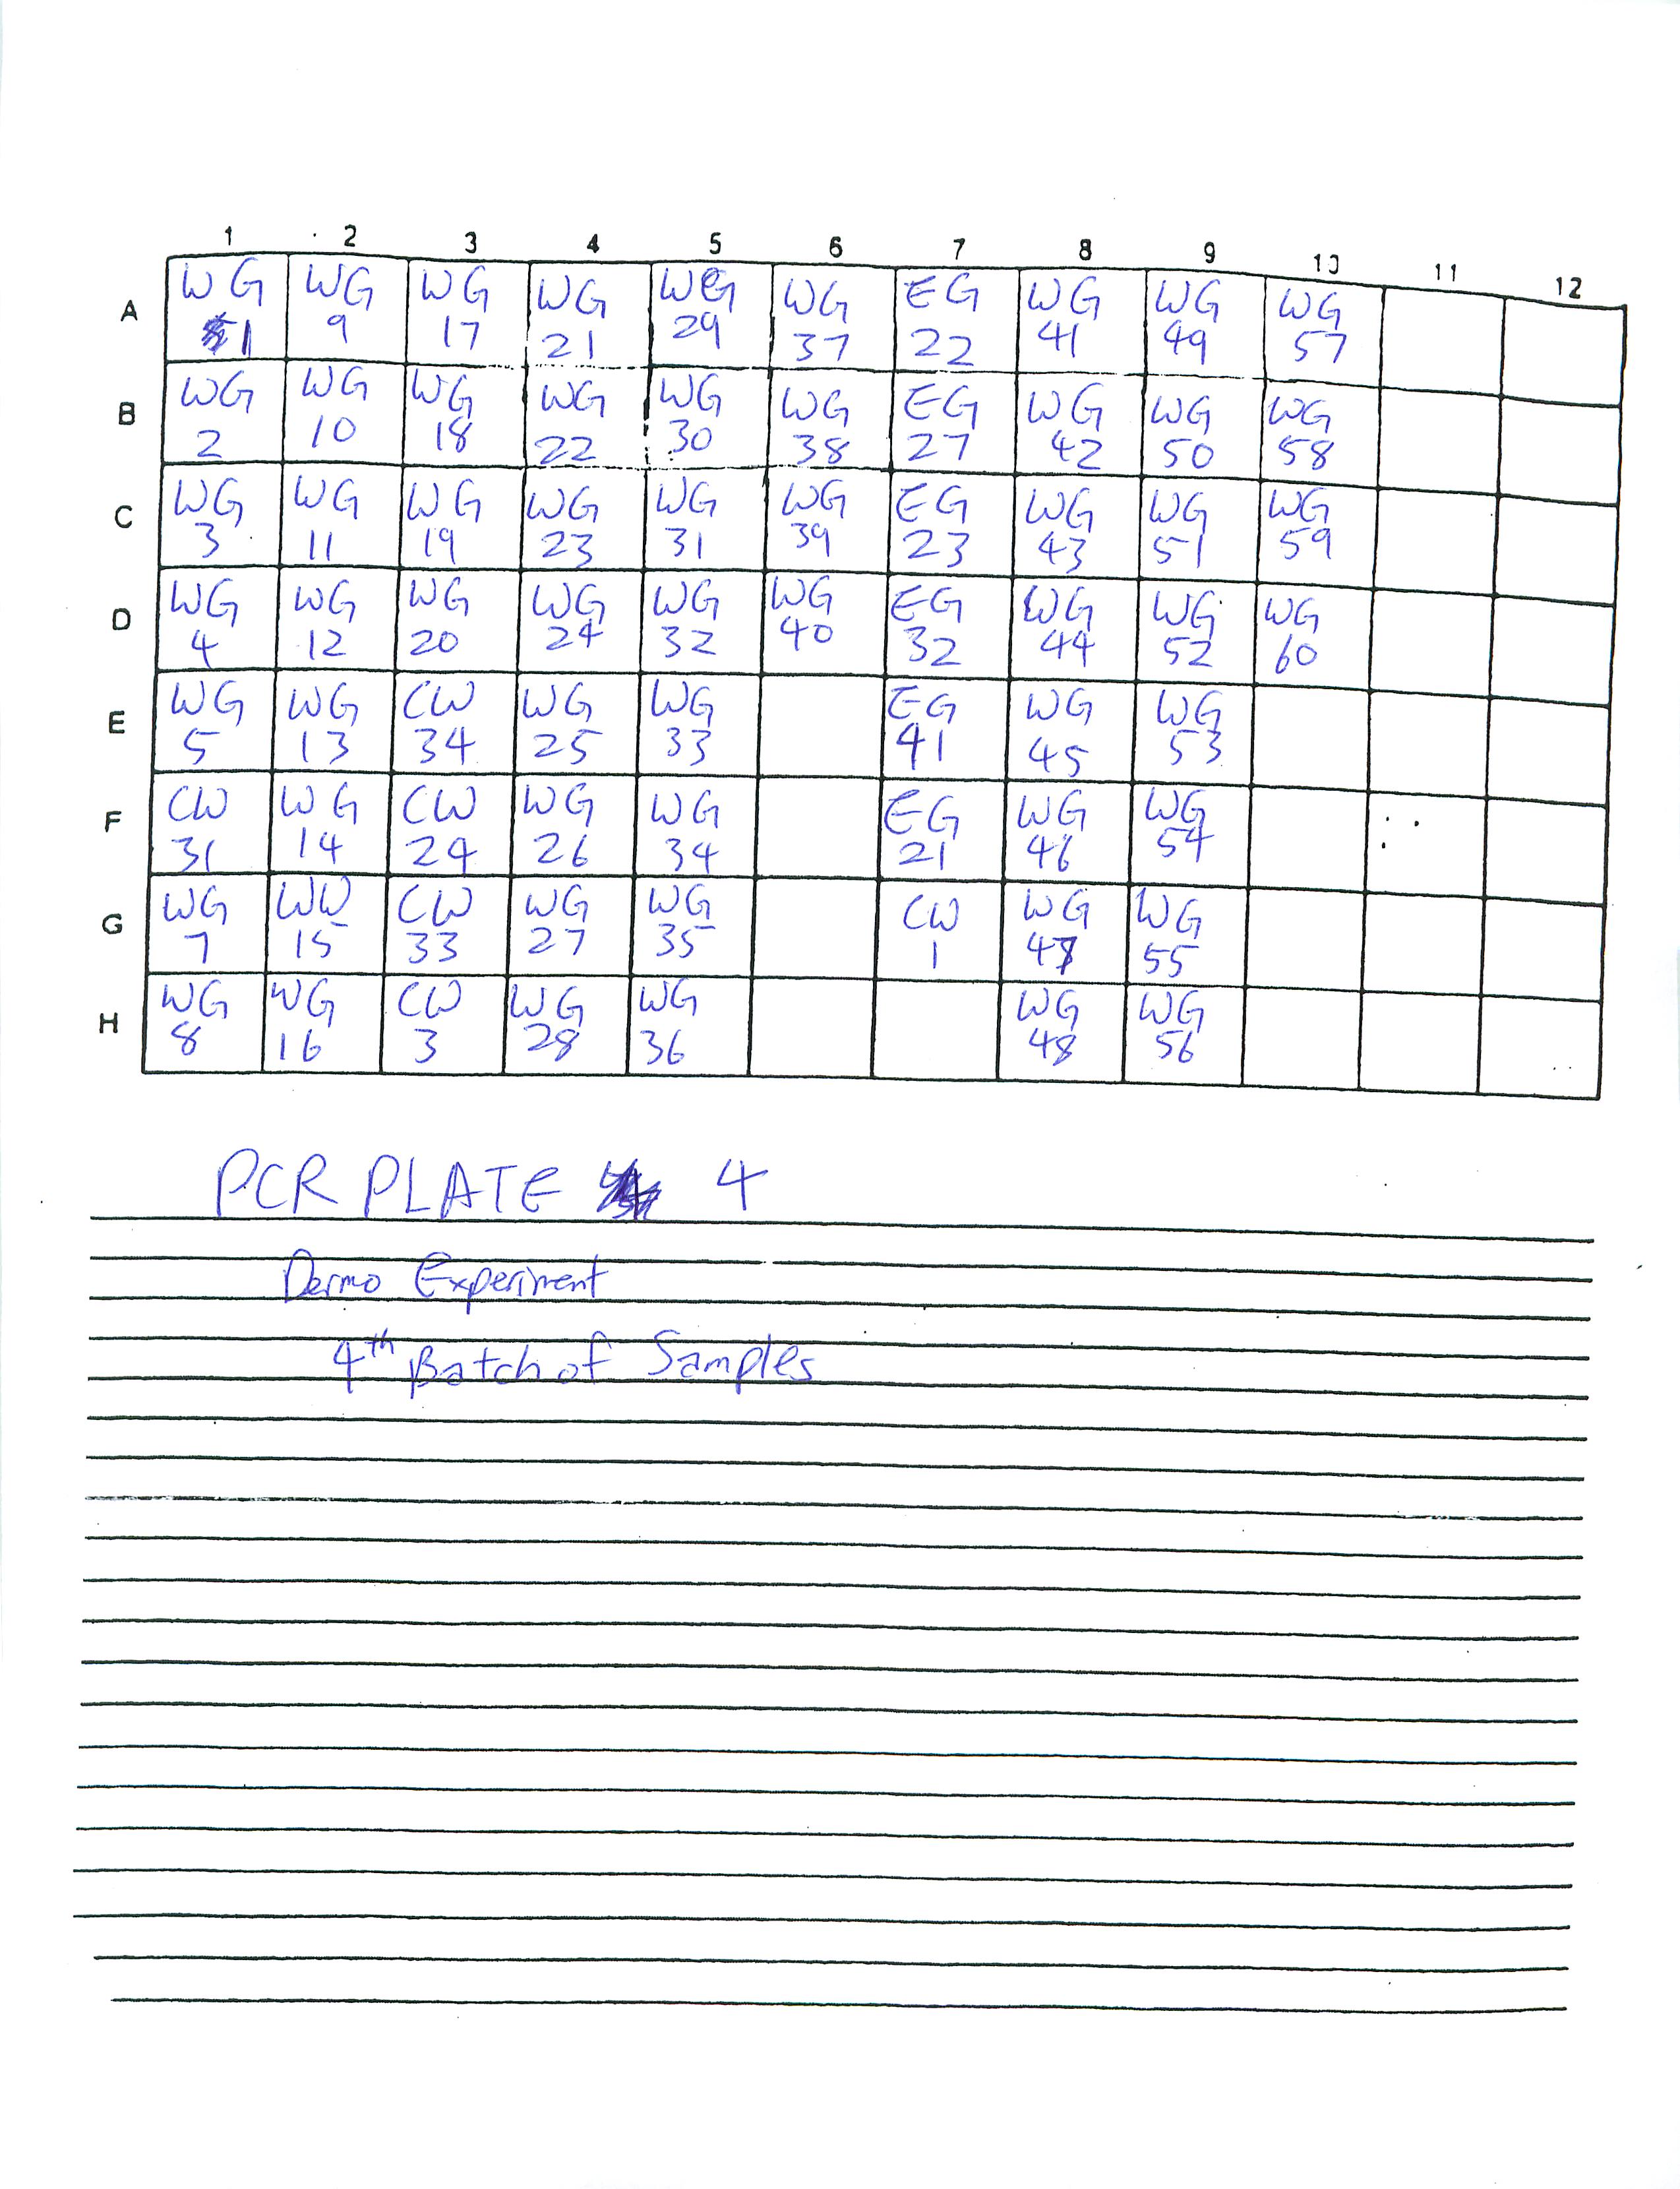
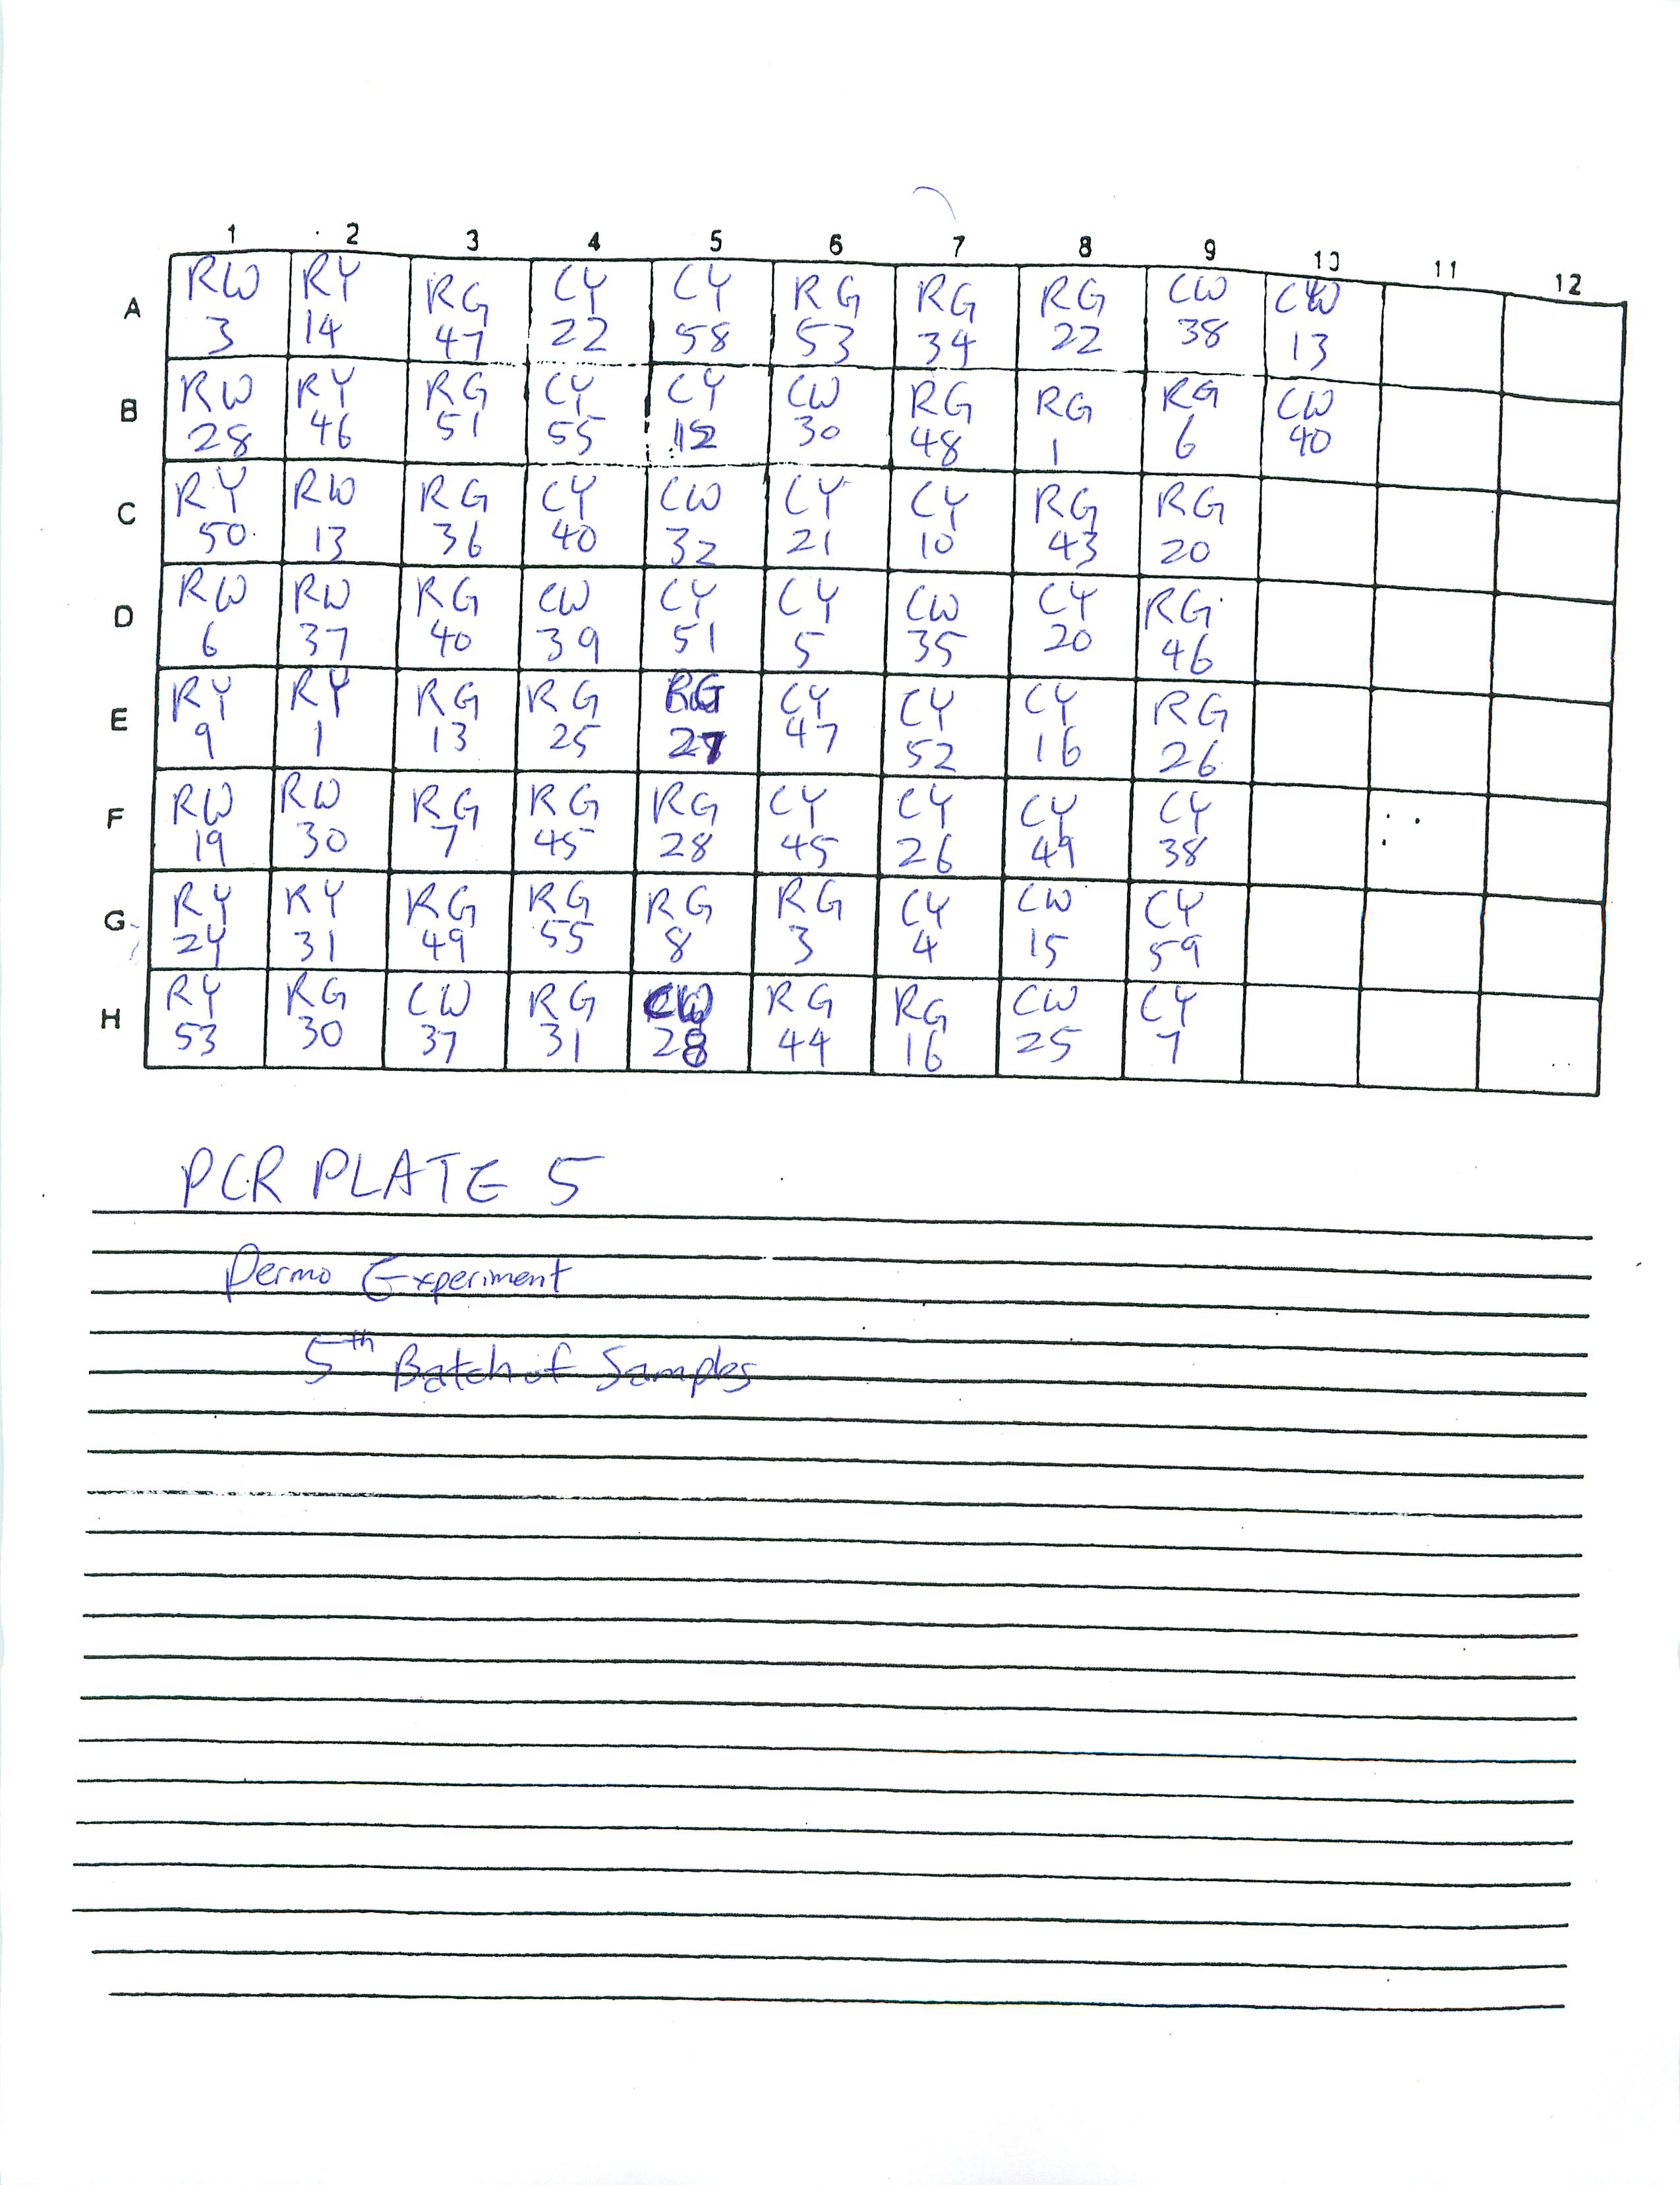
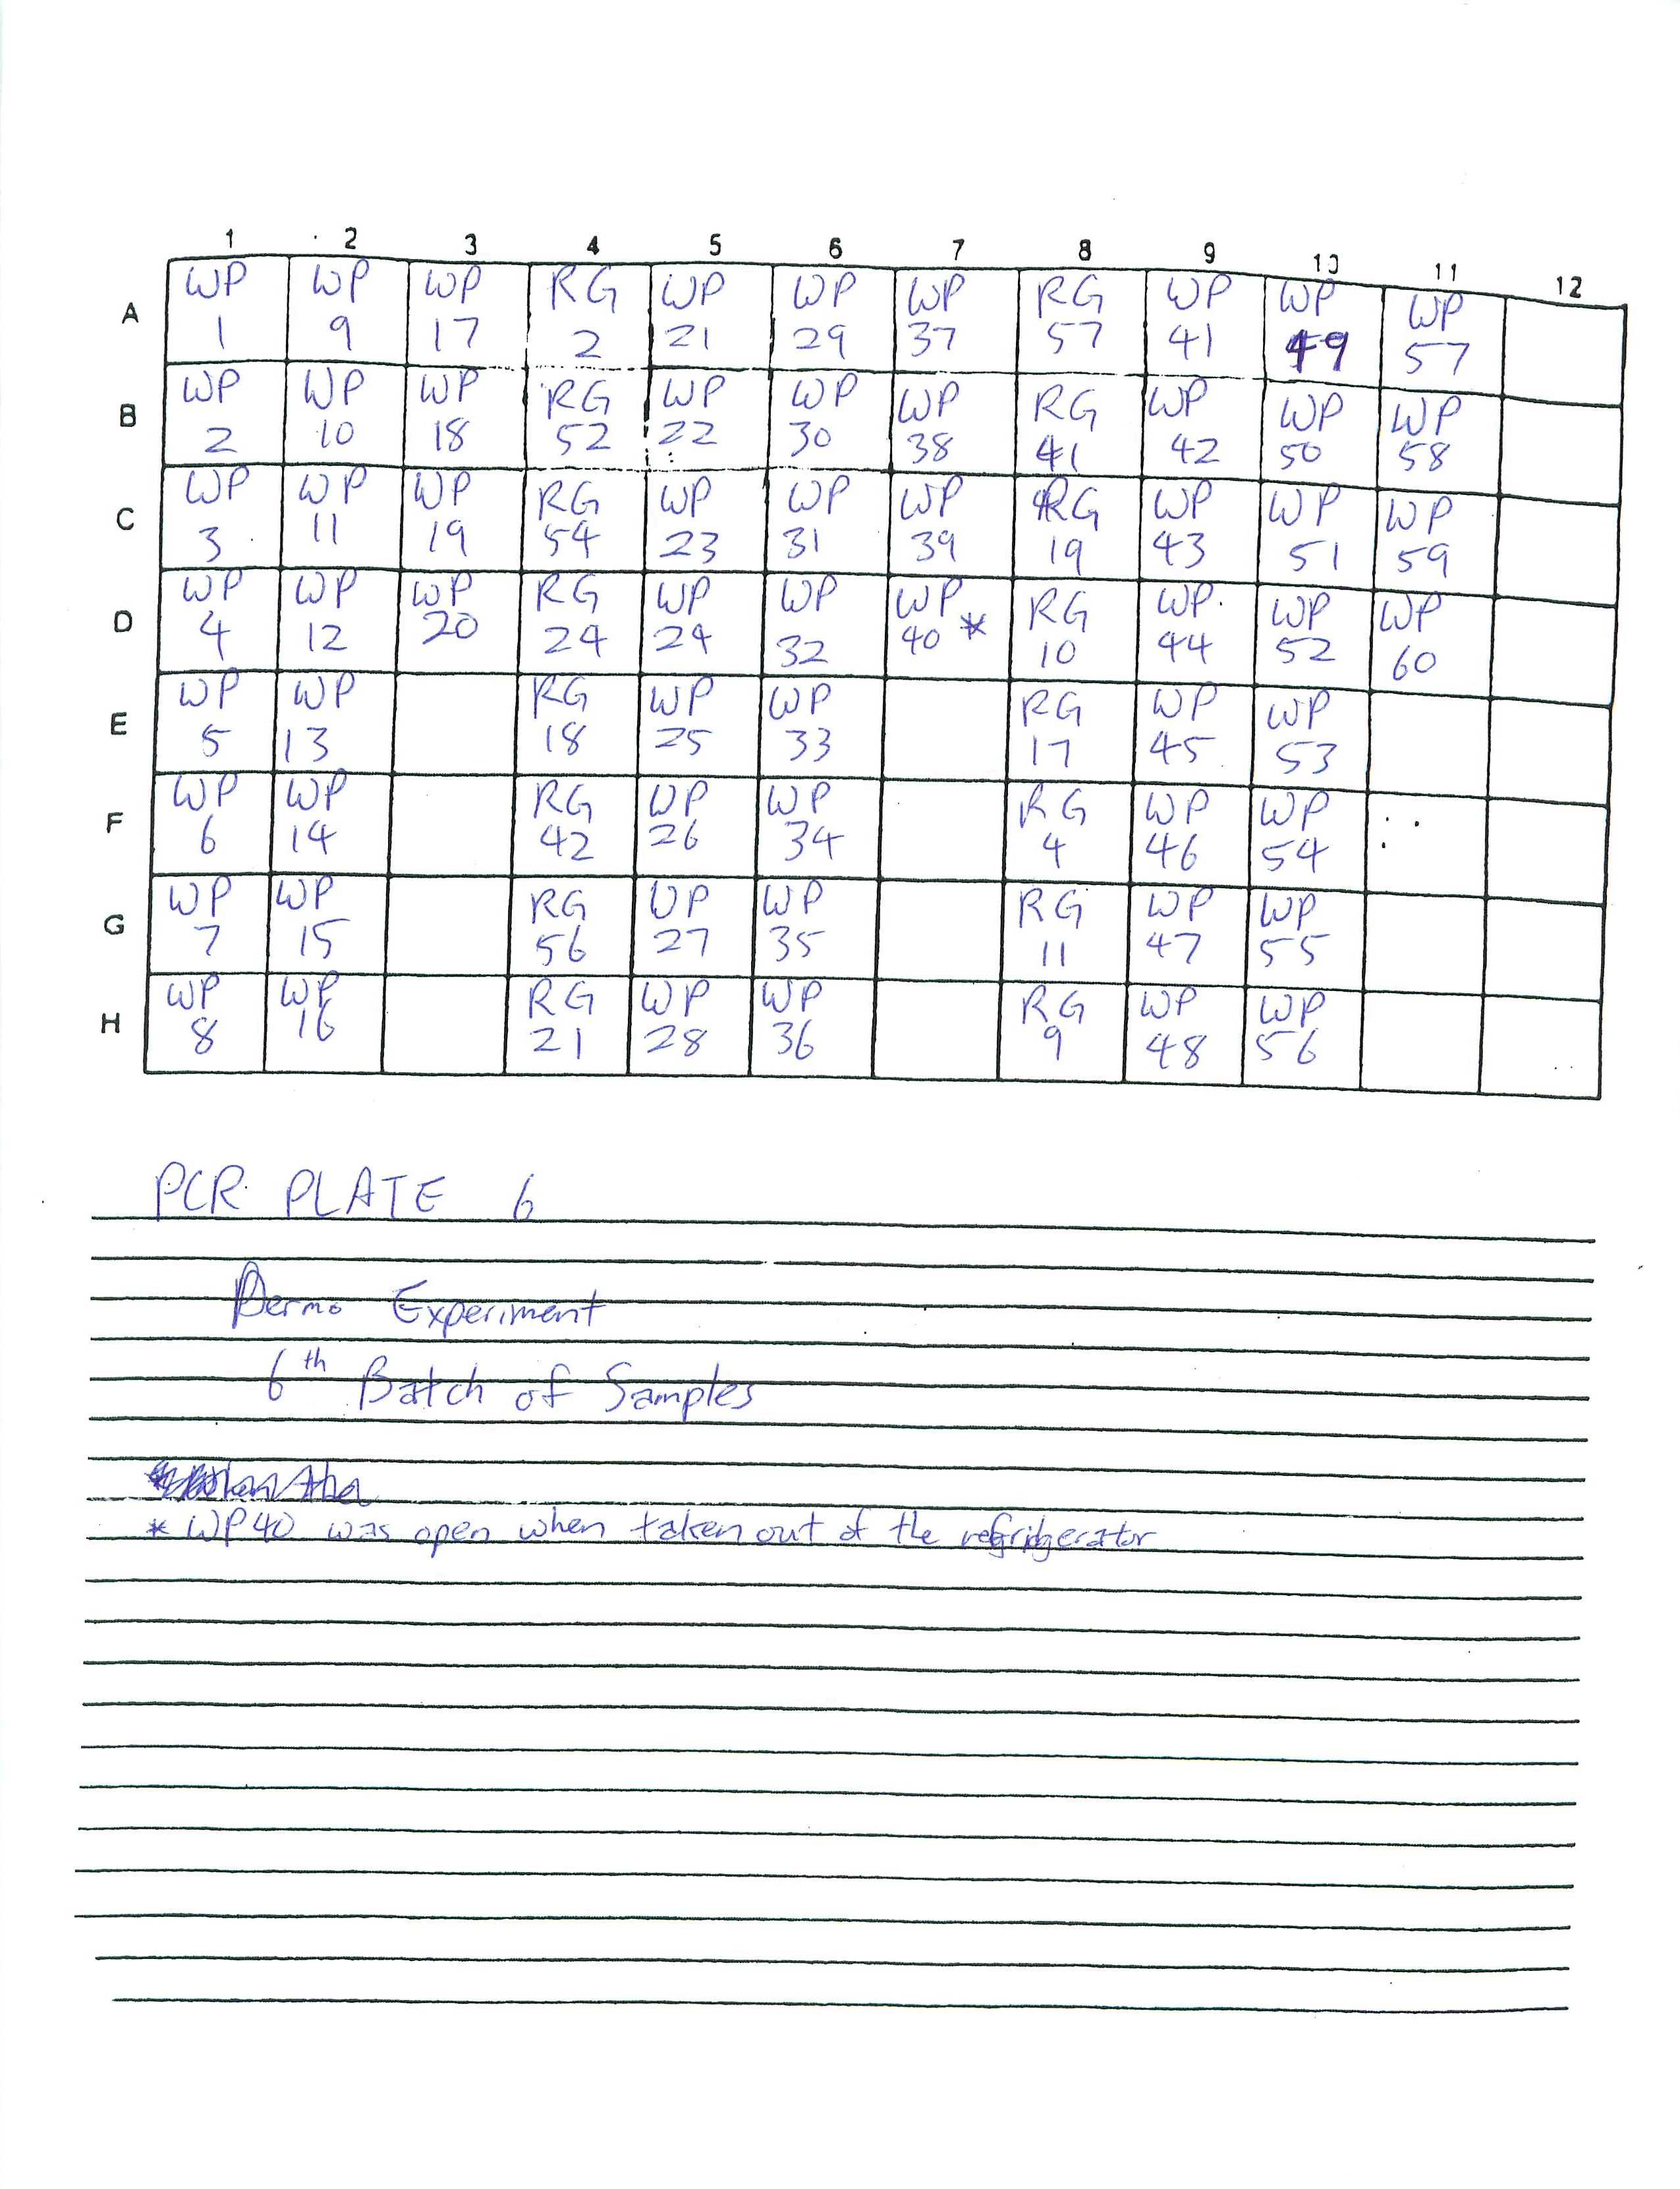
Will continue to make PCR sheets and PCR plates tomorrow.
1-14-09
Incubated 1st batch of oyster samples in 95 degrees Celsius for 40 minutes. Each samples were recorded onto a PCR sheet for organization:
PCR Plate 1:
| 1 |
2 |
3 |
4 |
5 |
6 |
7 |
8 |
9 |
10 |
11 |
12 |
|
| A |
RB 9 |
RB 39 |
RP 15 |
WY 14 |
EP 47 |
EP 60 |
EP 39 |
EP 33 |
EP 17 |
- |
- |
- |
| B |
RP 48 |
RB 35 |
RB 37 |
WY 12 |
EP 56 |
EP 34 |
EP 26 |
EP 52 |
EP 32 |
- |
- |
- |
| C |
RB40 |
RP 45 |
RP 57 |
WY 30 |
EP 58 |
EP 21 |
EP 55 |
EP 22 |
EP 3 |
- |
- |
- |
| D |
RP 11 |
RP 22 |
RP 29 |
WY 10 |
EP 23 |
EP 9 |
EP 59 |
EP 7 |
EP 24 |
- |
- |
- |
| E |
RP 24 |
RP 1 |
RP 4 |
WY 51 |
EP 25 |
EP 12 |
EP 8 |
EP 16 |
EP 40 |
- |
- |
- |
| F |
RP 8 |
RB 36 |
WY 39 |
- |
EP 19 |
EP 29 |
EP 51 |
EP 27 |
EP 14 |
- |
- |
- |
| G |
RP 30 |
RB 6 |
WY 58 |
- |
EP 43 |
EP 50 |
EP 15 |
EP 11 |
*EP 10 |
- |
- |
- |
| H |
RB 32 |
RP 38 |
WY 3 |
- |
EP 57 |
EP 38 |
EP 28 |
EP 13 |
*EP 36 |
- |
- |
- |
PCR Plate 2:
| 1 |
2 |
3 |
4 |
5 |
6 |
7 |
8 |
9 |
10 |
11 |
12 |
|
| A |
WW |
CP 1 |
CP 9 |
CP 17 |
CP 25 |
CP 33 |
RG 14 |
CP 41 |
CP 49 |
CP 57 |
- |
- |
| B |
RG |
CP 2 |
CP 10 |
CP 18 |
CP 26 |
CP 34 |
RG 23 |
CP 42 |
CP 50 |
CP 58 |
- |
- |
| C |
RG |
CP 3 |
CP 11 |
CP 19 |
CP 27 |
CP 35 |
RG 15 |
CP 43 |
CP 51 |
CP 59 |
- |
- |
| D |
RG |
CP 4 |
CP 12 |
CP 20 |
CP 28 |
CP 36 |
RG 32 |
CP 44 |
CP 52 |
CP 60 |
- |
- |
| E |
RG |
CP 5 |
CP 13 |
CP 21 |
CP 29 |
CP 37 |
RG 38 |
CP 45 |
CP 53 |
- |
- |
- |
| F |
WG |
CP 6 |
CP 14 |
CP 22 |
CP 30 |
CP 38 |
RG 58 |
CP 46 |
CP 54 |
- |
- |
- |
| G |
RW |
CP 7 |
CP 15 |
CP 23 |
CP 31 |
CP 39 |
RG 60 |
CP 47 |
CP 55 |
- |
- |
- |
| H |
RW |
CP 8 |
CP 16 |
CP 24 |
CP 32 |
CP 40 |
RG 37 |
CP 48 |
CP 56 |
- |
- |
- |
1-8-2009
Cataloged samples which came in this morning.
While the fact that one sea scallop came in was obvious due to its large size, the three smaller scallops were unable to be categorized; they all looked like bay scallops.
Top View of Scallops; From Left to Right: Sea Scallop, Unknown Scallop #1, Unknown Scallop #2, Unknown Scallop #3
Bottom View of Scallops; From Left to Right: Sea Scallop, Unknown Scallop #1, Unknown Scallop #2, Unknown Scallop #3
Top View of Sea Scallop
Bottom View of Sea Scallop
Bottom View of Unknown Scallop #1
Top View of Unknown Scallop #1
Bottom View of Unknown Scallop #2
Top View of Unknown Scallop #2
Top View of Unknown Scallop #3
Bottom View of Unknown Scallop #3
Smaller samples in tubes were also cataloged:
Large Ziplock Bag with Pink Zip:
1. (3) Male Sea Scallops
2. (6) Bay Scallops
3. Bay Scallop 059
4. Bay Scallop 051
5. Bay Scallop 035
6. Bay Scallop 330
7. Bay Scallop 318
8. Bay Scallop 219
9. Bay Scallop 296
10. Bay Scallop 329
11. Bay Scallop Black Dot
Small Ziplock Bag with Clear Top:
1. Bay Scallop Pure - 8/04/2008
2. "Hybrid" Scallop - 8/04/2008
Regarding the gene sequences, I obtained what may have been the Bay and Sea Scallop gene sequences previously used to create primers. However, upon further inspection and research on the NCBI website, the four gene sequences used came out to be Bay and Sea Scallop myosin gene sequences. Just for kicks, I used Geneious to assemble my previously constructed Bay Scallop Actin and the two Bay Scallop Myosin gene sequences, as well as the Sea Scallop Actin and the two Sea Scallop Myosin gene sequences--no matches for either of them.
Each of the two Sea Scallop myosin and the two Bay Scallop myosin gene sequences were assembled with each of the primers separately--no matches for any of them.
Unfortunately, it seems as though the four gene sequences are NOT what was used to make the primers from.
1-7-2009
Was introduced to Geneious and its functionality.\
Using the NCBI website, Sea Scallop Actin gene sequence was found and placed in the database. Bay Scallop Actin gene sequence was unavailable directly on the NCBI website so it was constructed by BLASTing the Sea Scallop gene sequence and using 5 EST nucleotide sequences.
Using Geneious, it was found that while the forward primer (used for both bay and sea scallops) was matched from site 443 to 459 on the Bay Scallop Actin gene sequence. However, the reverse primer did not match up properly with the Bay Scallop Actin gene sequence. Since Sam talked about the possibility of the primers being switched on a previous account of preparation for the experiment, the Bay Scallop Actin gene sequence was put up to be assembled with both Sea Scallop's reverse primers but did not produce any matches.
The Sea Scallop Actin gene sequence, on the other hand, had matching sites for both the forward primer and the second reverse primer (Primer Sea_Actin_Rev2). While the forward primer matched up from site 421 to 427, the reverse primer matched up in an interesting manner as shown:
Sea Scallop Actin Gene Sequence from site 1400 to 1440: TTTACTAACCAAAGTATATGGACAGCTATGTATACTAAGGA
Reverse primer Sea Scallop Actin gene from 1400 to 1440: - - - - - - - - - CAAAGTATATGGACAGCTAT - TATAC - - - - - -
This mishap may have occurred due to either accidents or unavailable information, as this experiment was begun about a year ago.
At this point, the best road to take would be to redesign new primers, or at least the reverse primer for the Bay Scallop Actin. Geneious assembled the Sea Scallop Actin gene sequence and the Bay Scallop Actin gene sequence and showed the best site for a Bay Scallop primer to attach was around site 1290 (around site 1265 on Sea Scallop gene sequence).
1-6-2009
A 1% agarose gel was prepared for the samples to run on.
Electrophoresis gel was run.
Lane 1: 100 bp Ladder
Lane 2: Water
Lane 3: Bay and Sea Scallop "Hybrid"
Lane 4: Bay Scallop
*Lanes start from the left

It looks as though water showed some bands while it was not supposed to. Also, the Bay Scallop does not seem to share any common bands with the Bay and Sea Scallop "Hybrid" so it shows the experiment gives no useful evidence of a "hybrid" scallop being possible. Perhaps the "Hybrid" lane not giving any clear nor useful bands is due to the fact that the "hybridized" tissue had not been chelexed.
-
1-5-2009
First day of trying to determine whether Bay and Sea Scallop can be hybridized.
A small (~1mm^3) piece of Bay Scallop tissue (YLB47) was cut and mixed with 300microliters of 10% chelex. The mixture was incubated at 95 degrees Celsius for 30 minutes and periodically vortexed. *Hybridized Bay and Sea Scallop tissue may not have been chelexed.
EDIT 1-6-2009: Dr. Steven Roberts confirmed the "Hybridized Bay and Sea Scallop tissue had not been chelexed.
Rather than pipetting the correct amount of PCR reagents for each sample, a master mix was made.
GoTaz Preparation Calculation:
| 2X Master Mix |
12.5 microliters |
*4.5 (4 samples to be prepared) |
56.25 microliters |
| Primer "f" |
0.5 microliters |
*4.5 |
2.25 microliters |
| Primer "r" |
0.5 microliters |
*4.5 |
2.25 microliters |
| Water |
9.5 microliters |
*4.5 |
42.75 microliters |
| Template |
2 microliters |
(no change necessary) |
|
| Total |
25 microliters |
23 microliters of the master mix was added to three tubes. 2 microliters of water was added to one tube, 2 microliters of chelexed bay scallop tissue was added to the second tube, and 2 microliters of pre-chelexed hybridized tissue was added to the third. All three samples were placed in the Peltier Thermal Cycler.
Will be back tomorrow to see whether samples are good to run on gel electrophoresis.
12-29-2008
First day of lab!
Was introduced to labs and various rooms of buildings.
Notified of safety precautions and general instructions regarding the labs.
Learned about various tools and machines in labs such as an a utoclave.
Saw and fed the octapus!
Watched Sam White prepare for an agarose gel electrophoresis of RNA Gel - V. tubiashii mRNA samples (Sam's Notebook - entree #2008122