analyzed data. Split up powerpoint. Finishing paper.
December 2, 2010
I decided to look at the expression of SOD “super oxide disputase” in the mock control (no pesticide), mock & pesticide, LPS control (no pesticide), and LPS & pesticide DNA samples. (Samples 49-80) Duplicates were made for each of the DNA samples, which is equal to 62 qPCR wells.
The Master Mix was halved to reduce mixture waste. The master mix for each well consisted of 25ul of 2x Immomix, 2ul of Syto-13 dye, 2.5 uL of 10uM primer F, 2.5uL of 10uM primer R, 16ul nanopure H20, and 2ul of cDNA. The master mix was amounts were multiplied by 72 to account for the 62 wells, 4 blank wells and possible mistakes. PCR at 55°C.
October 29, 2010
After the necessary samples were DNased, they were quantified using the nanodrop spectrophotometer.
All of our samples were then normalized to 1ug RNA per reverse transcription reaction. To beginning normalizing our RNA; we mixing our normalized RNA by inverting the tube and combining 1ug of RNA, 0.5 uL of oligo dT, and 15ul of H20 in a labeled PCR tube. The mixture was ten incubated for 5 minutes at 70°C on the thermocycler then immediately transferred to ice. After chilling the tube, we added 5ul of M-MLV 5X reaction buffer, 5ul of dNTPs, and 1ul of M-MLV RT. The mixture was then incubated again for 60 minutes at 42°C and then heat inactivated at 70°C for 3 minutes on the thermocycler. After incubation, the samples were centrifuged and stored at -20°C.
Now that samples have been normalized, we are now prepared to qPCR.
November 16th, 2010
Beginning on the 16th, we did a test PCR for genomic DNA contamination. We first added 0.5ul of RNA into new tubes along with 50ul of qPCR reaction mastermix. Mastermix included 2000ul of 2x Immomix, 160 ul of Syto-13 dye (50uM), 200ul of 10uM primer F, 200ul of 10uM primer R, and 1408ul of nanopure H20. From the qPCR results, we determined that 12 samples needed to be DNAased.
November 18th, 2010
DNAase. Samples 11, 25, 28, 32, 41, 42, 45, 58, 59, 61, 76, 77 were DNAased. The procedure included combining 3ul of TURBO buffer, 1ul of TURBO DNAase and 30ul of RNA into a tube and incubated for 30 minutes at 37°C. Another 1ul of TURBO DNAase was added (for the rigorous procedure) and incubated for an extra 30 minutes. After the 60 minutes of incubation, we added 3 uL of DNAase inactivation reagent and incubated at room temperature for 5 minutes (simultaneously mixing by inverting). Tubes were spun down and stored in the -80°C until further quantification.
Reverse Transcription. The procedure began be normalizing RNA to 1ug per RT reaction. In a 0.5 ml PCR tube, 1 ug of normalized RNA, 0.5 ul of oligo dT and 15ul of H20 were added together. The solution was incubated for 5 minutes at 70°C then transferred to ice. 5 μl of M-MLV 5X Reaction Buffer, 5 ul of dNTPs and 1 μl of M-MLV RT were added to the mixture, and then incubated at 42°C for 60 minutes and 3 minutes at 70°C. Samples were spun down and stored on ice at -20°C.
Reflection.
Procedure has run relatively smooth. Besides from mistaking pipette volumes everything has run without error.
November 9, 2007
For the salmon pesticide lab, I found one interesting gene sequence to look at called MHC class II angitgen gene - which is involved in the immune response and autoimmunity.
LCOLPO mykiss_MHC_F AGAGTTGTGGTACGCAGACTTCAAC
LCOLPO mykiss_MHC_R AAACTGATCTGCAAACGGAGGCA
Salmon were infected with both toxic cocktail and the LPS antigen.
November 7, 2010
Introduction/Objective.
Currently the hindrance for distribution and growth of shelled-organisms are the escalating levels and distribution of CO2 in the ocean. With atmospheric levels reaching 380 ppm and still rising, excess CO2 equilibrates with the surface of the world’s oceans and causes a lower pH environment for marine organisms (Pörtner et al., 2004; IPCC, 2007). The most comprehended issue in ocean acidification is the inability for marine calcifying (CaCO3) organisms to construct their shells and/or skeletons from the decreasing saturation of carbonate (CO3) in the upper ocean (Ries et al 2009, Farby et al 2008, Kurihara 2008). Although there is a significant amount of research on calcifying organisms’ response to hypoxia, there is very little knowledge about the combined effect of increased CO2 and temperature. Therefore, the goal of this study is to determine if increased CO2 and temperature causes a physiological response in the Strongylocentrotus purpuratus, a common sea urchin in the Puget Sound. This will be determined through the use of DNA microarrays and quantitative PCR. Two proteins for possible analysis are SM30 and SM50, which facilitate the precipitation of calcium in the spicule. Therefore, if a sea urchin was exposed to a hypoxic environment, there would most likely be a change in gene expression. Other possible test organisms include: mussels, oysters or snails.
Materials and Method.
Urchin collection. Around 30 urchins will be collected along the Puget Sound. Prior to experimentation, to account for former exposure to increased CO2, urchins should be held in flow through sea water tanks for two to four days.
CO2 Tanks. Urchins will be separated into six different CO2/temperature tanks (5 urchins in each group). The three different CO2 levels will be: 1000ppm, 700ppm, and 390ppm; while the two different temperature tanks will be 5 and 25°C. Specific CO2 levels were acquired by IPCC’s current predicted CO2 level for 2100 at 1000 ppm, the current CO2 level of 390 ppm and an intermediate level at 700 ppm. To acquire specific CO2 levels in the seawater, we will mix CO2- free air with pure CO2 to create air with desired CO2 concentrations. Desired CO2 concentrations can then be mixed with seawater in reservoirs and transferred to the specific water tables. Water heaters will be placed in 1 of each of the 2 different CO2 tanks to determine temperature relation. The tables will be regulated daily.
Quantitative PCR Analysis. RNA will be isolated from urchin spicule tissue and transcribed into cDNA for PCR analysis; therefore allowing us to quantify the relative gene expression in the tissue. Proteins and genes used will be those involved in biomineralization and skeleton formation – such as SM30 and SM50. Other genes involved in urchin stress, hypoxia and calcification should be looked at too.
Timeline.
The first and second week will be dedicated to urchin collection and exposure to increased CO2 and temperature; while the third and fourth week will be dedicated to tissue sampling and qPCR lab work. For the last and final week, we used for data analysis and writing.
References.
Fabry, V., Seibel, B., Feely, R., & Orr, J. (2008). Impacts of ocean acidification on marine fauna and
ecosystem processes. ICES Journal of Marine Science , 414-432.
IPCC (2007) Climate change 2007: synthesis report. A contribution of Working Groups I, II, and II to the
Third Assessment Report of the Intergovernmental Panel on Climate Change, Valencia
Kurihara, H. (2008). Effects of CO2-driven ocean acidification on the early developmental stages of
invertebrates. Marine Ecology Progress Series , 275-284.
Portner, H., Langenbuch, M., & Reipschlager, A. (2004). Biological Impact of Elevated Ocean CO2
Concentrations: Lessons from Animal Physiology and Earth History. Journal of Oceanography , 705 - 718.
Ries, J., Cohen, A., & McCorkle, D. (2009). Marine calcifiers exhibit mixed responses to CO2-induced ocean acidification. Geological Society of America , 1131-1134.
November 7, 2010
Summary. The purpose of this lab was to finish/develop the dot blot that we had started the previous lab, as well as performing qPCR to measure gene expression in our decided primers. The dot blot will be measuring DNA methylation.
Materials and Methods.
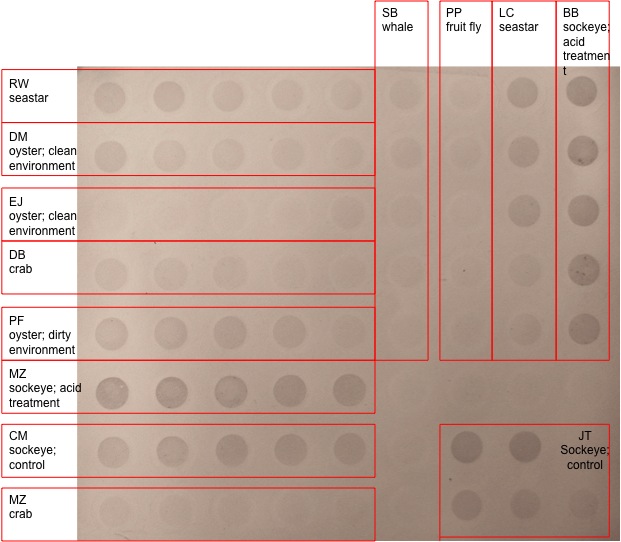
Chromogenetic immunodetection method on previous submission; below is my results from dot blot “LC seastar”.
Quantitative PCR.
1. Primers were rehydrated by adding the amount of nM multiplied by 10 of nuclease-free water to the dehydrated primers.
2. Make a 100uM stock and a 10uM working stock for qPCR – this is done by dilution 1:10 (10ul primer in 90ul water).
3. Make enough master mix for 7 qPCRs to compensate for volume loss.
| Component |
Volume 1X |
Volume 7X |
Final Con. |
| Master Mix, 2X (Immunomix) |
25ul |
175ul |
1x |
| Syto-13 dye (50uM) |
2ul |
14ul |
2uM |
| F Primer (10uM) |
2.5ul |
17.5ul |
2.5uM |
| R Primer (10uM) |
2.5ul |
17.5ul |
2.5uM |
| Sterile H2O |
16ul |
112ul |
N/A |
5. After thawing my cDNA, I added 2ul cDNA to tube 1 and 2, 2ul RNA to tube 3 and 4, and 2ul water to tubes 5 and 6.
(The RNA will serve as a control for possible DNA contamination; while the water will serve as a control testing for contamination in our reagents.
6. Cap the tubes securely.
7. Spin tubes for a couple of seconds, and then hand the tubes over to the TA to load and run on qPCR machine.
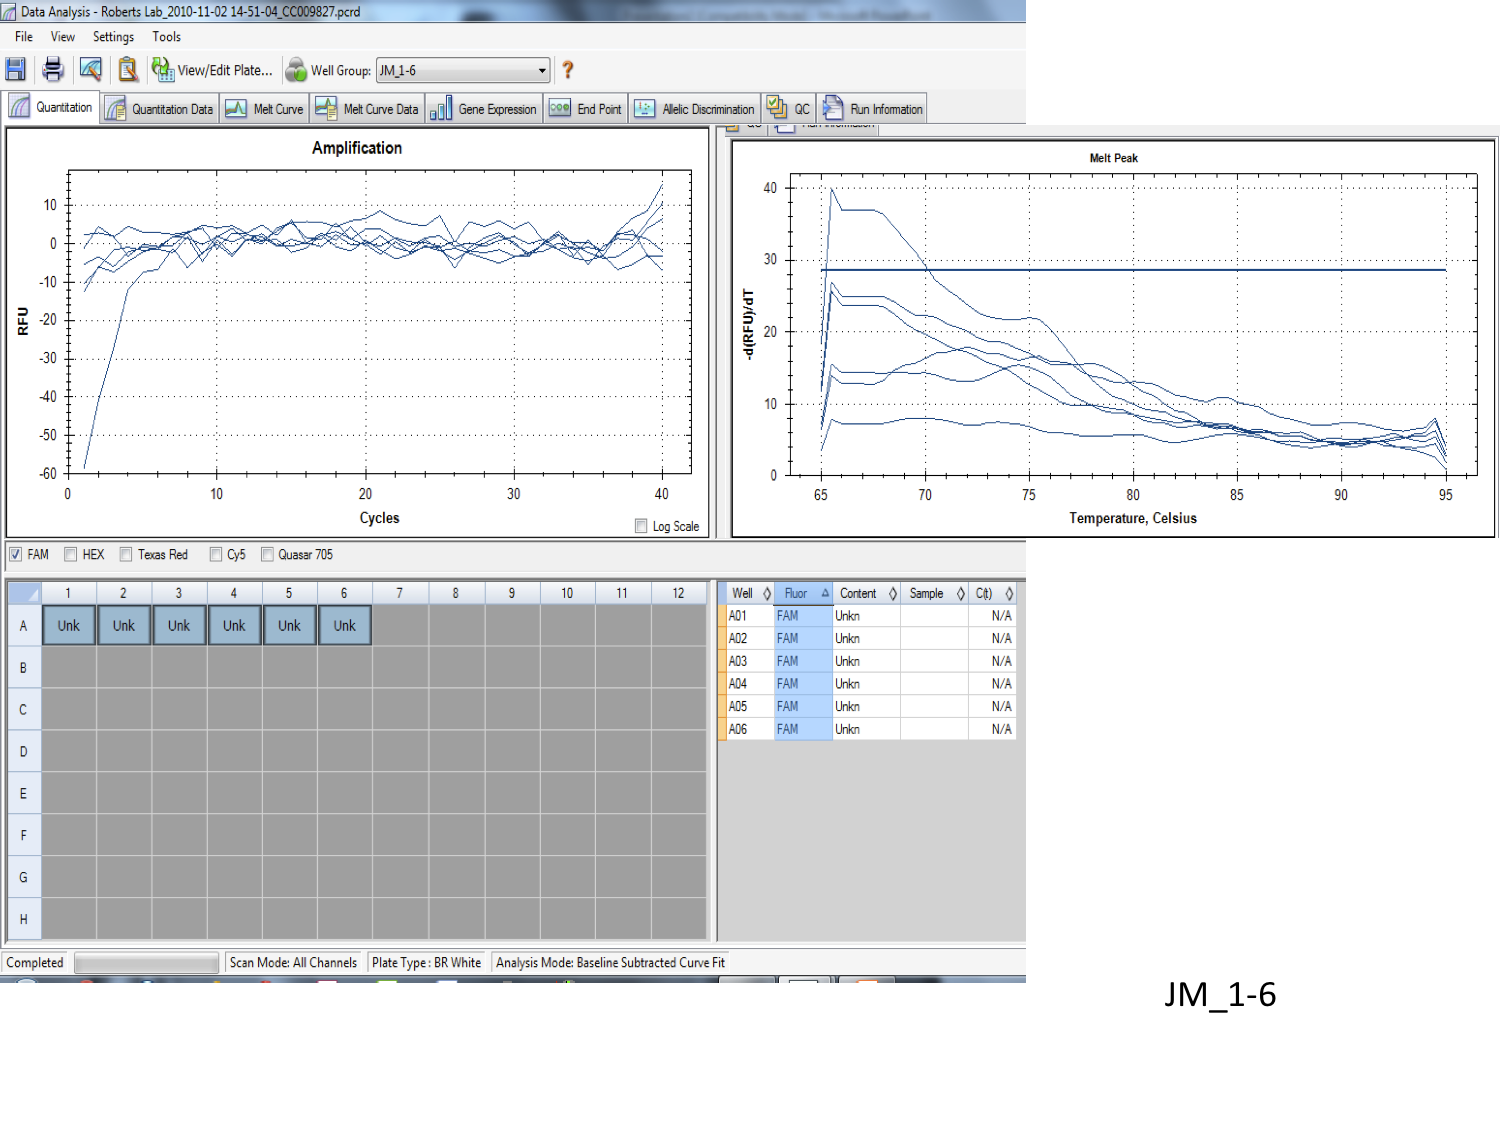
Results. From looking at the results of the dot blot, I would say that it was a success. By comparing my “LC seastar” to “RW seastar” there is a definite correlation in intensities, with the first couple wells having a darker more indented pigment than the lower wells. The darker level of staining indicates that my sample had a high amount of DNA methylation.
The qPCR results seem to be successful, the melting point graph show a distinct point around 80°C indicating a specific, exact primer. However, I’m not exactly sure what the multiple lines on each graph indicate (possibly number of copies). The primer was used to target the Olfactory marker 1on a sockeye salmon tissue.
Discussion. As a whole I think the entire lab went seemingly well. I was able finish the qPCR and dot blots without any problems or mishaps. After completing both of these techniques, I believe that both were great learning experiences. Not only giving me the confidence to go on NCBI, but to also pick out a gene of interest, DNA sequence and DNA primer. In almost every lab I’ve taken, I’ve been given everything I need to complete a thoughtless lab; however in this lab I feel like I’ve watched and done it from start to finish (minus a couple of group qPCR runs). On the other hand, the dot blot was an interesting take on determining DNA methylation. Although it didn’t give my exact quantification of concentration, looking at the shade or intensity of a color is an interesting way of determining absorption.
October 26, 2010
Summary. The objective of this lab was to check the successfulness of the PCR and product on the agarose gel, as well as measure the cytosine methylation using a dot blot and chromogenic immunodection methods.
Methods.
Agarose Gel Electrophoresis. Gel was placed in the gel box and filled with 1x TAE buffer until it completely submerged the gel. Gel combs were removed, after which we filled a 7uL 100bp ladder in the first far left lane, and subsequently added each of our 4 PCR samples into our given lanes. The gel was run at 100V for 1 hour – then looked at under a UV transilluminator.
Cytosine Methylation Dot Blot. Using my Starfish DNA sample, I prepared five dilutions of my DNA. The five target dilutions were developed by combining different amounts of water, 20x SSC, and 50ng/ul DNA sample (table 1). To begin the dot blotting, we cut a nylon membrane to fit the 72 wells, and soaked it in 6X SSC for 10 minutes. A filter paper, cut to the same size as the nylon membrane, was soaked with 6X SSC – then assembled with nylon membrane (membrane lying on top of the filter paper). The wells were then vacuumed and allowed to filter through. The five DNA dilutions were then denatured by placing in boiling water for 10 minutes then immediately transferring to ice. After spinning the DNA for 5 minutes I put my 5 DNA dilutions in a well – then filtered through to the nylon membrane. Once filtered though, we transferred membrane to filter paper soaked in Denaturation buffer and allowed to sit for 5 minutes. Once finished we let dry then wrapped the dried blot paper in plastic wrap and placed upside down on a UV transluminator for 2 minutes at 120kJ to immobilize the DNA.
At this point we ran out of time in lab, and left the WesternBreeze chromogentic immunodetection protocol for next week.
WesternBreeze Chromogenic Immunodetection. We first prepared a 20mL blocking solution by combining 14ml of ultra filtered water, 4ml of blocker (part A), 2ml of blocker (part B). The membrane was placed in the 10ml of the blocking solution and incubated for 30 minutes in a covered dish on a rotary shaker set at 1 rev/sec. After the 30 minutes, the blocking solution was decanted and rinsed with 20ml of water for 5 minutes. The membrane was then incubated for an hour in 10ml of primary antibody solution (10ml of blocking solution, 2ul of 5-MeC antibody). The membrane was then washed for 5 minutes with 20ml of TBS-T (repeated 3 times), rinsed with 20ml of water for 2 minutes (repeated twice), incubated in 5ml of chromogenic substrate until color began to develop and then finally rinsed twice with 20ml of water for 2 minutes.
Results/Discussion. The 4 PCR bands, don’t look great. There is a lot of haze – and there isn’t much of a distinct band on any of the four lines. I’ll need help on distinguishing if there is any information given in my four lines.
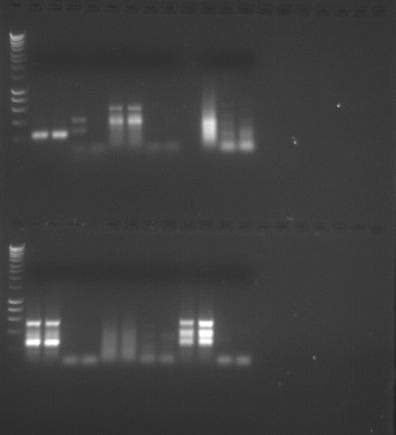
Reflection. The purpose of today’s lab was to finish the PCR protocol from last lab by running our DNA on an agarose gel and visualizing the samples using a UV transiluminator. We also were taught about the dot blot technique which is an immunodetection based assay that enables us to visualize the DNA methylation concentration between our different DNA samples. I’m disappointed in my assay results, and hope that I can find some information or meaning in the blurred lines. I’m not exactly sure why my results proved to be so indistinguishable. Hopefully I will have better luck next time.
------------------------------------------------------------------------------------------------------------------------------------------------------------------------------------------------------------------------------------------------------>
October 18, 2010
Summary. The objective of this lab was reverse transcribe my sockeye salmon RNA into complementary DNA, along with using PCR to amplify a gene of interest, and making an agarose gel.
Materials and Methods.
Reverse Transcription. To transcribe my RNA into cDNA I added 5uL of the RNA into a PCR tube labeled “LAC, cDNA”, along with 1uL of oligo dT and 4uL of nuclease free H20. After incubating the mixture for 5 minutes at 70°C then immediately transferring to ice, I added 5uL of M-MLV 5X Reaction Buffer, 5uL of dNTPs, 1 uL of M-MLV RT, and 4 uL of nuclease free H2O. The mixture was then incubated for 60 minutes at 42°C and then heat inactivated at 70°C for 3 minutes in the thermocycler. After the sample was centrifuged for a couple seconds it was stored on ice at -20°C.
Polymerase Chain Reaction. The reaction master was made by combining 250uL of GoTaq Green Master Mix 2X, 15uL of foreword primer 10uM, 15 uL of reverse primer 10uM, and 108uL of nuclease free H2O. The primer I used was GnRH. Four tubes were then labeled 1 through 4: tubes 1 and 2 contained 2 uL of cDNA and while tubes 3 and 4 contained 2uL of Nuclease-free H20. 48uL of the reaction master was then added to each of my 4 PCR tubes with their specific template already added (cDNA or Nuclease-free H20). The tubes were centrifuged to pool the liquid at the bottom the tubes then put through a thermal cycling profile (table below). Once finished cycling the tubes were stored at -20°C.
| Stop |
Temperature |
Time |
Cycles |
| Denaturation |
95°C |
5 min |
1 |
| Denaturation |
95°C |
30 sec |
40 |
| Annealing |
55°C |
30 sec |
|
| Extension |
72°C |
90 sec |
|
| Final Extension |
72°C |
3 min |
1 |
| Hold |
4°C |
∞ |
1 |
Making an agarose gel. 2 grams of agarose was mixed with 150mL of 1xTAE in a 1L flask and microwaved for 3 minutes. After cooling the solution 12uL of ethidium was added and mixed by swirling. The solution was then poured into a gel tray, gel combs were added and then plastic wrapped for the next lab.
Results/Conclusion. The third lab was mostly all procedural techniques to amplify and isolate our cDNA which we will use and examine further at the next lab. On October 26th, more information will be known about my results from the finished agarose gel.
Reflection. With all the busy work, it seemed that the purpose of this lab was to acquaint us with the protocol and procedure of PCR. The procedure was used to generate thousands to millions of copies of a DNA sequence with only a couple of pieces of DNA. Our agarose gel, PCR, and designed primer will hopefully quantify the created cDNA.
October 12, 2010
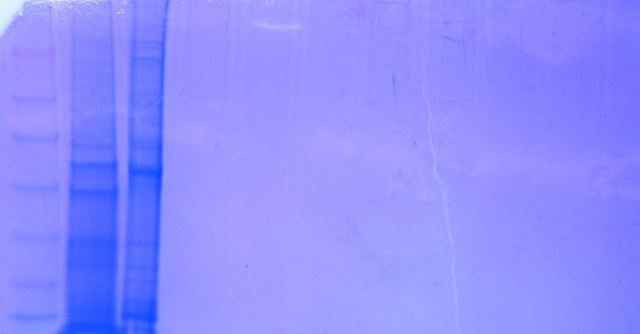
Summary. The objective of this lab was to run the extracted total protein from the previous lab through an SDS-PAGE gel, to separate proteins by molecular weight -
Materials and Methods.
SDS-PAGE Protocol. After acquiring my protein extract from the previous week, I thawed the sample and dispensed 15uL of it into a new screw cap tube with 15uL of 2X Reducing Sample Buffer. The new sample was mixing my flicking and centrifuged for 10 seconds in order to pool the liquid. After boiling the sample for 5 minutes, the entire sample was loaded into the appropriate well in the gel box (#10). After the class loaded all their protein samples, electrodes were plugged into the gel box and set at a voltage of 150V and ran for 45 minutes. Once finished the gel was trimmed, placed in a Coomassie Stain, incubated for 5 minutes, rinsed with 10% acetic acid and incubated for another 15 minutes. Once bands were visible, our TA took a photo of the finished gel.
RNA Extraction. To extract the RNA we isolated in the first lab, we incubated our homogenized tissue sample tube at room temperature for 5 minutes, and then added 200uL of chloroform. After vortexing the sample for 30 seconds then spinning the tube in a microfuged for 15 minutes, I transferring the aqueous clear top layer of the solution to a fresh microfuged tube; the rest of the solution was discarded. I then added 500uL of isopropanol to the new tube, mixing it by inverting the tube several times. The solution was then incubated at room temperature for 10 minutes, then microfuged for 8 minutes at max speed; a white small pellet with supernatant was the product. 1mL of 75% EtOH was added to the pellet and then vortexed, the new solution was then microfuged at 7500g for 5 minutes; after the supernatant fluid was removed. The tube was then microfuged for 15 seconds, the remaining EtOH removed, and the pellet was dried at room temperature for 5 minutes. To finish the extraction, I resuspended the pellet in 100uL of 0.1% DEPC-H2O, incubated the tube at 55°C for 5 minutes, and then lastly placed on ice.
RNA Quantification. To measure the concentration of RNA in my solution, I pipetted 2uL of my RNA sample into a nanodrop spectrophotometer. The spectrophotometer then measured the A260/280 ratio, A260/230 ratio and RNA concentration. The remaining sample was stored at -80°C until further use.
Calculations. None.
Results.
RNA concentration: 933.4 ng/nL
A260/280 ratio: 1.97
A260/320 ratio: 2.21

Conclusion. The Polyacrylamide Gel Electorophoresis is used to separate proteins from each other based on their molecular weight. After the gel is finished, protein weights can be determined by location and width of the bars on the protein band. My protein sample of sockeye salmon with pH treatment was in gel, well 10. From the photo, there isn’t a clear indication between the sockeye samples with pH treatment and those without. Each of the four treatments (mine included) has three bands placed at high, medium and low molecular weights. My middle and low bands are the strongest on the band, however not as strong/wide as one pH treated salmon band, and one non-treated salmon band. From these photos, I would conclude that there is no significant visible trend in the sockeye salmon protein bars and it would be helpful to perform a western blot to determine which proteins were in the sample. Good -
My RNA sample for sockeye sample with pH treatment A showed a concentration of 933.4 ng/nL – the high concentration level is most likely due to the freshness of the sockeye salmon in comparison to the other organism which were not freshly caught. The A260/280 ratio was measured to be 1.97 which is in the range (1.8 – 2.0) of clean RNA. The A260/230 ratio, however, was measured at 2.21 which is not in the range (1.5 – 2.0) of clean RNA; this is most likely due to carryover phenol, ethanol or high salt in the sample.
Reflection. The purpose of this lab was to continue previously started work on RNA and Protein extraction. To lab however also informed us of the protocol of Polyacrylamide Gel Electorophoresis and nanodrop spectrophotometer – these are used to measure the molecular weight of different proteins in a solution and measure the concentration of RNA in a given sample. The procedure was clear; most of the lab was spent on vortexing and microfuging. I feel the lab would have been more interesting if more time was spent learning about the protein gels.
Table 1. List of sample types and lanes in gel electrophoresis.

Figure 1. Gel 1 starting with Lane 1 on the left. My sample was in Lane 10.

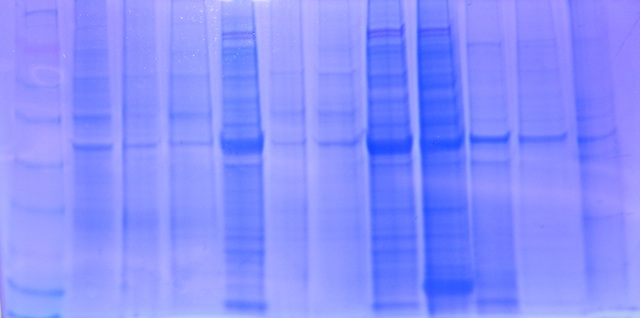
Figure 2. Gel 2 starting with Lane 1 on the left.
Primer pair 1
| Sequence (5'->3') |
Strand on template |
Length |
Start |
Stop |
Tm |
GC% |
||
|---|---|---|---|---|---|---|---|---|
| Forward primer |
ACGCGGGGACAGCGAAACTA |
Plus |
20 |
1 |
20 |
58.45 |
60.00% |
|
| Reverse primer |
CGCTGCAGGGACTGGACACG |
Minus |
20 |
215 |
196 |
60.04 |
70.00% |
|
| Internal oligo |
Plus |
|||||||
| Product length |
215 |
|||||||
| Product Tm |
||||||||
| Product Tm - min(OLIGO Tm) |
||||||||
| Exon junction |
||||||||
| Total intron size |
||||||||
>AB490250.1 Oncorhynchus nerka sOMP1 mRNA for salmon olfactory marker protein 1, complete cds code
product length = 215
Forward primer 1 ACGCGGGGACAGCGAAACTA 20
Template 1 .................... 20
Reverse primer 1 CGCTGCAGGGACTGGACACG 20
Template 215 .................... 196
October 5, 2010
Please Include the date at the top of your entry -
Summary. The purpose of this lab was to perform an RNA and protein extraction for sockeye salmon tissue. We then later determined the concentration of total protein by using a Bradford protein assay. To create primer designs in the next lab, we looked for three significant proteins in our given organism’s genome. Technically we are looking for gene sequences not protein, since proteins sequences would be written out as a string of amino acids. :) -
Materials and Methods.
RNA Isolation. Only starting the procedure for RNA extraction, we added 500 uL of TriReagent into the labeled tube of sockeye salmon tissue and homogenized the tissue using a pestle and vortex. Once completely homogenized another 500 uL of TriReagent was added, votexed for 15 seconds and stored at -80°C until further studied.
Protein Extraction. Previously weighed, I began by adding 500 uL of CellLytic MT solution into the given 1.5mL tube. After homogenizing the sockeye salmon tissue with a sterile disposable pestle and inverting the tube several times, I microfuged the tube for 10 minutes at max speed in a refrigerator. Once finished I transferred the supernatant top liquid layer of the microfuged tube into another tube with the label “Protein”.
Protein Quantification Protocol. I first diluted an aliquot of my protein sample 1:2 by pipetting 15uL of my protein sample with 15uL of DI water in a fresh tube labeled “Protein, BA, LAC, 10/5/10”, then mixing it by pipetting. In a second tube, I pipette 30 uL of DI water and labeled it “blank”. In both tubes I transferred 1.5mL of Brandford reagent and inverted the tubes several times before incubating for 10 minutes. Once incubated, I transferred 1000uL of the blank solution into a disposable cuvette and 1000UL of the protein solution into another disposable cuvette. First wiping the cuvette with KimWipes, I used the blank cuvette to zero the spectrometer, then measured the absorbance of the protein cuvette at 595nm twice. Each time mixing the solution and whipping the cirucumfrence with KimWipes to get an accurate measurement. After measured, the protein sample was stored at -20°C.
Calculations. Taking the two absorbance measurements I averaged their values, and determined the protein concentration by using the equation y = mx + b.
y = 1013.8x + 0
y = 1013.8(0.176) + 0
y = 356.89
Results.
Spectrophotometer readings: 0.178, 0.174.
Average = 0.176.
Back-calculation of protein concentration: y = 1013.9 X 0.176 X 2 = 356.89 ug/ml
Conclusion. Since we just began a lab that should take several weeks, nothing can be strongly said about the procedure or results of the lab. I was able to accurately extract the protein – this was shown by the dark blue color of the solution in comparison to the light brown color of the “blank” solution. Good observation! -
Reflection. I found the purpose of this lab to be to familiarize myself with the protocols of RNA and protein extraction and the NCBI website. The procedure ran smoothly with straightforward directions and descriptions. Although the NCBI website seemed somewhat confusing at first, from further exploration I now find the website straight forward and relatively hand for other projects and papers.
Using NCBI I found three proteins that I would like to look at more closely, these include: metallothionein A (ABA03253) protein which may be involved in protection against metal toxicity and oxidative stress This is a protein which cannot be used for designing primers and PCR. There is a nucleotide sequence for the gene metallothionein A (see DQ139340.1) however this is the entire gene sequence (not just mRNA or cDNA) which contains both the introns and exons (the expressed regions transcribed into RNA). We will only be able amplify exonic (since it is RNA) regions using qPCR so primers designed off of this sequence might not work because we do no where the exons are. For this class, I would stick to one of the other genes because there is a better chance that the primers will work -