1/6/12
Summary: finish dot blot from 1/5/12. Oysters exposed to dietary L-methionine
Procedure:
- cont. from 1/5/12
- followed Invitrogen's Western Breeze mfr. instructions for using a nitrocellulose membrane
- prepped 1:10,000 dilution of primary 5-MeC antibody (Diagenode)
- primary antibody incubation 1 hr
- development time: no color after 12 minutes, stopped reaction after 60 minutes
- image using Sam's camera. NOTE: tried to image using Friedman lab's imager but could not get a good, focused image.

The results are inconclusive. The background is really high and there is no clear dilution effect. 60 minutes is the longest exposure time I've done with this assay, but the overall signal was so low (or background was so high) that I didn't feel comfortable stopping the exposure any earlier. If I were to repeat this assay I would probably do a larger range of dilutions (e.g. 1.5 - 0.015 ng) and do slightly longer washes.
1/5/12
Summary: initiate dot blot procedure for analyzing global methylation patterns in oysters exposed to dietary L-methionine (gill tissue)
Procedure:
- prepared stock (@25ng/uL) of gDNA from oyster gill tissue (n=4 each: control, 24hr exposed, 48hr exposed (isolated 12/28/11))
- performed spike dilution series using the 25ng/uL stoc

- samples were denatured at 100C for 10min then placed on ice
- used nylon membrane for blotting: pre-wet in 6x SSC, pulled 500uL of 6x SSC through all wells prior to loading samples
- once all the samples were pulled through the manifold the membrane was placed on pre-wet blotting paper w/ denaturation soln. for 10 min, then, similarly on neutralization soln for 5 min.
- the membrane was allowed to dry, cross-linked (120kJ/2min) and stored between blotting paper O/N
12/28/11-12/29/11
Summary: isolate gDNA from oysters+L-methionine experiment (see 12/21/11)
Procedure:
- 12/28/11: estimated ~25mg of gill tissue for 12 total oysters (4 reps each: control, treated 24h and treated 48h) added 500uL DNAzol 200ug proteinase K and incubated RT rotating O/N
- 12/29/11: completed DNA isolation following DNAzol mfr's protocol
- solubilized gDNA in 100 - 300uL EB Buffer (Qiagen) (vol. dependent on amount of buffer needed to solubilize all DNA)
- quant on Nanodrop (Young lab)

Next Steps: These samples will be analyzed for global methylation levels using the dot blot procedure.
12/21/11
Summary: A) Nanostring update, B) oysters + L-methionine, sample 48hr time-point
A) Nanostring update: results of 4 C.gigas samples sent 12/8/11 are summarized below
- Samples were also quantitated at Nanostring results in blue:
- ovary(vinclozolin): Concentration: 230.2ng/uL (20uL sent), 434.1 ng/uL
- sperm sample. Concentration 358.2ng/uL (15uL sent), 108.5 ng/uL
- larvae exposed to Vt Concentration: 268 ng/uL (18uL sent), 317.2 ng/uL
- larvae exposed to 5-azacytidine Concentration 352.9ng/uL (15uL sent), 371.8 ng/uL
- the counts for the gDNA from the Vt exposed larvae are ALL below background with the exception of 1 probe (FP001424_p_cg_6_111), interestingly this same probe had low counts for Alu 1 for the other 3 samples
- The results for the 3 additional samples were added to the working summary that was first generated 12/7/11

- additionally, 2 additional probes showed partial methylation in a single sample: FP008556_p_cg_6_5 showed 28% meth in the ovary sample, and GU207456_52397 showed 31% methylation in the sperm sample
- Interpretations: 1) it's not too surprising that the concentrations obtained by Nanostring would be a little different, by I am surprised by the large disparities in the gamete samples, 2) I am surprised by the lack of hybridization of the larve +Vt sample. Is it possible that all the DNA is bacterial? That seems a little odd. It seems unlikely that it was a sample prep issue because I assume all 4 samples were digested/run at the same time, 3) I am still interested in the differences in the hexokinase gene (EU342886_1129). The gill samples are consistently unmethylated, while the larval/gamete samples show some level of methylation. It would be interesting to design bisulfite primers around this region to confirm these findings, 4) The 5-aza treatment does not appear to have removed ALL methylation from the larvae, the results are consistent with the control larvae from this trial for the sites interrogated.
12/20/11
Summary: oysters + L-methionine, sample 24hr time-point
- see trial start 12/19/11
- fed oysters am (0.125mL/oyster)
- ~1pm, sampled 4 oysters from the L-met treatment (gill tissue sampled and stored @-80C
- replaced H20 in both tanks (added fresh L-met at 0.7g/L to treatment tank)
- fed oysters (0.125 mL/oyster)
12/19/11
Summary: Start trial with oysters + L-methionine
Procedure:
- 12 juvenile oysters total (4 controls, 8 treatment)
- 2 tanks, 3L seawater each (salinity 32 ppt, temp set in room 12C)
- to tank w/ 8 treatment oysters add 0.7g/L L-methionine (2.1g L-methionine was dissolved in 1L seawater)
- feed oysters (0.125mL/oyster algae diet)
- start time 1pm.
12/16/11
Summary: General plan for L-methionine exposure. The goal of this small trial is to induce hypermethylation in oysters by exposing them to L-methionine. Background: Administration of L-methionine induces hypermethylation of certain gene promoters in rat brains (Weaver et al 2005). But it should be noted that the effects of dietary L-methionine exposures are not that straight forward (e.g. may cause hypermethylation only in certain genes, in certain tissues at certain times, and may also result in hypomethylation (Waterland 2006)).Oysters will uptake the free amino acid L-methionine in seawater (Nell & Dunkley 1984).
- concentration of L-methionine: 0.7g/L This concentration showed highest uptake in Sidney rock oyster trials - see previous ref from Nell & Dunkley
- duration of exposure:
- in oysters: L-methionine concentration in tissues (highest concentration was found in gill) increased rapidly for 3 hours, continued to increase slightly through 18hrs then leveled off before decreasing at 24 hrs
- L-methionine itself is not a methyl-donor, but is converted into S-adenosyl-L-methionine which can donate a methyl group. I am not really clear on how long this reaction takes (in general or in an oyster).
- In the Weaver et al (2005) study, they injected L-methionine daily over the course of 7 days before sampling
- based on this limited information, I plan to expose oysters to 0.7g/L L-methionine and sample at 18 & 48hrs post-exposure
- oysters: will use 12 of the small (~1.5in length) oysters that Emma has for this experiment. (n=4 each: control, 24 hr and 48 hr)
- feeding: oysters will be fed (artificial algal diet) at the start of the trial and at every 12hr thereafter. Water will be changed (for control and 48 hr exposure) and fresh L-methionine added (for the 48 hr sampling time-point) after 24hr.
12/14/11
Summary: complete EtOH precipitation of fractions generated using the MethylMiner kit (see 12/13/11). Evaluate separation by PCR
Procedure:
- followed mfr instructions for MethylMiner Kit to complete EtOH precipitation
- solubilize in TE buffer 60uL each sample, except triplicate sample elutions were combined here w/ 60 uL total
- quant on NanoDrop

Results:
I am most interested in the R037 1000mM NaCl Eluate sample, as this is the majority of the methylated fraction of the DNA. The quantification here is likely to be inaccurate since conc. is so low. *I will still estimate recoveries, but probably am overestimating the amount of methylated fractions
Control DNA: >100% total recovery (1ug), 60% was in non-captured fraction, 40% was in methylated fractions (combined). This is generally consistent with expected results (by PCR analysis, not direct quantitation) 70% in super, 30% in captured
Sample DNA: >100% total recovery* (~6ug at the beginning ~7.8ug at the end). Here is the breakdown:
non-captured supernatant: 6.2ug (79% of DNA recovered)
1000mM eluted fraction: 1ug (13% of DNA recovered)
2000mM eluted fraction (this would be the highly methylated fraction): 0.6 ug (8% of recovered DNA)
Evaluation of recovery: The recovery was high overall compared to previous runs (see 11/2010), but the breakdown %wise of each fraction was similar.
Follow-up: PCR was performed to evaluate separation of DNA
PCR for control DNA
- prepped 10uM working stock (5uM each) of primer mix (10uL primer mix, 90uL H20) for both methylated and non-methylated control DNA
- prepped master mix for each primer mix: 6uL primer, 150uL Apex Mmix, 138uL H20 (50 uL rxn enough for 6 rxns)
- for each master mix:
- added 1uL control DNA input (0.5uL each of meth and non-meth working stocks prepared yesterday) to 'input'
- added 1uL control DNA supernatant to 'supe' tube
- added 1uL control DNA elution 1 to tube 'elute 1' tube
- added uL control DNA elution 2 to 'eluate 2' tube
- added 1uL water to 'blank' tube
- cycling parameters (from mfr protocol):
- 94 2min
- 94 15 sec
- 55 15 sec
- 68 30 sec
- repeat 2 - 4 26 times
- 68 5min
Results:
eluate 1 (1000mM NaCl fraction), eluate 2 (2000mM NaCl fraction)

Conclusions/Next Steps: Moving to San Diego, next steps buy plane tickets. Not really. The separation worked, but not as well as it has in previous 2 runs in Nov 2010. Lanes 2 and 7 are positive controls and lanes and 11 are negative controls - as expected. For the left half of the gel, the majority of the non-methylated spike is in the non-captured supe fraction (lane 3), but there was also unmethylated DNA in the 1000mM NaCl elution (lane 4). For the right half of the gel, the majority of the methylated spike was in the methylated fraction (lane 9, and a some in lane 10), but there was also amplification in the in non-captured supe (lane 8). This would NOT be an appropriate separation if the goal was to do a comparative analysis between samples. However, this separation is being used primarily as a means to get a reduced representation of the genome for performing high-throughput bisulfite sequencing, so in this case, I feel the separation is sufficient. The only outstanding issue is that the quantification of the 1000mM NaCl eluate (or methylated fraction) is likely not accurate (conc. too low, no real 'peak' observed at A260). When this sample ships to htSeq they will do QC (size distribution and quantification) on the sample before initiating library prep. If the amount of DNA is not sufficient, I think it would be appropriate to pool this fraction with the remaining fragmented DNA sent to htSeq last week (12/07/11 D)
12/13/11
Summary: complete EtOH precipitation of and perform MethylMiner procedure for R037 pooled oyster sample (initiated 12/12/11).
Procedure:
- Completed EtOH precipitation from 12/13/11. Final volume is 100uL, concentration = 113ng/uL.
- Transferred DNA to a Covaris microtube and sheared DNA using protocol from SOLiD DNA fragment library (target size 150 - 200bp)
- Due to reagent limitations could only process 6ug of DNA through the MethylMiner kit so used 53.1uL of the fragmented DNA going forward with MethylMiner procedure:
- Initial bead wash:
- sample tube: 60uL bead, 40 uL 1x B/W buffer
- control tube: 10uL bead, 90uL 1x B/W buffer
- followed mfr instructions for washing
- MBD protein diluting
- sample tube: 42uL MBD, 158 uL 1x B/W buffer
- control tube: 7uL MBD, 93uL 1x B/W buffer
- DNA preparation
- sample tube: 53.1uL gDNA in 186.9uL H20 (for final conc. of 25ng/uL) added to 100uL 5x B/W buffer and 160uL H20
- control tube: 20uL 5x B/W buffer, 20uL K562 DNA, 1uL diluted meth control, 1uL diluted non-meth control, 58uL H20
- followed mfr instructions (detailed below in steps 4 - 10 of 11/10/10 entry) for the remainder of the protocol. performed multi-step elution with a 1000mM NaCl and a 2000mM NaCl. - samples stored at -80 for EtOH precipitation
- Initial bead wash:
12/12/11
Summary: Prepare a pool of C.gigas gill DNA (35 x 51 oysters grown in SB for 10m (sampled 4/10)) to repeat MBD procedure to get sufficient gDNA to prep bisulfite treated library for Illumina sequencing.
- remake the same pool of gDNA generated 11/13/10
- first needed to re-isolate DNA from a few individuals R037 11, 12, 13 and 16.
- added ~20mg of tissue, 500uL DNAzol and 200ug pK
- rotated end over end for 5 hr at RT
- followed mfr instructions for DNAzol
- solubilized in 100 - 250uL of TE buffer (depending on size of DNA pellet)
- spec'd samples on Nanostrop

- re-spec'd the samples previously isolated that had sufficient gDNA

- pooled 1250ng of DNA from each of 8 R037 gill samples
- #02 19.1uL
- #03 46.4uL
- #06 12.9uL
- #07 13.4uL
- #11 10.1uL
- #12 25.4uL
- #13 4.3uL
- #16 12.0uL
- initiated EtOH precipitation (max volume in Covaris tube is 100uL) added 0.1 vols of 3M sodium acetate, mixed and then added 2.5 vols of 100% EtOH. Mixed and incubated @ -20C
12/9/11
Summary: ran bisulfite PCR samples from 12/08/11 on gel and excised bands
loaded 20uL of 1st and 2nd round PCRs (see 12/08/11) on 1.0% agarose EtBr gel
Results:

Bands! Bands of the correct size!!!! Ok, in summary: The first round PCR shows a faint band around 800bp as expected. The 2nd round PCRs (left to right, sample, 1st round PCR blank, 2nd round PCR blank), show nice bright band at the expected band sizes (355bp and 547bp). There are faint higher MW bands in both sample lanes. The bright bands were excised and stored immediately at -20 (Mac's bisulfite box). A couple follow up things: 1) looks like the method to determine exon/intron boundarys works pretty nicely (see NB entry 12/6/11) 2) BiSearch software did a nice job w/ primer design.
Next steps: The PCR products are ready for cloning next week.
12/8/11
Summary: A) bisulfite PCR C.gigas Vtg primers, B) EtOH precipitate gonad samples (see rationale for precipitation 12/7/11), C) send samples to Nanostring.
A) Bisulfite PCR of Cg vitellogenin (putative 3'exon See SR notebook 12/1/11)
- sample: DH02 bisulfite treated 12/10/09
- 1st round PCR
- used 1uL of template and 24uL mmix composed of : 12.5uL 2x Apex, 0.3uL each 10uM primer stock and 10.9uL H20 per rxn.
- primers used: Cg_Vtgbs_lastout F & R (SRID: 1435, 1434)
- 95C 4min
- 5 cycles: 95C 30seconds, 52C 90seconds, 72C 120 seconds
- 25 cycles: 95C 30seconds, 52C 90seconds, 72C 90 seconds
- 72C 4min
- 2nd round PCR
- 1uL of PCR product from the 1st round PCR
- had 2 blanks for each reaction: 1uL of blank from 1st round, and 1uL H20
- master mix: same as above
- 2 primer pairs(SRID in parenthesis)
- Cg_Vtgbs_lastout_F & Cg_Vtgbs_lastin_R(1435, 1432)
- Cg_Vtgbs_lastin_F & Cg_Vtgbs_lastout_R(1433, 1434)
- cycling parameters: same as 1st round PCR
B) EtOH precipitation of gonad samples originally isolated 7/19/10 and re-spec'd 12/7/11. Samples are P28 and P32 ovary samples from oysters spawned 7/01/10. These samples showed some particulate matter in them 12/7/11 and abnormal spec profiles. Briefly, added 0.1 vols of 3M sodium acetate to 280uL of sample, mixed and then added 2.5 vols of 100% EtOH. Mixed and incubated @ -80C for 1hr. Pelleted DNA 16,000g, 15mins, 4C. Discarded supe. Washed pellet w/ 1mL 70% EtOH (2x washes). Pelleted DNA 16,000g, 5mins, 4C. Discarded supe. Resuspended pellets in a total of 100uL Qiagen Buffer EB (10mM Tris-HCl) and spec'd. Profile is still abnormal. Concentrations (P28: 301.7ng/uL and P32: 223.6 ng/uL ) are likely to be inaccurate.

C) Sent 4 samples to Nanstring for analysis. Based on previous data (see summary 12/7/11), wanted to send a few additional larvae samples and also submitted a sperm and ovary sample. Spec'd all samples 12/7/11, but Nanostring will also get a concentration for these samples prior to running them.
- ovary sample, oyster exposed to vinclozolin (ID: P17 gonad, spawned 7/1/11). Concentration: 230.2ng/uL (20uL sent)
- sperm sample, control oyster (ID: P19 gonad, spawned 7/1/11). Concentration 358.2ng/uL (15uL sent)
- larvae exposed to Vibrio tubiaschii (ID "380 Vt b (8/23/10)-ETS"). Concentration: 268 ng/uL (18uL sent)
- larvae exposed to 5-azacytidine (ID experiment 6/3/10 - 6/7/10, isolation Sam White 6/8/10). Concentration 352.9ng/uL (15uL sent)
12/7/11
Summary: A) Working summary of Nanostring data, B) quantification of potential gDNA samples for Nanostring, C) EtOH precipitation of 5-aza treated larvae sample, D) Ship MBD sample to UW htSeq
A) Working summary of Nanostring data. Includes a few QC steps (1 and 2), scoring method (3), results (4 and 5) and some interpretation. The original file is in Dropbox>Lab>Mac>nanostring

B) Re-quant some older gDNA samples. I'm doing this because the sperm sample I sent to Nanostring was much lower than expected based on the original concentration (isolated 7/22/10). I want to make sure I have good samples before they get run in the assay. The idea is to analyze additional larvae samples as well as repeat a sperm sample and include an ovary sample.
Results:

Yes, something funny is going on with many of these samples. For example P2, P10 and P28 all had conc.between 100 - 300ng/uL in July 2010 (7/22/10). There were some particulates in some of these samples, I wondered if some of the DNA had precipitated out? so I gave them a good spin and re-quanted (see 2nd reads of P28 and P2), it appeared that the conc. had gone up for these second reads, but the spec profiles did not show a nice peak at 260 so I'm not sure what's going on here. I would like to try to EtOH precipitate these samples again, probably in a Tris buffer (instead of 8M NaOH pH adjusted w/ HEPES which is the DNAzol buffer).
Next Steps: I need to EtOH precipitate the 5aza tx larvae sample to get it to a higher conc. for Nanostring before I send it. There is a 'control' sperm sample that looks good for analysis (P19), the ovary sample that had a high concentration and good A260/A230 (P17) was a vinclozolin treated oyster. It could be worth analyzing this sample, but will probably want to try to EtOH precipitate the other ovary samples to get a good control.
C) EtOH precipitation of 5-aza treated larvae. Briefly, added 0.1 vols of 3M sodium acetate to 400uL of sample, mixed and then added 2 vols of 100% EtOH. Mixed and incubated @ -80C for 1hr. Pelleted DNA 16,000g, 15mins, 4C. Discarded supe. Washed pellet w/ 1mL 70% EtOH. Pelleted DNA 16,000g, 5mins, 4C. Discarded supe. Resuspended pellets in a total of 100uL Qiagen Buffer EB (10mM Tris-HCl) and spec'd.

D) Send methylation enriched gDNA to htSeq for Illumina Whole Methylome sequencing. This enriched sample was generated using the MethylMiner kit (Invitrogen). The sample is a pool of gill tissue from 35x51 oysters grown in Samish Bay (R037) for 10 months (see 11/12/10 - 11/15/10 for prep). Specifically, the 1000uM NaCl eluted fraction (methylated) is being sequenced. This same fraction was also directly sequenced (no bisulfite conversion) in March of this year (see 3/7/11 for this sample prep). I spec'd the sample (NOTE: I spec'd this sample in section A but used the wrong buffer to blank. I re-spec'd w/ TE buffer): concentration 15.2ng/ul, 260/280: 1.9, 260/230: 1.1. A total of 0.5ug was shipped on ice, O/N to UW htSeq.
12/6/11
Summary: designed bisulfite PCR primers for the last ~840 bp of Cg_Vtg (AB084783)
Procedure:
- In an effort to avoid large/multiple introns or designing a primer over an intron/exon boundary, Steven mapped assembled C.gigas genomic contigs (from resequencing efforts) to the mRNA sequence. Multiple contigs aligned w/ the mRNA sequence. For some contigs, there were multiple places that aligned to the mRNA likely indicating the presence of an intron. example:

- Targeting a putative exon, I designed nested bisulfite primers using BiSearch (This is the first time I've used this. Previously I've used MethPrimer)
- Here is the region targeted and the position of primers. The 1st round primers should amplify ~850bp, the 2nd round primers should amplify 355bp and 552bp (left to right)

11/30/11
Summary: 1) ran bisulfite PCR samples from 11/29/11, 2) completed C. gigas larvae DNA isolations initiated 11/29/11.
Bisulfite PCR:
loaded 20uL of 1st and 2nd round PCRs (see 11/29/11) on 0.8% agarose EtBr gel
Results: no bands were observed for either the first or second round PCR for both genes (estrogen receptor or vitellogenin)
Interpretation: This is not really that unexpected. The primers were designed from an mRNA sequence. It is likely that the gDNA contained introns (first round PCR was to amplify ~1500bp of each gene, the second round to amplify ~700bp of the 1st round template), and so it is possible that band sizes were too large to amplify under these conditions. Alternatively, it is possible that primers were designed across an exon/intron boundary and therefore did not bind to the genomic sequence.
gDNA isolation:
- completed DNAzol protocol according to mfr instructions. There were no visible pellets after the DNA precipitation step for any of the samples. The DNA was solubilized in 20uL of 8mM NaOH added 2uL 0.1mM HEPES to pH adjust
- quant samples on Nanodrop

Interpretation: Isolations did not go so well. Only 2 of the samples (bold above) had decent recoveries. There are a few reasons why the recoveries were poor. 1) possibly did not have enough larvae for some of the samples (see observations above), 2) larvae have tiny calcified shells, may need to crush larvae or do a more extensive pK digestions to recover DNA from a small # of larvae.
11/29/11
Summary: 1) PCR of bisulfite treated C.gigas gDNA - ER and Vtg gene. 2) Initiated DNA isolation of larval C.gigas samples
Procedure Bisulfite PCR:
- sample: DH02 bisulfite treated 12/10/09
- 1st round PCR
- used 1uL of template and 24uL mmix composed of : 12.5uL 2x Apex, 0.3uL each 10uM primer stock and 10.9uL H20 per rxn.
- 2 sets of primers used: Cg_Vtgbs_A(F&R), Cg_ERbs_A(F&R) (SRIDs Vtg: 1428, 1429; ER: 1424, 1425)
- 95C 4min
- 5 cycles: 95C 30seconds, 55C 90seconds, 72C 120 seconds
- 25 cycles: 95C 30seconds, 55C 90seconds, 72C 90 seconds
- 72C 4min
- 2nd round PCR
- 1uL of PCR product from the 1st round PCR
- had 2 blanks for each reaction: 1uL of blank from 1st round, and 1uL H20
- master mix: same as above
- 4 primer pairs(SRID in parenthesis)
- ER A(F)_B(R) (1424, 1427)
- ER B(F)_A(R) (1426, 1425)
- Vtg A(F)_B(R) (1428, 1431)
- Vtg B(F)_A(R) (1430, 1429)
- cycling parameters: same as 1st round PCR
Procedure gDNA isolation:
- samples: various larval samples from some of Emma's earlier trials for OA and OA + V. tubiaschii, the number of larvae varied for each sample from barely visible to about a half a pinky nail's worth (didn't weight them as they were in small vols of liquid). Most of the samples had been stored in RNA later, 2 had been frozen immediately at -80C *see 11/30/11 for notes on individual samples
- Added 500uL DNAzol to each sample tube (after decanting as much liquid as possible), then added 10uL pK @ 21.1 ug/uL
- Samples rotated end over end overnight.
11/1/11-11/2/11
Summary: isolate gDNA from 6 oysters (C.gigas) exposed to 100ng/L EE2 for 96hr (see 10/27/11 for experiment). Samples to be used for Nanostring study. Also included an 'alive' diploid oyster exposed to low pH (sample from integrative environmental physiology A1D)
Procedure:
- 11/1/11: added 20- 25mg of gill tissue, 500uL DNAzol and 50ug proK to tube and incubate rotating at RT O/N
- 11/2/11: completed DNAzol protocol according to mfr instructions. Solubilized DNA in 200uL of 8mM NaOH added 20uL 0.1mM HEPES to pH adjust
- quant samples on Nanodrop (used Graham's machine)

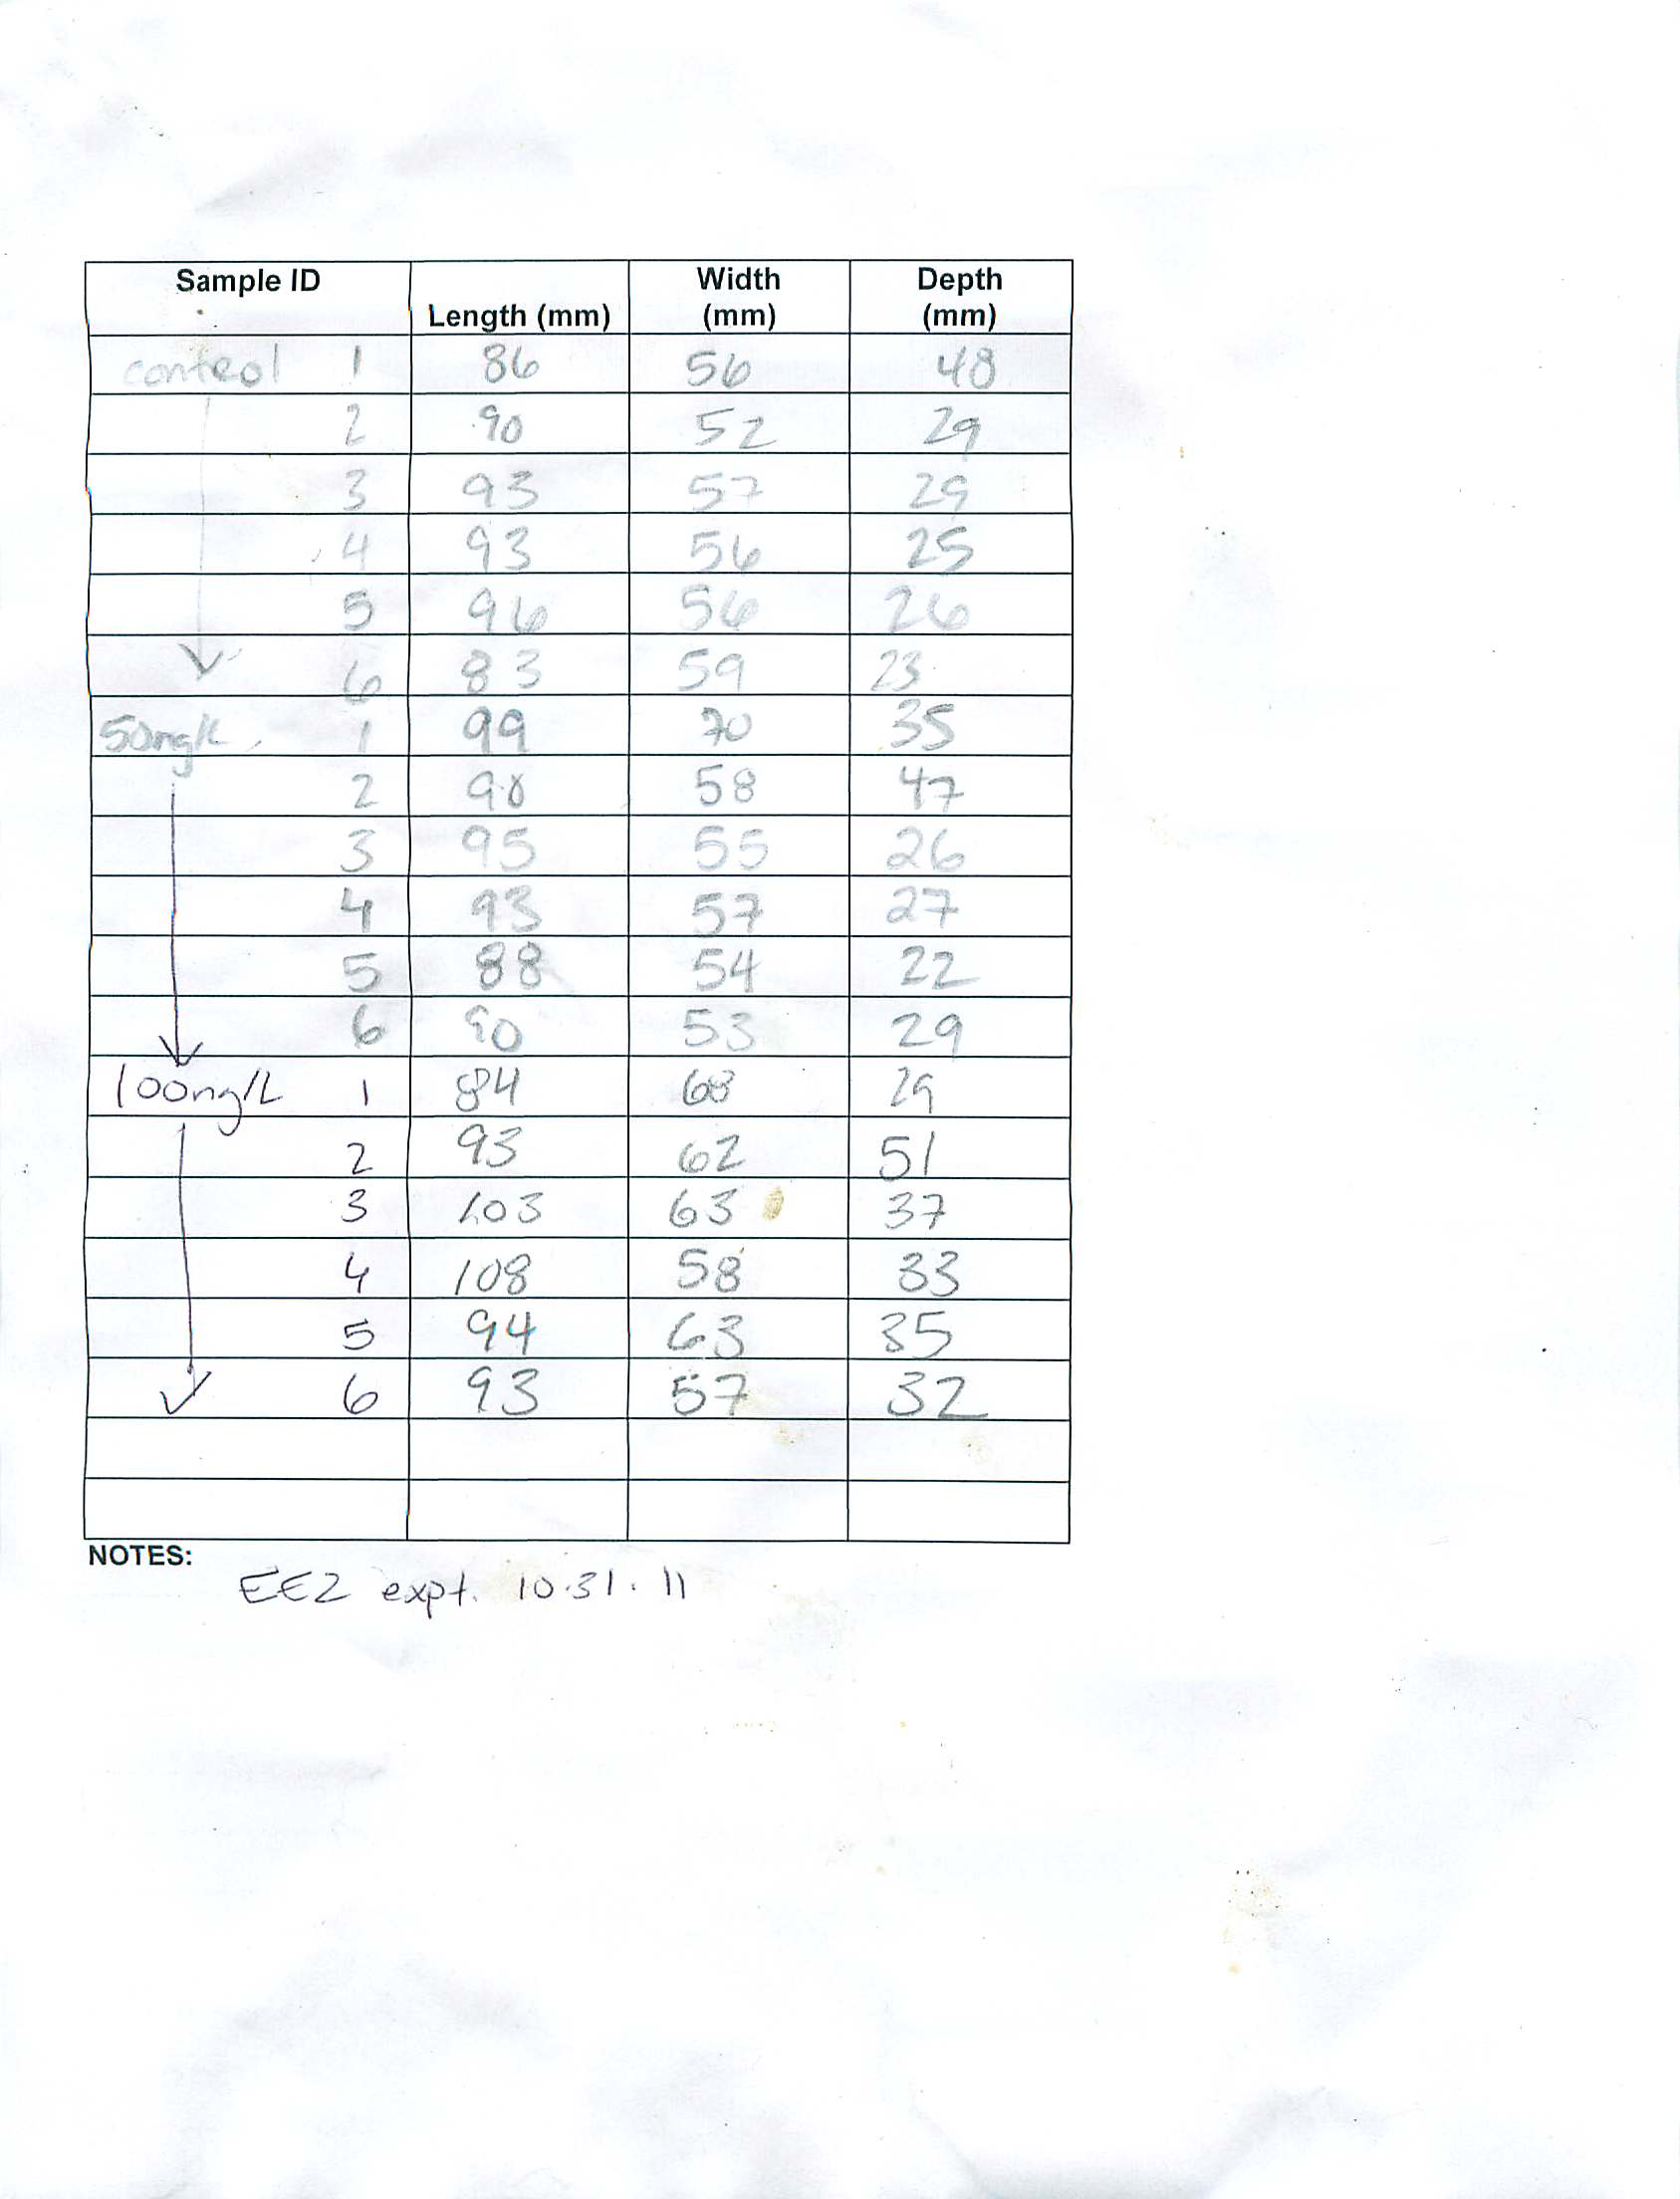
10/31/11
Summary: complete 96 hr EE2 experiment initiated 10/27/11
Procedure:
- 10/28/11 fed 1mL/tank
- 10/29/11 complete water change/re-dosing following same procedure as 10/27/11, fed 1mL/tank
- 10/20/11 fed 1mL/tank
- 10/31/11 ended experiment and sampled tissues
10/27/11
Summary: begin experiment dosing oysters with 17alpha-ethynylestradiol (EE2) at 100ng/L and 50ng/L (total duration of exposure to be 96 hours)
Procedure:
- a total of 18 oysters (3 tanks total, n=6 oysters/5 gallon tank) have been acclimating in 6L of water since 10/25/11. They were fed 1mL algae paste once/day
- today I prepared 2 dilutions of EE2 using Sam's 10mg/mL stock
- dilution A: 10uL @10mg/mL into 990uL EtOH for a final conc. of 100ng/uL
- dilution B: 200uL dilution A (@100ng/uL) into 200uL EtOH for a final conc. of 50ng/uL
- I did a complete water change on all 3 tanks adding 6L seawater/tank using a graduated cylinder
- Then I added the treatments:
- added 6uL of dilution A (100ng/uL) to 50mL of water from the tank, mixed the soln. and added back to the tank (6L total) for a final dose of 100ng/L
- added 6uL of dilution B (50ng/uL) the same way to the second tank for a final dose of 50ng/L
- added 6uL of EtOH (vehicle control) the same way to the third tank
- I added 1mL algae paste to each tank
- Treatments started at 1:30 pm
10/25/11-10/26/11
Summary: cont. from 10/24/11. Select colonies for purification, grow O/N in liquid broth, purify plasmids
Procedure:
- 10/24/11: Selected 4 colonies for each PCR product, Inoculated 5mL 1x LB + 50ug/mL of Kanamycin. Incubated O/N, 37C, 200RPM
- 10/25/11: 3mL of each culture used for mini-preps. Qiagen kit was used and mfr protocol followed. Eluted products were stored at -20C in 'Mac's Bisulfite Treated..' box
10/24/11
Summary: cont. from 10/20/11. Today: Repeat PCR-screen for insert using 1 vector primer and 1 gene specific primer
Procedure:
- PCR screened each colony for the insert using a vector primer and a gene specific primer. I am not absolutely sure which direction the PCR product gets inserted in so for each PCR product will set up 2 mastermixes: 1) M13F_gene specific reverse, 2) M13R_gene specific reverse for a total of 6 mastermixes
- I only screened a sub-set of the colonies: these ID's correspond to gel from 10/20/11:
- 1. 1-2,1-3,1-6,1-8,1-10
- 4. 4-1, 4-2, 4-5, 4-6
- 5. 5-1, 5-4, 5-6, 5-9, 5-10
- note: gene specific primers are 1. A(R), 4. B(R), 5. nest B(R)
- prepared mastermix (50uL reactions) with 25uL 2x Apex mmix, 0.3uL each F and R primer, 24.4uL H20
- PCR parameters
- 95C 10 min
- 40 cycles
- 95C 30 sec
- 55C 30 sec
- 72C 120 sec
- 72C 10 min
(HyperladderII used: top bright band-2000bp, middle - 1000bp, lower-300bp)

Summary: Yeah, still not sure what I cloned. Bands were not observed for the master mixes using the M13 reverse primers (lower half of gel (not labeled)) indicating that the inserts (what ever they are) were inserted in the 5' ->3' direction. For the PCR's using the M13 (F) primer and gene specific reverse primers multiple faint bands were observed for a majority of all 3 PCR products. The expected band size is ~1000bp for all 3 products. There is a faint band at 1000 bp for a majority of the lanes, but there are also higher MW bands as well. Some lanes show bright bands around 200bp. Since 1 insert specific primer was used, empty vector should not amplify. All in all, results are a little confusing still. In order to determine what has been cloned I will continue on with plasmid preps for 4 of the clones for each PCR product.
10/20/11
Summary: cont. from 10/19/11. Today: Repeat PCR-screen for insert using vector primers
Procedure:
- PCR screened each colony for the insert using vector primers
- prepared mastermix (50uL reactions) with 25uL 2x Apex mmix, 0.3uL each F and R primer, 24.4uL H20
- PCR parameters
- 95C 10 min
- 40 cycles
- 95C 30 sec
- 55C 30 sec
- 72C 120 sec
- 72C 10 min

Conclusions/Next Steps: The expected band size for the insert + amplified bit of vector using M13 primers would be around 1000bp for all 3 of the PCR products. None of the colonies had 1000bp bands. Empty plasmids would be around 200 bp, so it looks like there is some kind of an insert for some of the colonies (bands >300bp). I am stumped about the band >2000bp. In order to see if the desired product (or part of the desired product?) has been cloned, will re-screen colonies using 1 vector primer and 1 gene specific primer.
10/19/11
Summary: cont. from 10/18/11. Today: select colonies and PCR-screen for insert using gene specific primers
Procedure:
- a majority of the colonies were blue, but selected 10 white colonies for PCR product 1 and 5, and 7 colonies (only 7 white colonies) for PCR product 4
- PCR screened each colony for the insert using the nested gene specific primers (see primers used 10/17/11)
- prepared mastermix (50uL reactions) with 25uL 2x Apex mmix, 0.3uL each F and R primer, 24.4uL H20
- PCR parameters
- 95C 10 min
- 40 cycles
- 95C 30 sec
- 55C 30 sec
- 72C 120 sec
- 72C 10 min
10/18/11
Summary: initiate cloning of PCR products from 10/13/11 (bisulfite treated Cg_hsc70) using TOPO TA Cloning Kit
Procedure:
- thaw bands, transfer to ultra-DA purification tubes, spin at 5000rcf for 10 min
- warm plates to RT
- prepare cloning rxn (varied amount of sample added based on band intensity (>intensity, <vol.): (remaining vol of PCR product stored in Mac's bisulfite DNA box)
- PCR product "1": 4uL PCR, 1uL salt soln, 1ul vector
- "4": 1uL PCR, 0.7uL salt 1.6uL H20 0.7uL vector
- "5": 1.8uL PCR, 0.7uL salt soln, 0.8uL H20, 0.7uL vector
- rxns incubated at RT for 15min, then placed on ice
- add 2uL rxn to vial of TOP10 competent cells
- incubate on ice for ~20 min
- heat shocked at 42C for 30 sec, then back on ice quickly
- add 250uL RT SOC medium
- incubate tubes horizontally at 37C for 1 hr, at 200rpm
- in the meantime, added 40uL of 40mg/mL X-gal onto 7 room temp plates then dried at 37C
- after incubation spread 100uL of each cell broth onto plate (3 plates for product 1, 2 plates for product 4 and 5)
- incubate at 37C overnight
10/17/11
Summary: run PCR products from 10/13/11 (bisulfite treated Cg_hsc70) on gel and cut out bands
Procedure:
- load total vol (25uL) of 2nd round PCR onto 1% agarose gel
- cut out bands from 2nd round PCR of product 1, 4 and 5:
- 1. nest A (F)_A (R)
- 4. nest B (F)_B (R)
- 5. B (F)_ nest B (R)

negative controls were negative. PCR 1 gave very faint band ~650 bp, PCR 4 had bright band @ 700bp and PCR 5 gave mid-intensity band @ 800bp (these bands are the same size are previous bands (from March 2011) - The expected band sizes for all 3 are between 600 and 700bp.
Next Step: clone PCR products
10/13/11
Summary: PCR of bisulfite treated C.gigas gDNA - hsc70 gene. I am repeating what was performed back in March 2011 with a subset of the nested primer pairs because the products didn't clone the first time around. Changes from March: anneal temp dropped from 58C to 55C (58C was to high for product 'A' primers), added 2uL of template to 2nd round PCR instead of 1uL.
Procedure:
- used the same sample as previous: BB02 bisulfite treated 12/10/09
- see 3/9/11 for srID of primers
- 1st round PCR
- used 1uL of template and 24uL mmix composed of : 12.5uL 2x Apex, 0.3uL each 10uM primer stock and 10.9uL H20 per rxn.
- 2 sets of primers used: A (F_R) and B (F_B)
- cycling parameters:
- 95C 4min
- 5 cycles: 95C 30seconds, 55C 90seconds, 72C 120 seconds
- 25 cycles: 95C 30seconds, 55C 90seconds, 72C 90 seconds
- 72C 4min
- 2nd round PCR
- used 2 samples: 2uL of PCR product from the 1st round PCR
- had 2 blanks for each reaction: 2uL of blank from 1st round PCR (labeled Ba below on gel), and 2uL H20 (labeled Bb below on gel)
- master mix: same as above, but only 9.9uL H20/reaction
- 3 primer pairs (keeping numbering scheme same as 3/22/11):
- 1. nest A (F)_A (R)
- 4. nest B (F)_B (R)
- 5. B (F)_ nest B (R)
- cycling parameters: same as 1st round PCR
10/06/11
Summary: 3'/5' RACE PCR C.gigas DNMT1 cont. from 10/5/11. Nested PCR and visualization of PCR products
Procedure:
- prepared mastermix using BD Bioscience SMART RACE kit:
- H20 (34.5uL each) = 138uL
- 10x Advantage 2 PCR Buffer (5uL each) = 20uL
- dNTP (1uL each) = 4uL
- 50x Adv 2 polymerase (1uL each) = 4uL
- 2uL of primary PCR (see 10/06/11) was diluted in a total of 100uL Tricine buffer from RACE kit
- all reactions had 2.5uL diluted primary PCR, 41.5 uL mmix
- 1: 1uL NUP, 1uL NGSP1, 1.5uL H20
- 2: 1uL NUP, 2.5uL H20 (neg control)
- 3: 2.5uL H20, 1uL NGSP1 (neg control)
- followed Program 2 ( as GSP Tm = 60–70°C):
- 20 cycles:
94°C 30 sec
68°C 30 sec
72°C 3 min
Next Steps: Send the 800bp band from the 3'RACE for sequencing (early next week?). I will combine this sequence with the 1366bp already sequenced. I may be able to get additional sequence bioinformatically using some of the newly released C.gigas sequencing data.