Link to my bioinformatics notes in Evernote
[ http://www.evernote.com/shard/s74/pub/19254861/mgavery/mgaverysnotebook/rss.jsp]
Summary: PCR for Pyromark (50uL reactions for sequencing)
Procedure:
- diluted bisulfite treated DNA to 20ng/uL (or 40ng/uL in the case of sample EV2.28 and the positive control)
- prepped mastermix for the 44098 primers, ran PCR using optimized conditions, performed a gel check - looks good, blank is primer dimer only (resolution on camera is bad)

- prepped mastermix for 733 primers, ran PCR, and stored at 2-8C
Run 5uL of PCR on gel to confirm presence of band at ~300bp
Submit all 18 samples, sequencing primers and sample submission paperwork to Cassie at Fred Hutch
7/24/14
Summary: PCR for Pyromark to determine if primers can amplify unconverted DNA
Procedure:
- ran 2 samples both bisulfite converted and non-bisulfite converted: individuals 28 and 29 (28 had a weak band for primer 44098 and 29 had a strong band)
- ran all 3 primers under their optimized PCR conditions (see previous entry 7/9/14)
- ran them out on EtBr gel

The 733 primers amplify both bisulfite converted and non-bisulfite converted DNA. The 748 primers still not showing much amplification. The 44098 primers can also amplify converted and non-converted DNA. Here though, the amplification is almost not present for either 28 sample, but there is amplification for the 29 sample (both bisulfite and non). I should have run this gel out longer to get the separation between the band and the primer dimer (seen in the blank and oyster 28 lanes)
07/09/14-7/10/14
Summary: PCRs for Pyromark
Procedure:
used previously optimized PCR conditions for primers 733 (56C anneal/3.0mM MgCl2), 748 and 44098 (50C anneal/1.5mM MgCl2)
Mmix prep info here:
http://eagle.fish.washington.edu/bivalvia/070914bisulfite.pdf
Samples were stored at 4C overnight. On 7/10/14, 20uL were loaded into sequencing plate for the Hutch and 5uL were used for running the gel.
Gel Image:
The ladder is a 100bp ladder. The band is very bright for the 733 primers. The band is fainter for the 748 primer and is also subdued by being right underneath the dye front. The 44098 primer gives a good band for sample Ev2.20 and Ev2.29, but the other samples' bands are pretty faint and slightly smaller? than the others.
Gel labeling top of bar: sample number (e.g. 16 = Ev2.16, etc.) The 100% methylated control is labeled with "+" and the blank is labeled "B"

Next steps: Take 20uL of PCR product and 100uL of 10uM sequencing primer to Cassie at the Hutch.
7/2/14
Summary: Repeat PCR from 6/27/14. NOTE: Used different sample only -> Ev2.24 (@130.37ng/ul) prepped at 40ng/uL dilution with 3.06uL of DNA with 6.9uL H20 then did 1:2 serial dilutions to 10ng/uL
Results:
I am happy with the results from the 748 primers. I don't think the starting template amount makes a lot of difference, so will use the 20ng going forward. The 44098 primers are still behaving weirdly. The blank has a faint band that is between 100-200 bp. Since all the reagents are the same in both master mixes, I might assume that the band is from contamination in the primer? Something is definitely amplifying in the DNA wells, but it's smeary. I'll continue to run the gel out and see if it clears up at all. I think I can conclude that the PCR I ran last week did not include polymerase, meaning that the funny band in the 44098 wells was occurring anyway - maybe some kind of primer dimer/timer/... thing?

same gel, run out an hour longer (yes, it was also dropped). Running it out longer helped separate out the primer band seen in the blank with the actual amplified bands. There may be a little bit of smearing above the main band?, but overall it looks good.

Summary/Next steps:
I will order the sequencing primer for all 3 primer pairs and run the PCRs at the optimal conditions for each primer pair. These samples will be sent to the Hutch for pyrosequencing.
6/27/14
Summary: Continued optimization of bisulfite primers (see 6/25/14 for most recent PCR)
Procedure:
- Dilutions of Ev2.28 were performed to load 40, 20, 10 and 5 ng of DNA per reaction (recommendation for bisulfite PCR is 10-20 ng DNA/reaction; previous PCRs used 20ng/reaction)
- prepped master mixes for primers CgBS_748_187112F/R (SRID: 1595/1594) and CgBS_44098_295365F/R (SRID: 1593/1592)
- Mmix prep (1.5mM MgCl2) can be found here: http://eagle.fish.washington.edu/bivalvia/062714bisulfite.pdf
- Anneal temp for this PCR is 50C
NOTE: checked dilutions and realized I only loaded 20, 10, 5 and 2.5ng/reaction for this assay
No bands present in 748 lanes. Low MW band present in all reactions of 44098 - either contam or dimer. One thing I noticed on 7/214 when setting up the PCR is that I almost forgot to add the polymerase because I leave it in the freezer until I need it - maybe I forgot to add? Previous PCR with the 20ng condition produced a band, so something did not go well here. Will repeat and include higher DNA load.

6/25/14
Summary: continued to optimize bisulfite primers (see previous entries in 6/20/14 and 6/18/14 for results)
Procedure:
- prepared master mixes and used a bisulfite treated gDNA sample as template (EE2v2.28 diluted to 20ng/ul) for all reactions
- see details of temp gradients, MgCl2 conc. and play layout here: http://eagle.fish.washington.edu/bivalvia/062514bisulfitepcrlayout.pdf
- ran 20uL of PCR reaction on gel (HyperladderII on top, HyperladderI on bottom)
The band size are as expected 733 =251bp, 748=233bp, 44098=128bp. I am happy with the performance of the 733 primers. All anneal temps look similar so going forward I will use a 56C anneal for these primers. Primer 748 is showing weak bands at both MgCl2 concentrations. In order to ensure the template isn't inhibiting the reaction I will do a dilution of the DNA and run the 50C anneal temp at 1.5mM MgCl2. The 44098 primers are show a very light smear in the region of 128 bp. I will perform a similar dilution series of template at 50C anneal as well to try to improve this.

6/20/14
Summary: a) ran PCRs from 6/19/14 on gel, b) bisulfite treated the EE2v2 samples to be used for the MBD-ChIP validation
a) Gel
Procedure:
- added 6uL of 5x loading buffer to 25uL PCR reaction
- loaded 12uL of each PCR on gel and 5uL of HyperladderII
Unfortunately the resolution on this gel is not as good as the last one. Not sure if it's because I only loaded 12uL instead of 20 or if it has something to do with the gel box or the way I ran it. The band size are as expected 733 =251bp, 748=233bp, 44098=128bp, but I can't tell if there is a single or multiple bands. I will use this gel to limit the temps and MgCl concentrations for one additional optimization assay. For the 733 primers I will repeat the 56, 58, 60 and 62C conditions with the 3.0 MgCl2 conc. For the 748 primers there are no real strong bands, so I'll try lowering the anneal temps. I think I'll try 1.5 and 3.0mM concentrations and do a gradient of 50 - 56C. For the 44098 primers I'll also try a few lower temps and repeat a few temps that showed stronger bands. So with the 1.5mM and 3.0mM concentrations I'll do a 50, 53, 55 and 56C temps.

b) Bisulfite Treatment
Procedure:
followed EpiTect procedure for: Sodium Bisulfite Conversion of Unmethylated Cytosines in DNA (except for sample Ev2.22 where I used the prep described in method for "Sodium Bisulfite Conversion of Unmethylated Cytosines in DNA from Solutions with Low Concentrations of DNA")
Volumes/Concentrations used:

http://eagle.fish.washington.edu/bivalvia/skitch/062014bisulfite.pdf_%281_page%29-20140623-155651.jpg
Results:
Nice 260 peaks. The A260/A280 is really high for these samples. The exact same thing happened when I have done bisulfite treatment in the past. The blank was EB buffer from the EpiTect kit.


6/19/14
Summary: PCR optimization for PyroMark assays (bisulfite). Performed additional anneal temp for primers: CgBS_733_26796F/R (SRID: 1597,1596), and tried out primers CgBS_748_187112F/R (SRID: 1595/1594) and CgBS_44098_295365F/R (SRID: 1593/1592) for the first time.
Procedure:
- bisulfite treated gDNA test sample: a pool of gill and EE2 treated gill (011212) was used for all conditions
- ran PCR on the qPCR machine to get a temp gradient. the following 6 anneal temps were tested: 53, 54.9, 56.1, 59.6, 62.3,64C for the new primers and additional temps:59.6, 62.3, 63.1 and 64 were tested for the CgBS_733 primers
- also ran 3 concentrations of MgCl2: 1.5mM, 3.0mM, 4.5mM for the new primers (only 3.0 for the CgBS_733 primers)
- 1 blank per mastermix at 57.7C for the new primers and 61.1 for the CgBS_733 primers
- used Invitrogen Platinum polymerase, mmix and plate layout here:
6/18/14
Summary: ran the PCRs from 6/17/14 on a gel to look for PCR conditions that give single strong band
Procedure:
- added 6uL of 5x loading buffer to 25uL PCR reaction
- loaded 20uL of each PCR on gel and 5uL of HyperladderII
The band size is as expected @ 251bp. All of the conditions showed amplification with the exception of 1.5mM MgCl2 at 60C. Almost all of the PCRs show a faint band just above the major band. The 'best' condition is 30mM MgCl2 at 60C anneal temp, but I would like to take the anneal temp a little higher and try again. I'd also like to check with Cassie to see if I could gel purify the major band and submit that for sequencing. Next steps is running higher anneal temps with the 3.0mM MgCl2 condition and running the additional 2 primer pairs (also going for a wider range of temps for those as well).

6/17/14
Summary: PCR optimization for PyroMark assays (bisulfite). Starting with just 1 primer pair and running 24 different conditions (anneal temps and MgCl2 conc.'s vary). Primers: CgBS_733_26796F/R (SRID: 1597,1596) note: reverse primer is biotinylated
Procedure:
- bisulfite treated gDNA test sample: sperm P19 bisulfite treated 011212 (diluted with H20 to ~20ng/uL) used for all conditions
- ran PCR on the qPCR machine to get a temp gradient. the following 6 anneal temps were tested: 53,55,56,58.2,59,60C
- also ran 3 concentrations of MgCl2: 1.5mM, 3.0mM, 4.5mM
- 1 blank per mastermix at 57C
- used Invitrogen Platinum polymerase, mmix prep and plate layout here: (link to: http://eagle.fish.washington.edu/bivalvia/gel_and_other_images/06172014qPCRlayout.pdf)
- followed Cassie's suggestion to run 45 cycles (need to use up all of the biotinylated primer, extra will affect pyrosequencing) denature (94C), anneal (variedC), and extention (72C) were all 30s with initial hot start of 10min/95C and final extend 10min/72C
6/16/14
Summary: prepare a 'positive control' DNA that is 100% methylated to use in Pyromark assays
Procedure:
- gDNA used: Ev28 (isolated by Sam) @126.01ng/uL
- prepared duplicate reactions with 0.5ug each following mfr instructions for M.Sss (link to protocol: http://www.zymoresearch.com/downloads/dl/file/id/122/e2010i.pdf)
- incubated at 30C for 3 hrs. then added additional methylase and incubated overnight
- stopped reaction 06/17/14 by incubating at 63C for 20 min
- stored gDNA in Mac's bisulfite DNA box in -20C
3/28/14
Summary: Test gDNA isolation of early gonad sample with Qiagen kit (used day zero female "7.go")
Procedure:
Followed manufacturer's instructions (starting on page 28) of Qiagen DNeasy Protocol (Animal Tisues)
-starting material: 13mg (cut up)
-proK/ATL buffer overnight (4:20pm start, 10am stop - solution was not viscous)
-observed white precipitate when AL buffer was added, loaded all volume onto column
-eluted in 100uL EB 2x (combined elutions for a total volume of 200uL)
Results: There is strong absorbance at A230 (A260/A230 =1). A260/A280=1.86, concentration=93.4ng/uL
Conclusions/Next Steps: not sure if the carryover is ethanol or salt. If ethanol, I need to make sure the column is really dry prior to elution. If salt from the sample, probably not much I can do. I am concerned however about how it will affect the downstream application (bisulfite treatment).
Follow up: Sam ran another test sample (EE2v2.9go) on 4/2/14 and had a better A230. He used ~ 10mg starting tissue. The only differences we noted between procedures is he does all spin steps at max speed and does that final spin step for 10 instead of 3 minutes (protocol says to spin at 20g, but centrifuge only goes to 16g so he upped the time). Perhaps his protocol dries the column better and gets residual ethanol etc. off the column.
2/26/14
Summary: Testing RNA recovery using RNAeasy Plus Mini Kit take 2 (take 1 was done 2/25/14): Sonication and Qiashredder columns.
Procedure:
Following up from yesterday's failed procedure, I tried 3 different things today to optimize the protocol:
1. I could have 'too much' gDNA or RNA in sample, to not overload the columns I used the minimum amount of tissue 10mg and the maximum amount of tissue ~30 mg (27 mg) from a day 0 female.
2. I could have poor homogenization so I tried two different things
a) Qiashredder columns: This is one option for homogenization given in the manual. We have these columns (even though they're old: 2007) so I processed 2 samples (the 10mg and 27 mg samples). I disrupted the samples first with mortar and pestle then ran them through the column (max spin for 2 min). Sample was clear after column.
b) Sonication: Sonication is another option for homogenization given in the manual (even though they say specifically to use Qiagen's TissueRuptor, but we only have a regular old sonicator). I did one sonicated sample with 27mg of starting material (a second day 0 female) And did pulse sonication on ice - about 30, 1 second pulses. The sample was clear after sonication.
3. Perhaps there was not enough enough lysis buffer. Today I used 650ul of buffer (should have used 600 maximum, I didn't read it well enough and used 650uL instead).
Then I followed the protocol the same way I did on 2/25/14 except the RNA column step was performed twice since only 700uL of lysate can be placed on the column at a time.
Results:
Neither the 10mg or 27mg Qiashredder'ed samples showed any RNA recovery (eluted in 30uL H2O)
The sonicated 27mg sample showed some recovery with a very small peak at A260. The sample was reported to contain 11ng/uL RNA (330ng total). This should be enough for an RNA-Seq library even if this quantitation isn't accurate because the concentration is too low for Nanodrop to read accurately. The sequencing lab said they have made successful libraries with 50 -100ng of RNA.
Conclusions/Next Steps
The RNA yield is low compared to what the manual states is possible with this kit (minimum of 4ug of recovery). I am not sure if the issue is with the tissue type? I almost want to try the process one time with a gill tissue sample, where we know we get good RNA recovery, and see what the results look like.
In terms of being ready to run my real samples, I am still a little hesitant. I think I have less than 27 mg for most of these samples - probably closer to 15mg for most samples, which may not result in enough RNA.
2/25/14
Summary: Test RNA recovery in the tiny EE2 day 7 gonad samples I have. Using 1 female samples and trying out the RNeasy Plus Mini Kit
No recovered RNA from this test.
Procedure:
- Started by getting a rough estimate for how much tissue I have for each sample. With the exception of individual 22, which is on the array, I have about 10-15mg of tissue for each sample. This should be sufficient for the kit, which uses between 10-30mg tissue
- The Kit manual says you can get between 4- 60ug of RNA from 10mg of tissue (depending on tissue type). At the very, very minimum I need 50-100 ng of RNA to make a library
- I started with sample 26 (day 7 female that was not on the array) as a test sample to see how much RNA I could recover. I had 15mg of tissue to start
- added 10uL of betamercaptoethanol (BME) to 1mL Buffer RLT Plus (make fresh every time)
- added 44mL EtOH to Buffer RPE per bottle instructions
- added 350uL Buffer RLT Plus (with BME) and 15mg tissue and homogenized (~1min) w/ mortar and pestle. Solution was cloudy no solid tissue remained
- Centrifuged for 3min at max speed and removed lysate -- here I noticed a thin, white film on the top of the solution and a tiny 'pellet' at the bottom. I tried to remove just the clear supe. Not sure if the white film on top indicates it wasn't mixed well enough?
- Removed lysate and added to gDNA Eliminator column, centrifuged max speed (says >8000 x g) for 30 s
- Saved flow through and added 350uL freshly prepared 70% EtOH with water supplied in the kit
- Mixed well by pipettng and transferred entire 700uL to RNAeasy spin column and centrifuged for 15s
- Washed 1x with 700uL W1 (centrifuged max speed (says >8000 x g) for 15 s
- Added 500uL Bufer RPE, spin max 15s
- Added 500uL Buffer RPE, spin max for 2 min
- Put column in new collection tube and did Option step 10 - centrifuge 1min max speed
- Placed column in new collection tube and added 30uL RNAase free H20. Let it sit for 1 min and centrifuged for 1min at max speed (still says greater than or equal to 8000 x g)
- Did not perform step 12 using another 30uL of H20
- Put 2 uL on nanodrop with H20 blank and no peaks were observed (0.7ng/uL RNA)
The troubleshooting section of the manual says a few things could be happening here: 1) not enough disruption - try using the sonicator for 30s, 2) reduce the amount of starting tissue OR add more lysis buffer. Too much RNA can clog the column, I am using 1/2 of the maximum amount of tissue, so I don't really think using less is a good idea. I could increase the lysis buffer volume. The instructions say 350-600uL and I used the minimum. Maybe this would help with that weird thin layer I saw after centrifuging the disrupted tissue and Buffer RLT plus.
7/26/13
Summary: purify gDNA (i.e. improve A260/A230 ratio) using Qiagen MinElute Kit samples for control and EE2 treated pools for use in microarray.
Procedure: starting w/ gDNA from 7/21/13
- following Qiagen MinElute protocol for 'PCR purification' added 60uL (5x vol) PB buffer to the samples from 7/21/13
- followed remaining mfr kit protocol with the exception that I left the PE buffer sit on column for 5 min prior to spinning (this step is in troubleshooting guide to help remove salt)
- eluted in 10uL EB and quant on nanodrop
The A260/A230s are much improved (1.9), the A260/A280s are still good = 1.8 - 1.9
Total DNA for the control sample: 54.04 x 9.1uL recovered = 492ng
Total DNA for the treated sample: 56.34 x 10uL recovered = 563ng


Conclusion/Next steps:
The kit worked to improve the A260/A230 ratio. The total DNA recovered is at the low end of what is acceptable for labeling. I will send Cassie at FH this information and see what she says about doing any QC for these samples.
7/21/13
Summary: complete EtOh precipitation from 7/19/13
Procedure: spin max at RT 15min, wash 2x in cold 70% EtOH (spin 5min and remove wash), resuspend DNA in 12uL EB buffer (Qiagen). Quant on Nanodrop
Results:
.jpg "external image 072213nano.bmp%20(2%20documents,%202%20total%20pages).jpg")
.jpg "external image 072213nanoplot.bmp%20(2%20documents,%202%20total%20pages).jpg")
Conc. Next Steps:
It appears that the DNA was still in one of the wash steps/or binding buffer. Bad news is that the A260/A230 is still low. Ordered MinElute kits to try to purify the sample. Threw away the remaining kit supplies from the Zymo Research sample kit
7/19/13
Summary: attempt to cleanup DNA to reduce A230 reading from control and treated EE2v2 pools - no DNA in eluate, attempt to precipiate DNA from washes/binding buffer
Background: these are the input v input fragmented DNA pools from EE2 treated and control individuals (n=3/pool). This material went into the MBD procedure and the methylated fractions were generated from this material. I am trying to improve the A260A230 ratio prior to labeling for the microarray
Procedure: Used the Zymo Research DNA Clean and Concentrate Kit (we had an unopened sample box in the lab)
- 2x vol of binding buffer: 400uL for EE2 exposed, 112uL for control
- follow rest of mfr protocol (basically spin, remove flow through (I saved), wash 2x and remove flow through (saved)
- elute in 25uL EB (Qiagen)
- blanked w/ EB and spec'd on Nanodrop and there was no DNA in the eluate
- tried heating EB to 65C (per protocol for troubleshooting) and eluting in 10uL - no DNA in eluate
- tried to get a spec reading of the binding buffer or wash flow through, but couldn't get a good blank on these reagents
- combined all eluate, wash, binding buffer flowthrough fractions and performed chloroform extraction
- equal vol chloroform
- vortex 30 sec and spin max 15min
- 2.5vol EtOH and 1/10th vol NaOAc
- mix by inversion then placed in -80C
7/2/13
Summary: initiated DNA isolation for EE2v2 sample #22 (day 7 female, EE2 treated). Need additional DNA to make pool for the 'input v input' array assay.
7/1/13
Summary: pos control PCR from MBD procedure 6/28/13, and EtOH non-captured fraction from the control sample and captured wash fractions from the EE2 treated and control samples
Procedure:
- PCR: pos control PCR for captured and non-captured fractions per mfr. protcol (and see 6/14/13 entry for details)
- EtOH precipitation
- EtOH precipitation of non-captured fraction for the control sample and spec for concentration, also EtOH and spec the captured wash fractions to see if can get any more recovery for the methylated fractions
PCR (gel)
The methylated DNA spiked into the pos control sample was present in the captured ('cap') fraction as expected indicating the methylated DNA has been fractionated out. There is a faint band for the nonmethylated spike in the non-captured fraction. It was expected that this band would be much brighter, however, since the non-methylated DNA is NOT in the captured fraction, it's ok that the the band is faint.

Spec of non-captured and wash fractions:
The wash fractions did not have a peak at A260 therefore the samples will not be pooled with the captured material. Overall, there was very little recovery in the washes, most of the DNA is recovered in the original capture step with the high salt elution.
Total recovery for the MBD control sample:
Input: 16ug
Noncaptured: 68.79ng/uL x 180uL = 12.4ug
Captured: 0.947ug
Total yield: (12.4ug + 0.947ug)/16ug * 100 = 83% recovery ~ this is within the range of previous recoveries, again the % DNA recovered in the methylated fraction is less than what is usually found: 7% here, previously found 18-22% of recovered DNA in the methylated fraction. Perhaps the female gonad samples are less methylated than the gill tissue?

6/29/13
Summary: ethanol precipitation of pos controls and EE2 treatment and control samples (initiated 6/28/13)
Procedure:
- followed precip. procedure in MethylMiner kit
- spec'd on Nanodrop

- there is a total of 60uL/samples
- EE2 treatment sample: 15ng/uL x 60uL = 0.900 ug total
- EE2 control sample: 15.79ng/uL x 60uL = 0.947ug total
Minimally, I needed 1ug to do the labeling for the MBD-Chip. I will have enough to do the labeling, but not enough to QC the sample (size/concentration check) first so it will be kinda risky. One way to do a little QC is to send plenty of DNA for the unenriched 'input v. input' samples, which is the same pooled DNA prior to enrichment.
Next: Run the pos control PCR for the MBD procedure and precipitate the non-captured fraction for at least one of the sample to look at total recovery from the procedure.
6/28/13
Summary: MBD repeat of 6/19/13 - EE2 treatment and control sample
Procedure:
- prepping reactions for 16ug of DNA (hoping to get at least 10% back in methylated fraction)
- Prepped beads per MethylMiner kit instructions: a) 160uL beads for samples, 10uL beads for pos. control b) 112uL MBD for samples, 7uL MBD for pos. control)
- 188uL EE2 pool at 78.4 ng/uL (I thought I had 16ug total, but in fact had less so added 14.7ug of DNA)
- 217 control pool at 73.7ng/uL
- Followed remaining mfr instructions to obtain non-captured (performed 4x washes) and captured (high salt only) fractions.
- Proceded to EtOH for all of the captured and non-captured fractions. Added 3M NaOAc and 100% EtOH per manual.
- took 2 uL of the captured fractions out to spec before EtOH precip. Blanked on the high salt buffer and there was no absorption at A260. If only 10% of starting DNA was in there it would be ~5ng/uL, so maybe it's not surprising in that much volume. After EtOH precip will go from 400uL to 60, so we'll see.
- Samples stored at -80 to finish EtOH precipitation (remaining wash fractions were stored at -20C)
6/26/13
Summary: fragmenting DNA for MBD (processing additional DNA from samples 6/11/13 to supplement the remaining DNA)
Procedure:
- EE2: sample 22 is limiting (only 2.4ug of DNA remaining) so pooling 3 individuals in equal quantities (i.e. 2.4ug each)
- sample 22: 35uL @68.52 ng/uL
- sample 20: 11.6uL @206.26 ng/uL
- sample 16: 31.5uL @76.29 ng/uL
- added 21.9uL H20 for total vol of 100 and placed in covaris tube
- Control: sample 32 is limiting, pooking 3 individual in equal quantities (4.85ug each)
- sample 32: 52uL @ 91.51ng/uL
- sample 28: 49.1uL @98.74ng/uL
- sample 29: 33.4uL @ 145.20ng/uL
- added 64.5uL H20 for total vol of 200 and placed 100uL each in 2 tubes.
- sheared DNA using the same protocol as 6/11/13
- pooled the newly sheared EE2 (100ul) and control (total vol 200uL) DNA into the tubes containing the previously fragmented DNA and spec'd
- EE2: 78.4ng/uL ~188uL = 14.7ug
- control: 73.7ng/uL ~ 310uL = 22.8ug
6/20/13
Summary: complete EtOH precipitation of MBD fractions initiated 6/19/13
Procedure:
- followed mfr instructions for EtOH precipitation for captured and non-captured fractions from yesterday's fractionation
- spec'd on nanodrop
- performed qPCR to check pos and neg controls - see 6/14/13 entry for protocol followed (used diluted control DNA from yesterday for the pos spikes)

- Total Yields: for two of the samples: control A and treatment A I precipitated the unmethylated and methylated fractions to look at total recovery. All samples are solubilized in 60uL DNAse free H20
- control A: 7.8uL nonmeth + 0.04ug meth = 7.84ug/8ug input = 98% recovery (0.5% methylated fraction)
- treatment A: 7.3ug nonmeth + 0.3ug meth = 7.6ug/8ug input = 95% recovery (4% methylated fraction)
- Total DNA for methylated fractions: control: 0.5ug, treated: 0.4ug (these are probably not accurate Nanodrop readings since conc. so low)
- PCR results (nonmethylated primers on left, methylated primers on right)

Conclusions/Next steps:
- Previous MBD fractionations had total yields between 63-130% so this was within the expected range
- However, previous runs also had about 18-22% of the total yield in the methylated fraction
- todays fractionation was about 10x less than previous ~2% methylated.
- It appears that the methylated DNA from the control was lost somewhere. Separation did happen since the methylated DNA was not present in the non-captured fraction, but either through loss of pellet? or overdrying of DNA? the methylated fraction was lost. This could also be the case for the samples, where low recovery is due to issue in EtOH precipitation either through loss of pellet or overdrying.
- This is the 5th time I've performed this procedure and the first time this has happened. Results were as expected with the control when I ran it late last week. I used different stocks of ethanol than I did last week and had more samples to manage so I am thinking something happened during the EtOH precip. I observed pellets in all samples after the first centrifugation step, but after the first wash pellets were really hard to see in the methylated fractions.
6/19/13
Summary: Methylation enrichment of Ev2 samples (pooled EE2 treated and control gonad samples (n=3 each))
Procedure:
- Performing 2 replicate MBDs for each pooled sample with 8ug DNA/replicate (33ug DNA processed total 32 sample +1ug pos control)
- 3 individuals were pooled after fragmentation (see 6/11/13), spec'd samples on nanodrop:
- Control pool: 84.6ng/uL
- EE2 pool: 75.5 ng/uL
- Prepped beads per MethylMiner kit instructions: a) 80uL beads for samples, 10uL beads for pos. control b) 56uL MBD for samples, 7uL MBD for pos. control)
- Added DNA to prepped beads
- 94.6uL each control replicate
- 106uL each EE2 replicate
- Followed remaining mfr instructions to obtain non-captured (performed 4x washes) and captured (high salt only) fractions.
- Proceded to EtOH for all of the non-captured fractions, the non-captured and captured fractions for the pos. control, and 2 replicate each (EE2 and control) of the non-captured fractions to evaluate total yield. Added 3M NaOAc and 100% EtOH per manual
- Samples stored at -80 to finish EtOH precipitation (remaining wash fractions were stored at -20C)
6/14/13
Summary: Testing MBD kit by running the control (day 2 of 2)
Procedure: PCR of control DNA using primers specific to the control methylated and non-methylated DNA spikes
- prepped 10uM stock of primers (3uL 100uM stock, 27uL H20)
- prepped new dilutions of spike methylated and non-methylated DNA (1uL into 99uL of H20)
- prepped mastermixes for methylated and non-methylated primers: 6uL primer, 150uL Apex Mastermix, 138uL H20
- added 49uL of mmix and 1uL of the following for each primer set
- pos: 0.5uL diluted methylated DNA, 0.5uL diluted non-methylated DNA
- blnk: 1uL H20
- NC: 1uL non-captured supernatant (non-methylated DNA)
- Wsh: 1uL pooled washes (non-methylated DNA)
- Cap: 1uL of the captured and eluted DNA (methylated DNA)

Conclusions & Next steps:
The results are as expected. The non-captured and wash fractions amplified with the non-methylated primers and the captured fraction amplified with the methylated primers. The next step is to process my samples early next week. I'll need to check before I start and make sure there is sufficient reagents to process 40ug of DNA.
6/13/13
Summary: Testing MBD kit by running the control (day 1 of 2)
Procedure: followed the MethylKit protocol for running the control sample only (DNA provided from kit with methylated and non-methylated DNA spiked in). Stored captured and non-captured fragments @-20C
Next steps: PCR for the methylated and non-methylated DNA. If all goes well will MBD my samples on Monday.
6/11/13
Summary: pooled gDNA from Ev2 isolations on 6/3/13 and sheared pooled DNA
Procedure:
- working backwards with my math, I will need 3 ug of DNA (1ug total DNA, 2ug methylation enriched (MBD) DNA) for the EE2 treated sample (n=3 pooled gonad) and the control sample (n=3 pooled gonad). To get 2ug of MBD DNA I need to start w/ about ~20ug of total DNA since the methylated fraction is only ~13%. So I prepped a pool of 22ug of treatment DNA and 25ug on control DNA (these were a bit higher in concentration so I prepped some extra to run sheared DNA on gel).
- EE2 pool: 96.1uL (#16), 35.6uL (#20), 107.0uL (#22), I then added 61.3uL of EB buffer for a total vol. of 300uL and pipetted 100uL into each of 3 crimp cap Covaris tubes
- control pool: 84.4uL (#28), 57.4uL (#29), 91.1uL (#32), I then added 67.2uL of EB buffer for a total vol. of 300uL and pipetted 100uL into each of 3 crimp cap Covaris tubes
- Sheared each of the 6 microtubes on the Covaris using Rhonda's protocol for 500bp shearing: Duty Cycle 5%, Intensity 3, Cycles/Bursts: 200, Bath: 5C, first treatment is 60sec, second treatment is 30sec
- Pooled the 3 Covaris tubes for each sample back into a microcentrifuge tube and spec'd on Nanodrop
- EE2: 74.4ng/uL (x300uL = 22.3ug)
- control: 81.3ng/uL (x300uL = 24.4ug)
- Ran 0.5ug of sheared control DNA on a 1% agarose/EtBr gel to check size distribution..

Conclusion: most of the DNA is between 500 - 50bp, but a majority of it is between 200-300bp. I think this is ok because Cassie at the hutch says: 'Yes, 500bp is fine…we just want the majority of your sample to be greater than 200bp.' Next step is MBD, but since Claire is having issues with the control samples, I will run the controls myself first to help her troubleshoot and make sure everything is working ok before I run the protocol with my samples.
6/3/13-6/4/13
Summary: gDNA isolation Ev2 day 7 female gonad samples
Procedure:
- isolated DNA from 3 females from control group (2 tanks total) and 3 females from the treatment group (2 tanks total) using DNAzol
- 0.5mL DNAzol
- used 1/2 of the gonad sample from -80C (~8-15ug)
- little pestle action, 2.35uL proK (18.35ug/uL), another 0.5mL DNAzol and O/N incubation @ RT
- followed mfr protocol for precipitation and washing then solubilized in 150uL EB Buffer (Qiagen) and spec'd (samples in June2012 gDNA box)
- spec results:

- 260/280 looks ok, but the 260/230 is quite low. The quantities are sufficient for MBD (I want to have ~7ug sheared for MBD, and 100uL max volume in Covaris tube, so I'll be ok there). Also will need some left over for the 'input v input' assay. The next step will be shearing the gDNA and also confirming design (i.e. poor before or after MBD) and total quantity needed for labeling. I don't want to use more starting material than necessary since MBD kits are limited.
3/29/13
Summary: Ev2 update - sampling 3/25/13/3/26/13
- sampled all remaining oysters day60/61 of trial: 230 total
- froze (-20C) a 60mL water sample from control tank 2
- all measurements can be found in Dropox>Lab>Mac>EE2 trail>'EE2v2 data'
- will keep track of stats performed in Evernote notebook
3/19/13-3/21/13
Summary: isolation and shipment of DNA samples from F1 of vinclozolin treated and control parents to Nanostring. 8 Samples total.
Procedure:
- isolated DNA from ~20mg of gonad tissue from 8 males (4 with vinclozolin treated parents: #3,4,20,21; 4 w/ control parents #44,45,57,58) using DNAzol following mfr instructions. Solubilized in 200uL of PCR H20.
- Did an EtOH precipitation of all 8 samples (only 1 sample had a low concentration (quant by Nanodrop), but processed all 8)
- Quant. after EtOH precipitation:

- Shipped ~10ug of each sample to Nanostring. Remaining DNA stored in Mac's July gDNA box in -20C.
3/20/13
Summary: Ev2 update
- 3/18/13 sampled 2 control animals (tank 4): 1 undetermined and 1 male by light microscopy
- 3/20/13 total degree days for this trial =1107 -> this is what I was initially targeting as 1100 degree days should be 50% mature ova (Muranaka and Lannan 1984)
- 3/20/13 samples 2 EE2 treated animals (tank 1 and tank3): 2 were female

2/1/13
Summary: sampled 1 week time-point for Ev2
Procedure:
- sampled 15 oysters from 500ng/L EE2 tx and 15 oysters from control tank (n=5/tank)
- samples taken: gonad (underside of animal), histology cross section between muscle and labial palps, and gill sample. NOTE: gonad samples are quite small. These animals were putting on glycogen (white tissue), but no gonad tubules were present. I looked at a few gonad samples under the microscope and no gametes were observed.
- measurements for this time-point were added to the original spreadsheet. See link from 1/25/13
1/31/13
Summary: shipped T=0 histology samples for Ev2 (see 1/25/13)
1/30/13
Summary: completed DNA isolation from 1/29/13 - note: going to repeat samples with less starting tissue, max amount of tissue resulted in super viscous solution that was not acceptable for downstream steps.
1/29/13
Summary: DNA isolation from male gonad tissue from the vinclozolin F1's
Procedure:
- 4 vinclozolin males (3 & 4 (10 x 11 cross), 20 & 21 (10 x 17 cross)
- 4 control males (44 & 45 (19 x 31 cross), 57 & 58 (19 x 30 cross)
- 40-50mg of tissue/1mL DNAzol/400ug proteinaseK (exception: sample 3 only 500uL DNAzol
- rotating O/N @ RT
1/25/13
Summary: initiated 'Ev2' trial, EE2 exposure
Procedure:
- prepped 10mg/mL EE2 stock solution: 0.06g in 6mL EtOH and stir at RT for 1hr
- prepped 0.02 mg/mL working stock: 10uL 10mg/mL EE2, 4990uL DI H20 (prepped control working stock 10uL EtOH, 4990 uL DI)
- treatments: 750uL working stock into 30L of water for a final concentration of 500ng/L EE2
- oysters: diploid oysters from Thorndyke bay (mixed families) spawned in Summer of 2012
- 3 replicate treatment tanks, 3 replicate control tanks: 50 oysters each (150 oysters/treatment). Tanks are 30L seawater, single pump and airstone. Starting temp 11C (recording feeding, temp change and water changes in paper notebook in wet lab)
- sampled 10 oysters at T=0 (gill, gonad, histology), size here
12/19/12
Summary: Sampled F1 generation of vinclozolin exposed oysters and control oysters
Procedure
- 2 vinclozolin treated families (male (#10) mated with 2 females(#11 & 17)) crosses: 10x11 and 10x17
- 2 control families (male (19) mated with 2 females (#30 & 31) croses 19x30 and 19x31
- sampled 15 animals from each family measured: length, width, total weight, sex determination and sampled gill and gonad (sampled kept on dry ice and stored on top shelf of the -80)
- morphometrics here: https://docs.google.com/spreadsheet/ccc?key=0AuvyLilchDgFdEozd3Z0TTVDUWtwajUwUUhvcjBBT1E
- also measured all oysters from each family on 09/26/12. Data can be found on same worksheet but "09/26/12" tab
- NOTE: on 11/16/13 most of the remaining oysters were dead (19x31 one oyster remaining, 10x17 2 oysters, 10x11 7oysters, 19 x 30 10 oysters)
10/23/12
Summary: took a few oyster samples during FISH441 lab today to have in the freezer. C.gigas gonad samples (male and female) and O.lurida samples gill and gonad. The Olys had been exposed to an acute heat shock 40C for 1hr. When sex could be determined it was written on the top of the tube. These samples are stored in the top shelf of the -80 in 'Mac's -80C' box.
9/5/12
Summary: run remaining PCR product from samples analyzed 8/29/12 on gel

same gel closer up:


8/29/12
Summary: ABI3730 run at Manchester
Procedure: 1uL of PCR product was loaded into wells containing mastermix of LIZ500 size standard and Hi-Di formamide.
Plate layout: row A: primer set 1, row B: primer set 2 etc.. through G, row H: no template; column 1: Blanks, column 3: 152M, column 5: 152H, column 7: 91M, column9: 91H, column 11: no template
8/28/12
Summary: perform pre-select and select PCR (using FAM labeled primers) for test run of MSAP on ABI sequencer
Procedure: 1) perform pre-select PCR (2 samples: 91 (control) and 152 (EE2 tx)), cycling params: 'PRESELECT' 2) dilute pre-select product, 3) select PCR using FAM labeled Eco primers, cycling parameters: 'TD/56C'. See deets here:
http://eagle.fish.washington.edu/trilobite/Sites_genefish_100112/Mac/082812%20procedure_01.jpg
8/25/12
Summary: MSAP select PCR - testing amplification after pre-select PCR using Amplitaq
Procedure:
- samples: 91H pre-select product neat, 91M pre-select product neat, 91H and M pre-select PCR products at a 1:20 dilution
- a positive control was also prepared using pre-select product from 7/27/12 (Apex mastermix)
- negative controls included 5uL of template of the blank used in the pre-select PCR and a 5uL of H20

The pre-select PCR using AmpliTaq polymerase does amplify bands even though a smear was not observed on a gel run previously (8/7/12). If you compare the banding pattern between the + control (Apex) and the Amplitaq (can only do this for the HpaII ("H") samples), it appears that most of the bands are similar, but they are of different intensities and some bands are observable using the Amplitaq that were not observed using the Apex. Because the AmpliTaq is a higher quality polymerase, I think going forward will give more reproducible results than with the Apex. There is a single band that amplified when the blank from the pre-select PCR was used as template. Oddly, the same size band was not observed in any of the samples. Possibly there was contamination after the PCR was performed and prior to running the select PCR? The select PCR blank was clean. Of note, the Hpa bands are more clear than the Msp bands for this particular primer set. The Msp lanes still show some high background.
8/21/12
Summary: MSAP pre-select PCR with Amplitaq (3.5mM MgCl)
Procedure: performed pre-select PCR using sample 91 (both H and M dig-lig). Previously (8/7/12), the pre-select PCR using Amplitaq did not show up as a smear on the gel. In order to see if amplification had occurred I needed to repeat the pre-select here and then add this product as template to the select PCR. An aliquot of PCR product was used to prepare a 1:20 dilution (in H20) and all samples were frozen at -20C.
8/7/12
Summary: run PCR products from 8/6/12 (see 'Next steps') on gel: MgCl2 titration using Amplitaq polymerase.
Results: This images shows the results of the Metaphor agarose gel (~2hr at 100V). First, I am having a really difficult time getting the comb out of the gel without breaking some of the wells (as evidenced by the overflow). Gel issues aside, the blanks are clean and amplification was observed using 3.5 mM and 4.5 mM MgCl2, but not 2.5mM MgCl2. The 3.5 mM MgCl2 lane shows the best resolution of bands and should be used going forward. The pre-select PCR's did not show an observable smear (not included in image below, loaded to right but all lanes are blank). Since I added loading dye to the entire pre-select PCR I will have to re-run to check and see if enough amplification occurred to get bands on the 2nd round of PCR. If I am able to do a test run tomorrow on the sequencer I will use the pre-select products generated 7/27/12 as template in the select PCR.

8/6/12
Summary: results of Amplitaq PCR from 8/3/12, troubleshooting Amplitaq results
Procedure:
- On 8/3/12 a test run of select (primer set 3) and pre-select PCRs were performed using Amplitaq polymerase (1.5mM MgCl2) these were run on a gel and no amplification was observed (Apex was also tested (4.5 mM MgCl2) and produced the expected banding pattern)).
- After comparing the reaction components, I noticed that the salt concentrations were different between the Apex (4.5 mM) and Amplitaq (1.5mM). For background, I originally ran the Apex mastermix with a titration of MgCl2 back in 2010 and had been using a 4.5 mM concentration since then. I decided to test the Amplitaq with the salt concentration recommended in the manufacturer's protocol, which also agreed with a few of the MSAP protocols (such as Liu and Keyte).
- In order to troubleshoot the lack of bands using the Amplitaq mastermix, I increased the salt concentration to 4.5mM MgCl and re-tested the select PCR using sample 97Hpa. I prepared mastermixes using Apex at 4.5mM MgCl2, Apex at 1.5mM MgCl2, and Amplitaq at 4.5mM MgCl2
- Results:

- Increasing the salt concentration in the Amplitaq reaction mixture from 1.5 mM to 4.5 mM MgCl2 resulted in banding similar to that of the Apex mastermix. Of note, the Amplitaq mastermix shows a reduced background. No smearing is observed >1000bp and the bands are sharper in general. The Apex mastermix resulted in banding regardless of the salt concentration, however it does appear that the lower salt concentration does improve the background. I also wanted to investigate the role of annealing temp and cycle number in this PCR. The replicates on the left were run with the TD PCR and a general anneal temp of 56 (25 total cycles of general amplification), the panel on the right the anneal temp was increased to 60C and 15 total cycles. The best resolution on this gel came from the Amplitaq polymerase at 4.5mM MgCl2 and an anneal temp of 56C for 25 cycles
https://www.dropbox.com/s/am7jlckmwqsu9ui/PCR%20080712.jpg
8/3/12
Summary: Repeat select PCR from 8/2/12 that had contamination in blank reactions. Also include a few reactions using Platinum PCR Taq since I'm not sure if the Apex mmix would be good to put on sequences since it has dye in it.
Procedure:
- prepare mmix using Apex (see MSAP protocol) for 7 reactions
- prepare mmix using Platinum Taq (Invitrogen) for 7 reactions: per rxn: 2.5uL 10x PCR buffer, 0.5uL 10mM dNTP, 0.8uL 50mM MgCl2, 0.5uL each primer, 0.1uL polymerase, 16.1uL H20 (4uL template)
- add template from sample 91 'original 7/26' pre-select PCR (@ 1:20 dilution)
- running the 56C protocol with 25 cycles (same as 8/2/12) and also the 56C protocol with 15 cycles: Each cycling parameters has a replicate of 91H and 91M in both Apex and Invitrogen Platinum and a blank
- here I noticed that the protocol for the '60C' anneal temp that was run yesterday was actually running at 56C. Noted in notebook for 8/2/12
- results:

- Blanks look good, reducing cycle number doesn't really gain anything in terms of high background. The Platinum Taq did not amplify (there is a hint of a few bands in the 91H lane for the 25cycle amplification. I think the issue here may have been the amount of dNTP in the mastermix. I think I need 10mM each, instead I used 10mM total
Amplitaq PCRs
mmix components (per reaction): 2.5uL 10x PCR buffer 2, 2uL 10mM dNTP, 0.5uL each primer (10mM), 0.125uL AmpliTaq polymerase, 0.75uL 50mM MgCl, 13.6uL H20 (25uL reactions, 5uL template).
performing a select PCR (primer pair 3) with Amplitaq - TD PCR w/ 56C anneal
performing pre-select PCR (using sample 97H and 97M) - 1 batch with TD PCR w/ 56C anneal and 1 general preselect protocol with 20cycles at 56C (see MSAP protocol for additional details on parameters).
8/2/12
Summary: Optimizing MSAP PCR reactions to reduce background, using a subset of samples from 7/31/12-8/1/12. Using a touchdown PCR protocol and 2 different annealing temps for the general amplification
Procedure:
- pre-select PCR:
- samples: used digested/ligated DNA from oysters 91 and 152 (7/26/12)
- prepared a single mastermix to run touchdown PCR w/ 2 annealing temps (4uL template, 16uL mmix (mmix prepped per MSAP protocol)
- thermalcycling parameters are below - ran both 91 and 152 samples for the 56C general anneal temp, ran only 91 for the 60C anneal temp
- "56C": 94C 2min, 10 cycles: 94C 30s, 65C 30s (dropping 1C per cycle), 72C 2min, 25 cycles: 94C 30s, 56C* 30s, 72C 2min, 60C 30min
- "60C": varied from above only by increasing anneal temp in 25cycle general amplification (marked by *) to 60C
- results of pre-select: (NOTE 8/3/12: the 60C protocol was in error - both programs ran at 56C)

- diluted all samples by adding 150uL of H20 to the remaining 10uL of PCR product (1:16 dilution)
- compared to initial pre-select PCR run 7/27/12 the smears are more visible, but there is still some banding (1 @ ~1500bp, 1 @ ~900bp)
- select PCR:
- for this test run I am using primer set 3 (wide range of sizes, lots of bands to try to resolve) - (primers: Eco_ACA, Hpa/Msp_TGA)
- prepared a single mastermix to run various pre-select PCR products (27 reactions total w/ 4uL template, 16uL mmix)
- PCR cycling parameters are the same as above, various templates were used:
- "56C" cycling parameters (12 total samples): original pre-select products 7/27/12, original pre-select products with an additional dilution (1:20 total) similar to Liu protocol, pre-select products performed today using 56C protocol (1:16 dilution)
- "60C" cycling parameters (10 total samples): same as 56C for the original pre-select products, but ran pre-select products from 60C protocol (1:16 dilution).
- results of select (NOTE 8/3/12: the 60C protocol was in error - both programs ran at 56C)

- Blanks had contamination. Difficult to say if background has been reduced. Will repeat tomorrow.
8/1/12
Summary: 1) Test run (PCR and gel separation) a few of the unlabeled MSAP primers with the samples prepared earlier this week (EE2 trial) 1) Run PCR products for testing vtg6 and DNMT primers (PCR 7/31/12) on gel.
Procedure:
- selected 2 samples: 91 and 152 to test run 3 (of 7) selective primer pairs
- master mixes for primer pairs 1,2 and 3 were prepared. see MSAP protocol for primer sequences, 40uL reactions were prepared instead of 20uL reactions in order to have enough product to run on 2 gels
- PCR setting as stated in MSAP protocol (Mac>PSTHIRTY thermocycler protocol)
- prepared a 2% metaphor Agarose gel (following mfr instructions) and a 2% Agarose gel
- ran gels for ~1hr at 70V, then ~2 hr at 100V
agarose gel:
primer tests are on the left of the gel, MSAP samples on the right. Primer test samples are (left to right): 3 independent cDNA samples from dg/gonad, gDNA, blank. MSAP samples are (left to right per primer set): 91 Hpa, 91 Msp, 152 Hpa, 152 Msp

metaphorose gel

Conclusions/Next steps:
The vtg primers did not amplify any of the cDNA samples or the gDNA. These primers have been used in Dheilly et al 2012, so I would like to try this PCR again with gonad sample from a late stage female oyster. It's possible the primers are working, but vtg is not expressed in these samples. The DNMT primers amplified the expected size product for the cDNA. The primers do amplify genomic DNA, but it is a larger band indicating these primers span at least 1 intron. The MSAP samples had higher resolution using the metaphorose. There is still a lot of 'smearing' in the lanes. This could possibly be due to background from the first pre-select PCR? In general, the range of band sizes for these primers is quite large between 2000 and 100. It would be difficult to score these bands with the resolution here. Need to find out if these samples are suitable for CE.
7/31/12
Summary: test PCR primers for C.gigas vitellogenin6 and DNMT
Procedure:
- Primer background:
- vtg6 primers (SRID: 1513,1512) based on Dheilly et al 2012
- DNMT primers (SRID: 1511,1510) designed using primer3 based on consensus sequence from 03/9/11
- Prep mastermix for each primer pair (6 reactions): 12.5uL 2xApex, 0.15uL each primer (10uM), 11.2uL H20
- Added 24uL mmix and 1uL template to PCR tube. Templates included:
- Dg/gonad cDNA prepped by Sam 3/11/11 (wells A5, B5, C5)
- gDNA (parent 17 gill sample)
- H20 blank
- Thermocycler parameters: 10min 95C, 40 cycles: 30s 95C, 30s 55C, 60s 72C, 10min 72C
7/27/12
Summary: perform pre-select PCR for MSAP procedure from 7/26/12 (oocyte DNA from EE2 treatment samples)
Procedure:
- end digest-ligation at 8:30am by adding 175uL of PCR grade H20 to reactions
- prepare PCR reactions for pre-select PCR following MSAP protocol (follow link on 7/26 for procedure). Included digest-ligation blanks (digest-ligation reaction with no template) for both HpaII and MspI enzymes as well as PCR blank
- ran 10uL of PCR product on gel and added 90uL of H20 to the remaining 10uL volume

- There was no amplification in the digest-ligation reactions for either enzyme or in the PCR blanks. I am surprised to see the presence of discreet bands in these pre-select samples. Previously, I have only observed the expected smears in the 1200 - 200bp range (e.g. 2/10/11) not discreet bands (but, I have only run pre-select products on the gel twice). I do not think these bands will negatively affect the next round of PCR. Even if these bands 'swamp out' the signal, it will not affect all primer pairs since each combination will amplify different fragments. There is the expected DNA smear observed from about 800-300bp. Although the amount of DNA was normalized in each reaction, there appears to be less PCR product in sample 152. I don't think this will affect subsequent analysis since there was observable amplification and the HpaII sample will only be direction compared to the MspI sample for 152 after selective PCR amplification.
- Next steps: order labeled primers for select PCR in order to run samples on ABI 3730.
7/26/12
Summary: Initiate MSAP for C.gigas oocyte DNA from EE2 treatment samples
Procedure:
- prepare digestion/ligation reactions for the following samples: 91,97,108 (EE2 treated, stage 3), 152 (control stage 2), 153 (control stage 3) following the MSAP protocol
- below are DNA and H20 volumes for each sample in uL

- samples in 37C H20 bath overnight
7/25/12
Summary: complete DNA isolation from 7/24/12
Procedure:
- completed DNA isolation according to DNAzol protocol, eluted samples in H20
- performed EtOH on a subset of samples with low yield (marked w/ asterisk in table below)
- the table below describes (by column): oyster ID, weight of starting tissue, concentration of gDNA, total volume, total yield in ug, required volume for 0.8ug DNA (this is the amount required for MSAP). Only the samples in bold will be used for MSAP

7/24/12
Summary: initiate DNA isolation for 9 C.gigas gamete samples from EE2 trial, 35 day time-point
Procedure:
- sample selection: Nine stripped oocyte samples total. Three 500ng/L EE2 treatment (stage 3), 3 controls (stage 3), 3 controls (stage 2). Rationale: compare treatment v control and also have ability to compare gonad dev. stages 3 v 2.
- EE2 (stage 3): 91 (R373), 97 (R554), 108 (R874)
- control (stage 3): 152 (R373), 157 (R554), 155 (R869)
- control (stage 2): 153 (R373), 159 (R554), 156 (R869)
- Thawed 1 of 2 gamete samples stored at -80C
- Weighed sample, added 500uL DNAzol and 50 pK to all samples with the exception of 153 where 1mL of DNAzol and 100pK was used.
- 91: 18.8ug
- 97: 13.3ug
- 108: 16.8ug
- 152: 16.8ug
- 153: 32.0ug
- 155: 17.9ug
- 156: 9.2ug
- 157: 9.2ug
- 159: ~12ug
- rotating tubes overnight at RT
7/23/12
Summary: staging of gonadal development of 5 week time-point females from control and 500ng/L EE2
Staged 19 female oysters (11 EE2 @ 500ng/L, 8 control) using the staging of Steele and Mulcahy 1999. All but 1 of the oysters were either stage 2 or 3 (a single control oyster was a stage 1). A number of the stage 3 oysters I would like to note with an asterisk because there was some connective tissue remaining within the gonad tissue and some of the follicles had not coalesced. Nevertheless, in terms of this staging system, I would still give them a 3.
| treatment |
individual |
stage |
| 500ng/L EE2 |
91 |
3 |
| 500ng/L EE2 |
96 |
2 |
| 500ng/L EE2 |
97 |
3* |
| 500ng/L EE2 |
98 |
3* |
| 500ng/L EE2 |
108 |
3 |
| 500ng/L EE2 |
110 |
3* |
| 500ng/L EE2 |
112 |
3* |
| 500ng/L EE2 |
115 |
3 |
| 500ng/L EE2 |
116 |
3 |
| 500ng/L EE2 |
119 |
3* |
| 500ng/L EE2 |
120 |
3* |
| control |
152 |
3 |
| control |
153 |
2 |
| control |
155 |
3* |
| control |
156 |
2 |
| control |
157 |
3 |
| control |
159 |
2 |
| control |
166 |
3 |
| control |
172 |
1 |
Statistics: Chi-square between treatment =0.2

took a few more oocyte measurements (see initial measurements 7/20/12) and confirmed that variability is huge. Oysters 152 and 166 are control oysters, all of the others are EE2 treated.

7/20/12
Summary: measurements of oocytes size in EE2 treated v. control oysters
- took 6 images at 400x magnification for each oyster (so far have done this for 13 of 19 oysters) to use for oocyte area analysis
- also have a few 100x images for staging purposes
- at 400x magnification, I can get about 5 oocyte measurements/image. I am only using free oocytes (not attached to the follicular wall) with an observable nucleus (to try to ensure oocytes are on the same plane)
- just to get a feel for the sizes I analyzed the area of 10 total oocytes between 2 images (5/image) for 5 different stage 3 oysters (3 treatment, 2 control). I used ImageJ for this analysis.
- A graph of the sizes are below. The pvalue was 0.3 between treatment and control.
- Initial observations: there is a lot of variability between individuals within treatment. This could at least partly be due to the fact that I only 2 of 6 images were used for the analysis. I observed while taking the images that different portions of the gonad seemed to differ in oocyte size and number - this was making staging more difficult too - so maybe I would get different values when I use all 6 images? This initial look at oocyte area leads me to believe that the variability in this measurement is going to be too high, especially considering the small numbers I have. One question remaining is that at least qualitatively, there appears to be some skew towards a higher stage of gonad development in the treated oysters - would it then be acceptable to pool these stages to compare oocyte area? All of the animals in this initial analysis I would characterize as being stage 3 females.
 l
l7/17/12
Summary: first attempts at measuring oocyte area using NIS elements and ImageJ
NIS Elements
- captured images of oyster 91 and 166 on the microscope in the Young lab at 200x magnification
- manually outlined the area of 10 oocytes manually using the freehand tool in NIS elements - the manual outlining felt a little biased, because the shapes were not round, the perimeter could be biased based on how many points I select as I went around the cell. I would like to try to automate this process.
- areas for the 10 measurements for oyster 91 and 166 are below (note that measurement 7 for oyster 166 is inaccurate)

ImageJ
- used captured images of oyster 91 and 166 on the microscope in the Young lab at 200x magnification
- opened images in ImageJ and made binary image of oyster 166 to facilitate automated area measurements
- used the wand tool to outline regions of interest (ROIs), I wanted to only used oocytes w/ visible nuclei so I had the original image opened side by side
- sometimes the wand tool does not pick up all the edges of the cell, so I had to go in and manually adjust the outline. To do this I select the freehand tool then hold down the option key while circling the area that I do NOT want included.
- it took about 10 minutes to get 15 ROIs highlighted, then I selected all of the RIOs and clicked on measure to get the measurements in pixels
- when I opened the image for oyster 91 it was too difficult to use the wand tool on the binary images because the contrast wasn't strong enough to pick up the cell images.
- Initially, I wanted to use 4 random images of each gonad at 200x magnification and measure ~20 oocytes per image - but because it's difficult to see the outlines, at least on oyster 91, I would like to try using a higher magnification (400 or 600x), to see if the edges are more defined.
- Here are examples of the original and binary images of oyster 91 and 166

7/12/12
Summary: measurements of oocytes using the Young Lab microscope and NIS elements software
- Measured the diameter of the oocytes. since the cells are not round, measurements are from the longest distance of the ovoid shaped oocytes. Averaged ~ 10 measurements per slides, so these measurements are only an estimate and were meant to get familiarized with the software.
- R861 oocytes 30-50um
- R554 oogonium <12um
- R818 early oocytes <15um
- R819 oocytes 40 - 60um
- R371 oogonium <10um
- R385 oocytes 40 - 55um
7/10/12
Summary: Images of day0 histology for staging.
- album of images here: http://www.flickr.com/photos/32788337@N08/sets/72157630520454332/
- slideshow and staging using Steel & Mulcahy 1999 here. I am not confident about R819 and R554 females. I think the shape of the follicles and presence of lots of hemocytes is throwing me off - will try to get another opinion. Follow up: Consensus opinion is that R819 is stage 2 and R554 is stage 1.
Images histology day0
View more PowerPoint from mgavery
7/9/12
Summary: A) Results of actual EE2 concentration in seawater on select days by GCMS; B) Day zero histology notes
Results:
(A) EE2 concentrations in tanks
500ng/L nominal Tank 1:
5/28 (fresh preparation): 350ng/L
5/30 (post-1/2 tank change): 45ng/L
6/4 (24hr post fresh dosing): 25ng/L
50ng/L nominal Tank 3:
5/28 (fresh preparation): 37.2ng/L
5/30 (post-1/2 tank change): 37.4ng/L
6/4 (24hr post fresh dosing): ~37ng/L
(B) Gonad staging of 10 oysters (1 per family) at Day zero of the trial:
NOTE: these are initial notes, looked at slides w/ C. Friedman today, but I need to decide on staging criteria and reexamine
0 - undifferentiated, 1 - very early development, 2-mid development, 3 - ripe, 4-ripe/partial spawn, 5 - reabsorption
R385 - female, stage 2-3 (mature eggs were present in folicle)
R874 - male, stage 3-4 (mature spermatazoa)
R371 - female, stage 1 (very few oocytes in lumen)
R861 - female, stage 2-3
R819 - female 3-4 (ripe)
R373 - male, stage 3-4 (mature spermatazoa)
R869 - male, stage 1-2
R554 - female, stage 5 (possibly spent, in reabsorption, lots of hemocytes)
R363 - male, stage 3-4 (mature spermatazoa)
R818 - female, stage ~2 (no oocytes in middle of follicle, but developing at edge of follicle)
7/6/12
Summary: Quick graphs of sex ratios for day 35 and 42 samples by treatment and by family. Sample sizes vary for all graphs so see raw data/previous notebook entries. Although not significantly different, there is a trend toward more females in treated groups compared to control. Family R554 is the only family that shows a majority of females (for Day 35 & 42 combined: 3/5 (females/total) for control, 3/5 for 50ng/L treatment, and 6/6 for 500ng/L treatment.)


6/21/12
Summary: Documentation of EE2 trial week 6:
The oysters remaining after the 35 day sampling will be maintained for 1 to 2 weeks in the absence of any treatment to assess whether any molecular changes (e.g. DNA methylation), if they occurred, are maintained after the EE2 treatment has been removed.
- 6/21/12 - oysters from replicate tanks were combined into a single tank (all bags from 1 of the tanks were marked with an additional white tag to denote which tank they came from: tanks 2, 4 and 5 were tagged); a complete water change was performed and oysters were fed 4mL.
- 6/22/12 - fed 4mL am and 4mL pm
- 6/23/12 - 1/2 tank water change; fed 6mL
- 6/24/12 - fed 6mL
- 6/25/12 - fed 4mL am and 4mL pm
- 6/26/12 - sampled remaining oysters (52) and determined sex on light microscope. Samples: gill, histology cross-section, gonad
6/14/12 - 6/20/12
Summary: Documentation of EE2 trial week 5:
- 6/14/12 - feed 4mL am and 4mL pm; no mortalities
- 6/15/12 - feed 2mL am and 4 mL pm; full tank water change; mortalities: 1 red tag, Tank 3 (50ng/L) - female
- 6/16/12 - feed 4mL am and 4mL pm; no mortalities
- 6/17/12 - feed 4mL am and 4mL pm; 1/2 tank water change; no mortalities
- 6/18/12 - feed 4mL am and 4mL pm; no mortalities
- 6/19/12 - feed 4mL am and 4mL pm; 1/2 tank water change; no mortalities
- 6/20/12 - Day 35 of trial. Sampled 30 oysters/treatment (15/tank); mortalities: 3 red tag Tank 5 (control), 1 red-blue tag Tank 5 (control)
- oysters were weighed and measured. all data can be found here
- the following samples were taken: gill, gonad, cross-section for histology, gametes
- gamete sampling procedure: animals were stripped of gametes from the gonad tissue (using 0.2µm filtered seawater) on the underside of the animal (this keeps most of the tissue and the gonad on the 'top' of the oyster intact). From this ~5mL sample, the oysters were sexed and two 1mL sub-aliquots were taken after larger particles had settled out. Eggs were centrifuged at 800g for 15 min and spermatazoa were centrifuged at 2500g for 20 min. After centrifugation the seawater was drawn off and the samples were snap frozen.
6/7/12 - 6/13/12
Summary: Documentation of EE2 trial week 4:
- 6/7/12 - feed 4mL am and 4mL pm; 1/2 tank water change; mortalities: 1 not tagged, Tank 1 (500ng/mL) gonad screened and mature spermatazoa obvserved, 1 yellow-green tag Tank 5 control gonad screened and mature spermatazoa observed (in both cases activated sperm were observed after the addition of a drop of seawater to gonad smear on slide)
- 6/8/12- feed 4mL am and 4mL pm; no mortalities
- 6/9/12 - full water change then feed 4mL; no mortalities
- 6/10/12 - feed 4mL am and 4mL pm; no mortalities
- 6/11/12 - feed 4 mL am and 4mL pm; 1/2 tank water change; mortalities: 1 yellow-green tag Tank 3 (50ng/L) - spermatazoa observed, but very little activity.
- 6/12/12 - feed 4mL am and 4mL pm; mortalities: none
- Attempt to thermal spawn: using 1 individual/tank (6 animals total). No oysters spawned, will try again tomorrow. Briefly, was trying to thermal spawn without food. Oysters were placed at 26C and slowly warmed to 30C. Once they were had been at that temp for an hour I added food to see if that would initiate spawning. After another 30 minutes they were all placed back at roomtemp with air to try again tomorrow. If they don't spawn tomorrow I will sample them and look at gametes under scope. Here are some notes (the first 3 digits are the time):

- 6/13/12 - feed 3mL am and 4mL pm; 1/2 tank water change; mortalities: 1 green tag Tank 3 (50ng/L) - female (eggs observed)
- Attempt 2 at thermal spawning (multi-media observations also available):
- 11:30am oysters (in either 200 or 500ml of water) were placed at 28C, over the next 20 min they were brought up to 30C
- 12:30pm no spawning has occurred, sacrificed the Tank 5 oyster to look at gamete maturation. I did a strip spawn of this animal using the 'underside' of the gonad using filtered seawater to rinse gametes into a 50mL conical. I collected about 5mL of gametes. I let the sample settle for a few minutes (there was some heavier material that settled to the bottom), then pipetted 1mL samples (2 total) off the surface of the sample. I put a sample on a slide and was happy to see a really pure egg sample. I spun the 1mL samples at 100g for 15 min, removed the supe and added 1mL 70% EtOH. I looked at the supe and it was cell-free, and the resuspended eggs were still pretty much intact. Since the oysters weren't spawning very easily, I think this is a great substitute to get 'gamete only' samples. The other nice thing is that the oyster remains attached to the cup shell, so that it stays pretty much intact and a nice histology sample can still be taken this way.
- 1:15pm remaining oysters (in their original containers) were cooled slowly in a 20C water bath
- 1:45pm oysters were placed back in heated water bath (water in containers was replaced with 25C water before placed back in 28C waterbath)
- 2:45 observed that one individual, Tank 2, had spawned. Collected 1mL sample from the 500mL of water, this individual was male. Spinning the spermatazoa sample at 100g for 15 min did not work that well, lots of spermatazoa in the supe. I did a second spin at 1000g for 15 min and this sample was 'cell-free'
- The remaining individuals were strip spawned. The quality of the samples varied depending on the size of the oyster, here I also tried strip spawning into weigh boats instead of conical tubes - even though I only have 1 example of sampling into the tube this type of sample seemed more 'pure', I think this is because some of the debris was allowed to settle out before taking the sample. This is how I would like to sample gametes next week.
- Summary of sex of individuals:
- T5 (control) - female
- T6 (control) - male
- T1 (500ng/L) - male
- T2 (500ng/L) - male
- T3 (50ng/L) - female
- T4 (50ng/L) - male
- In summary: Thermal spawning was not that successful, many of the animals had mature gametes (active spermatazoa observed in strip spawned individuals), but still only 1 out of 6 individuals spawned and this was after hours of heating and cooling. This approach will not be viable for obtaining gamete samples from oysters. However, I was pleased with the overall quality of gamete samples that could be obtained by strip spawning. I think the best way to do this is to strip spawn into a 50mL conical tube, let debris settle for a few min, the pipette 1 or 2 (probably 2 to do both RNA and DNA extractions) 1mL samples off the top. To remove the seawater from cells the samples should be spun at 100g for 15 min (may consider doing a higher speed for male samples, but even with low speed a small pellet formed so the quantity of cells should probably be sufficient for DNA extraction). Of the 7 animals assessed today 3 were female and 4 were male. No pattern was observed that indicated a treatment effect.
- Attempt 2 at thermal spawning (multi-media observations also available):
5/31/12 - 6/6/12
Summary: Documentation of EE2 trial week 3: 5/31/12- 6/6/12, cumulative mortality: 4
- 5/31/12 - feed 3.5mL am, 3mL pm, no mortality
- 6/1/12 - feed 3mL am, 3mL pm; 1/2 tank water change; no mortality
- 6/2/12 - feed 3mL am, 3mL pm; no mortality
- 6/3/12 - feed 4mL am; complete water change (fresh working stocks), water samples from Tanks 1 and 3; mortality: 1 red-blue tag Tank 3.
- 6/4/12 - feed 4mL am, 4mL pm; water samples from Tanks 1 and 3; no mortalities
- 6/5/12 - feed 4mL am, feed 4 mL pm; 1/2 tank water change; no mortalities
- 6/6/12- feed 4mL am and pm; mortalities: 1 yellow tag Tank 3 (50ng/L) - no mature gametes observed
5/24/12 - 5/30/12
Summary: Documentation of EE2 trial week 2: 5/24/12 -5/30/12 , cumulative mortality over this period=25
- 5/24/12 - brought in 275 gallons of water yesterday. The room temp had been fluctuating +/- 2 degree for the past few days and the water has seemed to stabilize it a bit. At the start of the trial the temp was set to 18C and there were 11 mortalities in the first week (doesn't appear to be treatment related). The temp was reduced to 16C to attempt to reduce the mortality, but still encourage gametogenesis. I think temp excursions of +/-2 degrees at 16C is more tolerable to the animals. Feeding: 2mL am, 3mL pm Mortalities: 1 red tag Tank 1(500ng/L EE2), 1 unbagged Tank 6 (control), 1 neon yellow tag Tank 5 (control), 1 red-blue tag Tank1 (500ng/L)*, 1 neon yellow Tank 2 (500ng/L)*, 1 orange tag Tank 2 (500ng/L)*, 1 red-blue tag Tank 5 (control)*. Histology was taken for the animals marked w/ and asterisk. red-blue tag Tank 1 had mature eggs under light microscope, red-blue Tank 5 was probably male. Photographs are here.
- 5/25/12 - feed: 3mL am, 3.5mL pm mortalities: 1 green tag Tank 1. Looked at gonad sample under microscope w/ Brent V., no mature gametes present.
- 5/26/12 - feed 3ml am, 3ml pm. mortalities: 1 red-white (red) tag, Tank 1 (500ng/L), 2 red-blue tag Tank 4 (50ng/L), 1 pink tag Tank 4 (50ng/L), changed 1/2 water
- 5/27/12 - feed 3mL am, 3mL pmmortalities: 1 green tag Tank 1 (500ng/L)*, 1 green tag Tank 4 (50ng/L), 1 yellow-green tag Tank 4 (50ng/L)* *=histo
- 5/28/12- feed 3mL am, 3mL pm, complete water change, water samples from Tank 1,3,5 mortalities (all sampled for histo): 1 green tag Tank2 (500ng/L), 1 red-blue tag Tank 2 (500ng/L), 1 yellow tag Tank 4 (50ng/L), 1 pink tag Tank 5 (control)
- 5/29/12-feed 3mL am, water sampled tank 1, 3, 5.
- 5/30/12 - feed 4mL pm (did not feed am because of sampling). Sampled 30 animal/treatment (15/tank) and sampled gill, gonad and histology cross-section. Labels and measurements here. mortalities: green tag Tank 4 (50ng/L), neon yellow Tank 3 (50ng/L), green-yellow tag Tank 2 (500ng/L), blue-red tag Tank3 (50nL/L), green-yellow tag Tank 3 (50ng/L), dark blue tag Tank 4 (50ng/L); changed 1/2 water and took water samples post-change from Tank 1 and 3
5/17/12 - 5/23/12
Summary: Documentation of EE2 trial week 1: 5/17/12 - 5/23/12, temp change from 18-19C, cumulative mortality over this period =11, no more thank 1 animal/tank/day
- 5/17/12 - 4mL algae/tank
- 5/18/12 - temp to 19C, 1/2 tank water changed, 5.5 mL algae/tank (2.5mL am, 3 mL pm), mortalities: 1 unbagged Tank 4 (50ng/mL EE2)
- 5/19/12 - 4 mL algae/tank pm
- 5/20/12 - 1/2 tank water changed, 4mL algae/tank pm
- 5/21/12 - 4mL feed (2mL am, 2mL pm), mortalities: 1 red-blue tag, Tank 6 (control); 1 orange tag, Tank 5 (control), 1 red tag, Tank 2 (500ng/L EE2), 1 yellow-green tag, Tank 1 (500ng/L)
- 5/22/12 - 5mL feed (2mL am, 3 mL pm), full water change, mortalities: 1 red tag, Tank 4 (50ng/L); 1 pink tag, Tank 3 (50ng/L); 1 yellow tag, Tank 2 (500ng/L); 50mL water samples from tanks 1 and 3 frozen at -20C for EE2 analysis
- 5/23/12 - 5mL feed (2mL am, 3mL pm), mortalities: 1 red tag, Tank 5 (control); 1 light blue tag, Tank 4 (50ng/L), Tank 3 neon yellow (50ng/L). It looked like they had cleared the 2mL from the morning so were fed 3 mL in the afternoon; 50mL water samples from tanks 1 and 3 frozen at -20 for EE2 analysis.
5/16/12
Summary: Day 0 of EE2 trial.
Procedure:
- On 5/10/12, 300 oysters were brought into the lab from Thorndyke Bay. They are Pipestem (BC) oysters, 30 each from 10 different single pair matings. Information on the individual families can be found here.
- Oysters were placed in a single container at 16C and fed daily. After 4 days (5/14/12) the temperature was raised to 18C.
- The experiment was initiated on 5/16/12 and included 1) day zero sampling, 2) preparation of EE2 stock solutions and 3) distribution of oysters into tanks.
- Day zero sampling:
- 1 oyster from each family, n=10
- oysters were measured, weighed and then shucked (see below for measurements)
- for sampling the whole body was removed gentry from the shell and a cross-section of the oyster, half-way between the muscle and the labial palps was taken for histology
- the following tissues were then sampled for DNA/RNA analysis: digestive gland, mantle, muscle, gill and stored immediately at -80C
- photographs were taken of each oyster (with the exception of R385). Three of the animals appeared to have initiated gametogenesis (white fluid was released after cross-sectioning).
- Preparation of EE2 stock solutions:
- prepared a 10mg/mL EE2 stock solution: 0.0601g in 6mL EtOH
- prepared a 1mg/mL EE2 stock solution: 0.0051g in 5mL EtOH
- stock solutions were mixed for 1 hr on a stir plate, these stock solutions should be stable >1yr.
- prepared 200x dilutions of each stock in DI water to make the working stock solutions (as well as an EtOH control): 10uL each stock or EtOH only, 4,990uL DI H20. *Working stocks will be made fresh every week
- For the 500ng/L treatment tanks, 750uL of the 0.02mg/mL working stock was added to a final volume of 30L (15,000 total ng or 500ng/L) *additions were made by adding 750uL to the final 5L of water and swirling to mix before adding to the tanks.
- For the 50ng/L treatment tanks, 750uL of the 0.002mg/mL working stock was added to a final volume of 30L (1,500 total ng or 50ng/L)
- For the control tanks, 750uL of the EtOH only working stock was added to the tanks
- original worksheets can be found here
- Distribution of oysters into tanks:
- oysters from individual families are being kept separate in small mesh bags for this experiment. for each family:
- 9 oysters from each family were placed into the 500ng/L treatment (2 replicate tanks, so 5 animals into 1 tank and 4 into the replicate tank), 9 oysters will be placed into the 50ng/L treatment (same distribution between tanks). The families are separated in small mesh bags and so are distributed by family for a total of 45 oysters per tanks (see layout -page 2)
- 8 oysters from each family were distributed between the 2 replicate control tanks
- 5 additional oysters (not separated by family) were placed into the control tank to equal 45 oysters/tanks. These additional oysters may be opened periodically to check for ripeness
- additional oysters 16 total were distributed among the tanks (not separated by family) and may also be used to check for ripeness
- families can be identified by color coding of zipties on bags, additionally a small tube was added to each bag with the family number on it.
- animals were fed (1.5mL/container)
- oysters from individual families are being kept separate in small mesh bags for this experiment. for each family:
Day zero measurements:
length and width in mm, mass in grams. original data sheet here.

Oyster bag labeling scheme:

4/10/12
Summary: summarize of results for most recent Nanostring samples 3/21/12.
This table is tracking the results of a number of the more interesting (i.e. there is evidence of methylation and/or differential methylation) sites. The most recent samples, tested 3/21/12, include additional gonad samples and larvae samples as we were interested in the differential methylation observed for the hexokinase loci (probe ID: EU342886_1129).

3/1/12
Summary: results of bisulfite sequencing for C.gigas hexokinase gene fragment for: larvae, sperm, gill and EE2 exposed gill
NOTES: see original notes from sequencing 2/21/12. The sequencing facility was contacted and had some thoughts about why the sequencing results were poor (see email here) and they re-ran the samples. A summary of the results are below:
Percent methylation is based on the results of 4 individual clones analyzed for each sample (between 2 and 6 sequencing replicates were analyzed for each clone). For the samples noted w/ an asterisk only 2 of the 4 clones were analyzed at that positions (for the other clones this position either had a SNP or deletion so that it was not a CpG site), for the EE2 exposed gill none of the clones could be analyzed at position 2. For that reason I do not have a lot of confidence in the results for position 2. For the larvae samples, a similar situation was observed for positions 3 and 4 so that only 2 of the 4 clones could be analyzed. Position 4 CpG is the site that is being analyzed in Nanostring (EU342886_1129).

In summary, I am confident in saying that this region is differentially methylated between sperm and gill (and trends point that way for larvae too). Other trends observed are that it appears that the this region has higher methylation in the larvae sample compared to the gill, and that the EE2 exposure does not appear to affect methylation in this region of the hexokinase gene - but it is important to note that the gill sample analyzed was not the 'control' for the EE2 experiment, but rather a gill sample taken at a different time. I would like to get additional clones analyzed for all 4 of these samples (especially the larvae) to have more confidence in the quantitation of these results. Comparing the results of CpG position 4 with that of Nanostring results the trends are the same (see entry 12/21/11) although quantitatively different. In summary, Nanostring results for all gill samples tested (including EE2 exposed gill) had 0% methylation, the larvae had 63% methylation and the sperm showed 30% methylation. It may be important to note that if there is a real SNP in this position (as it appears there may be from some of the larvae clones) it's possible that the %methylation result from Nanostring could be biased because the enzyme recognition site may be absent.
2/23/12
Summary: complete gDNA isolation from 2/22/12; send samples to Nanostring
Procedure:
- larvae samples looked pretty good after digestion O/N. Vortexed all samples briefly before centrifuge step. Followed DNAzol procedure including 2x washes in 75% EtOH
- solubilized samples in H20. Female gonad samples had a small pellet so solubilized in 100uL. Male gonad and larvae sampled solubilized in 100uL (larvae had been split in half so 200uL total/sample). There was still some color to the larvae pellet, so following the note in the DNAzol procedure that 'some insoluble material may remain' after solubilization I spun samples at 12k g for 10min and removed the supernatant. All samples were now clear and free of particulates.
- Combined the replicate larvae samples and Quantified all samples on the Nanodrop

- The larvae extractions worked pretty well. I think rinsing the larvae first, having sufficient DNAzol (1mL opposed to 500uL last time) and crushing the larvae w/ a pestle before digestion helped. I also think the centrifugation step at the end to remove the insoluble material helped to clean up the DNA. The concentration of the female gonad samples were a bit low for the Nanostring assay so initiated an EtOH precipitation to concentrate these samples:
- added 0.1 vols of 3M sodium acetate to 280uL of sample, mixed and then added 2.5 vols of 100% EtOH. Mixed and incubated @ -80C for 4hr. Pelleted DNA 16,000g, 15mins, 4C. Discarded supe. Washed pellet w/ 1mL 70% EtOH (2x washes). Pelleted DNA 16,000g, 5mins, 4C. Discarded supe. Resuspended pellets in a total of 30uL H20 and spec'd.
- P28 gonad female - 260.45ng/uL, P30 gonad femaile - 187.0ng/uL
- added 0.1 vols of 3M sodium acetate to 280uL of sample, mixed and then added 2.5 vols of 100% EtOH. Mixed and incubated @ -80C for 4hr. Pelleted DNA 16,000g, 15mins, 4C. Discarded supe. Washed pellet w/ 1mL 70% EtOH (2x washes). Pelleted DNA 16,000g, 5mins, 4C. Discarded supe. Resuspended pellets in a total of 30uL H20 and spec'd.
- Shipped 4 samples to Nanostring:
- larvae 4-19-11 155: 20uL @ 479.8 ng/uL
- larvae 4-19-11 159: 20uL @ 533.62 ng/uL
- P10 gonad male (vinclozolin treated): 15uL @901.9ng/uL
- P28 female: 20uL @260.45 ng/uL
2/22/12
Summary: begin gDNA isolation for C.gigas samples (gonad and larvae) to be tested in the last batch of Nanostring assays.
The goal is to get additional larvae and gonad sample to test using the Nanostring assay since we only currently have data for 1 sample of each. I will be isolating fresh DNA from the gonad samples I have from the July 2010 spawning as well as some larval samples from the hatchery (4-19-11 155 and 4-19-11 159).
Procedure:
- gonad samples: only had 2 sperm samples to choose fromm1 was 5-aza treated the other vinclozolin treated, I selected the vinclozolin treated (P10). For the female samples, I selected 2 control females with the most tissue remaining (P30 and P32). I added half of the remaining sample (<25mg) to a tube and added 1mL DNAzol and 400ug pK to incubate RT/rotating. I also used a pestle to try to break up the sperm sample.
- larvae samples. The larvae were stored in RNAlater so they were rinsed in 2x in 1mL TE (decanting between rinses) to remove the residual RNAlater. Samples were divided in half and crushed them with a pestle in 1mL of DNAzol. 400uL of pK were added and samples were incubated at RT/rotating.
- next step: will complete the isolation after incubating overnight.
2/21/12
Summary: notes from Sanger sequencing results from samples sent 2/2/12
Results: Overall the quality of the sequences were surprisingly low. I spot checked the concentration of the plasmids on the Nanodrop and they are consistent and of sufficient conc (all between 150 - 250ng/uL). There are 3 sequencing reps per clone (2F and 1 R using the M13 primers). For many of the plasmids one or 2 of the replicates had decent sequences but the third is horrible. Indicating the plasmid is ok and either the loading or the sequencing was bad? The hexokinase sequences were mediocre overall. For the Vtg plasmids there was consistent poor quality. There was only good sequence data for the 3' sperm sample (the 5' sperm and 3' and 5' EE2 sample did not have any good quality reps). Summaries for each gene are below:
Hexokinase: more clones needed but the general trend follows the Nanostring results with both gill samples showing zero methylation at the Nanostring target (3/3 clones) and at least some methylation in the larvae (1/3) and sperm (3/3) at the same site. More clones are needed to see if the trends hold true. Next steps: Submit samples for sequencing again, select final 4 samples for Nanostring analysis. At this point I would like to test a 2nd gonad sample for both sperm and ovary as well a separate C.gigas larvae sample. For the 4th sample it may be interesting to include 1 rep of the gills samples exposed to L-methionine.
Vitellogenin: only the 3' sperm sample had good sequence consensus (shown below). These sequences align w/ what I was considering the 5' region of this nested primer set (labeling problems?). Most of the CpG sites here are unmethylated. *Cytosines are blue, CpGs are marked in purple on CDS - no blue at CpG sites = no methylation* There are a small number of putative 'unconverted' cytosines (C's in non-CpG context and only 1 clone). Next steps: Submit samples for sequencing again. Right now the results are just descriptive so it would be nice to get results to compare to the methylation status of the sperm sample.

2/2/12
Summary: completed mini-preps from 2/1/12
Procedure: repeated procedure from 1/28/12
Next Step: load sequencing plate and send Vtg and hexokinase samples out for Sanger sequencing on 2/6/12
2/1/12
Summary: run gel for PCR screen of vitellogenin bisulfite clones, initiate mini-prep
Results:
0.8% agarose gel, see 1/31/12 for PCR

Most of the clones look good. The expected band size (+vector sequence (used M13 primers)) for vtg 5' is ~700bp, and vtg 3' is ~600bp.
1/31/12
Summary: cloning of C. gigas vitellogenin bisulfite treated DNA cont. from 1/30/12. Today: select colonies and PCR-screen for insert using M13 vector primers.
Procedure: repeated procedure from 1/26/12 (A)
1/30/12
Summary: initiate cloning of bisulfite treated C.gigas DNA for the (putative) last exon of Vitellogenin. Samples: EE2 exposed gill and sperm (see 1/123/12 for PCR)
Procedure: repeated procedure from 1/25/12 here. The PCR products here are from a nested bisulfite primers - see 12/6/11 for sequences
1/28/12
Summary: finish mini-prep of plasmids from 1/27/12 (hexokinase bisulfite treated 4 C.gigas samples). CLC: Started CLC jobs notes for today here
Procedure
Decanted ~1.5mL broth from each tube into microcentrifuge tube and spin max speed 1min. Remove supe. Decant an additional ~1.5 mL broth into tube, spin max 1min. Decant supe. Follow instructions for Qiagen's Qiaprep Spin Miniprep kit. NOTE: did not perform step 10 which is a wash w/ Buffer PB. Stored tubes in labeled rack in large -20C.
Next Steps: Will clone vitellogenin PCR products (see 1/13/12) next week then submit all the samples on a plate for sequencing (probably Thursday).
1/27/12
Summary: run gel for PCR screen of hexokinase bisulfite clones, initiate mini-prep
Results:
0.8% agarose gel, see 1/27/12 for PCR

PCR screen looks good for a majority of the clones. The predicted band size from the hex PCR is 503bp, plus the ~200 bp of vector (used M13 primers) gives a 700bp, which is where a majority of the clones are (using HyperladderII). Note: I was not able to load sperm clone 8 or EE2 1 (human errors) so there is nothing loaded in those lanes. I will pick 4 clones each w/ bands @ 700bp to do mini-preps.
MiniPrep:
added 5mL liquid LB broth + 50ug/mL Kan to individual tubes then used a toothpick to innoculate broth w/ the selected re-streaked colonies. tubes were placed in 37C shaking at 220rpm to incubate over night
1/26/12
Summary: A) cloning of C. gigas hexokinase bisulfite treated DNA cont. from 1/25/12. Today: select colonies and PCR-screen for insert using M13 vector primers. B) notes for de novo assembly of C.gigas fosmid reads.
Procedure:
A)
- there were white and blue colonies for each of the 4 samples. For each sample, 10 while colonies were re-streaked and PCR-screened using M13 primers. Forgot to put X-gal on the plates used for re-streaking again (ok, hopefully that will be the last time now)
- prepared mastermix (50uL reactions) with 25uL 2x Apex mmix, 0.3uL each F and R primer, 24.4uL H20
- PCR parameters
- 95C 10 min
- 40 cycles
- 95C 30 sec
- 55C 30 sec
- 72C 120 sec
- 72C 10 min
General notes: Focus on assembling 1 fosmid at a time first, ignore the paired reads, do not need to trim reads first
1. Started assembly w/ fosmid ..17. I will try to do a few assemblies with ..17 (varying parameters), before going onto other fosmids
2. de novo assembly: fosmid ..17 paired end reads. Mostly default parameters: mismatch=2, insertion=3, deletion=3, length fraction=0.5, similarity=0.8, distance: min-150, max-200 (did not check the 'guidance only' box), 'vote', 'random', minimum length of contig=100
1/25/12
Summary: initiate cloning of C. gigas hexokinase bisulfite treated DNA
Procedure:
- Sample: hexokinase 5' PCR product (see target sequence below) for 4 samples: gill, sperm, EE2 exposed gill, larvae (see 1/13/12 for PCR)
- thaw bands, transfer to ultra-DA purification tubes, spin at 5000rcf for 10 min
- warm plates to RT
- prepare cloning rxn (for each sample): 2.8uL PCR, 0.7uL salt soln, 0.7ul vector
- rxns incubated at RT for 12min, then placed on ice
- add 2uL rxn to vial of TOP10 competent cells
- incubate on ice for 20 min
- heat shocked at 42C for 30 sec, then back on ice quickly
- add 250uL RT SOC medium
- incubate tubes horizontally at 37C for 1 hr, at 200rpm
- in the meantime, added 40uL of 40mg/mL X-gal onto 7 room temp plates then dried at 37C
- after incubation spread cell broth onto 2 plates (150uL and 100uL respectively)
- incubate at 37C overnight
1/13/12
Summary: Second round PCR and band excision for bisulfite sequencing of portions of C. gigas hexokinase and Vtg genes.Continued from 1/12/12
Procedure:
- 2nd round PCR
- 1uL of PCR product from the 1st round PCR
- had 2 blanks for each reaction: 1uL of blank from 1st round (1º), and 1uL H20 (2º)
- master mix: same as above
- 4 primer pairs(SRID in parenthesis)
- Starting w/ 1st round Vtg primers:
- Cg_Vtgbs_lastout_F & Cg_Vtgbs_lastin_R(1435, 1432)
- Cg_Vtgbs_lastin_F & Cg_Vtgbs_lastout_R(1433, 1434)
- Staring w/ 1st round hexokinase primers
- Cg_hexkinBS_out_F & Cg_hexkinBS_inA_R(1443, 1440)
- Cg_hexkinBS_inB_F & Cg_hexkinBS_out_R(1439, 1442)
- Starting w/ 1st round Vtg primers:
- cycling parameters: same as 1st round PCR (see 1/12/12)
all PCR rxns run out on a 0.8% agarose gel
order of samples (left to right) for each primer set: gill E, sperm, gill EE2 exposed, larvae (control), blank 1º, blank 2º

All major bands were excised from the gel and stored @ -20 (Mac's bisulfite box). The major bands were all the expected size. This was the first time these hexokinase primers were tested. The 3' pair of these nested primers showed a faint band @ ~300bp, but the major bands still have pretty good intensity.
Conclusions/Next steps: It appears from the band sizes that the primers are working as expected. The next step is to do some cloning with a sub-set or maybe all? of these samples.
1/12/12
Summary: First round PCR for bisulfite sequencing of portions of C. gigas hexokinase and Vtg genes. The samples: gillE, gill EE2 100ng/L (3), sperm (P19), larvae (control from 5-aza experiment)
Procedure:
- 1st round PCR
- used 1uL of template and 24uL mmix composed of : 12.5uL 2x Apex, 0.3uL each 10uM primer stock and 10.9uL H20 per rxn.
- primers used: Vitellogenin: Cg_Vtgbs_lastout F & R (SRID: 1435, 1434), Hexokinase: Cg_hexkinBS_out F & R (SRID: 1443, 1442)
- 95C 4min
- 5 cycles: 95C 30seconds, 52C 90seconds, 72C 120 seconds
- 25 cycles: 95C 30seconds, 52C 90seconds, 72C 90 seconds
- 72C 4min
- 4C hold
Next Steps: Will do 2nd round PCRs tomorrow.
1/11/12
Summary: Bisulfite conversion of 8 samples C.gigas gDNA (a majority have been previously tested on the nCounter system)
Procedure
- dissolve bisulfite mix (1 tube) w/ RNAse free water (per mfr instructions)
- add DNA and H20 to a final vol of 20uL and NMT 2ug DNA PCR tubes (mfr says 0.2mL tubes, but I didn't have those)
- gill E (samples A - H isolated for Nanostring last year): 16.4uL (@121.58ng/uL), 3.6uL H20
- control larvae (from 5-aza experiment): 15.6uL (@128.02ng/uL), 4.4uL H20
- 5-aza larvae: 5.7uL (@352.9ng/uL), 14.3uL H20
- sperm (P19 gonad control): 18.4uL (@108.5ng/uL), 1.6uL H20
- ovary (P17 vinclozolin tx): 8.7uL (@230.2ng/uL), 11.3uL H20
- gill EE2 (100ng/L, rep 3): 13.0uL (153.62ng/uL), 7.0uL H20
- gill L-MET (l methionine 48h, rep d): 20uL (@ 97.99ng/uL)
- gill low pH (FISH 441 alive diploid low pH): 11.4uL (@ 175.34ng/uL), 8.6uL H20
- added bisulfite mix and DNA protection buffer (manual says DNA protect buffer should be green, it was more brown, the color still turned blue (as expected) once everything mixed)
- performed conversion in thermal cycler and cleaned up DNA per mfr's protocol. Only 1 elution was performed in a total vol of 20uL.
- spec'd samples on Roberts Lab nanodrop to estimate quantity and check quality


I used the wrong constant for gDNA, so the quant is just an estimate. The A260/320's are low for some of the samples and the yields are really variable. Just to point out, the last time I did this procedure the A280/A320 was ~3 (12/10/09) and the yields were more consistent. Next step, I am going to use some of these samples to do bisulfite sequencing of a portion of the hexokinase gene that has been assayed on the nCounter system and showed differential methylation between gill and all other tissue samples. I am going to do the bisulfite PCRs for the Vtg primers at the same time since I have them.
1/6/12
Summary: finish dot blot from 1/5/12. Oysters exposed to dietary L-methionine
Procedure:
- cont. from 1/5/12
- followed Invitrogen's Western Breeze mfr. instructions for using a nitrocellulose membrane
- prepped 1:10,000 dilution of primary 5-MeC antibody (Diagenode)
- primary antibody incubation 1 hr
- development time: no color after 12 minutes, stopped reaction after 60 minutes
- image using Sam's camera. NOTE: tried to image using Friedman lab's imager but could not get a good, focused image.

The results are inconclusive. The background is really high and there is no clear dilution effect. 60 minutes is the longest exposure time I've done with this assay, but the overall signal was so low (or background was so high) that I didn't feel comfortable stopping the exposure any earlier. If I were to repeat this assay I would probably do a larger range of dilutions (e.g. 1.5 - 0.015 ng) and do slightly longer washes.
1/5/12
Summary: initiate dot blot procedure for analyzing global methylation patterns in oysters exposed to dietary L-methionine (gill tissue)
Procedure:
- prepared stock (@25ng/uL) of gDNA from oyster gill tissue (n=4 each: control, 24hr exposed, 48hr exposed (isolated 12/28/11))
- performed spike dilution series using the 25ng/uL stoc

- samples were denatured at 100C for 10min then placed on ice
- used nylon membrane for blotting: pre-wet in 6x SSC, pulled 500uL of 6x SSC through all wells prior to loading samples
- once all the samples were pulled through the manifold the membrane was placed on pre-wet blotting paper w/ denaturation soln. for 10 min, then, similarly on neutralization soln for 5 min.
- the membrane was allowed to dry, cross-linked (120kJ/2min) and stored between blotting paper O/N
12/28/11-12/29/11
Summary: isolate gDNA from oysters+L-methionine experiment (see 12/21/11)
Procedure:
- 12/28/11: estimated ~25mg of gill tissue for 12 total oysters (4 reps each: control, treated 24h and treated 48h) added 500uL DNAzol 200ug proteinase K and incubated RT rotating O/N
- 12/29/11: completed DNA isolation following DNAzol mfr's protocol
- solubilized gDNA in 100 - 300uL EB Buffer (Qiagen) (vol. dependent on amount of buffer needed to solubilize all DNA)
- quant on Nanodrop (Young lab)

Next Steps: These samples will be analyzed for global methylation levels using the dot blot procedure.
12/21/11
Summary: A) Nanostring update, B) oysters + L-methionine, sample 48hr time-point
A) Nanostring update: results of 4 C.gigas samples sent 12/8/11 are summarized below
- Samples were also quantitated at Nanostring results in blue:
- ovary(vinclozolin): Concentration: 230.2ng/uL (20uL sent), 434.1 ng/uL
- sperm sample. Concentration 358.2ng/uL (15uL sent), 108.5 ng/uL
- larvae exposed to Vt Concentration: 268 ng/uL (18uL sent), 317.2 ng/uL
- larvae exposed to 5-azacytidine Concentration 352.9ng/uL (15uL sent), 371.8 ng/uL
- the counts for the gDNA from the Vt exposed larvae are ALL below background with the exception of 1 probe (FP001424_p_cg_6_111), interestingly this same probe had low counts for Alu 1 for the other 3 samples
- The results for the 3 additional samples were added to the working summary that was first generated 12/7/11

- additionally, 2 additional probes showed partial methylation in a single sample: FP008556_p_cg_6_5 showed 28% meth in the ovary sample, and GU207456_52397 showed 31% methylation in the sperm sample
- Interpretations: 1) it's not too surprising that the concentrations obtained by Nanostring would be a little different, by I am surprised by the large disparities in the gamete samples, 2) I am surprised by the lack of hybridization of the larve +Vt sample. Is it possible that all the DNA is bacterial? That seems a little odd. It seems unlikely that it was a sample prep issue because I assume all 4 samples were digested/run at the same time, 3) I am still interested in the differences in the hexokinase gene (EU342886_1129). The gill samples are consistently unmethylated, while the larval/gamete samples show some level of methylation. It would be interesting to design bisulfite primers around this region to confirm these findings, 4) The 5-aza treatment does not appear to have removed ALL methylation from the larvae, the results are consistent with the control larvae from this trial for the sites interrogated.
12/20/11
Summary: oysters + L-methionine, sample 24hr time-point
- see trial start 12/19/11
- fed oysters am (0.125mL/oyster)
- ~1pm, sampled 4 oysters from the L-met treatment (gill tissue sampled and stored @-80C
- replaced H20 in both tanks (added fresh L-met at 0.7g/L to treatment tank)
- fed oysters (0.125 mL/oyster)
12/19/11
Summary: Start trial with oysters + L-methionine
Procedure:
- 12 juvenile oysters total (4 controls, 8 treatment)
- 2 tanks, 3L seawater each (salinity 32 ppt, temp set in room 12C)
- to tank w/ 8 treatment oysters add 0.7g/L L-methionine (2.1g L-methionine was dissolved in 1L seawater)
- feed oysters (0.125mL/oyster algae diet)
- start time 1pm.
12/16/11
Summary: General plan for L-methionine exposure. The goal of this small trial is to induce hypermethylation in oysters by exposing them to L-methionine. Background: Administration of L-methionine induces hypermethylation of certain gene promoters in rat brains (Weaver et al 2005). But it should be noted that the effects of dietary L-methionine exposures are not that straight forward (e.g. may cause hypermethylation only in certain genes, in certain tissues at certain times, and may also result in hypomethylation (Waterland 2006)).Oysters will uptake the free amino acid L-methionine in seawater (Nell & Dunkley 1984).
- concentration of L-methionine: 0.7g/L This concentration showed highest uptake in Sidney rock oyster trials - see previous ref from Nell & Dunkley
- duration of exposure:
- in oysters: L-methionine concentration in tissues (highest concentration was found in gill) increased rapidly for 3 hours, continued to increase slightly through 18hrs then leveled off before decreasing at 24 hrs
- L-methionine itself is not a methyl-donor, but is converted into S-adenosyl-L-methionine which can donate a methyl group. I am not really clear on how long this reaction takes (in general or in an oyster).
- In the Weaver et al (2005) study, they injected L-methionine daily over the course of 7 days before sampling
- based on this limited information, I plan to expose oysters to 0.7g/L L-methionine and sample at 18 & 48hrs post-exposure
- oysters: will use 12 of the small (~1.5in length) oysters that Emma has for this experiment. (n=4 each: control, 24 hr and 48 hr)
- feeding: oysters will be fed (artificial algal diet) at the start of the trial and at every 12hr thereafter. Water will be changed (for control and 48 hr exposure) and fresh L-methionine added (for the 48 hr sampling time-point) after 24hr.
12/14/11
Summary: complete EtOH precipitation of fractions generated using the MethylMiner kit (see 12/13/11). Evaluate separation by PCR
Procedure:
- followed mfr instructions for MethylMiner Kit to complete EtOH precipitation
- solubilize in TE buffer 60uL each sample, except triplicate sample elutions were combined here w/ 60 uL total
- quant on NanoDrop

Results:
I am most interested in the R037 1000mM NaCl Eluate sample, as this is the majority of the methylated fraction of the DNA. The quantification here is likely to be inaccurate since conc. is so low. *I will still estimate recoveries, but probably am overestimating the amount of methylated fractions
Control DNA: >100% total recovery (1ug), 60% was in non-captured fraction, 40% was in methylated fractions (combined). This is generally consistent with expected results (by PCR analysis, not direct quantitation) 70% in super, 30% in captured
Sample DNA: >100% total recovery* (~6ug at the beginning ~7.8ug at the end). Here is the breakdown:
non-captured supernatant: 6.2ug (79% of DNA recovered)
1000mM eluted fraction: 1ug (13% of DNA recovered)
2000mM eluted fraction (this would be the highly methylated fraction): 0.6 ug (8% of recovered DNA)
Evaluation of recovery: The recovery was high overall compared to previous runs (see 11/2010), but the breakdown %wise of each fraction was similar.
Follow-up: PCR was performed to evaluate separation of DNA
PCR for control DNA
- prepped 10uM working stock (5uM each) of primer mix (10uL primer mix, 90uL H20) for both methylated and non-methylated control DNA
- prepped master mix for each primer mix: 6uL primer, 150uL Apex Mmix, 138uL H20 (50 uL rxn enough for 6 rxns)
- for each master mix:
- added 1uL control DNA input (0.5uL each of meth and non-meth working stocks prepared yesterday) to 'input'
- added 1uL control DNA supernatant to 'supe' tube
- added 1uL control DNA elution 1 to tube 'elute 1' tube
- added uL control DNA elution 2 to 'eluate 2' tube
- added 1uL water to 'blank' tube
- cycling parameters (from mfr protocol):
- 94 2min
- 94 15 sec
- 55 15 sec
- 68 30 sec
- repeat 2 - 4 26 times
- 68 5min
Results:
eluate 1 (1000mM NaCl fraction), eluate 2 (2000mM NaCl fraction)

Conclusions/Next Steps: Moving to San Diego, next steps buy plane tickets. Not really. The separation worked, but not as well as it has in previous 2 runs in Nov 2010. Lanes 2 and 7 are positive controls and lanes and 11 are negative controls - as expected. For the left half of the gel, the majority of the non-methylated spike is in the non-captured supe fraction (lane 3), but there was also unmethylated DNA in the 1000mM NaCl elution (lane 4). For the right half of the gel, the majority of the methylated spike was in the methylated fraction (lane 9, and a some in lane 10), but there was also amplification in the in non-captured supe (lane 8). This would NOT be an appropriate separation if the goal was to do a comparative analysis between samples. However, this separation is being used primarily as a means to get a reduced representation of the genome for performing high-throughput bisulfite sequencing, so in this case, I feel the separation is sufficient. The only outstanding issue is that the quantification of the 1000mM NaCl eluate (or methylated fraction) is likely not accurate (conc. too low, no real 'peak' observed at A260). When this sample ships to htSeq they will do QC (size distribution and quantification) on the sample before initiating library prep. If the amount of DNA is not sufficient, I think it would be appropriate to pool this fraction with the remaining fragmented DNA sent to htSeq last week (12/07/11 D)
12/13/11
Summary: complete EtOH precipitation of and perform MethylMiner procedure for R037 pooled oyster sample (initiated 12/12/11).
Procedure:
- Completed EtOH precipitation from 12/13/11. Final volume is 100uL, concentration = 113ng/uL.
- Transferred DNA to a Covaris microtube and sheared DNA using protocol from SOLiD DNA fragment library (target size 150 - 200bp)
- Due to reagent limitations could only process 6ug of DNA through the MethylMiner kit so used 53.1uL of the fragmented DNA going forward with MethylMiner procedure:
- Initial bead wash:
- sample tube: 60uL bead, 40 uL 1x B/W buffer
- control tube: 10uL bead, 90uL 1x B/W buffer
- followed mfr instructions for washing
- MBD protein diluting
- sample tube: 42uL MBD, 158 uL 1x B/W buffer
- control tube: 7uL MBD, 93uL 1x B/W buffer
- DNA preparation
- sample tube: 53.1uL gDNA in 186.9uL H20 (for final conc. of 25ng/uL) added to 100uL 5x B/W buffer and 160uL H20
- control tube: 20uL 5x B/W buffer, 20uL K562 DNA, 1uL diluted meth control, 1uL diluted non-meth control, 58uL H20
- followed mfr instructions (detailed below in steps 4 - 10 of 11/10/10 entry) for the remainder of the protocol. performed multi-step elution with a 1000mM NaCl and a 2000mM NaCl. - samples stored at -80 for EtOH precipitation
- Initial bead wash:
12/12/11
Summary: Prepare a pool of C.gigas gill DNA (35 x 51 oysters grown in SB for 10m (sampled 4/10)) to repeat MBD procedure to get sufficient gDNA to prep bisulfite treated library for Illumina sequencing.
- remake the same pool of gDNA generated 11/13/10
- first needed to re-isolate DNA from a few individuals R037 11, 12, 13 and 16.
- added ~20mg of tissue, 500uL DNAzol and 200ug pK
- rotated end over end for 5 hr at RT
- followed mfr instructions for DNAzol
- solubilized in 100 - 250uL of TE buffer (depending on size of DNA pellet)
- spec'd samples on Nanostrop

- re-spec'd the samples previously isolated that had sufficient gDNA

- pooled 1250ng of DNA from each of 8 R037 gill samples
- #02 19.1uL
- #03 46.4uL
- #06 12.9uL
- #07 13.4uL
- #11 10.1uL
- #12 25.4uL
- #13 4.3uL
- #16 12.0uL
- initiated EtOH precipitation (max volume in Covaris tube is 100uL) added 0.1 vols of 3M sodium acetate, mixed and then added 2.5 vols of 100% EtOH. Mixed and incubated @ -20C
12/9/11
Summary: ran bisulfite PCR samples from 12/08/11 on gel and excised bands
loaded 20uL of 1st and 2nd round PCRs (see 12/08/11) on 1.0% agarose EtBr gel
Results:

Bands! Bands of the correct size!!!! Ok, in summary: The first round PCR shows a faint band around 800bp as expected. The 2nd round PCRs (left to right, sample, 1st round PCR blank, 2nd round PCR blank), show nice bright band at the expected band sizes (355bp and 547bp). There are faint higher MW bands in both sample lanes. The bright bands were excised and stored immediately at -20 (Mac's bisulfite box). A couple follow up things: 1) looks like the method to determine exon/intron boundarys works pretty nicely (see NB entry 12/6/11) 2) BiSearch software did a nice job w/ primer design.
Next steps: The PCR products are ready for cloning next week.
12/8/11
Summary: A) bisulfite PCR C.gigas Vtg primers, B) EtOH precipitate gonad samples (see rationale for precipitation 12/7/11), C) send samples to Nanostring.
A) Bisulfite PCR of Cg vitellogenin (putative 3'exon See SR notebook 12/1/11)
- sample: DH02 bisulfite treated 12/10/09
- 1st round PCR
- used 1uL of template and 24uL mmix composed of : 12.5uL 2x Apex, 0.3uL each 10uM primer stock and 10.9uL H20 per rxn.
- primers used: Cg_Vtgbs_lastout F & R (SRID: 1435, 1434)
- 95C 4min
- 5 cycles: 95C 30seconds, 52C 90seconds, 72C 120 seconds
- 25 cycles: 95C 30seconds, 52C 90seconds, 72C 90 seconds
- 72C 4min
- 2nd round PCR
- 1uL of PCR product from the 1st round PCR
- had 2 blanks for each reaction: 1uL of blank from 1st round, and 1uL H20
- master mix: same as above
- 2 primer pairs(SRID in parenthesis)
- Cg_Vtgbs_lastout_F & Cg_Vtgbs_lastin_R(1435, 1432)
- Cg_Vtgbs_lastin_F & Cg_Vtgbs_lastout_R(1433, 1434)
- cycling parameters: same as 1st round PCR
B) EtOH precipitation of gonad samples originally isolated 7/19/10 and re-spec'd 12/7/11. Samples are P28 and P32 ovary samples from oysters spawned 7/01/10. These samples showed some particulate matter in them 12/7/11 and abnormal spec profiles. Briefly, added 0.1 vols of 3M sodium acetate to 280uL of sample, mixed and then added 2.5 vols of 100% EtOH. Mixed and incubated @ -80C for 1hr. Pelleted DNA 16,000g, 15mins, 4C. Discarded supe. Washed pellet w/ 1mL 70% EtOH (2x washes). Pelleted DNA 16,000g, 5mins, 4C. Discarded supe. Resuspended pellets in a total of 100uL Qiagen Buffer EB (10mM Tris-HCl) and spec'd. Profile is still abnormal. Concentrations (P28: 301.7ng/uL and P32: 223.6 ng/uL ) are likely to be inaccurate.

C) Sent 4 samples to Nanstring for analysis. Based on previous data (see summary 12/7/11), wanted to send a few additional larvae samples and also submitted a sperm and ovary sample. Spec'd all samples 12/7/11, but Nanostring will also get a concentration for these samples prior to running them.
- ovary sample, oyster exposed to vinclozolin (ID: P17 gonad, spawned 7/1/11). Concentration: 230.2ng/uL (20uL sent)
- sperm sample, control oyster (ID: P19 gonad, spawned 7/1/11). Concentration 358.2ng/uL (15uL sent)
- larvae exposed to Vibrio tubiaschii (ID "380 Vt b (8/23/10)-ETS"). Concentration: 268 ng/uL (18uL sent)
- larvae exposed to 5-azacytidine (ID experiment 6/3/10 - 6/7/10, isolation Sam White 6/8/10). Concentration 352.9ng/uL (15uL sent)
12/7/11
Summary: A) Working summary of Nanostring data, B) quantification of potential gDNA samples for Nanostring, C) EtOH precipitation of 5-aza treated larvae sample, D) Ship MBD sample to UW htSeq
A) Working summary of Nanostring data. Includes a few QC steps (1 and 2), scoring method (3), results (4 and 5) and some interpretation. The original file is in Dropbox>Lab>Mac>nanostring

B) Re-quant some older gDNA samples. I'm doing this because the sperm sample I sent to Nanostring was much lower than expected based on the original concentration (isolated 7/22/10). I want to make sure I have good samples before they get run in the assay. The idea is to analyze additional larvae samples as well as repeat a sperm sample and include an ovary sample.
Results:

Yes, something funny is going on with many of these samples. For example P2, P10 and P28 all had conc.between 100 - 300ng/uL in July 2010 (7/22/10). There were some particulates in some of these samples, I wondered if some of the DNA had precipitated out? so I gave them a good spin and re-quanted (see 2nd reads of P28 and P2), it appeared that the conc. had gone up for these second reads, but the spec profiles did not show a nice peak at 260 so I'm not sure what's going on here. I would like to try to EtOH precipitate these samples again, probably in a Tris buffer (instead of 8M NaOH pH adjusted w/ HEPES which is the DNAzol buffer).
Next Steps: I need to EtOH precipitate the 5aza tx larvae sample to get it to a higher conc. for Nanostring before I send it. There is a 'control' sperm sample that looks good for analysis (P19), the ovary sample that had a high concentration and good A260/A230 (P17) was a vinclozolin treated oyster. It could be worth analyzing this sample, but will probably want to try to EtOH precipitate the other ovary samples to get a good control.
C) EtOH precipitation of 5-aza treated larvae. Briefly, added 0.1 vols of 3M sodium acetate to 400uL of sample, mixed and then added 2 vols of 100% EtOH. Mixed and incubated @ -80C for 1hr. Pelleted DNA 16,000g, 15mins, 4C. Discarded supe. Washed pellet w/ 1mL 70% EtOH. Pelleted DNA 16,000g, 5mins, 4C. Discarded supe. Resuspended pellets in a total of 100uL Qiagen Buffer EB (10mM Tris-HCl) and spec'd.

D) Send methylation enriched gDNA to htSeq for Illumina Whole Methylome sequencing. This enriched sample was generated using the MethylMiner kit (Invitrogen). The sample is a pool of gill tissue from 35x51 oysters grown in Samish Bay (R037) for 10 months (see 11/12/10 - 11/15/10 for prep). Specifically, the 1000uM NaCl eluted fraction (methylated) is being sequenced. This same fraction was also directly sequenced (no bisulfite conversion) in March of this year (see 3/7/11 for this sample prep). I spec'd the sample (NOTE: I spec'd this sample in section A but used the wrong buffer to blank. I re-spec'd w/ TE buffer): concentration 15.2ng/ul, 260/280: 1.9, 260/230: 1.1. A total of 0.5ug was shipped on ice, O/N to UW htSeq.
12/6/11
Summary: designed bisulfite PCR primers for the last ~840 bp of Cg_Vtg (AB084783)
Procedure:
- In an effort to avoid large/multiple introns or designing a primer over an intron/exon boundary, Steven mapped assembled C.gigas genomic contigs (from resequencing efforts) to the mRNA sequence. Multiple contigs aligned w/ the mRNA sequence. For some contigs, there were multiple places that aligned to the mRNA likely indicating the presence of an intron. example:

- Targeting a putative exon, I designed nested bisulfite primers using BiSearch (This is the first time I've used this. Previously I've used MethPrimer)
- Here is the region targeted and the position of primers. The 1st round primers should amplify ~850bp, the 2nd round primers should amplify 355bp and 552bp (left to right)

11/30/11
Summary: 1) ran bisulfite PCR samples from 11/29/11, 2) completed C. gigas larvae DNA isolations initiated 11/29/11.
Bisulfite PCR:
loaded 20uL of 1st and 2nd round PCRs (see 11/29/11) on 0.8% agarose EtBr gel
Results: no bands were observed for either the first or second round PCR for both genes (estrogen receptor or vitellogenin)
Interpretation: This is not really that unexpected. The primers were designed from an mRNA sequence. It is likely that the gDNA contained introns (first round PCR was to amplify ~1500bp of each gene, the second round to amplify ~700bp of the 1st round template), and so it is possible that band sizes were too large to amplify under these conditions. Alternatively, it is possible that primers were designed across an exon/intron boundary and therefore did not bind to the genomic sequence.
gDNA isolation:
- completed DNAzol protocol according to mfr instructions. There were no visible pellets after the DNA precipitation step for any of the samples. The DNA was solubilized in 20uL of 8mM NaOH added 2uL 0.1mM HEPES to pH adjust
- quant samples on Nanodrop

Interpretation: Isolations did not go so well. Only 2 of the samples (bold above) had decent recoveries. There are a few reasons why the recoveries were poor. 1) possibly did not have enough larvae for some of the samples (see observations above), 2) larvae have tiny calcified shells, may need to crush larvae or do a more extensive pK digestions to recover DNA from a small # of larvae.
11/29/11
Summary: 1) PCR of bisulfite treated C.gigas gDNA - ER and Vtg gene. 2) Initiated DNA isolation of larval C.gigas samples
Procedure Bisulfite PCR:
- sample: DH02 bisulfite treated 12/10/09
- 1st round PCR
- used 1uL of template and 24uL mmix composed of : 12.5uL 2x Apex, 0.3uL each 10uM primer stock and 10.9uL H20 per rxn.
- 2 sets of primers used: Cg_Vtgbs_A(F&R), Cg_ERbs_A(F&R) (SRIDs Vtg: 1428, 1429; ER: 1424, 1425)
- 95C 4min
- 5 cycles: 95C 30seconds, 55C 90seconds, 72C 120 seconds
- 25 cycles: 95C 30seconds, 55C 90seconds, 72C 90 seconds
- 72C 4min
- 2nd round PCR
- 1uL of PCR product from the 1st round PCR
- had 2 blanks for each reaction: 1uL of blank from 1st round, and 1uL H20
- master mix: same as above
- 4 primer pairs(SRID in parenthesis)
- ER A(F)_B(R) (1424, 1427)
- ER B(F)_A(R) (1426, 1425)
- Vtg A(F)_B(R) (1428, 1431)
- Vtg B(F)_A(R) (1430, 1429)
- cycling parameters: same as 1st round PCR
Procedure gDNA isolation:
- samples: various larval samples from some of Emma's earlier trials for OA and OA + V. tubiaschii, the number of larvae varied for each sample from barely visible to about a half a pinky nail's worth (didn't weight them as they were in small vols of liquid). Most of the samples had been stored in RNA later, 2 had been frozen immediately at -80C *see 11/30/11 for notes on individual samples
- Added 500uL DNAzol to each sample tube (after decanting as much liquid as possible), then added 10uL pK @ 21.1 ug/uL
- Samples rotated end over end overnight.
11/1/11-11/2/11
Summary: isolate gDNA from 6 oysters (C.gigas) exposed to 100ng/L EE2 for 96hr (see 10/27/11 for experiment). Samples to be used for Nanostring study. Also included an 'alive' diploid oyster exposed to low pH (sample from integrative environmental physiology A1D)
Procedure:
- 11/1/11: added 20- 25mg of gill tissue, 500uL DNAzol and 50ug proK to tube and incubate rotating at RT O/N
- 11/2/11: completed DNAzol protocol according to mfr instructions. Solubilized DNA in 200uL of 8mM NaOH added 20uL 0.1mM HEPES to pH adjust
- quant samples on Nanodrop (used Graham's machine)

10/31/11
Summary: complete 96 hr EE2 experiment initiated 10/27/11
Procedure:
- 10/28/11 fed 1mL/tank
- 10/29/11 complete water change/re-dosing following same procedure as 10/27/11, fed 1mL/tank
- 10/20/11 fed 1mL/tank
- 10/31/11 ended experiment and sampled tissues
10/27/11
Summary: begin experiment dosing oysters with 17alpha-ethynylestradiol (EE2) at 100ng/L and 50ng/L (total duration of exposure to be 96 hours)
Procedure:
- a total of 18 oysters (3 tanks total, n=6 oysters/5 gallon tank) have been acclimating in 6L of water since 10/25/11. They were fed 1mL algae paste once/day
- today I prepared 2 dilutions of EE2 using Sam's 10mg/mL stock
- dilution A: 10uL @10mg/mL into 990uL EtOH for a final conc. of 100ng/uL
- dilution B: 200uL dilution A (@100ng/uL) into 200uL EtOH for a final conc. of 50ng/uL
- I did a complete water change on all 3 tanks adding 6L seawater/tank using a graduated cylinder
- Then I added the treatments:
- added 6uL of dilution A (100ng/uL) to 50mL of water from the tank, mixed the soln. and added back to the tank (6L total) for a final dose of 100ng/L
- added 6uL of dilution B (50ng/uL) the same way to the second tank for a final dose of 50ng/L
- added 6uL of EtOH (vehicle control) the same way to the third tank
- I added 1mL algae paste to each tank
- Treatments started at 1:30 pm
10/25/11-10/26/11
Summary: cont. from 10/24/11. Select colonies for purification, grow O/N in liquid broth, purify plasmids
Procedure:
- 10/24/11: Selected 4 colonies for each PCR product, Inoculated 5mL 1x LB + 50ug/mL of Kanamycin. Incubated O/N, 37C, 200RPM
- 10/25/11: 3mL of each culture used for mini-preps. Qiagen kit was used and mfr protocol followed. Eluted products were stored at -20C in 'Mac's Bisulfite Treated..' box
10/24/11
Summary: cont. from 10/20/11. Today: Repeat PCR-screen for insert using 1 vector primer and 1 gene specific primer
Procedure:
- PCR screened each colony for the insert using a vector primer and a gene specific primer. I am not absolutely sure which direction the PCR product gets inserted in so for each PCR product will set up 2 mastermixes: 1) M13F_gene specific reverse, 2) M13R_gene specific reverse for a total of 6 mastermixes
- I only screened a sub-set of the colonies: these ID's correspond to gel from 10/20/11:
- 1. 1-2,1-3,1-6,1-8,1-10
- 4. 4-1, 4-2, 4-5, 4-6
- 5. 5-1, 5-4, 5-6, 5-9, 5-10
- note: gene specific primers are 1. A(R), 4. B(R), 5. nest B(R)
- prepared mastermix (50uL reactions) with 25uL 2x Apex mmix, 0.3uL each F and R primer, 24.4uL H20
- PCR parameters
- 95C 10 min
- 40 cycles
- 95C 30 sec
- 55C 30 sec
- 72C 120 sec
- 72C 10 min
(HyperladderII used: top bright band-2000bp, middle - 1000bp, lower-300bp)

Summary: Yeah, still not sure what I cloned. Bands were not observed for the master mixes using the M13 reverse primers (lower half of gel (not labeled)) indicating that the inserts (what ever they are) were inserted in the 5' ->3' direction. For the PCR's using the M13 (F) primer and gene specific reverse primers multiple faint bands were observed for a majority of all 3 PCR products. The expected band size is ~1000bp for all 3 products. There is a faint band at 1000 bp for a majority of the lanes, but there are also higher MW bands as well. Some lanes show bright bands around 200bp. Since 1 insert specific primer was used, empty vector should not amplify. All in all, results are a little confusing still. In order to determine what has been cloned I will continue on with plasmid preps for 4 of the clones for each PCR product.
10/20/11
Summary: cont. from 10/19/11. Today: Repeat PCR-screen for insert using vector primers
Procedure:
- PCR screened each colony for the insert using vector primers
- prepared mastermix (50uL reactions) with 25uL 2x Apex mmix, 0.3uL each F and R primer, 24.4uL H20
- PCR parameters
- 95C 10 min
- 40 cycles
- 95C 30 sec
- 55C 30 sec
- 72C 120 sec
- 72C 10 min

Conclusions/Next Steps: The expected band size for the insert + amplified bit of vector using M13 primers would be around 1000bp for all 3 of the PCR products. None of the colonies had 1000bp bands. Empty plasmids would be around 200 bp, so it looks like there is some kind of an insert for some of the colonies (bands >300bp). I am stumped about the band >2000bp. In order to see if the desired product (or part of the desired product?) has been cloned, will re-screen colonies using 1 vector primer and 1 gene specific primer.
10/19/11
Summary: cont. from 10/18/11. Today: select colonies and PCR-screen for insert using gene specific primers
Procedure:
- a majority of the colonies were blue, but selected 10 white colonies for PCR product 1 and 5, and 7 colonies (only 7 white colonies) for PCR product 4
- PCR screened each colony for the insert using the nested gene specific primers (see primers used 10/17/11)
- prepared mastermix (50uL reactions) with 25uL 2x Apex mmix, 0.3uL each F and R primer, 24.4uL H20
- PCR parameters
- 95C 10 min
- 40 cycles
- 95C 30 sec
- 55C 30 sec
- 72C 120 sec
- 72C 10 min
10/18/11
Summary: initiate cloning of PCR products from 10/13/11 (bisulfite treated Cg_hsc70) using TOPO TA Cloning Kit
Procedure:
- thaw bands, transfer to ultra-DA purification tubes, spin at 5000rcf for 10 min
- warm plates to RT
- prepare cloning rxn (varied amount of sample added based on band intensity (>intensity, <vol.): (remaining vol of PCR product stored in Mac's bisulfite DNA box)
- PCR product "1": 4uL PCR, 1uL salt soln, 1ul vector
- "4": 1uL PCR, 0.7uL salt 1.6uL H20 0.7uL vector
- "5": 1.8uL PCR, 0.7uL salt soln, 0.8uL H20, 0.7uL vector
- rxns incubated at RT for 15min, then placed on ice
- add 2uL rxn to vial of TOP10 competent cells
- incubate on ice for ~20 min
- heat shocked at 42C for 30 sec, then back on ice quickly
- add 250uL RT SOC medium
- incubate tubes horizontally at 37C for 1 hr, at 200rpm
- in the meantime, added 40uL of 40mg/mL X-gal onto 7 room temp plates then dried at 37C
- after incubation spread 100uL of each cell broth onto plate (3 plates for product 1, 2 plates for product 4 and 5)
- incubate at 37C overnight
10/17/11
Summary: run PCR products from 10/13/11 (bisulfite treated Cg_hsc70) on gel and cut out bands
Procedure:
- load total vol (25uL) of 2nd round PCR onto 1% agarose gel
- cut out bands from 2nd round PCR of product 1, 4 and 5:
- 1. nest A (F)_A (R)
- 4. nest B (F)_B (R)
- 5. B (F)_ nest B (R)

negative controls were negative. PCR 1 gave very faint band ~650 bp, PCR 4 had bright band @ 700bp and PCR 5 gave mid-intensity band @ 800bp (these bands are the same size are previous bands (from March 2011) - The expected band sizes for all 3 are between 600 and 700bp.
Next Step: clone PCR products
10/13/11
Summary: PCR of bisulfite treated C.gigas gDNA - hsc70 gene. I am repeating what was performed back in March 2011 with a subset of the nested primer pairs because the products didn't clone the first time around. Changes from March: anneal temp dropped from 58C to 55C (58C was to high for product 'A' primers), added 2uL of template to 2nd round PCR instead of 1uL.
Procedure:
- used the same sample as previous: BB02 bisulfite treated 12/10/09
- see 3/9/11 for srID of primers
- 1st round PCR
- used 1uL of template and 24uL mmix composed of : 12.5uL 2x Apex, 0.3uL each 10uM primer stock and 10.9uL H20 per rxn.
- 2 sets of primers used: A (F_R) and B (F_B)
- cycling parameters:
- 95C 4min
- 5 cycles: 95C 30seconds, 55C 90seconds, 72C 120 seconds
- 25 cycles: 95C 30seconds, 55C 90seconds, 72C 90 seconds
- 72C 4min
- 2nd round PCR
- used 2 samples: 2uL of PCR product from the 1st round PCR
- had 2 blanks for each reaction: 2uL of blank from 1st round PCR (labeled Ba below on gel), and 2uL H20 (labeled Bb below on gel)
- master mix: same as above, but only 9.9uL H20/reaction
- 3 primer pairs (keeping numbering scheme same as 3/22/11):
- 1. nest A (F)_A (R)
- 4. nest B (F)_B (R)
- 5. B (F)_ nest B (R)
- cycling parameters: same as 1st round PCR
10/06/11
Summary: 3'/5' RACE PCR C.gigas DNMT1 cont. from 10/5/11. Nested PCR and visualization of PCR products
Procedure:
- prepared mastermix using BD Bioscience SMART RACE kit:
- H20 (34.5uL each) = 138uL
- 10x Advantage 2 PCR Buffer (5uL each) = 20uL
- dNTP (1uL each) = 4uL
- 50x Adv 2 polymerase (1uL each) = 4uL
- 2uL of primary PCR (see 10/06/11) was diluted in a total of 100uL Tricine buffer from RACE kit
- all reactions had 2.5uL diluted primary PCR, 41.5 uL mmix
- 1: 1uL NUP, 1uL NGSP1, 1.5uL H20
- 2: 1uL NUP, 2.5uL H20 (neg control)
- 3: 2.5uL H20, 1uL NGSP1 (neg control)
- followed Program 2 ( as GSP Tm = 60–70°C):
- 20 cycles:
94°C 30 sec
68°C 30 sec
72°C 3 min
Next Steps: Send the 800bp band from the 3'RACE for sequencing (early next week?). I will combine this sequence with the 1366bp already sequenced. I may be able to get additional sequence bioinformatically using some of the newly released C.gigas sequencing data.
10/5/11
Summary: 5' RACE PCR C.gigas DNMT1 cont. from 8/3/11 - retrying 5' RACE with Sam's C.gigas RACE ready cDNA
Procedure:
- prepared mastermix using BD Bioscience SMARTer RACE kit:
- H20 (34.5uL each) = 138uL
- 10x Advantage 2 PCR Buffer (5uL each) = 20uL
- dNTP (1uL each) = 4uL
- 50x Adv 2 polymerase (1uL each) = 4uL
- C.gigas 5' RACE ready cDNA prepared by Sam White was utilized
- all reactions had 2.5uL cDNA, 41.5 uL mmix
- 1: 5uL UPM, 1uL GSP1
- 2: 5uL UPM, 1uL H20 (neg control)
- 3: 5uL H20, 1uL GSP1 (neg control)
- followed Program 2 ( as GSP Tm = 60–70°C):
- 20 cycles:
94°C 30 sec
68°C 30 sec
72°C 3 min
8/3/11
Summary: 3'/5' RACE PCR C.gigas DNMT1 cont. from 8/2/11. Nested PCR and visualization of PCR products
Procedure:
- prepared mastermix using BD Bioscience SMART RACE kit:
- H20 (34.5uL each) = 379.5uL
- 10x Advantage 2 PCR Buffer (5uL each) = 55uL
- dNTP (1uL each) = 11uL
- 50x Adv 2 polymerase (1uL each) = 11uL
- 2uL of primary PCR (see 8/2/11) were diluted in a total of 100uL Tricine buffer from RACE kit
- prepared 5 reactions each for 3' and 5' cDNA
- all reactions had 5uL diluted primary PCR, 41.5 uL mmix
- 1: 1uL NUP, 1uL NGSP1, 1.5uL H20
- 2: 1uL NUP, 1uL NGSP2, 1.5uL H20
- 3: 1uL NUP, 2.5uL H20 (neg control)
- 4: 2.5uL H20, 1uL NGSP1 (neg control)
- 5: 2.5uL H20, 1uL NGSP2 (neg control)
- followed Program 2 ( as GSP Tm = 60–70°C):
- 20 cycles:
94°C 30 sec
68°C 30 sec
72°C 3 min

- Lane ID: lanes2-6 (3'RACE tubes 1 - 5 left to right), lanes 7-11 (5'RACE tubes 1 - 5 left to right)
- The negative controls were negative. The GSP2/NGSP2 primers amplified an ~ 800bp band, the 5'/GSP1 primers did not amplify
- The band in lane 3 was excised and frozen at -20C (Mac's cDNA box #2)
The excised band can be cloned and sequenced (or directly sequenced?). It is unclear whether the 5' RACE ready cDNA was not good or if the primers just didn't work. I will retry both sets of primers with Sam's C.gigas 5' RACE ready cDNA if there is a sufficient amount.
8/2/11
Summary: 3'/5' RACE PCR C.gigas DNMT1
Procedure:
- reconstituted primers (designed by SR) in TE:

- prepared mastermix using BD Bioscience SMART RACE kit:
- H20 (34.5uL each) = 379.5uL
- 10x Advantage 2 PCR Buffer (5uL each) = 55uL
- dNTP (1uL each) = 11uL
- 50x Adv 2 polymerase (1uL each) = 11uL
- C.gigas 3' and 5' RACE ready cDNA prepared by MG 2/6/09 was utilized
- prepared 5 reactions each for 3' and 5' cDNA (used both GSP1 and GSP2 with each cDNA, in case of any error in preparation of cDNA or design of primers)
- all reactions had 2.5uL cDNA, 41.5 uL mmix
- 1: 5uL UPM, 1uL GSP1
- 2: 5uL UPM, 1uL GSP2
- 3: 5uL UPM, 1uL H20 (neg control)
- 4: 5uL H20, 1uL GSP1 (neg control)
- 5: 5uL H20, 1uL GSP2 (neg control)
- followed Program 2 ( as GSP Tm = 60–70°C):
- 20 cycles:
94°C 30 sec
68°C 30 sec
72°C 3 min
*NOTE: 8/3/11. Results of gel: no bands were observed in any of the 10 lanes:

6/16/11
Summary: hsc70 (AJ305315) bisulfite sequencing analysis. PCR products 1 and 2 (see 3/22/11)
- introns and exons marked (white and gray respectively), PCR products marked in blue, CG dinucleotides marked in purple. Original sequence was 'bisulfite converted' by hand (converted all C to T with exception of those in CG dinucleotide) prior to alignment. Each bisulfite replicate is a 'consensus' of >3 replicate sequences generated from a separate clone (i.e. all pseudoreplicates have been removed)

Predictions:

Conclusions: Two exons and 2 introns have been analyzed for methylation status of individual cytosines. Only 4 CGs in introns - none are methylated . A number of CG in exons are methylated (85% in exon 4) - usually methylation status is 100% in inverts, but intermediate levels for a few. It appears like there may be some non-CG methylation (sites where 100% of clones retain C in a non-CG dinucleotide) and there is also a small degree of what looks like unconverted cytosines. Based on the predicted methylation status for individual exons, I am interested in seeing the methylation status of exon 3 which has a much higher CpGo/e than the other exons. Maybe it will be unmethylated? Maybe it's an alternatively spliced exon??
5/11/11-5/12/11
Summary: PROPS NGS data analysis summary - Gene Discovery: verifying consensus seqs from de novo mapping of reads that did NOT map back to Sigenae v8 are 'novel'; RNA-seq of novel consensus seq; annotation of RNA-seq
workflow:
- mapped 3994 consensus seq back to Sigenae v8 on CLC (to verify 'novel' sequences)
- 245 of the consensus seq mapped back (i.e. not novel - will need to look at these more closely. why didn't they hit in the first mapping?)
- 3749 of the consensus seq did not map back (i.e. novel sequences)
- analysis of 3749 novel seqs:
- NCBI blastall (blastx to swisspro database) in Inquiry - returned hits (note: evalue cutoff hits is HIGH (10)) for 3452 sequences
- narrowed this table down to a top hit for each of the 3452 sequences
- 1399 of these had evalues < 1e-5
- RNA-seq of BB3 and DH3 trimmed using the 3749 consensus seq as reference
- performed Baggerly's test on proportions
- NCBI blastall (blastx to swisspro database) in Inquiry - returned hits (note: evalue cutoff hits is HIGH (10)) for 3452 sequences
- joined tables of top hit and gene expression in Galaxy to annotate differentially expressed genes:
- BB: 33 consensus sequences with >2 fold upreg. (p<0.05 FDR corrected) and top hit evalue <1e-5
- DH: 73 sequences with >2 fold upreg. (p<0.05 FDR corrected) and top hit evalue <1e-5
5/5/11
Summary: PROPS NGS data analysis summary - Gene Discovery: annotating contigs generated from de novo assembly of unmapped reads using BB and DH_trimmed 3 as input and Sigenae v8 as reference
workflow:
- downloaded contigs (consensus sequences) of unmapped reads (Sigenae v8 as referece). Total contigs = 3995
- did a BLASTALL blastx in Inquiry
- some contigs had multiple hits so sorted the hit table first by contig then by 'score' to get a 'top hit' for each = 3664 had a top hit
- saved the results of the hit table (after joining with swiss pro titles in Galaxy) here: Dropbox>Lab>Mac>PROPS ngs>'annotations of contigs of unmapped reads using Sigenae v8 as reference.xls'
4/30/11
Summary: PROPS NGS data analysis summary for today
- CLC jobs started: de novo assembly of BB and DH, mapping of BB and DH to Sigenae v6
4/28/10
Summary: PROPS NGS data analysis summary for today
- RNA-seq: BBC v. DH (reference is Sigenae C.gigas v8)
- BBC: 8321 contigs >/= 2.00 fold increase, 176 of those had FDR corrected p-value </= 0.05 (101 if corrected w/ Bonferroni), 98 of those were annotated with 'best hit' in Sigenae database, 37 of those were annotated with go terms
- DH: 5972 contigs >/= 2.00 fold increase, 122 of those had FDR corrected p-value </= 0.05 (60 if corrected w/ Bonferroni), 75 of those were annotated with 'best hit' in Sigenae database, 25 of those were annotated with go terms
- CLC jobs started: de novo assembly of the unmapped reads (did not map to Sigenae v8)
- joined DH upregulated genes (122) to annotations in Galaxy
- join BB upregulated genes to annotation tables
- make a table of GO to GO slim and join table s for BB and DH
- NOTE: add a sequence column to v8 annotation tables before joining anything else - will make blasting easier
3/22/11
Summary: gel pieces or PCR product already extracted from gel given to SR for cloning:
labeled tubes 1 - 5:
1. gel piece: A(F)_nest A(R) - gel 3/21/11
2. already extracted: nest A int (F) & (R) - gel 3/11/11
3. already extracted: nest A (F)_A (R) - gel 3/11/11
4. already extracted: B(F)_nest B (R) - gel 3/11/11
5. gel piece: nest B (F)_B(R) - gel 3/21/11
3/21/11
Summary: 2nd round PCR of bisulfite treated C.gigas DNA to characterize methylation pattern of hsc70. Cont. from 3/18/11, 2nd round PCR and band excisions
Procedure:
- performed 2nd round PCR using PCR products from 3/18/11 as a template
- 6 total primer pairs were used, 4 w/ the 'A' template and 2 with template 'B'
- info on primer pairs and master mixes can be found here
- ran 20uL of product on a 0.8% agarose gel w/ EtBr

Expected bands were observed in the 'B' primer pairs. For the 'A' primer pairs, the results were inconsistent with previous results. The nest A(R)_A(F) band *run at 55C annealing* showed a band similar to previous (3/14/11), the A9F) nestAint(R) I had never run before, but the expected band size is ~1200 a faint band was observed @ 800. The other two primers, which previously (3/9/11) gave very intense bands at the expected size did not show any bands. Ugh. I excised the 4 visible bands and froze them immediately at -20C.
Conclusions/Next Steps: Will use A(F)_nest A (R) and B(F)_nest B(R) products for cloning. The additional bands to be used will be from the gel run 3/11/11.
3/18/11
Summary: PCR of bisulfite treated C.gigas DNA to characterize methylation pattern of hsc70. This is a follow-up to 3/9/11 in order to 1) repeat the PCRs to get fresh bands for cloning, 2) use different a Taq/cycling parameters to try to amplify the whole gene.
Procedure:
repeat 3/9/11 PCR (first round PCR) Apex mastermix
- conditions/sample same as 3/9/11 - samples at -20 after PCR
- Tried to amplify hsc70 (bisulfite treated) in two ~1400 bp products using first round amplification primers (hsc70 A (F) & A (R), and hsc70 B(F) & B(R)
- Advantage 2: mastermix prepared according to 'protocol at a glance' (except cut everything in half for 25uL reactions), using 0.2uM each primer, used 10x Advantage 2 SA PCR buffer. Cycling parameters: performed a 3 step PCR (because TM of primers too low for suggested two step PCR.
- 95C 1min, 35 cycles: 95C for 30 sec, 55C for 30 sec, 68C for 3 min, 68 C for 3 min
- Tried to amplify hsc70 (bisulfite treated) in a single product using a combination of first round amplification primers mastermix 1: hsc70 A (F) & B (R), and mastermix 2: hsc70 B(F) & A(R)
- Advantage Genomic LA: mastermix prepared according to 'protocol at a glance' using 0.2uM each primer. Cycling parameters: performed a 3 step PCR (because TM of primers too low for suggested two step PCR.
- 94C 1min, 30 cycles: 98C for 10 sec, 55C for 30 sec, 68C for 15 min, 72 C for 10 min
ran 20uL of Advantage 2 and Genomic LA samples and blanks on an agarose gel and no visible bands were observed.
Next steps:
perform nested PCR with Apex following same procedure as 3/9/11. Will run gel, cut bands and freeze immediately for cloning.
3/11/11 & 3/14/11
Summary: PCR of bisulfite treated C.gigas DNA to characterize methylation pattern of hsc70. This is a follow-up to 3/9/11 using a lower annealing temperature to try to get amplification for nested PCR pair: A (F)_nest A (R).
Procedure:
- followed the same procedure as 3/9/11. Used the same sample BB02 bisulfite treated to perform 1st PCR. The only difference was the annealing temp was dropped from 58C to 55C. Used 1 uL of the PCR product in the 2nd PCR. Also included a 'neat' BB02 bisulfite treated DNA sample and negative controls from both rounds of PCR. The primer set I was interested in was A (F)_nest A (R), but I also used nest A (F)_A (R) as a positive control primer pair because it showed good amplification in the first PCR. The only difference for the 2nd round PCR was the annealing temperature was dropped from 58C to 55C.
- ran 1st and 2nd round PCR samples on a 0.8% agarose gel w/ EtBR, using Hyperladder I

- bands in lane 3 and 7 were excised and the Ultrafree-DA columns were used to extract DNA from gel and eluate was stored in small -20 in bisulfite box
Lowering the annealing temperatures for the initial and nested PCR was sufficient for producing a band with the primer pair A(R)_nest A (F). The band is faint, but is close to the expected size of ~500bp. Lowering the annealing temp did produce a 2nd band (the lower band) in the nest A (F)_A(R) primer pair when the neat bisufltie treated DNA was used (lane6) (it is expected that lowering the annel temp may reduce specificity), but when the PCR product from the first round was used as the template (lane 7) only the expected band was visible. The next step is sequence these bands by either direct sequencing or by subcloning.
3/9/11 - 3/10/11
Summary: PCR of bisulfite treated C.gigas DNA to characterize methylation pattern of hsp70.
Background on primer design:
- tried a hemi-nested approach per the suggestion from this post on Protocols Online. One reason to use this approach is to get better specificity using a nested design, the other (and I'm not sure why) is to get longer amplicons.
- the first step was to in silico bisulfite convert the C.gigas hsp70 sequence (AJ305315)
- then designed primers to target the first half of the gene (~1500 bp) referred to as A, and the second half of the gene (~1500 bp) referred to as B (see below)

- next step was to design hemi-nested primers (and for this situation I did an internal nested pair as well) to use with the PCR product from A (see below)

- then did the same thing with the product from B (see below)

PRIMER SEQUENCES:

Procedure:
- 1st round PCR
- performed PCR with bisulfite converted DNA: BB02 bisulfite converted 12/10/09 (see notebook entry below)
- used 1uL of template and 24uL mmix composed of : 12.5uL 2x Apex, 0.3uL each 10uM primer stock and 10.9uL H20 per rxn.
- 2 sets of primers used: A (F_R) and B (F_B)
- cycling parameters:
- 95C 4min
- 5 cycles: 95C 30seconds, 58C 90seconds, 72C 120 seconds
- 25 cycles: 95C 30seconds, 58C 90seconds, 72C 90 seconds
- 72C 4min
- 2nd round PCR
- used 2 samples: 1uL of PCR product from the 1st round PCR, and 1uL of neat bisulfite converted DNA (BB02 same as above)
- had 2 blanks for each reaction: 1uL of blank from 1st round PCR (labeled Ba below on gel), and 1uL H20 (labeled Bb below on gel)
- master mix: same as above
- 5 sets of primer pairs used:
- nest A int (F_R)
- nest A (F)_A (R)
- A (F)_nest A (R)
- nest B (F)_B (R)
- B (F)_ nest B (R)
- cycling parameters: same as 1st round PCR
- ran 20uL of each reaction (including the 2st round PCR)on a 1% agarose gel


- the bands are all at the expected sizes for the nested PCR
- cut out bands from 2nd round of amplification for the 4 primer pairs that had amplification, used Ultrafree-DA column to extract DNA from gel and stored in small -20 in bisulfite box
The 2nd round PCR bands were the expected sizes, although I couldn't visually see a band from the 1st round amplification (expected at 1500ish bp product for both A and B amplicons), it appeared to have amplified since the 2nd round PCR produced a band (that is stronger than just running the neat DNA). I am not sure why the the nest A (R)_A (F) PCR didn't amplify anything, possibly reducing the annealing temp may help for this one (A (F) has a 57.2C TM).
Next step is to get this DNA onto the sequencing plate and also continue to follow up w/ Epigendx about doing pyrosequencing on these samples.
3/9/11
Summary: C.gigas DNMT1 characterization update (see primer design 10/7/10)
assembly of sequence data generated from PCR products:

Consensus Sequence (1366bp):
CGCCCCAATTTTTTTTGCTGGAGACGTACGTAACTTTGTATCGTTCAAGCGCAGCATGGTTCTGAAGCTGGCGCTGCGCTGCCTCACTACGATGGG
ATACCAGTGTACGTTTGGAGTTCTCCAGGCCGGGAGTTACGGAGTCCCGCAGACACGAAGAAGAGCCATTATACTAGCAGCAGCCCCTGGCGAAA
AGCTGCCATTTTTTCCTGAACCTCAGCATGTTTTTGCACCAAGAGCCATGCAACTCTCAGTTCAAGTCGATGATAAAAAATTTATGTCCAACATCACC
AGAATGGAGTCGGCGCCATTCCGCACAATCACAGTGAGGGACACAATGTCCGACCTCCCAGAAATCAGGAACGGGGCCAAAGCTGAGGAGATCT
CCTACCAGGGAGACCCACAGTCTCACTTCCAGAGAATCATTCGAGGCAAGCAGCACCAGCCGATTCTCAGGGACCACATATGTAAGGAGATGAGTC
CTCTAGTGGCGGCCAGAATGCAGCATATCCCTCTGGCCCCGGGCTCAGATTGGAGGGACCTTCCGAACATTGAGGTCCGTCTCTCCGATGGAACCA
AGACCAAGAAACTGCAGTACACCCATTATGACAAAAAGAACGGCAAGAGTTCGGATGGCTCCCTAAGGGGGGTATGTTCCTGTGCTGAGGGTAAGGC
GTGTGAGACGATGGACCGTCAGTTCAACACCCTGATCCCCTGGTGTCTCCCCCACACAGGAAACAGACACAACCACTGGGCCGGGCTGTACGGGCG
GCTACAGTACGACGGGTTCTTCAGCACCACTGTTACCAACCCAGAACCCATGGGGAAACAGGGAAGGGTTCTCCACCCAGAGCAGCACCGGGTGGTC
AGCGTCAGGGAGTGTGCCCGCTCCCAGGGGTTCCCCGACACCTACAGATTCTTTGGCAACATTCTGGACAAACACAGACAGATCGGTAATGCTGTTCCA
CCTCCCATGGCTCGGTTCATTGGACTGGAGATTCGAAAGTCGCTGGAATGGAAGACCGCTGATCAGCCAGACATAGAAACAGAGACAGAGGTAAAAGGTG
ATGTGAAGATGGAGGTCAAGGTTGCTGAGGGGTCACCTTGTAAGCCGGGCTCTTCCCTGAATTAACAGTTGCATGGACGTGATAAGAAACGTGAAGATTTCC
GAAATGTGAAAAAGAAGAATCTTGGATGAAATAAACCGACGATTTGGAGGAACACGCTTTCAGCCATCATATGTAATGGTGTCGCCAATGAACCTGACAAAAAT
TGAAAGTAAATTTAATCATGAGTCATTAATTAAAGTGCCGACGTTAGTACCAATCTTATGGACTGTGATAATGAAGTAGTAAGAAGGTACAAAATG
BLASTX of this 1355bp consensus sequence:

Top Hit

3/7/11
Summary: aliquoted MBD immunoprecipitated C.gigas samples for SOLiD library prep and analysis
Justification of samples: using the MethylMiner kit, I fractionated pooled C.gigas gDNA (from gill tissue) into methylated and unmethylated fractions. I performed this procedure for two different samples; the first was a pool of 35x51 oysters outplanted at Willapa Bay for 10mo. (labeled R051) on 11/10/10, the second was a similar pool of 35x51's outplanted at Samish Bay for 10mo. (labeled R037) on 11/15/10. The procedure was the same for both of these samples, and ended with 3 fractions for each library: the unbound fraction (unmethylated), the DNA fragments that eluted with 1000mM NaCl (methylated), the fragments that eluted with 2000mM NaCL (highly methylated). Most of the DNA was recovered in either the unbound fraction or the 1000mM eluated fraction. It should be noted that the control methylated DNA also eluted in the 1000mM fraction. As a first step to characterize the methylated and unmethylated fractions of the C.gigas genome, two of these samples will be submitted for SOLiD library prep and sequencing: Samish Bay unbound (unmethyated) and Samish Bay 1000mM NaCL eluate (methylated). The Samish Bay samples were chosen as they had higher 260/260 ratios than WB.
Procedure: re-quantified both of these samples on the nanodrop and aliquoted 0.5ug of fragmented DNA into a fresh tube and placed in NGS sequencing box in -80C.
- SB unmeth C.gigas (gDNA @ 30.1ng/ul, 16.6uL)
- SB meth C.gigas (gDNA @ 14.8ng/uL, 33.8uL)
2/15/11-2/16/11
Summary: MSAP cont. from 2/11/11. Repeat selective PCR and increase run time and % agarose to get better resolution of bands
Procedure:
- repeat select PCR, using gill sample isolated in DNAzol (see 2/11/11). NOTE: I should have repeated the PCRs with the mantle sample as the gill sample used an incorrect DNA conc. (0.2ug instead of 0.8ug). Didn't remember this until after samples were loaded.
- prep master mix for 5 rxns each with primer pairs 1-7: 60uL 2x Apex, 14.4uL 25mM MgCl2, 3.6uL each primer, 14.4 uL H20
- PCR conditions per MSAP procedure (Mac's 'PSTHIRTY' protocol on thermocylcer)
- prepared a 1.5% agarose gel w/ EtBr and ran at 100V. start: 10am, stop: 12:30pm

Conclusions/Next steps:
Did not gain much in the way of resolution by running a longer gel. Should also probably consider post-staining in the future. Other than 1 very bright band (top band) in MspI that is not present in HpaII (indicating a methylated CCGG), there are no other bands that show a difference in presence/absence in any of the other primer pairs. Still not a lot of resolution to speak of, so perhaps a polyacrylamide gel, or bioanalyzer or CE analysis would provide more definitive results? I need to repeat the pre-select and select PCR to test other types of visualization (Apex mastermix has loading dye that is not compatable with the other methods).
2/11/11
Summary: MSAP procedure cont. from 2/10/11: a) visualize selective PCR w/ primer pair 1 on a gel, b) select PCR with additional primer pairs
Procedure:
- ran entire volume of PCR (20ul) on 1% agarose EtBr gel at 100V

Results: Results for duplicates are consistent between samples (these are duplicate digestion-ligation reactions from DNA from the same tube). This is the first time I have seen consistent results. Since the DNAzol samples are consistent for this prep and not for previous preps, I can only assume that the 'fresh' DNA had something to with the reproducibility. I will run these samples (i.e. same pre-select PCR as the template) with additional primer pairs (e.g. primer pair 5 which I have run with 2 different oyster gill preps prior to this). To confirm that the 'fresh' DNA has an effect, I would like to repeat the digestion-ligation with this DNA as well as previously run DNA that has shown not to be reproducible.
Procedure cont. (select PCR w/ additional primer pairs)
- prep master mix for 5 rxns each with primer pairs 1,2,3, 4 & 5: 60uL 2x Apex, 14.4uL 25mM MgCl2, 3.6uL each primer, 14.4 uL H20
- sample: I chose to use the DNAzol mantle sample for this PCR because I have the most comparative data w/ DNAzol extracted samples, and the mantle tissue actually had the correct amount of DNA in the digestion-ligation reaction (0.8ug)
- PCR conditions per MSAP procedure (Mac's 'PSTHIRTY' protocol on thermocylcer)

Conclusions/Next Steps:
Reproducibility success! These data seem to suggest that using freshly isolated DNA is the key, however, it should be noted that previous attempts with this protocol have only used two tissue samples, one from gill (with two independent DNA isolations from that sample) the oter from gonad. The gill tissue had been stored in RNA later prior to isolation and the DNA had been stored for >2 months before the digestion-ligation occurred. The gonad tissue had been stored on ice for ~8 hours then placed at -80 prior to isolation. Two things to do going forward: The first is to run all 7 primer pairs on a large, high % agarose gel to try to get the most separation between the bands. A number of the primer sets don't appear to have noticeable differences in the bands between the Hpa and Msp digests. Would like to get more resolution to be able to determine if this is in fact the case and also decide if agarose gels will allow enough resolution to score the 'epigenotype' (versus needing to run a polyacrylamide gel or CE). Additionally, I would like to use MSAP to analyze tissues that I already have either frozen (some, but not all in RNAlater) or stored in ethanol. It would be really nice to get data from these samples so I think it's worth it to do a trial run with these different types of tissue storage.
2/10/11
Summary: MSAP procedure continued from 2/9/11, specifically pre-select PCR and gDNA evaluation from 2/8/11
*IMPT NOTE!*
The amount of DNA that went into each digestion-ligation reaction on 2/9/11, the same reactions that were used in the pre-select PCR today was miscalculated. This error does not affect the mantle samples (still 0.8ug in each reaction), however, for the gill samples 2.6ug of the Qiagen extracted gill B was added and 0.2ug of the DNAzol gill B was added. This could certainly have an effect on enzyme efficiency, especially for the Qiagen sample, I am less worried about the impact of excess enzyme in the DNAzol sample.
Procedure:
- digestion-ligation reactions were stopped by adding 175uL H20 at 9am
- performed pre-select PCR on all 16 samples
- mastermix (for 18 rxns): 180uL 2xApex, 43.2uL 25mM MgCl2, 10.8uL Eco preselect primer, 10.8uL Hpa/Msp pre-select primer, 43.2uL H20
- PCR conditions per MSAP procedure (Mac's 'PSTHIRTY' protocol on thermocylcer)

- ran a subset of samples out on a gel (see results below), diluted all samples 1:5.5 (per MSAP procedure) *NOTE!*: consistent with screwing up everything today, I also added 135uL of H20 to the bottom, left well (Dzol gill M) instead of 90uL
- select PCR with primer pair 1 (rationale for primer pair 1: Caroline said it was the most consistent primer set from her work so far):
- mastermix (for 18 rxns): 180uL 2xApex, 43.2uL 25mM MgCl2, 10.8uL EACH primer, 43.2uL H20
- PCR conditions per MSAP procedure (Mac's 'PSTHIRTY' protocol on thermocylcer)
gDNA isolation evaluation (left) The gel below is a 1% agarose/EtBr gel w/ 1ug of DNA loaded per lane. Qiagen extractions are in lane 2,3 & 7, DNAzol extractions are lanes 4,5 &6. Two gills samples were isolated with each procedure (gill A (ga) and gill B (gb)) and one mantle sample (m) was isolated. pre-select PCR (right): Qiagen (Q) and DNAzol (D) isolated gDNA from gill (g) and mantle (m) either Eco/HpaII digested (H) or Eco/MspI digested (M).


In general, the DNAzol extracted samples show less degradation than the Qiagen extracted samples (or possibly Qiagen kit is better at pulling over the smaller sized fragments?). This needs to be taken into consideration along with the fact that the DNAzol also showed some type of carryover (as evidenced by A230 abs. maybe EtOH? DNAzol solution?). Can't tell much from the pre-select PCR other than the negative is clean and the digestion/ligation/PCR seemed to work.
2/9/11
Summary: complete gDNA isolations (Qiagen DNeasy kit & DNAzol) from 2/8/11 and digestion-ligation
Procedure:
gDNA isolations:
- complete isolations from 2/8/11 following mfr protocol
- Qiagen: final elution volume in AE buffer was 100uL
- DNAzol: solubilized with 8M NaOH (200uL for gill A, 300uL for gill B and mantle), then added 20uL 0.1M HEPES to gill A and 30uL 0.1M HEPES to gill B and mantle to pH adjust.
- Results:


*NOTE: forgot to adjust constant for dsDNA (defaults to 40)
Results:
DNAzol:
gill A: 61.05 ng/uL
gill B: 121.95 ng/uL
mantle: 141.5 ng/uL
Qiagen:
gill A: 547.15 ng/uL
gill B: 394.15 ng/uL
mantle: 146.7 ng/uL
Thoughts: Nothing can be said about yield here because I didn't normalize by weight. But both the A260/A280 and A260/A320 ratios are higher with the Qiagen kit. There is some carryover from the DNAzol procedure that is causing absorbance at 230nm. I will run the gDNA out on a gel w/ the pre-select PCR to get a better feel for the quality of the extraction.
digestion-ligation:
- performed digestion ligation per MSAP procedurefor:
- Qiagen extracted: gill B and mantle in duplicate
- DNAzol extracted: gill B and mantle in duplicate
- incubated at 37 @ 4pm.
2/8/11
Summary: initiate gDNA isolations from fresh oyster gill and mantle using Qiagen DNeasy kit and DNAzol. Purpose is to evaluate the Qiagen extraction procedure for use in MSAP. So far I have only tried MSAP w/ gDNA isolated using DNAzol and the results have not been reproducible.
Procedure:
- sampled gill and mantle from a Pacific oyster - gill was sampled in duplicate and mantle only 1 for each type of isolation (6 samples total)
- placed ~30uL of tissue (weight was not normalized between samples) in tube
- followed mfr protocols for each extraction method
- Qiagen: add 180uL ATL buffer and 20uL pK to tube and incubate at 56C overnight
- DNAzol: add 500uL DNAzol and 20uL pK to tube and incubate on rotator (end over end) at RT overnight
2/2/11
Summary: MSAP continued from 1/31/11, agarose gel analysis
Procedure:
- run select PCR (primer pair 5) on 1% EtBr gel
- also included one of Caroline's gDNA samples (0.5ug of Juv 4). her replicate samples show great reproducibility so I wanted to compare her starting material to that of oysters (NOTE: her extractions are using the DNeasy columns, oyster DNA extracted using DNAzol)

Conclusions/Next Steps:
- First, I was surprised to the see the apparent degradation in the salmon gDNA considering the good reproducibility seen from this samples (see Caroline's notebook). If the problem w/ the reproducibility in the oyster sample was due to degradation of the sample, I would expect to see a nice, tight gDNA band in a more reproducible sample. This does not seem to be the case. However, since these samples were extracted with different methods and thus end up in different buffers, it's possible that the final diluent from the DNAzol is somehow impacting the specificity of the enzyme? I have no idea how likely this is. In the initial 25ul reaction only 3 - 6ish of those uL's are DNA diluent.
- The results for these samples seems to indicate that the irreproducible results seen previously are not a result of using degraded gDNA. The gonad sample tested looked relatively undegraded and the banding pattern is still different between samples taken from the same tube.
- Finally, the bands here to not appear as crisp as in the previous gel run 12/16/10 (see a copy of image below). The only difference I noted between the 2 gels was that this gel was run at 60V and the previous gel was run at 100V (the sizes of the gels were different too, so I let the first one, which was bigger, run longer).

1/31/11
Summary: MSAP continued from 1/27/11, selective PCR
Procedure:
- followed MSAP procedure for select PCR NOTE: only used primer pair 5, wanted to look at reproducibility first before I ran all primer sets
1/27/11
Summary: MSAP continued from 1/26/11, pre-select PCR
Procedure:
- followed MSAP procedure for diluting samples and pre-select PCR (NOTE: did not run pre-select on gel)
1/26/11
Summary: run C.gigas gDNA on agarose gel to determine quality of starting material for MSAP digests performed 1/25/11. NOTE: digests performed by Caroline, samples were prepared in duplicate for each digestion-ligation reaction. Samples: A) parent 2 gonad (male) extracted 7/20/10, B) R037-08 April 2010 gill extracted: 11/13/10 (this DNA is from a different sample than the one used in previous MSAP trials (previous samples were extracted in Jun2010 by Sam)
Procedure:
- 0.5 ug of gDNA used in the 1/25/11 digestion-ligation samples was loaded, 0.25ug the gDNA from the previous MSAP trials (RO37-08 April2010, extracted Jun2010 by sam) was run loaded as a comparison (could not load more than 250ng due to conc. of gDNA)
- NOTE: DNAzol was used for the gDNA extration from all of these samples

Conclusion:
The parent 2 gonad sample looked somewhat degraded (a bit of a smear below the highest band). This sample was chosen because the gel from the original extraction showed little to no degradation. There was no band for the R037-08 April 2010 11/13/10 extracted sample. Maybe this is due to sample prep, or possibly the DNA is really degraded. The R037-08 April 2010 extracted Jun2010 showed some degradation as well, less sample was loaded here, so it's difficult to see for sure. Since I can't really say what happened with the R037 11/13/10 gDNA I am going to run the pre-select PCR for all 4 digestion-ligation samples and take a look at that on a gel.
12/16/10
Summary: MSAP select PCR
Procedure:
- first things first, found one of the replicate HpaII/EcoRI PCR tubes in the microfuge - initiated pre-select PCR for this lingerer
- with the remaining 6 pre-select PCR rxns (3 Msp, 2 Hpa, 1 Blank) addded 90uL H20 for a total vol of 110uL
- prepared mastermixes for the 7 selective PCR primer pairs from (Liu et al 2008): 20uL total/rxn, prep for 7 reactions per primer pair, 16uL mmix and 4uL diluted pre-select PCR product): 70uL 2x Apex, 16.8uL MgCl2, 4.2uL each 10uM working stock of EcoRI and H/M pre-select primer, 16.8uL H20)
- cycling parameters:72C for 2 min followed by 30 cycles of: 94C 30s, 56C 30s, 72C 2min w/ a final extension of 60C for 30min.
NOTE: Of the 3 MspI/EcoRI digests 2 are 'fresh' from 12/15/10, the 3rd is the pre-select PCR product stock from 12/9/10.


Conclusions/Next Steps:
Currently, this method is not very reproducible. Triplicate Msp digests show strikingly different banding patterns. The first 2 lanes of Msp digests for each primer pair were performed at the same time, the third was performed earlier (12/9/10). These digests should look the same regardless of methylation pattern (all CCGG will cut). The HpaII digests, which could potentially show a different banding pattern between preps of the same tissue sample if the methylation patterns were different also look very different between the two digests performed from the same time (I don't really feel like the differences are due to diff in methylation since the reps are from the same DNA prep). These results could be due to either (or both): 1) incomplete digestion by the enzymes, which could be remedied by adding more enzyme or by spiking in additional enzyme later in the digest or 2) star activity due to non-specific cutting. I will look at these enzymes more to see how likely this second option is.
12/15/10
Summary: pre-select PCR w/ restriction-ligation samples prepped 12/14/10
Procedure:
- stopped restriction-digestion reactions from 12/14/10 w/ heat (HpaII/EcoRI @ 65C and MspI/EcoRI @ 80C both for 20min then kept on ice)
- diluted an aliquot of HpaII/EcoRI digests (3) and MspI/EcoRI digests (2) 1:8: 5uL restriction-ligation reaction, 35uL H20
- master mix prep (20uL total/rxn, prep for 7 reactions, 16uL mmix and 4uL 1:8 diluted restriction ligation per rxn): 70uL 2x Apex, 16.8uL MgCl2, 4.2uL each 10uM working stock of EcoRI and H/M pre-select primer, 16.8uL H20)
- cycling parameters:72C for 2 min followed by 30 cycles of: 94C 30s, 56C 30s, 72C 2min w/ a final extension of 60C for 30min.
12/14/10
Summary: restriction-ligation for MSAP analysis R037-08 (replicate samples) MspI and HpaII digests
Procedure:
NOTE: typo, adapters are at 40pm/uL and 4pm/uL (not nm) respectively

incubated at 37C ON
12/09/10-12/12/10
Summary: MSAP troublehsooting: 1) cont. pre-select PCR with restriction-digestion ligations from 12/2/10 (performed w/ fresh T4ligase and buffer), 2) selective PCR w/ 1U T4 ligase (neat and diluted)
Procedure:
- rationale for PCRs performed, sample ID and mmix prep can be found here
- ran 10uL of all samples on 1% agarose gel
lane 1) Hyperladder I , sample ID: 1U = 1U T4ligase, 0.6U = 0.06U T4ligase, dil1=1:8 dilution of 1U ligase, dil.6 = 1:8 dilution of 0.06U ligase

Conclusions/Next Steps:
The sample from the original restriction ligation is shown in lane 6. The Apex master mix (in contrast to the last troubleshooting run) showed fantastic amplification using 1U of T4 ligase both neat and after a 1:8 dilution in water. I am not sure why the Amplitaq mastermix did not work with the 1U of ligase, but for the next step I will use the product from the neat Apex mastermix to perform the selective PCR with the 7 primer sets.
...CONT.:
selective PCR:
perform PCR w/ 4 selective primer sets using the product from the pre-select PCR for the Apex Mmix using 1U T4 ligase and the 1U T4 ligase diluted 1:8 (lanes 8 and 10 from above gel)
- dilute remaining 10uL of product w/ 90uL of H20 (this is conservative - the protocol from Liu 2001 dilutes w/ 150-200uL, but I figured I could always go back and dilute more)
- prepare master mixes for primer pairs 1, 2, 4, and 5 using Apex master mix w/ added MgCl2 (final conc. 4.5mM)
- prepared each mastermix for 4 rxns: 40uL 2x Apex, 9.6uL MgCL2 25mM, 2.4uL 10uM stock Eco primer, 2.4uL 10uM stock H/M primer, 9.6uL H20
- for ID of primer see spreadsheet linked in 12/6/10 entry
- PCR cycling parameters: 72C for 2 min followed by 30 cycles of: 94C 30s, 56C 30s, 72C 2min w/ a final extension of 60C for 30min.

Conclusions/Next steps:
It appears that we have a protocol ready to go. Using more ligase (1U/restriction-ligation reaction) produced lots of amplification in the expected range during the pre-select PCR. The banding pattern on the selective PCR was dependent on whether or not the restriction-ligation sample was diluted before the pre-select PCR, with the diluted sample showing more distinct banding (diluting is consistent with the protocol from Liu et al 2001). Going forward, will need to run both digest-ligation conditions (i.e.: EcoRI/MspI and EcoRI/HpaII) and do multiple restriction-ligations for the same sample to evaluate reproducibility. THEN, can take a look between experimental samples). This digest (EcoRI/MspI) was using gill tissue from 35x51 hybrids outplanted at SB for 10months.
12/07/10
Summary: complete C.gigas gDNA isolations from 12/06/10
Procedure:
some tissue was still visible in the tubes, spin 10k g for 10min at 4C, decant soln. into a clean tube and precipitate w/ 250uL 100% EtOH. Mix by inversion and let sit 3 min. Spin 5000g for 5 min at 5C. Discard liquid wash 2x w/ 800uL 75%EtOH (spin 2 min @ 1000g between washes), solubilize in 300uL 8M NaOH, add 30uL 0.1M HEPES to target pH 8.
quant:

Pooled replicates D and B together to get 50ug for Nanostring. Total vol was 642 uL, with a conc. of 78.9ng/uL, A260/A280 of 1.8 and A260/A230 of 1.2.
12/06/10
Summary: qPCR MSAP, gDNA extraction from oyster gill (for Nanostring, targeting 50ug of DNA from the same tissue sample)
qPCR:
From the smears on the gel 12/3/10, it is unclear what is amplifying (some blank lanes appear to have smears) and why, if there are PCR products, why no bands are observed (e.g. not enough resolution on the agarose gel?) Will run qPCR to see if there is amplification (via florescence) and see what the melt curves look like
- selected 4 primer sets (1,3,4,5) to run on qPCR. Ran the Amplitaq 4.5mM MgCl2 20 cycle samples, as well as the 30 cycle sample. Prepped in duplicate to run on Friedman and Roberts lab qPCR machine. See prep here.
- added 30ug of gill tissue, 500uL DNAzol and 20uL proteinase K to 1.7mL tube and incubated at RT rotating end-over-end.
The results here are inconclusive. While the run on the Roberts lab showed increased florescence at cycle 2, the blanks also showed increase in florescence around cycle 20. The Friedman lab results showed less amplification all around, but the blanks also showed increase in florescence. For both runs, the melt curves were a bit ambiguous.
12/03/10
Summary: MSAP selective PCR w/ 7 primer pairs. Run digested DNA from restriction-ligation troubleshooting on agarose gel
Procedure:

Results:
Lane ID: 1) Hyperladder I, 2-4) primer pair 1: blank, 20 cycle, 30 cycle, 5-7) primer pair 2: blank, 20 cycle, 30 cycle...and so on through primer pair 7

12/2/10
Summary: troubleshoot MSAP from 11/30/10-12/01/10, specifically PCR conditions as well as restriction-ligation rxns.
Procedure:
PCR troubleshooting:
variables to troubleshoot: 1) MgCl concentration (can't tell this from Liu et al 2001), 2) Taq efficiency (try a different enzyme), 3) # of cycles insufficient (try increase to 30)
- prepared 8 mastermixes: 4 using Apex mmix, 4 using Amplitaq (ABI) w/ associated PCR buffer and dNTP conc. per Liu et al
- within a 'type' of Taq there were 4 conc. of MgCl2 1.5, 2.5, 3.5 and 4.5mM
- mastermixes were prepared for 3 total reactions: 1 for 20cycles (0.5mL tubes), 1 for 30 cycles (0.2mL tubes), an additional blank rxn was prepared for the 4.5 mM MgCl mmix
- cycling parameters were the same as those 12/1/10 (with the exception of 10 extra cycles for half samples)
- the same sample was used for all parent 11 gonad digested w/ MspI/EcoRI
- specific information for preps can be found in this Excel spreadsheet on the PCR troubleshooting tab
variables to troubleshoot: the digest, the conditions of the digest-ligation, age of ligase, concentration of ligase
- prepared 5 reactions. two were digests only (no ligase), two were digest-restriction
- rationale: 1. digest only w/ NEB buffer 4 (recommended for MspI/Eco double digest) to check pattern of cutting, prepped two of these to possibly go forward w/ a ligation if need to do it separated. 2. digest in 'restriction-ligation' conditions to see if the working buffer conditions affect the enzyme cutting 3. repeat the restriction-ligation from11/30/10 w/ a fresh enzyme 4. the amount of ligase given in the paper is tiny (0.06U), so do 1 prep increasing the amount of ligase to 1U.
- actual prep and dilution information can be found in the same Excel sheet linked above, but on the digestion-ligation troubleshooting worksheet *NOTE*: typo, adapters are at 40pm/uL and 4pm/uL respectively.
PCR/restriction-ligation troubleshooting:

PCR: the Apex mmix did not show any amplification at at MgCl concentration. The Amplitaq preps appear to work at the high MgCl2 concentrations (3.5 and 4.5mM) with 30 cycles (possibly a little amplification at 20 cycles). The size distribution of the smear after PCR is similar to the restriction digest only samples (lane 12 of top and bottom) as expected since adapters are small.
restriction-ligation: the digests appear to be working, there is more cutting in the NEB recommended conditions (lane 12 top row), compared to digesting in the T4 ligase buffer (lane 12 bottom row). Going forward, I have a 2nd prep of the digest in NEB conditions that I can ligate. Maybe EtOH precipitate first to get rid of salts before ligating?
12/1/10
Summary: PCR of restriction-ligation samples (prepared by Sam 11/30/10) for MSAP
Procedure:
following procedure of Liu et al 2001
- added 175uL H20 to each digestion-ligation reaction (10 total)
- prepared mastermix using pre-selective primers for EcoRI and HpaII/MspI:
- each rxn contained 4uL sample 0.3uM each primer (EcoRI pre-select, H/M pre-select), 1x Apex Mmix, and H20 to 20uL
- prepped mmix for 11 rxns: 52.8uL H20, 6.6uL each primer, 110uL 2x Apex mmix
- cycling parameters: 72C for 2 min followed by 20 cycles of: 94C 30s, 56C 30s, 72C 2min w/ a final extension of 60C for 30min.
- run 10uL on 1.5% agarose gel (expect a smear between 150 - 1000bp)

Conclusions: Not what I expected. No amplification of any fragment sizes in any of the samples. Potential causes: 1) ligation did not work (the pre-selective primers will only bind to adapter sequence), or 2) the PCR did not work. If the problem is with the ligation it could be due to the age of the enzyme (T4 ligase 'expired' in 2009), or possibly the oligos didn't anneal correctly (T4 ligase will only bind ds DNA). To check if the problem is with 2) the PCR did not work, I need to double check the sequences of the oligos I ordered. That will be my first step because it will help w/ 1 or 2. If everything checks out then I will re-digest w/ fresh T4 ligase.
11/30/10
Summary: reconstitution an annealing of adapters for MSAP (methylation sensitive amplification polymorphism)
Procedure:
followed IDTs protocol for annealing oligos with the exception that T4 ligase buffer at a 1x concentration was used in lieu of Duplex Buffer.
sequences for adapters can be found in supplementary table 1 of Li et al 2008.
- Hpa/Msp adapters
- adapter I: added 123 uL 1x buffer to a final conc. of 0.24ng/uL
- adapter II: added 100uL 1x buffer to a final conc. of 0.24ng/uL
- added 1ng each oligo (4.2uL), 10x T4 ligase buffer to a conc. of 1x (5uL) and H20 to a final vol of 50uL
- final total conc. of HpaII/MspI adapter: 40pm/uL
- EcoRI adapters
- adapter I: added 100 uL 1x buffer to a final conc. of 0.27ng/uL
- adapter II: added 110uL 1x buffer to a final conc. of 0.27ng/uL
- added 1ng each oligo (3.7uL), 10x T4 ligase buffer to a conc. of 1x (5uL) and H20 to a final vol of 50uL
- final total conc. of EcoRI adapter: 40pm/uL
- placed tubes in thermocycler for 2 min at 95C, then cooled slowly on bechtop for 45 min.
11/29/10
Summary: MSP (qPCR portion only, see Sam's notebook 11/29/10 for digest info) of double digested C.gigas samples using hsp70 and macrophage kinase primers
Procedure:
- All digested samples all had a low conc. on the nanodrop, so 2uL of sample was run neat (i.e. samples were not normalized). However, in order to test the limit of detection of the primers the undigested samples were diluted to 1ng/uL (2uL loaded) and these dilutions were run in addition to the neat undigested samples. In addition, a serial dilution of P11 gill tissue was run: 1:10, 1:100 and 1:1000
- plate layout can be found here
qPCR was run in the Friedman lab. Results can be found in Dropbox>Lab>Mac file name: Roberts Lab_2010-11-29 16-18-11_CC009827.pcrd
In summary, the blanks were negative as expected. The serial dilution of the undigested P11 gill tissue amplified at 1:10 and 1:100 dilution (~4ng and 0.4ng loaded respectively) for both primer sets. All of the undigested samples diluted to 1ng/uL amplified. Although these samples were normalized, the Ct's were a couple cycles different for all of these samples. This is likely due to the fact that the nanodrop is not accurate at such low concentrations. The results for the MspI digests were as expected (no amplification) for all samples except the P11 gonad sample (both primer sets) and the P30 gonad sample (hsp70 primer set). All of the unknown samples were determined to be methylated at the hsp70 CpG site and unmethylated at the macrophase kinase CpG sites.
11/17/10 *NOTES*
Published procedures for digesting genomic DNA to completion:
Wang et. al., 2004 - 3h/37C/10Uenzyme per ug DNA, phenol chloroform extraction, EtOH precipitation, repeat from beginning
Dong et. al., 2006 - 10U enzyme per ug DNA, 48 hr digestion
11/16/10
Summary: complete EtOH precipitation of R037 fractions separated using MethylMiner kit. Quantify fractions.
Procedure:
- followed mfr instructions for MethylMiner Kit to complete EtOH precipitation
- solubilize in TE buffer 60uL each sample, except triplicate sample elutions were combined here w/ 60 uL total
- quant on NanoDrop

- pooled the 2 sample non-capture supe samples, conc. 29.6 ng/uL
The 260/280s are a little higher for this round compared to the first run performed 11/10/10. I didn't notice any beads in the fractions this time, so improved ratios are probably due to more care being taken when pulling the fractions out of the tube. Also of general note, this run had lower total recovery than the first run performed 11/10/10 (63% compared to 92%)
Control DNA: 100% total recovery (1ug), 80% was in non-captured fraction, 20% was in 1000mM NaCl fration and 0% was in 2000mM NaCl fraction (most methylated). This is generally consistent with expected results (by PCR analysis, not direct quantitation) 70% in super, 30% in captured
Sample DNA: 63% total recovery (7.3ug at the beginning 4.6ug at the end). Here is the breakdown:
non-captured supernatant: 3.6ug (78% of DNA recovered)
1000mM eluted fraction: 0.7ug (15% of DNA recovered)
2000mM eluted fraction (this would be the highly methylated fraction): 0.3 ug (7% of recovered DNA)
Conclusions/Next Step: The recovery was lower overall compared to the 11/10/10 run, but the breakdown %wise of each fraction was similar.
Follow-up: PCR was performed to
cont...
PCR for control DNA
- prepped 10uM working stock (5uM each) of primer mix (10uL primer mix, 90uL H20) for both methylated and non-methylated control DNA
- prepped master mix for each primer mix: 6uL primer, 150uL Apex Mmix, 138uL H20 (50 uL rxn enough for 6 rxns)
- for each master mix:
- added 1uL control DNA input (0.5uL each of meth and non-meth working stocks prepared yesterday) to 'input'
- added 1uL control DNA supernatant to 'supe' tube
- added 1uL control DNA elution 1 to tube 'elute 1' tube
- added uL control DNA elution 2 to 'eluate 2' tube
- added 1uL water to 'blank' tube
- cycling parameters (from mfr protocol):
- 94 2min
- 94 15 sec
- 55 15 sec
- 68 30 sec
- repeat 2 - 4 26 times
- 68 5min

11/15/10
Summary: complete EtOH precipitation of and perform MethylMiner procedure for R037 pooled oyster sample.
Procedure:
- completed EtOH precipitation from 11/13/10. Final amount of DNA 7.3ug in 100uL
- transferred DNA to a Covaris microtube and sheared DNA using protocol from SOLiD DNA fragment library (target size 150 - 200bp)
- prepared bead-MBD complex following mfr procedure (2 tubes total, 1 for samples w/ 8ug starting DNA (*I rounded up*), 1 for control DNA at 1ug.
- Initial bead wash:
- sample tube: 80uL bead, 20 uL 1x B/W buffer
- control tube: 10uL bead, 90uL 1x B/W buffer
- followed mfr instructions for washing
- MBD protein diluting
- sample tube: 56uL MBD, 144uL 1x B/W buffer
- control tube: 7uL MBD, 93uL 1x B/W buffer
- followed mfr instructions (detailed below in steps 4 - 10 of 11/10/10 entry) for the remainder of the protocol - samples stored at -80 for EtOH precipitation
- Initial bead wash:
11/13/10
Summary:finish DNA isolations (R037 April 2010) from 11/12/10, pool R037 DNA and initiate EtOH precipitation
Procedure:
finish DNA isolations: no tissue was visible, spin 10k g for 10min at 4C, decant soln. into a clean tube and precipitate w/ 250uL 100% EtOH. Mix by inversion and let sit 3 min. Spin 5000g for 5 min at 5C. Discard liquid wash 2x w/ 800uL 75%EtOH, solubilize in 200uL 8M NaOH, add 20uL 0.1M HEPES to target pH 8.
quant:

pool and EtOH precipitate: pool gDNA of 8 individuals to target 10ug total, need to EtOH precipitate to conc. to 100uL for fragmentation in Covaris
add 1250ng each of the following RO37 samples collected in April 2010 to a tube
- 16 - 77.1uL (16.21ng/uL)
- 12 - 86.9uL (14.39ng/uL)
- 11 - 139.3uL (8.97ng/uL)
- 03 - 32.5uL (38.48ng/uL)
- 02 - 23.5uL (53.14ng/uL)
- 13 - 56.3uL (22.21ng/uL)
- 06 - 12.2uL (102.6ng/uL)
- 07 - 12.2uL (102.6ng/ul)
- added 44uL NaOAc, 880uL 100% EtOH, mixed well and stored at -80C
11/12/10
Summary: A) run control DNA PCR reactions on gel, B) bioanalyze fractions of RO51 DNA from MethylMiner separation (see 11/11/10), C)start DNA isolation for R037
A) Results from pos. control DNA MethylMiner performed 11/11/10. For the pos. control known methylated and non-methylated fragments are spiked into a provided control DNA (they do not recommend spiking your sample due potential to specificity issues with the primers), then after fractionation you can assess the separation of the methylated DNA into the bound fractions, and the non-methylated DNA in the non-captured fraction.
lane ID:
M = methylated control DNA primesr, NM=non-methylated control DNA primers
1) 50 bp ladder
2) M mix meth and non-meth control DNA
3) M control non-captured (supe)
4) M control 1000mM NaCl Eluate 1
5) M control 2000mM NaCl Eluate 2
6) M blank
7) NM mix meth and non-meth control DNA
8) NM control non-captured DNA (supe)
9) NM control 1000mM NaCl Eluate 1
10) NM control 2000mM NaCl Eluate 2
11) NM blank
12) Hyperladder 1 (smallest band 200bp)

results are as expected! the methylated DNA is found primarily in the 1000mM NaCl Eluate 1 (lane 4), while the non-methylated control DNA is found primarily in the non-captured supernatant (lane 8). The 50bp ladder did not show up, but the band size is approximately correct being smaller than 200 bp. The positive spiked DNA (mix of non-meth and meth control DNA in water (lanes 7 and 2 respectively) had a band present as expected.
B) Bioanalyze MethylMiner Fractions - R051 pool
C) DNA isolation of R037 samples *NOTE: insufficient gDNA remains from original isolation, so starting a few more isolations to make a pool of 8 individuals 10ug total*
- added ~30ug gill tissue of R037 samples (SB - April 2010): 6,7,8,9,10
- added 500uL DNAzol and 20uL pK
- incubated on rotating platform (end over end) at RT overnight.
11/11/10
Summary: completed EtOH precipitations and quantited DNA fractionated using MethylMiner kit (see 11/10/10 for start of procedure)
Procedure:
followed mfr instructions for MethylMiner Kit to complete EtOH precipitation
- spin samples max speed 15 min 4C
- discard liquid (*NOTE*: I did observed tiny bit of brown color (beads) in most of the pellets. beads are bound to proteins)
- add 0.5mL cold 70% EtOH, spin max 5 min at 4C, discard liquid
- repeat previous step
- dry for ~ 5 min
- solubilize in TE buffer 60uL each sample, except triplicate sample elutions were combined here w/ 60 uL total
- quant on NanoDrop
- pooled the 2 sample non-capture supe samples, conc. 50.9ng/uL

My first observation is that overall the 260/280s are low. This may be due to residual MBD protein either alone or attached to a bead. Also of note, for samples 10ng/uL and lower, you can't really detect a 'peak' at 260, it all looks like baseline. With that said:
Control DNA: 100% total recovery (1ug), 60% was in non-captured fraction, 30% was in 1000mM NaCl fration and 10% was in 2000mM NaCl fraction (most methylated). This is pretty consistent with expected results (by PCR analysis, not direct quantitation) 70% in super, 30% in captured
Sample DNA: 92% total recovery (9ug at the beginning 8.3ug at the end). Here is the breakdown:
non-captured supernatant: 6.1ug (73% of DNA recovered)
1000mM eluted fraction: 1.5ug (18% of DNA recovered)
2000mM eluted fraction (this would be the highly methylated fraction): 0.5 ug (6% of recovered DNA)
Conclusions and Next Steps:
The manufacturer's protocol says to expect 3 - 20% of your DNA to be eluted in the 'methylated' fration if doing a single step elution. This is based off mammalian DNA (I assume), so I wasn't sure what to expect w/ oyster DNA. The range though is similar, about 20% was bound to the beads before recovery of methylated DNA. Most of this bound DNA came off in the lower salt buffer. Technically all 3 fractions have enough DNA to go into SOLiD fragment DNA library prep (range 10ng - 5ug).
The next step for this MethylMiner run would be to perform a PCR w/ the control DNA to make sure the methylated DNA was bound and eluted properly.
The next step for sample prep would be to repeat this procedure with the R037 (SB) sample*. This procedure worked pretty well, so I wouldn't change anything except try to be more careful so I don't transfer beads to the fractions. I may call Invitrogen about this, because I'm not sure how to improve this step.I would also consider running each of the fractions on the bioanalyzer to verify fragment length and possible fragment size bias.
*But here is option 2..since recovery was good, I could run the procedure again with 5ug of each sample (repeat R051 and add R037) but change the salt concentrations to 500mM NaCl and 2000 NaCl to get a more even distribution. If I would have been paying more attention, I would have noticed at the 80% of the control methylated DNA comes off in the 1000mM NaCl fraction and 20% in even less conc. salt elutions. I would be more confident about going this route if I knew the minimum amount of starting material the downtown sequencing facility would start w/ for library prep and if I tested these samples on the bioanalyzer.
Either way, once both samples are complete, they will be ready for library prep.
cont...
PCR for control DNA
- prepped 10uM working stock (5uM each) of primer mix (10uL primer mix, 90uL H20) for both methylated and non-methylated control DNA
- prepped master mix for each primer mix: 6uL primer, 150uL Apex Mmix, 138uL H20 (50 uL rxn enough for 6 rxns)
- for each master mix:
- added 1uL control DNA input (0.5uL each of meth and non-meth working stocks prepared yesterday) to 'input'
- added 1uL control DNA supernatant to 'supe' tube
- added 1uL control DNA elution 1 to tube 'elute 1' tube
- added uL control DNA elution 2 to 'eluate 2' tube
- added 1uL water to 'blank' tube
- cycling parameters (from mfr protocol):
- 94 2min
- 94 15 sec
- 55 15 sec
- 68 30 sec
- repeat 2 - 4 26 times
- 68 5min
11/10/10
Summary: performed MethylMiner protocol to make methylation enriched oyster DNA fractions
Procedure:
- completed EtOH precipitation from 11/09/10. Final amount of DNA 9ug in 100uL
- transferred DNA to a Covaris microtube and sheared DNA using protocol from SOLiD DNA fragment library (target size 150 - 200bp)
- prepared bead-MBD complex following mfr procedure (2 tubes total, 1 for samples w/ 9ug starting DNA, 1 for control DNA at 1ug)
- prepared sufficient 1x Bind/Wash buffer for 10ug of DNA (9 sample, 1 control) (3.6mL 5x bind/wash buffer, 14.4 mL DNase free H20
- Initial bead wash:
- sample tube: 90uL bead, 10 uL 1x B/W buffer
- control tube: 10uL bead, 90uL 1x B/W buffer
- followed mfr instructions for washing
- MBD protein diluting
- sample tube: 63uL MBD, 137uL 1x B/W buffer
- control tube: 7uL MBD, 93uL 1x B/W buffer
- mixed pre-washed beads and MBD together and incubated, rotating at RT for 1 hr
- washed bead-MBD complex per mfr protocol (100uL per wash)
- prepared 10pg/uL stocks on non-meth and meth control DNA by using 1uL of stock and 99uL of H20
- prepared sample and control DNA
- sample: 300uL H20, 100uL (sheared) RO51 DNA, 100uL 5x B/W buffer
- control: 58uL H20, 1uL meth DNA (10pg/uL), 1uL non-meth DNA (10pg/uL), 20uL K-562 DNA, 20 uL 5x B/W buffer
- added DNA to bead-MBD complex and incubated, rotating at RT, for 1 hr
- prepared elution buffer 1000mM NaCl by adding 1400uL of the High Salt Buffer (2000mM NaCL), to 1400 uL of Low Salt Buffer (0mM NaCl)
- removed non-captured DNA per mfr protocol
- for sample: 1 supernatant tube, 4 washes
- for control: 1 supernatant tube, 2 washes
- performed multi-fraction elution procedure per mfr protocol
- sample: followed procedure for >1-25ug, so there were 3 elution tubes for each NaCl concentration (1000mM NaCl first, then 2000mM NaCl)
- control: followed procedure for 1ug, so there were 2 elution tubes, same conc. NaCl as sample above
- combined non-captured washes per protocol (wash 1 and 2 pooled as Wash A, and for sample wash 3 and 4 pooled as Wash B) and control elution reps (elution 1 and elution 2) per protocol. The sample elution reps remain separate.
- added 1uL glycogen to each tube then 0.1 vol NaOAc (ph 5.2) and 2 vols 100% EtOH and stored at -80
11/09/10
Summary: prepared a pool of oyster gill DNA (R051 collected April 2010) for EtOH precipitation targeting 10ug in 100uL of TE for use in MethylMiner kit
Procedure:
- prepared pool of eight individuals from R051 (Willapa Bay juv) (1250ng each)
- 20 - 26.6uL (46.91ng/uL)
- 17 - 32.4uL (38.59ng/uL)
- 16 - 15.7uL (79.65ng/uL)
- 14 - 23.0uL (54.34ng/uL)
- 13 - 16.7uL (74.65ng/uL)
- 10 - 23.7uL (52.75ng/uL)
- 5 - 21.2uL (58.92 ng/uL)
- 2 - 13.2uL (94.72ng/ul)
- added 17.3uL NaOAc, 345uL 100% EtOH, mixed well and stored at -80C
10/26/10
Summary: RACE (3' and 5') for C.gigas DNMT1 using 2 sets of RACE ready cDNA
Procedure:
- prepared Mastermix for 13 rxns: 448.4uL PCR H20, 65uL 10x Advantage 2 PCR buffer, 13uL 10mM each dNTP, 13uL 50x Advantage 2 Polymerase Mix (10uL from SMART RACE kit, 3uL from straight Advantage PCR kit since I ran out)
- Added Mmix, samples and primers to 0.5mL PCR tubes for 5' and 3' RACE per mfr. protocol. Following samples and controls prepared for each:
- sample: 5' or 3' RACE ready cDNA prepared by SW Jun 2008
- sample: 5' or 3' RACE ready cDNA prepared by MG 2/6/09
- gene specific primer pos control: both SW and MG cDNA (both 3' or 5')
- UPM negative control: SW cDNA only
- gene specific primer negative control: SW cDNA only
- PCR cycling (followed protocol for Tm >70 (gene specific primers for 5' and 3' are both right at 70))
- 5 cycles: 94C 30s, 72C 4min
- 5 cycles: 94C 30s, 70C 30s, 72C 4min
- 25 cycles: 94C 30s, 68C 30s, 72C 4min
- 72C 6 min, 4C forever
- prepped 1.2% agarose gel w/ EtBr
- loaded 25uL each
1) ladder, 2) 5'RACE cDNA SW, 3) 5'RACE cDNA MG, 4) GSP + SW, 5) GSP + MG, 6) 5'UPM, 7) 5'GSP, 8) 3'RACE cDNA SW, 9) 3'RACE cDNA MG, 10) GSP + SW, 11) GSP + MG, 12) 3'UPM, 13) 3'GSP

bands were cut from lanes 2 and 3
Conclusions & Next Step:
Only the 5'cDNA amplified product. The bands are about 900bp in length. It is possible if the 3' PCR was performed again w/ a lower annealing temp, that amplification would occur. The next step is to squence the 5' bands and to repeat the 3' PCR with a lower temp.
10/15/10 & 10/18/10
Summary: Traditional PCR to test DNMT1 primers
10/15/10
Procedure:
Samples: cDNA C.gigas gill (date 10/30/08), gDNA DH14 gill (extracted5/19/09)
Mmix: (25uL total rxns, 1uL template)
2 blanks, 1 cDNA, 1gDNA for each primer pair (prepped mmix for 5 samples):
62.5uL 2x Apex Mmix
2.5uL 10uM primer F
2.5uL 10uM primer R
52.5uL H20
24 uL Mmix/rxn
Four primer pairs total:
1) Cg_Cv/CgDNMT1a_F & R (cDNA: 1,116 bp expected)
2) Cg_Cv/CgDNMT1b_F & R (cDNA: 417 bp expected)
3)Cg_Cv/CgDNMT1a_F & Cg_Cv/CgDNMT1b_R (cDNA: 782 bp expected)
4)Cg_Cv/CgDNMT1b_F & Cg_Cv/CgDNMT1a_R (cDNA: 751 bp expected)
PCR:
95C 10min
40 cycles:
95 15sec
55 30sec
72 2 min
72 10 min
10/18/10
Procedure:
prep 0.8% agarose EtBr gel, and run all samples (20uL each) w/ Hyperladder I as ladder
Imaged gel then cut out bands
Results:
legend: (c) cDNA (g) gDNA (b) blank

The primers did not give the expected band sizes
(see above for description of primer pair and expected band size)
primer pair 1) no band in cDNA or gDNA
primer pair 2) 1 band >1000bp in cDNA, expected ~ 400bp, some smearing in both lanes <1000 (cut out cDNA band)
primer pair 3) 1 band ~ 400 in cDNA and gDNA, expected 782bp (cut out cDNA band)
primer pair 3) 1 band >1000bp in cDNA, no band in gDNA, expected band size 751 (cut out cDNA band)
Conclusions:
None of the primer pairs gave the expected band sizes. The sequence used to design primers was made from a 'hybrid' of a C.virginica sequence and a C.gigas sequence that overlapped, so this may be the intended gene it's just a different size in gigas, or it's possible that it's just non-specific amplification. Can try direct sequencing to determine if it's intended region.
Next step:
5' and 3' RACE off C.gigas gene specific primers to get more sequence. Direct sequencing of today's cut bands.
10/7/10
Summary: looking for DNMT1 seq. in C.gigas.
There are 2 sequences in Gigasbase w/ homology (blastx) to DNMT1: CU994437 and CU994437. These two sequences align almost completely w/ a bit of sequence extending on both the 5' and 3' ends

This consensus sequence is 755 bp. A blastx of this concensus seq results in top hits to DNMT1

in a +1 frame. The area of consensus is highlighted below, the translation of the sequence is included

NOTE: a blastn also has DNMT1 top hits for example:

Also tried blastn against C.gigas GSS sequences (including bac clones) w/ no positive hits.
There is also a C.viriginica EST that has DNMT1 as a top BLAST hit. I did an alignment of the C.virginica sequence (CD647314) and there was some overlap

Next Steps:
1)Double check the NGS data to see if there is any additional sequence, I don't think there is.
2) Design primers for 5'RACE and maybe 3' RACE (even though consensus seems to have polyA?).
3) Design primers on the consensus sequence, to PCR both gDNA and cDNA to get an idea of gene structure
10/01/10
Summary: side-by-side w/ SOLiD purification kit and Pure-Link PCR purification kit (both Invitrogen).
Purpose: Troubleshoot failed SOLiD libraries (no recovery). I think it may have something to do with the purification kit (column based, comes with library kit) because I have yields of 45% after fragmentation, end-repair, purification. The protocol says to assume a yield around 70%. This purification kit is used 4 times during the library process, so starting w/ ~5ug of DNA the most recovery I could have gotten after 4 purification steps w/ 45% recovery each time is 200ng. This is maximum as I'm sure there is loss during size selection on the E-gel as well. So the columns are probably not the whole problem, since I didn't even recovery 200ng, but it seems like it could be a major contributor. So, just to make sure I didn't prepare the buffers incorrectly or something just as goofy, I'm running the SOLiD purification kit that I'm troubleshooting against the PureLink PCR purification kit that we use for the Whole Transcriptome Libraries.
Procedure:
- plan: use SOLiD (S) columns and PureLink (PL) columns (C), each with either the SOLiD or PureLink buffer (B):
- start w/ fragmented DNA from the 'wash' portion of Sam's MeDIP samples. Fragment size is ~ 500bp, so larger than the 150 - 250 that was used in library prep. The starting sample conc., determined on the NanoDrop, was 22.0ng/uL in 100 uL
- add 24uL (528ng total) to each of 4 columns, labeling:
- S-C, S-B
- S-C, PL-B
- PL-C, S-B
- PL-C, PL-B
- NOTE: the wash buffer and the elution buffer part numbers are the same for these 2 kits. The binding buffer and columns have different lot #'s between the 2 kits. Regardless ALL of the kit components were kept separate between the S-B samples and PL-B samples
- I followed the SOLiD purification protocol which was very similar to the PureLink protocol with the following exceptions:
- SOLiD protocol includes an additional 'let it sit at RT for 2min' step when sample/binding buffer is 1st loaded
- SOLiD protocol uses 2 min spins instead of 1 min spins for wash buffer
- SOLiD protocol has the sample/elution buffer pass over the column 2x instead of just 1 time in the PureLink protocol
- NOTE: all centrifugations were performed at RT at 10,000g

Conclusions:
With 100% recovery I would have expected 21ng/uL recovery, but realistically I should be getting around 70% recovery or 14.7ng/uL.
What I actually got was 14% recovery for the PureLink columns (P-C), regardless of buffer (S-B or PL-B), and 30% recovery for the SOLiD columns regarless of buffer. Since results were not buffer dependent I'll asume it's not the buffers (I was worried I may have prepped them incorrectly). The recovery on the SOLiD columns was even lower than the 45% I originally had. Possibly the recoveries get worse with less starting material? That is disappointing. I will refrain from drawing conclusions about the PureLink columns directly since I didn't follow the 'exact' procedure, but I would not suggest deviating from that procedure in the future. I did communicate w/ tech support at ABI earlier about the recovery issue and he said that they usually see 70% recovery, but was not shocked to hear about the 50% recovery. He suggested the use of the PureAmp beads to increase yield. While I can't definitively say that the columns are where all of the loss occurred, it seems like it's certainly contributing to the problem.
9/13/10
Summary: amplified MeDIP enriched libraries (library prep started 9/7/10 (see below) -->9/10/10)
Procedure:
9/10/10
Summary: completed MeDIP procedure (from 9/9/10), initiated DNA extraction/purification.
Procedure:
9/9/10
Summary: continued MeDIP procedure from 9/9/10: added beads, separated antibody-bound fractions, proK overnight
Procedure:
- pre-washed 45uL of homogenized beads w/ 1mL Ix IP buffer, mix:spin 6000rcf/2min, remove supe and add 45uL 1x IP buffer
- add 20uL of mixed beads to each of the tubes that had been incubating ON w/ antibody (see 9/8/10)
- incubated tubes for 2hr. @ 4C on rotating platform
- washed beads 3x using the following procedure (retained the pre-wash, as well as 3 wash solutions as it contained the 'unbound fraction' of DNA):
- spin: 6000 g/2min, remove supe
- add 1mL 1x IP buffer mix
- Resuspended beads in 250uL of digestion buffer (50mM Tris HCl pH 8, 10mM EDTA, 0.5% SDS) and 3.5 uL of 20mg/mL Proteinase K.
- Incubated tubes for ON (total time for incubation 24hr) @ RT on rotating platform.
9/8/10
Summary: Continue w/ SOLiD library prep from 9/7/10: Shearing the DNA through Nick Translation. Initiated MeDIP procedure
Procedure:
- complete EtOH precipitation from 9/7/10: spin max 30min, wash 70% EtOH, spin max 10 min, solubilize in 120uL TE buffer
- quant pools on nanodrop:
- R037: 37.29 ng/uL (4.5ug total)
- R051: 63.31 ng/uL (7.6ug total)
- added 3.7ug (max DNA for 100uL vol. constrain) of each sample to a Covaris tube:
- RO37: 100uL neat
- R051: 59.7uL DNA, 40.3uL TE
- followed SOLiD Fragment Library 'Standard Fragment Library Protocol' for: shearing DNA, end-repair, purification and quantification
- recovery and conc. from these steps:

- performed ligation of P1 and P2 adaptors per SOLiD protocol: calculated amount of adaptors per protocol based on amount of DNA for each sample: for R037, 13.1uL each adaptor; for R051 14.5uL each adaptor (vol H20 to QS to 200uL was 75.8uL for R037 and 71 for R051).
- purified on-column
- size-selected (E-gel/iBase): ran in 3 lanes (20uL max load, 50 uL total after purification). NOTE: again, 11:40 was not enough time to get to 150 - 200bp marker, so ran ~ 2 min longer. Added water ~ 10 minutes in, recovered ~15uL/lane, washed each well w/ 20uL and recovered that volume as well
- purified on-column: 50uL eluate
- nick translated:
- purified on-column: 50uL eluate
- MeDIP:
- added 300uL TE to eluate (350uL total), denatured at 95C for 10 min/immediately to ice 5 min
- 100uL 5x IP Buffer, 5uL anti-5MeCytosine antibody (5ug total), 45 uL H20
- incubated on end-over-end rocker at 4C ON
9/7/10
Summary: performed nick-translation of 2 SOLiD libraries (see 9/01/10), then performed PCR amplification (this was a mistake, as MeDIP should have been performed prior to PCR). Re-pooled gDNA of the same samples to start over, and initited EtOH precipitation of samples.
Procedure:
Nick Translation and PCR:
- prep. nick translation reaction:
- used protocol from ABI tech support (see 9/1/10)
- had 50uL of adaptor ligated DNA, so adjusted vol's/conc. accordingly
- 50uL DNA, 7uL 10x NEBuffer 2, 12uL dNTP (10mM*), 1uL DNA Polymerase I
- *conc. ~4x too high. I thought conc. was total dNTP, but was 10mM each, don't think it should impact,not a lot of DNA so did not increase enzyme conc
- incubate for 30 min @ 20C
- perform purification via SOLiD Purification Kit
- prepared PCR rxns: per protocol (Table 5) prepped mmix for 3 samples "<100uL vol" (2 samples and a neg control), added 400uL to each gel purified sample and divided reaction into 4 0.5mL PCR tubes
- performed PCR per Table 6 of protocol. Protocol gives you an optional number of cycles to run for 100 ng to 1ug states to run 6 to 8 cycles, I split the difference and ran 8 (too many cycles can overamplify and produce redundant molecules)
- purified per protocol and stored libraries (now ready for quantitation and ePCR) at -20C
- prepared pooled DNA (8 individuals) using the same individuals as the initial library prep (see notebook entry 8/30/10), with the exception that RO37-12 was used instead of R037-01 (due to insufficient vol):

- added 0.1 vol. NaOAc, 2 vol 100% EtOH, mix, store at -20C
9/01/10
Summary: Cont. from 8/30/10. Library prep: size selected DNA (pages 14 - 15 of SOLiD 3 Plus System Library Preparation Guide October 2009)
Procedure:
- 1st: downloaded '2% Size-select' E-gel program (Invitrogen) onto the E-gel system
- prepared gel per E-Gel size-select protocol
- loaded samples into top wells (10uL each sample, 10uL H20)
- ran iBase program: Run SIzeSelect 2% for 11 min 40 sec per protocol
- the 150 bp band was not through the collection well after 11min40sec, so added a few uL of H20 to collection wells and ran for an additional 1.5 minutes
- collected volume out of sample wells ~20 uL, then washed the well w/ 20uL H20 and recovered that vol. into the same tube per the SOLiD library protocol
Plan:
- order DNA Polymerase I (NEB) - done 9/1/10
- perform nick translation per 'old' library protocol (when nick translation was separate from amplification) below (protocol from ABI tech):

- purify using SOLiD Library purification kit
- proceed w/ MeDIP procedure
- finish library prep (PCR amplification, purifiy, quantitate)
8/31/10
Summary: Cont. from 8/30/10. Library prep: end repaired fragmented DNA, ligated adapters, attempted size selection (pages 10 - 15 of SOLiD 3 Plus System Library Preparation Guide October 2009).
Procedure:
- ran fragmented samples on Bioanalyzer 2100 (not called for in protocol, but for first time w/ procedure wanted to check). Used DNA1000 chip, followed mfr protocol. The size range was as expected: a representative e-gram (R037) is below

- end-repaired fragmented DNA following SOLiD protocol (NOTE: 99uL DNA used instead of 100uL) then purified per SOLiD protocol
- quantitated DNA per SOLiD protocol (recovery ~50% of 4ug input DNA, protocol does say if starting DNA conc. is low assume a 70% recovery at this step, so my recovery is kind of low)

- performed ligation of P1 and P2 adaptorsper SOLiD protocol:
- calculated amount of adaptors per protocol based on amount of DNA for each sample: for R037, 14.5uL each adaptor; for R051 13.8uL each adaptor (vol H20 to QS to 200uL was 71uL for R037 and 72.4 for R051).
- size-selection: the SOLiD library protocol states to use the E-gel/iBase system (Invitrogen) to size select for fragments in the 150 to 200 bp range. This was my first time using this system, and I failed miserably. Three major errors: 1) did not have required program downloaded onto the iBase and didn't realize this until after I had loaded samples (instead ran Run Egel 2% program for ~15 min), 2) only printed manual for Ebase station, not the size-select gel so performed a 'pre-run' when size select gel specifically states not to run this, 3) did not load water into collection wells - so I'm pretty sure the DNA stopped at the well. I still did a 'wash' when the markers were at the right spots and collected the water into a tube, but I doubt it has any DNA in it. Only saving grace: I still have 10% of the prep remaining because there were not a enough wells to run all the sample. Will get everything ship shape and run the remaining tomorrow. Should still have enough to prep the library as long as my MeDIP recoveries are similar to Sam's (~13% of input) (i.e. 10% of 4ug or 0.4ug *0.13 = 50 ng)
8/30/10
Summary: pooled and sheared gDNA from SB and WB hybrid oysters (April 2010 collection) for SOLiD DNA fragment library prep (MeDIP-seq) and fragmented using the Covaris.
Purpose: To prepare SOLiD DNA fragment libraries, enriched in methylated fractions (via MeDIP), of oyster gill tissue from sibling oysters 35 x 51 hybrids raised in different environmental conditions (Samish Bay and Willapa Bay) for 1 year. Sam has already done MeDIP on a similar pool (6/10), but in order to generate the libraries the adapters must be ligated to blunt-ended duplex DNA, the result of MeDIP is double stranded, so for this prep the DNA will be fragmented and adapters ligated prior to MeDIP.
Procedure:
- prepared pooled DNA (8 individuals) according to procedure for 1st MeDIP (see Sam's notebook entry 20100618 'gDNA Precipitation - SB/WB gDNA pools (prep for MeDIP)'). See exception below:
- NOTE: for the R037 sample there was not enough DNA remaining to use individual R037-0410-06 and -08. Instead 56.3 uL of R037-0410-13 and 77.2uL of R037-0410-15 were used.
- performed EtOH precipitation to concentrate samples and have them in the required TE diluent
- to each of the 2 pools added 0.1 vol NaOac and 2.5 vol 100% EtOH, mixed, 30 min @ -20, max spin 30 min, decant, wash w/ 70% EtOH, max spin 10 min, solubilized in 120uL TE Buffer
- quant pools on nanodrop:
- R037: 41.88 ng/uL (5.0ug total)
- R051: 71.72 ng/uL (8.6ug total)
- SOLiD DNA fragment library can start w/ 10ng - 5ug of input DNA. Added 4ug each (see volumes below) to a Covaris microTUBE and sheared DNA following SOLiD protocol (page 9 step 3.)
- R037: 95.6uL DNA, 4.4uL TE; R051: 56.3uL DNA, 43.6uL TE
- NOTES: when using Covaris, must fill w/ water and turn chiller on ~30min before running to get bath to 5C
- fragmented DNA stored at 4C
8/4/10
Summary: finished dot blot from 8/3/10
Procedure:
- followed Invitrogen's Western Breeze mfr. instructions for using a nitrocellulose membrane (used TBS-T instead of wash buffer)
- prepped 1:10,000 dilution of primary 5-MeC antibody (Diagenode)
- primary antibody incubation 1 hr
- development time: no color after 12 minutes, stopped reaction after 45 minutes
- tried to scan on the FSH copier - not enough resolution to pick up the color, final image from lab camera

Conclusions/Next Steps:
There are some trends, but to ensure same amount of DNA loaded (see gel from 7/22/10 where 'normalized' amount of DNA was run) need to find a way to normalize better. Will try quant software to normalize based on intensity of color in band from 7/22/10 gel. One thing that stands out to me is that the female gonad sample from a control animal appears to be less methylated than any of the male gonad samples. I need to check - are both egg and sperm haploid? I think oocytes are diploid. Not sure if it matters.
8/3/10
Summary: start dot blot of oyster parents used in spawn 7/1/10
Procedure:
- prepped dilutions of sample and control DNA

- boiled samples for 10min @ 100C, then placed on ice
- added DNA to wells, 6x SSC to blank wells, denatured membrane for 10min in denat. soln, then 5 min neut soln, dried membrane then crosslinked (120k J/2min)
7/22/10
Summary: EtOH precipitation of C.gigas gonad samples, 7/20/10, run samples (plus gill samples on gel to check quality of DNA)
Procedure:
- thawed samples, spin max 15min
- wash 2x w/ 500uL 70% EtOH
- solubilize in 8mM NaOH (100uL total for sample #10, 250uL total for all other samples - samples were split in two earlier, but combined here)
- add 0.1M HEPES to target pH 7.55 per DNAzol manual
- quant samples
- gel: load 0.5ug DNA for each sample, 0.8% agarose EtBr gel, ~40min @ 100V
Nanodrop:

Gel:

Conclusions:
Precipitation did not improve the 260/230. Still largest peak was at 230. Results from the gel show that the quantitation for these samples is not that reliable because of this (some much brighter than others). In general, it appears that the gametic tissue is less degraded than the gill tissue.
7/20/10
Summary: complete DNA isolation initiated 7/19/10
Procedure:
- batched gonad samples 1st, then did gill samples after. Same procedure for both
- pipette soln (DNAzol, remaining tissue if any, pK) up and down
- spin 10,000g for 10min
- supe into a new tube and 0.250mL 100% EtOH added, mix by pipetting/inverting
- spin 5,000g for 5 min
- decant
- wash 2x in EtOH (note, for 1st batch (gonad) centrifuged 1min at 1K between washes, for 2nd batch (gill) just allowed pellet to settle. this worked fine, and was easier)
- solubilize in 8mM NaOH - 500uL for gonad (300uL first, then 200ul after pellet did not dissolve), 250uL for gill (smaller pellets)
- add 0.1M HEPES to ~ 7.5pH in mfr protocol NOTE: for gonad samples added 1M HEPES instead of 0.1M inadvertently
Nanodrop Results:

plots of gonad samples:

Conclusions: gill samples look fine, gonad samples have HIGH abs. at 230. Images of plot above. Not sure why - Sam looked back at his notebook and the gonad sample he processed last week also had the lowest 260/230 ratio. I blanked w/ the appropriate blank, but it is also possibly not good that I added 1M HEPES instead of 0.1M. Regardless, will initiate an EtOH precipitation of the gonad samples to get rid of junk that may be absorbing at 230.
Next Step: initatiate EtOH precipitation for gonad samples. Divided samples due to vol constraints. Added 0.1vol NaOAc and 2x vol ice cold 100% ETOH. Placed in -20 (small) will continue procedure Thursday.
7/19/10
Summary: start DNA isolation of F0 generation of oysters (gonad and gill tissue) from heritability experiment - spawned 7/01/10
Procedure: for the following samples, ~25mg tissue, 500uL DNAzol, 20uL proteinase K on rotator overnight:
NOTE: the numbers correspond w/ sex determination results, see notes 7/01/10: #2, #28, #23, #10, #11, #17, #19, #30, #31
7/12/10
Summary: MSP qPCR
Procedure: layout, primers, samples here
7/7/10
Summary: notes on larvae from Nate Wight, restriction digests
- notes from Nate regarding larvae

- restriction digest set up. used 25ng/uL stocks Sam made last week: Sam's notebook 7/2/10, followed digest protocol (mmix, 10uL DNA from stocks, etc) from same entry in Sam's notebook
- started digests at 1pm @ 37C
- Sam to stop digests (heat stop) at 5pm
7/6/10
Summary: qPCR w/ MSP primers for: hsp70, and macrophage exp. protein 1 - like protein using digested oyster samples prepared by Sam 7/2/10
- normalized DNA conc. w/in each sample (ie U,H,M for each sample normalized to lowest conc. of the three)

- mmix prep and plate layout here
7/05/10
Summary: notes re. water change and feeding larvae @ hatchery
- water change:
- each bucket is filtered through 48um screen to catch larvae
- larvae are rinsed from the screen into a beaker w/ some filtered sea water
- filter this small volume containing larvae through 200um mesh (to collect large debris, larvae will go through) - back into the 48uM screen
- clean larvae are rinsed from screen into beaker w/ water ~ 200mL vol
- bucket is rinsed w/ disinfectant and filtered sea water added
- then larvae in beaker are added
- feeding:
- pull algae from reservoir containing mixture
- do cell count - 100ul sample, then add water to fill line
- for 4 day larvae want 30k cell/mL
- had about 7mil cell/mL - added 45mL algae to each container
- NOTES and observations:
- didn't do cell counts on the larvae today
- for the vinclozolin tx. and control crosses looked good - meaning there were a lot of larvae and had a nice brown color (which says they're eating)
- a few of the larger larvae were stuck in the 200um mesh and they looked well formed and happy under the dissecting scope
- looked at the larvae for the 5-aza crosses under the dissecting scope and compound scope. they were tiny! ~70um (compared to 110 -120 for 'normal' 4 day) and kind of deformed (not round, may have deformed velum because they swam in tight little circles)
07/01/10
Summary: notes re spawning @ hatchery
- all surviving oysters were packed up (cooler w/ an ice pack) in baggies and driven to hatchery
- opened oysters from each treatment group and control and determined sex of each individual (small sample w/ transfer pipette under microscope). additional notes about gametes - some of the eggs were tear shaped, Joth was not too concerned about this, said they round up when you put them in the beaker in SSW. Results from sex determination here
- rationale for picking crosses:
- needed to do outcrosses since using inbred lines
- all 51 x 51 5-aza treated animals died, so needed to cross 5aza group w/ a control animal
- since wanted 'reps', 2 females w/ each male, decided on 35 x 51 crosses (i.e. could use 2 diff 51x51 control female w/ the 1 5-aza treated male)
- thought about doing 35 x 35 inbred crosses for back-up, to be able to do 2 treated parents for 5aza group - but sperm was not very viable (not a lot of movement under the microscope), so did not do those crosses.
- crosses performed found here - numbers correspond to #s on sex determination sheet.
- stripped all the female gametes first (scored w/ blade, then used water bottle to get gametes into beaker), then added filtered SW to ~250mL
- then did males the same way (NOTE: males were done at the end because contamination more likely)
- did cell count for each of the females and determined volume needed for ~ 500k eggs per cross (ended up adding half the vol - ~250k eggs based on Joth's suggestion. Numbers/vols can be found here
- plunged beaker w/ eggs, then aliquoted desired volume into a separate beaker and added filtered sea water to ~250mL
- determined sperm viability (% motile), then added 1 - 3 volumes of 2 mL transfer pipette (higher volume if less motile - Joth helped w/ this, I wouldn't have known what to do - but did 2 volumes for what I though was about 50% 'active' sperm.
- let the gametes sit together for a few minutes, then looked at a sample under the microscope
- eggs were quite rounded and each had a number of sperm around them - a good sign for fertilization!
- even the less active sperm from the 5aza group looked good under the microscope after fertilization
- filled up 3.5 gal buckets w/ seawater, added entire vol to each bucket.
- H20 will be changed and larvae fed on saturday, I'll go in Monday to change water and feed again
6/30/10
Summary: complete EtOH precipitation, qPCR w/ MSP primers for: hsp70, Cyp450, and macrophage exp. protein 1 - like protein
Procedure:
- complete EtOH precipitation: 15max spin, decant, add 500uL 70% EtOH, max spin 5 min, decant, solubilize in 15uL H20
- quant samples on nano drop
- normalize each sample to the lowest conc. (e.g. U, H, M for CL (control larvae) all normalized to 28.65ng/uL)
- prep mmix for 3 primer pairs: hsp70 (well E11 of primer plate: MG_gigas_F-R_20100105), Cyp450 (well B12 of hot64 primer plate), macrophage exp protein 1 - like protein (well D1 of hot64 primer plate)
- prep info here
6/29/10
Summary: stop digests from 6/28, initiate EtOH precipitation
Procedure:
- after 17h incubation, heat stop digests for 20 min: HpaII @ 65C, MspI @ 80C (NOTE: NEB website no longer states heat inactivation as being acceptable for MspI. I called and they said they had a new sensitive test - and while inactivation stops almost all activity, it won' stop all)
- added 5uL NaOAc and 100uL cold EtOH directly to reactions - and undigested samples and placed in -80 overnight
06/28/10
Summary: restriction digests of oyster DNA: larvae (control, 5-aza tx), adult (control, 5-aza tx), 35x51 line (SB R037 01 -jun 2010, WB RO51 - jun 2010), CO2 expt ('air' no stress, 'CO2' no stress)
Procedure:
- digested 1ug of DNA each for: HpaII, MspI and undigested
- prep info:

- incubate at 37C - start: 4:30pm
6/23/10
Summary: finish dot blot from 6/22/10
Procedure:
- followed Invitrogen's Western Breeze mfr. instructions for using a nitrocellulose membrane
- prepped 1:10,000 dilution of primary 5-MeC antibody (Diagenode) using the 1:5:000 solution from 6/18/10
- primary antibody incubation 1 hr
- development time: no color after 12 minutes, stopped reaction after 34 minutes
nanodrop results of pre-dilutions:
(the order of loading for each of these replicates is unknown unfortunately)

dot blot:

actual loads based on spec of pre-dilution:

Conclusions/Next Steps:
Positive and negative controls look good (fruit fly DNA is very light, even at 0.8ug ). The samples are not really visually different, based on the specs of the pre-dilution the samples were loaded at the same conc. Next step is to use ImageJ software to quantitate dots.
6/22/10
Summary: dot blot (probe for 5mC). samples: oyster larvae (5-aza treated and control) in triplicate, + control (mammal), -control (fruit fly)
Procedure:
- sample procedure as 6/17 except different dilutions (see below) each pre-dilution and dilution series (spike dilutions) were performed in triplicate for the oyster samples, single preps for +/- controls
- dilutions:

Next Steps: blot tomorrow
6/18/10
Summary: finish dot blot from 6/17/10
Procedure:
- followed Invitrogen's Western Breeze mfr. instructions for using a nitrocellulose membrane
- prepped 1:5000 and 1:10,000 dilution of primary 5-MeC antibody (Diagenode)
- cut membrane in half between row D and E and incubated one half of the membrane with each dilution of primary antibody for 1 hour
- inadvertently washed membrane w/ water (instead of wash solution) after the primary antibody was added - called invitrogen, they said to be safe I should reprobe with the antibody, since I saved the dilutions! I incubated for an additional hour with each of the primary antibody solutions, then continued as stated in the protocol
- developed for 10 minutes took photos, then washed in water to stop development and dried membrane.

Conclusions/Next Steps: The blanks look good, the positive control DNA is positive (no dose response though), also impt to note that I am not sure about the methylation status of this DNA (i.e. what tissue, cell line, disease state etc). The 1:10,000 dilution looks good. Will use that going forward. It's interesting that the oyster and mammal DNA show similar intensities, I would have expected the oyster to be less. Also very interesting to note that the treated sample is visably lighter at the 0.2ug concentration (maybe not as obvious for the others?), suggesting that the DNA of larvae treated w/ 5-azacytidine is less methylated. Next step will be to use software to try to quantitate these results.
6/17/10
Summary: dot blot 'take 2' w/ anti-5MeC. Samples: larval oyster expt (control and tx w/ 5-aza), mammalian pos. control DNA. changes: diff primary antibody dilution (1:5,000 and 1:10,000) and diff conc. of DNA on blot (start a little lower and increase range on low end)
Procedure:
- same procedure at 6/15/10, with the exception of different dilutions (table below), used screw cap tubes
- did not have the same problem w/ the manifold this time. Made tiny changes, put large piece of filter paper down under the membrane, instead of just a membrane sized one (thought maybe it made things uneven), tape for unused wells did not go over the edge of top piece (maybe it was keeping the seal from being tight?), not sure if either one of these things made a difference
- prepped 2 tubes for each dilution, so I can probe w/ 2 conc. of antibody:

- layout: column 1: blanks, column 2: mammal, column 3 control, column 4 treated. For DNA samples: Row A - D were the first set of dilution (A being the most DNA), Row E-G loaded the second set of dilutions (E being the most DNA).
- during cross-linking I manually set the time for 2 min instead of just hitting preset then start.
- dried membrane
6/16/10
Summary: dot blot part II - using Western Breeze kit
Procedure:
- followed Invitrogen's Western Breeze mfr. instructions for using a nitrocellulose membrane
- NOTE: the protocol specifies 2 protocols, 1 for PVDF and 1 for nitrocellulose. Called tech support to ask for their suggestion, not much of one, used nitrocellulose protocol because nylon does not need the prewetting in methanol step like PVDF
- prepped 1:1000 dilution of primary 5-MeC antibody (Diagenode) - incubation time: 1hr
- followed remainder of mfr instructions. took photos at 2min, 10 min and 30 min after chrom. solution added.
exposure time 10 min

Conclusions:
Good news, binding! Bad news, looks really blown out (no dose response). Will have to adjust dilutions. Surprised that the human DNA looks as dark as the oyster, but if it's just so blown out I may just not be seeing these differences. Regarding exposure time - 2min, I feel is too short for getting the whole membrane coated evenly, 10 min about right, 30 minutes was way over exposed with the concentrations I chose.
6/15/10
Summary:
A) dot-blot analysis for 5-MeC in larval oyster DNA exposed to 5-aza, larval oyster control, mammallian DNA (positive control DNA)
B) sample 5-aza treated oysters (adults 51x51 line) found dead today
A) Procedure:
- cut nylon membrane to fit 3 columns of 96 well manifold
- first attempt at running SSC through wells of 1st 3 columns, 2 of them were blocked, so I tried last 3 columns (10-12) and those pulled through ok so I used those
- soaked nylon membrane in 6x SSC for 10 min, prewet filter paper and placed on bottom of manifold, then pre-wetted nylon membrane and closed up the manifold - adjusted to be pretty tight (maybe too tight?).
- dilutions:

- boiled samples for 5 min in heat block (100C) --NOTE: used snap-cap tubes instead of screw tops, shoot. a few lids popped, but I monitored as best I could. samples that popped: control 3ug, control 1ug and treated 0.5ug
- placed samples on ice after boiling and sspin down before loading
- added 500uL 6x SSC to wells and adjusted vacuum to pull through in 5ish minutes
- then added all 200 uL of sample - w/ the exception of those that popped
- IMPT NOTE: some of the wells were clogged after adding samples even though the 6x SSC pulled through just fine. I pippetted the liquid up and down a bit, and vol finally went through - this took about 15 min though
- well set up: col 1: mammal DNA, col 2: control DNA, col 3: treated DNA, rows A and B were blanks (6x SSC), C=3ug, D=2.5ug, E=2ug, F=1.5ug, G=1ug, H=0.5ug
- placed membrane on filter paper wetted w/ denaturation soln for 10 min, then transfered to filter paper wetted w/ neutralization soln for 5 min
- let membrane dry (turn bright white again) on a piece of dry filter paper
- crosslinking:
- wrapped membrane in plastic wrap, placed in crosslinked DNA side up
- this was kind of a guess. the protocol I was using said use the mfr protocol, the UVP manual convinced me to use the default program (which was supposed to be 2 min at 120k J), but I think it only went 30sec, so I did 120k J for an additional minute.
B) Procedure/Results
found 4 dead oysters today from the 5-aza treated group (51 x 51) treated w/ 50mg/L for 13 days
two were pretty dead, didn't sample. two were 'freshly' dead, sampled gill and mantle (put in -80C box w/ pilot samples). stored all 4 animals in -20
NOTE: 1 more almost dead, discovered later. couldn't really keep it's valves closed, but the adductor was still pulling a bit. sampled gill and mantle. put sample/oyster with the other samples

6/14/10
Summary: solution prep for dot blot
20X SSC
198.6g NaCl
100g sodium citrate
pH adjust to 7.0
QS to 1.133L
Denaturation Solution (1.5M NaCl/0.5M NaOH)
21.9g NaCl
5g NaOH
QS to 250mL
Neutralization Solution (1M NaCl/0.5 M Tris-Base, pH 7.0)
(note: solution called for Tris-HCl)
14.6g NaCl
15.2g Tris-Base
pH adjust to 7.0 using conc. HCl
QS to 250 mL
all solutions stored @ RT
6/9/10
Summary: run gDNA from oyster larvae (extracted by Sam 6/8/10) to assess quality
Procedure:
loaded 250 ng DNA from control and 5-aza treated oyster larvae on 0.8% agarose gel.
Results:

Conclusion/Next steps: looks great, can go forward w/ dot blot procedures and making bisulfite treated SOLiD libraries.
6/7/10
Summary: visual inspection of larvae treated w/ 5-aza, then started DNA isolation of samples
Procedure:
- observed larvae under dissecting and compound microscope.
- filtered larvae (~ 15 larvae/mL * 500mL ~ 7.5E3 larvae total) from the control and treatment flasks into 1.5mL centrifuge tube by filtering through 80mm mesh screen then pipetting/scraping larvae into tube. Had about 300uL of H20 on top, so centrifuged at 10k g for 5 min and decanted liquid by pipetting.
- Weight of the larvae was 90 mg for control and 160 mg for treated sample. This is higher than recommended for procedure, but some weight is water and some weight is shell so went forward w/ protocol as stated
- added 0.5mL DNAzol and 20uL proK (from Qiagen kit) to each tube and incubated overnight.


Observations: much easier to tell if alive or dead under compund scope. Even when they are not actively swimming, you can see moving internal structures. Did not observe any difference between control and treated samples. Maybe fewer moving in the treated samples, but I don't know how to quantify that. Will need to figure out for next time.
Next Steps: finish isolating DNA.
6/3/10
Summary: treatment of larvae w/ 5-azacytidine
Procedure:
- pulled 1L total H20 (concentrated larvae in bottom of 'flask') from container E and F (estimated to be 60larvae/mL)
- did an initial count, average of 3 wells, at ~ 34 larvae/well, 2mL/well ~ 15 larvae/mL
- split the volume into 2, 500 mL flasks
- added 0.026g 5-azacytidine to 5mL DI H20 mixed until went into solution and added to 1 flask for a final conc of 50mg/L
- added 5mL DI H20 to control tank
- put 2 mL/well into 3 wells each for treatment and control for pictures and observation
- difficult to get homogeneous samples
- many larvae appear dead because they are sitting at the bottom (but that does not mean they are dead if they are not swimming)
top: control, bottom: treated. Images taken using Friedman lab dissecting scope


5/26/10
Summary: finish DNA isolation of gill samples from 5-aza pilot study, restriction digests, run on gel
Procedure:
DNA isolation:
- see 'Samples for DNA Isolation' entry 5/25/10: 9 samples total
- followed mfr protocol - spin 10min/10,000g, move supe to new tube, add 1mL 100% ethanol, spin to pellet, wash 2x w/ 75%EtOH, solubilize in 300uL 8mM NaOH and 40uL 1M HEPES (for pH adjust).

abs at 230 high. Ethanol carryover?
Next Step:
Go forward with digests - HpaII, MspI for all samples
Restriction digests
(also included Amanda's samples)

- digested for 4 hours at 37C, stopped digest w/ loading buffer.
Results:
Gel
0.8% agarose, half of digest loaded (25uL ~ 0.5ug), EtBr gel, 1h/100V
labels: U - undigested, H - HpaII, M - MspI

original images in: Dropbox>Lab>Mac>052610gel
Conclusions:
DNA isolations look pretty decent, still some smearing for undigested. If de-methylation was occurring as expected, I would expect to see the HpaII smear shift closer to MspI w/ more time in treatment. This is qualitative so hard to read. Maybe 120h? but less DNA in these wells and 144h looks similar to others.
Next steps:
Maybe bioanalyzer - crap, I knew there was a reason I should have heat stopped those. Maybe loading dye doesn't matter for bioanalyzer??
05/25/10
Summary: attempt at DNA isolation of 5-azacytidine pilot samples, dose oyster larvae w/ 3 conc. of 5-azacytidine to observe behavior/mortality, re-start DNA isolation
Samples for DNA isolation:
5-azacytidine pilot study w/ juvenile oysters. Six day trial w/ treatment being refreshed every other day (100mg/L in a total of 2L):
control (24h), treatment (24h, 48h, 72h, 96h, 120h, 144h), treatment -> 'fresh' H20 (non treated) (48h treatment/24h fresh, 48h treatment/48h fresh)
Procedure:
DNA isolation: using DNAzol, followed mfr protocol using proK step for homogenization (0.5mL DNAzol, 20uL proK from Qiagen kit (conc.?)) overnight -started 5/24/10). After proK, still had a lot of tissue that was not homogenized. Solubilized in 8mM NaOH. Spec showed low to no recovery. Not sure what happened exactly, but I am positive that I started w/ too much tissue. Will repeat with 0.3ug (measured) to make sure.
larvae/5-azacytidine: aliquoted ~ 10 larvae in 2.8mL seawater into 6 wells of a 12 well plate (this is hard to do, w/ low conc. of larvae to get the same # per well, did a lot of pipette transferring then volume modification). Time of prep: 11:30am
- evaluated the number of dead/alive larvae (determined simply by movement of cilia - also not sure I'm doing this right)
- control 1: 1dead/10 alive
- control 2: 2 dead/ 18 alive
- control 3: 2 dead/9 alive
- 100mg/mL 5aza: 6 dead/9alive
- 50mg/mL 5aza: 4 dead/ 9 alive
- 20mg/mL 5aza: 1 dead/11 alive
- Added 200uL seawater to 3 control wells.
- Using a 5mg/mL stock (6.6mg in 1.3mL seawater) of 5-azacytidine added the following conc. to 1 well each
- 100mg/L: 140uL H20, 60uL stock 5aza
- 50mg/L: 170uL H20, 30uL stock 5aza
- 20mg/L: 188uL H20, 12uL stock 5aza
- at 5:30 I checked each well with a dissecting scope - all 6 wells looked happy and alive
- will check again tomorrow
- weighed 0.3 ug gill tissue, digested at RT (spinning) overnight w/ 0.5mL DNAzol 20uL proK (from Qiagen kit)
04/29/10
Summary: restriction digests: fruit fly, urchin, human, oyster
Procedure:
NOTE: urchin DNA reading was not accurate, so for today's digests I added the same vol. of sample as I did for the fly. This is just and estimation. Will need to re-isolate using a diff. kit
Dilutions:

- performed 2 hr. digest at 37C
- gel: 1.2% agarose

04/28/10
Summary: Isolated gDNA from fruit flies and sea urchin tube foot
Procedure:
- added ~30mg frozen fruit flies to 1.5mL tube. Added ~35mg sea urchin (S.purpuratus) tube foot tissue to 1.5 mL tube
- followed Qiagen DNeasy procedure (incubated in ATL/pK solution for 5 hours)
- eluted w/ 100uL AE buffer (eluate for urchin tube foot was quite purple)
- spec'd on ND
NOTE: also did quant of human DNA received from an outside source


I think the purple color is affecting absorbance. Would like to re-try using Power Soil or Stool kit. Other samples are ready for digestion. Will do digestions of all samples tomorrow.
4/23/10
Summary: gel image of fruit fly DNA (* see below, fruit fly DNA was obtained from Genome science) and oyster samples (oyster DNA was isolated around August 09)
digests performed by Sonia, gel run by Sam
Results:

4/01/10 - 4/04/10
Field data April 2010
data sheets
2/12/10
Summary: qPCR (x2) - MSP primers and BSP primers (w/ CCGG restriction sites), samples: digested oyster samples 'neat' and EtOH precipitated
Procedure: layout, primers, samples here and here
2/9/10
Summary: repeat PCR from 2/8/09 using qPCR include 2nd round digests. Second qPCR w/ additional primers also performed
1st qPCR Procedure:
- heat inactivated 2nd round digests 80C/20min MspI, 65C/20min HpaII
- qPCR using primers A4 and A11 - included BB02 1st and 2nd round digests 1ug/10U enzyme, and EtOH precipitated sample -layout here
- primer set A4 not methylated. Undigested sample shows amplification, HpaII and MspI do not
- primer set A11 - no amplification for any of the samples (this is in contrast to PCR results where expected band was apparent)
- concluded that primer set A4 (hsp25, EW777519) is not methylated
- possible mmix prep issue? No amplifcation for undigested conflicts w/ PCR results from 2/8/10. Should repeat to confirm.
- repeat A11 primers and run additional primers that have shown positive amplification: A10, A12, B1, B2, B3, B4 - layout here
2/8/10
Summary:run PCR samples from 2/05/10 on gel
Results:

Conclusions:
- still getting partial digestion. did some "Googling" and other people have had this issue. No great solutions, though recommended redigesting a portion of the original digest
- definitely got better digestion (qualitatively) doing digests overnight - starting material (fresh v RNAlater), and unit enzyme (10 v 20) did not have an effect on the digest
- EtOH precipitation after digestion may reduce the non-specific bands. Definitely looks like it w/ primer pair A4, but not as much for primer pair A100
- Originally had predicted that primer pair A4 (hsp25) was unmethylated and primer pair A11 (focal adhesion kinase) is methylated. At least qualitatively, this appears to be the case. For A4 the Hpa and Msp band intensities are similar indicating they both cut the same extent, For A11 Hpa and undigested intensities are the same indicating that Hpa could not cute due to methylated status. Because there is a similar pattern for all 6 batches of samples, I believe the result is due to the digest and not based on amount of input DNA.
- Maybe try qPCR with these primer pairs and EtOH precipitated samples to see if if there is a better way to analyze this "partial" digestion.
2/05/10
Summary: EtOH precipitate restriction digests from 2/4/10, run test PCR with 2 primer sets A4 and A11.
Procedure:
EtOH precipitation: for one batch of restriction digests with 1ug DNA/10U enzymes, did an ethanol precipitation. 50uL sample, 5uL NaOac, 100uL EtOH (ice cold), -20C for 1 hr.. spin max 15 min, decant, wash 500uL 70% EtOH mix max 5 min decant, 30uL H20 final volume. NOTE: also tried to EtOH undigested PCR samples (primers AJ_8882, AJ_9316 from PCR performed 2/1/10), but only had 5uL starting material and recoveries were really bad (see quant below).

PCR procedure: used primers A4 and A11 previously gave single band at expected size.
see layout and mmix prep here
Conclusions:
Not great recoveries from EtOH precipitation, start w/ 2ug next time. Used 1ug DNA, so expect 20ng/uL for final concentation in 50uL of digest material - so these are kind of close to expected. Undigested sample for Adult gigas 1 did not get any recovery, and low recovery for MspI BB02.
Next Steps:
Run gel
2/04/10
Summary: run Amanda & Mac side-by-side PCR and some PCR from 2/010/10 on gel. Prep restriction digests
Results for Gel:

Labels: U=undigested, H=HpaII, M=MspI; Primer ID numbers are the first 2 letters and last 4 numbers of NCBI Accession
AJ_2213: AJ12213 pgm gene, AJ_3432: AJ543432 tolloid like exon 1-18, AJ_9910: AJ579915 IRP1, AM_5551: AM265551 mtIV, AY_0003: AY660003 CAA gene
NOTE: I may have overloaded well 8 on the top which could have contributed to band in lane 9 H20
Side-by-side PCR shows contamination in H20 for at least 1 of Amanda's samples (the other one is possible overload of adjacent well). I don't think the contamination accounts for the presence of the bands in U and H wells as band intensity is much greater, prior to this run U and H did not have bands in consecutive PCRs. Next step is to repeat PCR to get clean water. Cause for no bands in previous PCRs undetermined.
For testing new primer sets, results are not as expected. For AJ_2213, the primers do not amplify, for AJ_3432 band is the correct size for U (686bp), but additional bands in H and M, for AJ_9910 the band should be 870, and did not get expected size, for AM_551 band is expected size (415 bp), U and H have additional band right below main band. AY_0003: U has expected band size (542 bp), but very faint, M does not show a band at that size, and H shows many bands.
Conclusion:
The restriction digests are not working as expected. Enzymes appear to work as Sonia has used them this week. Likely incomplete digestions, or possible sequences are wrong and no restriction sites exist in target sequence. The latter is unlikely because all of the primer sets show same results. Other troubling thing is presence of extra bands in digest gel. DNA is not purified after restriction digest and possible that buffers/enzyme mix is screwing up PCR conditions.
Next steps:
Run restriction digests overnight. Include enzyme/buffer only controls. Ethanol precipitate DNA prior to use in PCR
Procedure Restriction digests:
prepared restriction digests for 2 oyster gill samples BB02 (Jun09) and adult gill gigas 1 (BB02 stored in RNAlater prior to isolation, adult gigas gill 1 was isolated directly (oyster from tank in basement of FISH))
3 digest sets set up:
2 of them were 1ug of DNA and 10U of enzyme. This is the normal set-up. Performed in duplicate because I will EtOH precipitate 1 batch of these. The 3rd batch used 1ug DNA, 20U enzymes.
All digests were incubated at 37C for 16hr, then heat inactivated for 20 min (HpaII 65C, MspI 80C).
see preps here
2/03/10
Summary: side-by-side PCR w/ Amanda to troubleshoot differences in PCR using A3 primers (see Amanda's notebook for description)
Procedure:
Use A3 primers and make 2 mastermixes. 1 to use 1uL template, 1 to use 2uL template both in 25 uL rxn using 1x Apex mmix and pooled BB sample.
2/01/10
Summary: PCR, testing primers for genomic DNA sequences. Nine total.
Procedure:
mastermix and plate layout info - here
Results:
1/25/09
Summary: qPCR to check for completeness of restriction digests performed 1/22/10 (see Amanda's notebook)
Procedure:
- pooled BB01 and BB04 digests for undigested, HpaII digested and MspI digested
- chose 4 primer sets that showed amplification from the Cgigas hot 64 plate (primer sets A3, A4, A10 and A11)
- prep info for mmix and plate layout - here
- after qPCR, Amanda ran out products on a gel
primer A3: U, H and M were "positive" (showed amplification). The H amplified after the U, but before the M.
primer A4: U positive, H negative, M negative
primer A10: U, H and M were postive, although H & M amplified later
primer A11: U, H and M were positive - but H and M were quite late.
Results of Gel:
see Amanda's notebook for 1/25/10
primer A3: U, H and & M were positive-band size as expected
primer A4: U positive, H negative, M negative - band size as expected
primer A10, U, H and M were positive (although qualitatively, H and M may have been a bit less intense) - band size as expected
primer A11: U and H postive, but M was negative - band size smaller than expected: ~400bp not the epected 672 bp
Conclusions:
The goal of this PCR was to repeat the initial experiment with longer digestion times to see if partial digestion (assumed to be the issue with the first experiment (11/23 - 12/02) could be overcome. The results are not that straight forward however.
The results for A3 are not surprising as the amplicon does not contain a CCpGG restriction site. I originally had thought this was a methylated site based on qPCR because H had amplified later with M. I think this result shows me that qPCR should probably be used for analysis once the primer sets have been validated using qPCR
The results for primer set A4 are as expected for complete digestion. U is positive and M is negative. H is also negative indicating that the site is not methylated. The band size is as expected, so I can confidently say this site is not methylated. - Both qPCR and gel told me the same thing
The results for A10 indicate that something is not working since M is positive. Either a) there is partial digestion at this site, which I feel is less likely since primer set A4 showed complete digestion or b) the sequence does not contain a restriction site. The band is the correct size, so it is likely the expected amplicon. However, there could be differences in the sequence at the restriction site in this sample (i.e. 1 or more of the 4 base pairs CCGG is different). We could sequence this band to check.
Next steps:
- for this type of exploratory investigation I think conventional PCR is more appropriate because it is important to verify band size
- In order to a primer pair to be confirmed as "working" it must meet the following requirements: U is positive, M is negative, band size is as expected
- the undigested band for "working" primers should be cut out and sequenced for verification. the undigested band where Msp is positive, and band is the correct size should be cut out and sequenced to determine if restriction site is present for troubleshooting purposes.
- next step: repeat these primers, plus other potential working primers. Primers to be deemed working if they meet requirements listed above and start cutting out bands and saving at -20C
1/6/09
Summary: there are a few diff methods, days used to experimentally evaluate DNA methylation. Will keep a running tally here: Dropbox>Lab>Bioindicator>Methylation>Summary of Experimental Results.
To date, it looks like this:

there are more primers that worked for the restriction digest PCR that did not show DNA methylation. Still need to add those to the table.
12/30/09
Summary: sequencing results for bisulfite treated and non treated samples
NOTES:
In general, designing bisulfite primers is not easy. My first mistake was assuming I could use the same primers for the treated and non treated sample. The bisulfite treated samples have no cytosines (except for the methylated C's at CpG sites), so the original sequence is all T, A and G. The reduced complexity makes it hard to design unique primers. I found at least 1 program that will check primers against genomic data bases, but of course it's only for human and rat databases

For primer pair H5 (EST: AM858698), both treated and non treated samples matched up the expected amplicon. The top blast hit for this contig in the Signae db is for human neuromdin-u receptor. 1 of 7 CpG sites is methylated. Image below is using Kismeth tool. I've been playing around w/ it and it appears that it can not "BLAST" a large sequence, but if you put in the extracted original sequence and the bisulfite treated sequence, it will show matches, make dot plots etc. This tool was designed for plants, so it also looks for methylation at CHG and CHH sites.

For primer pair L1, the treated and non-treated did not match up w/ expected, however the nontreated band L1a matched up w/ a bisulfite treated sequence from band L1b. It is no longer possible to tell if this sequence came from a "high CpG" sequence or low CpG sequence, because they don't match w/ expected and there are no good BLAST hits for this squence - but when the 302bp sequences are compared to each other, only 1 C is not converted. Hard to tell if this is a CpG site, since do not know directionality of sequence.

For primer pair L2 (EST: AM860932), a portion of the sequence from the bisulfite tx L2a band aligned w/ the expected amplicon. The non-tx sample sequences apparently amplified something non-specific. For this region 95bp there were 2 CpG sites, and 1 appears to be methylated. This top BLAST hit for this contig according to the Signae db is for a human bromodomain adjacent to a zinc finger protein.

A few of the other band sequences had good hits in the the Signae contig database to CX069161. I checked the sequence in NCBI BLAST for vector contamination and there was a strong match in the regions that overlapped w/ my sequences. Maybe just incomplete trimming by geneious for for sequences.
Conc./Next steps:
Only 2 of the primer pairs (H5, L2) matches with the expected amplicon.
Going forward, will design primers using genomic sequences instead of ESTs. Will design 1 set of primers for the bisulfite treated sample using MethPrimer, will design regular primers outside of the expected amplicon region for the non-treated sample. Will run PCRs with these new primer sets. I still expect there will be non-specific binding with the MethPrimers since there is no way to check specificity, but hopefully will have more luck this time. Using genomic sequences will help since won't have an issue w/ running into introns.
12/23/09
Summary: purified plasmid preps and submitted for sequencing
Procedure:
Decanted ~1.5mL broth from each tube into microcentrifuge tube and spin max speed 1min. Remove supe. Decant an additional ~1.5 mL broth into tube, spin max 1min. Decant supe. Follow instructions for Qiagen's Qiaprep Spin Miniprep kit (Isolation of plasmid DNA from Agrobacterium using the QIAprep Spin Miniprep Kit (spin procedure). NOTE: did not perform step 10 which is a wash w/ Buffer PB.
After purification submitted samples in duplicate using both forward and reverse M13 primers.
12/22/09
Summary: cloning of bisulfite treated samples cont. from 12/21/09. Picked colonies, re-streaked, anayzed transformants by PCR (M13 primers), inoculated liquid broth with chosen colonies.
Procedure:
- lots of blue and white colonies on plates (more blue than white though)
- Prepped Mmix for analysis of transformants using M13 primers (NOTE: decided to use M13 foward & reverse (instead of 1 gene specific primer) so I didn't have to make 6 independent mmixes and screw up which samples went where)
- prepped 60, 50uL rxns
- Apex mix 25uL x 60 = 1500
- M13 Pf (20uM from kit) 0.3uL x 60 = 18uL
- M13 Pr (20uM from kit) 0.3uL x 60 = 18uL
- H20 24.4uL x 60 = 1464uL
- prepped 60, 50uL rxns
- added 50uL per well to 58 wells (56 samples, 2H20)
- picked 4 white colonies each plate and restreaked onto gridded plate (total of 56) using toothpick
- then placed toothpick into well of PCR plate
- PCR cycling parameters
- 10min 95C
- 40cycles:
- 30 sec 95C
- 30 sec 55C
- 120 sec 72C
- 10 min 72C


for the BSP samples, it is curious to note that for the L5 primers the band sizes are not the same for bisulfite tx. samples and the non-bisulfite tx samples (~250bp and ~550bp respectively). Selected at least 1 colony per primer pair for a treated and untreated sample. Also selected a few extra ones where band sizes were different between replicates. Final selection: L1a, L1b, L1d, L5d, H5b, H10a, H10b for bisulfite treated and L1a, L2a, L5a, H5a, H5c, H10a for non-bisulfite treated.
for Sepia samples, selected the following colonies per request by SBR: retinab (Rb), find (Fd), ventral mantle center top (vmcTb & vmcTd), vmcBc, vmcBd
Next step: the restreaked plates had been incubating at 37C since ~9:30am. At ~ 3pm I added 5mL liquid LB broth + 50ug/mL Kan to individual tubes then used a toothpick to innoculate broth w/ the selected re-streaked colonies. tubes were placed in 37C shaking at 250rpm to incubate over night
Next steps: tomorrow will purify plasmids for sequencing.
12/21/09
Summary: initiate cloning of PCR products from bisulfite treated and non-bisulfite treated C.gigas gDNA. Run PCR samples from Sepia PCR (see results in 12/18/09 entry)
Procedure:
- thaw bands, transfer to ultra-DA purification tubes, spin at 5000rcf for 10 min
- warm plates to RT
- prepare cloning rxn (final vol =4uL v. 6uL as stated in protocol), varied amount of sample added based on band intensity (>intensity, <vol.):

- rxns incubated at RT for ~ 12min, then placed on ice
- add 2uL rxn to vial of compentent cells (vials - purple cap, stored at -80C thawed on ice, then 2uL added when cells are just thawed (move quick!), then back on ice)
- incubate on ice for ~20 min
- heat shocked at 42C for 30 sec, then back on ice quickly
- add 250uL RT SOC medium, roll tube to coat in entirety
- incubate tubes horizontally at 37C for 1 hr, at 225rpm
- in the meantime, added 40uL of 20mg/mL X-gal onto 15 plates then dried at 37C (lids off)
- after incubation spread 100uL of each cell broth onto plate
- incubate at 37C overnight
12/20/09
Summary:run PCR products from 12/18/09 on gel


Results: still multiple bands even at a higher annealing temp. cut out bands from L2 and H10, but the same bands were present on the gel from the 18th and were brighter bands, so probably will not try to clone anything from this gel.
12/18/09
Summary:
1. run PCR products from 12/17/09 on gel.
2. Repeat PCR using BB06 sample (Jun09) for 10 of the primer sets that showed 'some promise', and increase annealing temp to 60C, increase rxn vol to 50uL, use Opticon for running PCR.
3. Run PCR using Sepia samples/primers
1. Gel Procedure:
- prepped 1.2% agarose gels (2 total: 150mL lg box, 100mL small box)
- loaded entire volume into well
- ran gel @ 100V ~ 1hr, loaded 5uL Hyperladder in each row.
gels are labeled as primer pair (primers 1 - 10 of either L=low CpG class or H - high CpG class_expected band size). order of samples is bisulfite treated, non-bisulfite treated and H20


- Cut out bands for bisulfite and non-bisulfite tx samples for the following primer pairs: L1, L2, L3, H5 & H10. Probably should have cut bands out for H6, unfortunately did not.
- normalized conc. of bisulfite treated and non-bisulfite treated gDNA for BB06
- bisulfite tx: 54ng/uL
- non-busulfite: 2.8uL @ 477ng/uL, 22.2 H20 = 25uL @ 54ng/uL
- prepared 50uL PCR reactions using Apex PCR mmix:
- 25 uL Apex mMix/rxn x 32 = 800uL
- 22 uL H20 x 32 =704uL
- added 47uL of mastermix to each of 30 wells
- added 2uL 10uM primer stock (F &R mix)
- added 1uL of either bisulfite treated gDNA, non-bisulfite treated gDNA or H20
- in summary - each of the 20 primer pairs had 3 rxns total: bisulfite, nonbisulfite for H20
- ran 96 well plate Opticon
- 10min 95C
- 40cycles:
- 30 sec 95C
- 30 sec 60C
- 60 sec 72C
- 10 min 72C
- forever 4C
- OBSERVATION: non-bisulfite tx samples for H2 and H3 had evaporated after PCR
3. Sepia Gel Results
(see layout under procedure)

Conc./Next Steps: Not really what I expected. Multiple bands and banding pattern was not the same between bisulfite tx. and control for most of the samples. Not sure if this has anything to do w/ quality of bisulfite tx. DNA? or the strange A260/A280 ratio for the bisulfite tx. samples (~3)? Will repeat PCR w/ 5 primer pairs from each of the 2 classes (high CpG and low CpG). Primer pairs were chosen if they had bands of the same size in the bisulfite tx and non-bisulfite tx samples.
12/17/09
Summary: reconstituted primer plate for BSP primers and made working stocks. PCR w/ each of the 20 primer sets using BB07 (Jun09) gDNA and BB07 bisulfite treated (see entry 12/10/09) gDNA.
Procedure:
- reconstituted 10nanomolar primers in 100uL H20
- prepared working stocks of primers in a 96 well plate 10uL F primer, 10uL R primer, 80uL H20 for 10uM conc for each.
- normalized conc. of bisulfite treated and non-bisulfite treated gDNA
- bisulfite tx: 17uL @ 66.5ng/uL, 5uL H20 = 22uL @ 51.4ng/uL
- non-busulfite: 6.5uL @ 393ng/uL, 43.5 H20 = 50uL @ 51.4ng/uL
- prepared 25uL PCR reactions using Apex PCR mmix:
- 12.5 uL Apex mMix/rxn x 62 = 775uL
- 10.5uL H20 x 62 = 651uL
- added 23uL of mastermix to each of 60 wells
- added 1uL 10uM primer stock (F &R mix)
- added 1uL of either bisulfite treated gDNA, non-bisulfite treated gDNA or H20
- in summary - each of the 20 primer pairs had 3 rxns total: bisulfite, nonbisulfite for H20
- ran 96 well plate in thermalcycler (w/broken lid)
- 10min 95C
- 15 sec 95C
- 30 sec 55C
- 60 sec 72C
- 10 min 72C
- forever 4C
- OBSERVATION: non-bisulfite tx samples for H2 and H3 had evaporated after PCR
12/11/09
Summary: designed primers to assess methylation status of 20 C.gigas genes (10 low-CpGo/e contigs, 10 high-CpGo/e contigs)
Notes: Started out by only using contigs w/ sequence lengths >800bp. High CpG ratios were chosen w/ a cut-off of 0.8. Low Cpg ratios started w/ cut-off of 0.2, then ended up choosing contigs w/ ~ 0.4 CpGo/e since couldn't design suitable primers to find CpG's if there were very few present. Used MethPrimer to design Bisulfite sequencing PCR (BSP) primers. This means there are no CpG's in your primers (so amplifies bisulfite converted and non-bisulfite converted gDNA equally), and amplicon contains a relatively high number of CpG sites to investigate methylation status). The paper that discusses MethPrimer for BSP (Li & Dahiya, 2002) mentions that it is hard to amplify long stretches of bisulfite treated DNA so targets amplicons of <300bp and that primers for BSP are typically a bit longer.
Excel table w/ chosen contigs and primer sequences can be found here.
12/10/09
Summary: Bisulfite conversion of gDNA from 8 C.gigas samples collected in Jun09
Procedure:
samples were selected to be ~same conc. with A260/A280 ~ 1.9
followed mfr protocol for Qiagen EpiTect Bisulfite kit:
- before starting
- added ethanol to Buffers BW and BD per instructions
- reconstituted carrier RNA w/ H20 to 1ug/ul (stored excess in 50uL aliquots in -20 kit components box)
- added 50uL carrier RNA to 5 mL buffer BL (per protocol for 8 samples)
- dissove bisulfite mix (1 tube) w/ RNAse free water
- add DNA solution and H20 to a final vol of 20uL and a total of 1.75 ug (protocol can go up to 2 ug) in 0.2mL tubes

- add 85uL Bisulfite mix and 35uL DNA protect buffer to each tube. Green DNA protect buffer turns blue when added as expected.
- mixed then placed in thermal cycler, followed mfr protocol (page 17 of handbook, saved profile in MAC>BISULFITE)
- 5min, 99C
- 25min, 60C
- 5min, 99C
- 1hr25min, 60C
- 5min, 99C
- 2hr55min, 60C
- after incubation finished w/ cleanup of bisulfite converted DNA in protocol pages 18 -19
- NOTE: used buffer BL w/ 10ug/mL carrier RNA although adding carrier RNA is not necessary when DNA is >100ng
- NOTE: eluted in 20uL 2 times: the following quantitation is with the first 20uL elution (the second elution was not combined, see quant values in Amanda's notebook 12/11/09)

Results:
- yields: ~ 1.3ug ssDNA yielded from 1.75ug dsDNA starting material
Yields are normal (per Qiagen tech support). The A260/A280 ratio is very high for all samples (~3), did some searching and not sure what causes this. Called tech support and they are not sure either. Suggested it may an artifact of high absorbance values and to dilute samples and quant again. Not sure if that would work since original sample A260/A280 ratios had higher overall absorbance but ratio was ~2. Also suggested just going ahead to try out samples in PCR reactions. They would not recommend purification using one of their gDNA clean-up kits since would worry that ss DNA wouldn't stick to columns very well. Could do an ethanl precipiation.
Did not combine second eluate (conc. values very small), but may before running PCR to increase vol. (20 primer sets, so need > 20uL), do not think that diluting 1:2 would affect PCR.
Next step, order Bifulfite Sequencing Primers to amplify regions w/ CpG to asses methylation status by sequencing of cloned products.
12/03/09
Summary: qPCR w/ 19 primers designed to detect methylation
Procedure:
- sample is pooled (2 individuals) juvenile gill gDNA (either undigested, HpaII digested, or MspI digested)
- plate layout
scoring of wells
observations:
-many of these primer pairs showed no amplification (intron?)
-for those that did show amplification: primer pairs E9 and E11 it does not appear that there is any methylation at these sites as the Ct's are the same for the HpaII and MspI digested samples.
Conclusions/Next Steps:
None of the primers tested here appear to be methylated at the restriction site, indicating that it is unlikely these regions are methylated at the restriction site. Now that all primer sets have been tested will go forward w/ PCR of gDNA using the primers for regions that appear to be methylated following this analysis, controls using primers from putatively unmethylated regions will be included.
NOTE: based on data from CpG o/e ratios, it appears that immune related genes primarily fall into the "unmethylated region" (high CpG o/e), therefore it seems reasonable that only 2 genes were found to be methylated from this batch of genes since they are immune related (upreg in response to bacteria exposure). Also of impt note, out of the 64 primer pairs tested only 20 showed amplification in the undigested gDNA (introns?).
12/02/09
Summary: qPCR w/ 24 primers designed to detect methylation
Procedure:
- sample is pooled (2 individuals) juvenile gill gDNA (either undigested, HpaII digested, or MspI digested)
- plate layout
scoring of wells
observations:
-negative control was positive in well D8 (primer set C8)
-many of these primer pairs showed no amplification (intron?)
-for those that did show amplification: primer pairs C7, D1, D3, D6, D7 and D12 it does not appear that there is any methylation at these sites as the Ct's are the same for the HpaII and MspI digested samples.
Conclusions/Next Steps: None of the primers tested appear to be methylated at the restriction site. One set of primers (C12), should be repeated, because the undigested sample did not amplify (likely a loading error), however, because the Ct was the same for the HpaII and MspI digested samples, it is unlikely that this region is methylated.
11/25/09
Summary: results of assembly of oyster NGS data to DNMT sequences in other species
Table:

Next steps: some of these may not be real. Double check if alignments are good.
11/23/09
Summary: 1. quant RNA isolated 10/28/09 (Jun LC01 - 07, WB01-07), 2. run qPCR w/ 24 primers designed to detect methylation
RNA Quant Results:

RNA Quant Conc./Next Steps: With the exception of low A260/A230 ratios for WB05 and LC03 results look good. Next step is to DNAse these guys and continue w/ isolations of the additional 13 samples from each site.
qPCR to detect methylated cytosines in oyster gDNA
Procedure:
- restriction digests were performed using oyster gDNA and restriction enzymes HpaII and MspI (see Amanda's notebook 11/20/09)
- pooled juv gigas gill digests (#1 and #3 from Amanda's notebook entry) for 100uL total each for U (undigested), H (HpaII digested), and M (MspI digested)
- reconstituted 64 primer pairs w/ 100uL H20 each well. Made 10uM working stocks of Pf and Pr by adding 10uL of stock (100uM) to 90 uL of H20. Then realized it would be easier to add the Pf and Pr into one plate resulting in 200uL total volume at 5uM each primer.
- Prepped qPCR plate: can run 22 primer pairs w/ 4 conditions each: U, H, M and H20 blank
- Ran normal SYBR 55degree melt 2 reads protocol - but extended extension time to 1 min (most product should be 600 - 800bp)
- scoring results and some observations:results
- 8 primer pairs did not have products for any condition - even undigested. Not sure why, introns??, may look into sequences
- 2 water blanks showed amplification, bummer. Not mmix contamination since the other 22 blanks were negative as expected.
- looks like there may not have been complete digestion - MspI should have been able to cut @ all restriction sites regardless of methylation status. Therefore, expect no product.
- these are more difficult to "score" than I thought - late amplification and wonky melt curves make for difficult interpretation
- mis-scoring! wells E3, F3, G3 are all negative. Blank in H12 is negative.
- Further analysis regarding incomplete digestion: If digestion was incomplete - one would still expect a decrease in amount of product produced because some proportion would be digested. So I've reanalyzed some of the positive wells based on the Ct value compared to the undigested samples. Looking at the results in this way, it appears that 2 genes are likely methylated. Primer set A3 (accession: EW777507, cAMP-responsive element binding) and A11 (accession: EW777781, focal adhesion kinase (FAK)) show similar Cts for undigested and Hpa I, but the Ct for Msp is about 4 -5 cycles later in both cases. This shows that there was no digestion w/ HpaII and some digestion for MspI. In other words, the gene is likely methylated because HpaII could not cut at that site and MspI could (just not completely). All of the other primer sets that showed positive results had a different profile for the Ct values. The Ct for HpaII and MspI was the same, but the undigested sample came up 4-5 cycles earlier for each case. In other words, this gene is likely un-methylated because HpaI and MspI could cut at that site (just not completely).


- furthermore, the genes predicted to be methylated have a low CpGo/e as expected. Two of the predicted un-methylated genes have a CpG o/e close to 1 as expected.

Next steps:
- Run some of these products on gel: primer pair: A6 (well: A6, B6, C6 and D6), primer pair B2 (well: E2, F2, G2, and H2), primer pair B4 (well: E4, F4, G4 and H4) and primer pair B6 (well: E6, F6, G6 and H6)
- perform another digestion - run longer or less DNA.
11/06/09
Summary: run gels of sample digested 11/05/09
Results:


11/05/09
Summary: prepare fresh gDNA samples from juvenile and adult C.gigas. Perform restriction digests using HpaII and MspI to evaluate for presence of methylated DNA.
Purpose: In response to yesterday's digests, it looks like starting gDNA for C.gigas samples (see undigested lanes) was already pretty degraded, which may make it difficult to interpret differences between HpaII and MspI digests. So, preparing fresh samples from different life stages and tissues of C.gigas
Procedure:
- isolate gDNA using Qiagen kit from the following samples:
- 2 juvenile oysters: 1 from North Bay Oct sampling (gill and mantle), the other is from NB or WB (gill, mantle and muscle)
- 2 adult oysters: adult gigas 1 (gill and digestive gland (d.g.)), adult gigas2 (gill, mantle and d.g.)
- 1 mussel: gill
- sea urchin tube feet (remaining tissue from Mon stored at -20C
- lysis time: 85minutes, elution volume: 100uL
- quantitate:

- something happened to sea urchin sample. after lysis, noticed there were some spines in sample instead of just tube feet - could have impacted soln?? did NOT go forward w/ digestion of this sample
- perform digests at 37C for 2 hr. prep notes here
- prepped 2 @ 1.2% and 1 @ 0.8% agarose gels
- stopped digests w/ stop solution, vortexed, spun down and stored w/ gels at 4C
- will run samples tomorrow.
11/04/09
Summary: repeat digests of sea urchin and MG_gigas sample from 11/02/09. Additional samples were also run (DNA from Friedman lab): various oyster species, clam, mussel and crab
Purpose: Repeat C.gigas sample from 11/02 w/ sea urchin control (partially methylated) and crab control (insect type is minimally methylated). Include additional bivalve samples for comparison.
Sample information:
- sea urchin: tube foot prep from 11/2
- MG_gigas: gill pool (see 11/2)
- crab: tanner crab gDNA (LC 2008)
- all others: pools of 5 animals extractions performed in 2003
- quant gDNA from new samples:

- prepared 50uL digests:
- incubate at 37C for 2 hrs. Stop digestion w/ 10uL 'stop solution' 50%glycerol 50mM EDTA (pH8). 0.05% bromophenol blue
- load onto 1.2% agarose gels.
- for sea urchin, MG C.gigas and mussel loaded 45uL (top 2 images)---> 0.75ug total loaded, for all other samples (bottom 2 images) loaded 55uL ---> 0.9ug


Conclusions/Next steps:
-
11/02/09
Summary: restriction digest w/ HpaII and MspI: C.gigas, herring, sea urchin, C.viriginica
Purpose:
Based on results from Imprint kit (10/29/09), it appears that either oyster samples are inhibiting the assay or there is a undetectable amound of methylation in the samples using this assay. In order to evaluate methylation status of oyster samples, will run a restriction digest using Hpa II (cuts CCGG sites, but will not cut if methylated) and MspI (an isoschizmer of HpaII, but is able to cut methylated DNA). Based on a paper by Bird & Taggert 1980, there are 3 'types' of methylation patterns: insect-type (no methylation), echinoderm type (having methylated and non-methylated fractions), and vertebrate-type (heavily methylated). Will isolate gDNA from each "type" and compare to oyster samples.
Procedure:
Isolated gDNA from mammal (cheek swab), sea urchin (tube feet), herring (skin/muscle)
- used Qiagen kit to isolate genomic DNA from samples. Measured 25mg for urchin and fish sample, cheek swab could not yield as much tissue, but went forward anyway following mfr instructions. Final elution volume in AE Buffer was 100uL
- quantitated gDNA on Nanodrop
- also included crab gDNA (tanner and blue crab) that I obtained from Friedman lab
- results: mammal gDNA isolation did not yield any quantifiable DNA, urchin and herring look ok. crab samples do not have quantifiable gDNA. See results below. Go forward w/ restriction digests using urchin and herring samples.

Restriction digests
- prepared digests of gDNA for sea urchin, herring samples as "controls" of echino-type and vertebrate-type
- oyster samples
- C.gigas: pooled DNA from 7 samples (equal volumes of 1 individual from all 6 sites collected in june)
- C.virginica: pooled gDNA (probably a few years old)
- quantified both samples on Nanodrop
- prepped digestions per table below (HpaII (10,000U/mL), buffer 1; MspI (20,000U/mL, buffer 4)

- digested for 2 hrs. at 37C, then stopped with 10uLsuggested 'stop solution' for enzyme: 50% glycerol, 50mM EDTA (pH 8), 0.05% bromophenol blue
- entire volume was loaded onto a 1.2% agarose gel and run at 100V for ~ 2.5 hrs

Conclusions/Next Steps:
I think the 'control' results are as expected. For the herring sample, I expected the MspI smear to be a bit lower than the sea urchin sample because it should be the more methylated 'vertebrate type', but overall the HpaII lane had a larger more compact smar, while the MspI was a longer, lower smear. The oyster results are quite odd. For C.gigas, there is no difference in banding patterns for the 2 digest - which may suggest little to no methylation, but both lanes appear to have the "MspI" type of pattern w/ a lower larger smear. Does this indicate that oysters have a higher number of CCGG sites than other species tested - but that none are methylated? I think this should be repeated with additional C.gigas samples for more information. For the C.vignica sample - it appears that no DNA was loaded. Not sure what happened here. Will also need to repeat.
Next steps would be to repeat these samples and add additional oyster samples and mussel samples (this was tested in Bird & Taggert 1980, for an additional control). Colleen has a bunch of gDNA from oysters she can give me.
10/29/09
Summary: Imprint kit test run. 1) added pts. to lower end of curve, 2) ran a range of sample DNA conc., 3) ran herring gDNA for info.
Procedure:
- standard curve was performed using serial dilutions. diluent was DNA binding soln. from kit
| Total ng added to well in 30µL |
stock conc. ng/uL |
vol of stock |
vol of diluent |
final conc. ng/µL |
| 25 |
50 |
1.2 |
73.8 |
0.8 |
| 12.5 |
0.8 |
40 |
40 |
0.4 |
| 6.3 |
0.4 |
40 |
40 |
0.2 |
| 3.1 |
0.2 |
40 |
40 |
0.1 |
| 1.6 |
0.1 |
40 |
40 |
0.05 |
- Samples were pre-diluted in water, then 3 uL of the diluted DNA was added to 27uL DNA binding solution
- Sample Dilutions:
- BB01: loaded final conc. of 250ng, 200ng, 150ng and 100ng
- DH07: loaded final conc. of 200ng
- WB01: loaded final conc of 200ng in duplicate
- Herring tail fin: loaded final conc. of 250ng, 200ng and 150ng.
- NOTE: prepped herring gDNA using Chelex for use in this assay. I wanted a sample that had a 'higher' % meth (wanted mammal but settled for fish). Quick procedure: 0.5mL 10%Chelex, 95C/20min,4C/4min, maxspin/5min, quant on nanodrop.
- 30uL of standards and diluted sample in DNA binding solution was loaded to each well
- incubate at 37C for 1 hr, add 150uL of block solution /well, incubate at 37C for 30min.
- dilute capture antibody 1:1000 (1uL antibody, 999uL wash buffer) immediately before use
- remove soln from wells, wash 3x in 1xWash Buffer (150uL each), add 50uL of diluted antibody an incubate at RT for 1hr.
- dilute detection antibody 1:1000 (same dilution as above)
- remove soln from wells, wash 4x with 1xWB), add 50uL of diluted antibody and incubate at RT for 30 min
- remove soln from wells, wash 5x with 1xWB, add 100uL of developing soln (brought to RT for 30 min prior to adding)
- incubated for 10min *this is the max incubation time recommended. top std was quite blue as were herring samples, but went full 10 min since oyster samples were so light
- added 50uL stop solution and read plate on Seeb plate reader at 450nm.
Excel spreadsheet
10/28/09
Summary: Isolated RNA from gill samples already in TriReagent for LC01-LC07 and WB01- WB07 from Jun2009
Procedure:
- samples already homogenized in 1mL TriReagent
- completed protocol per mfr instructions
- after precipitation (spin down after isopropanol), had organic phase at the bottom of each tube - w/ an interphase (RNA) above it. no idea what happened here. must have some how carryed over from tube. I pipetted the organic out and re-spun samples. then continued w/ protocol as stated.
- solubilized RNA in 100uL 0.1% DEPC H20
Not enough time to quant. Samples at -80 will quant on Friday.
10/17/09 - 10/21/09
Field sampling data sheets for Oct 2009
BB-10/17/09
WB-10/18/09
LC-10/19/09
NB-10/19/09
SB-10/20/09
DH-10/21/09
10/15/09
Summary: Isolated RNA from gill samples already in TriReagent for SB01-SB07 and DH01- DH07 from Jun2009
Procedure:
- samples already homogenized in 1mL TriReagent
- completed protocol per mfr instructions
- solubilized RNA in 100uL 0.1% DEPC H20


Conc/Next Steps:
These samples need to be DNAsed then checked for genomic carry-over before cDNA is made.
10/12/09
Summary: for labeling consistency, aliquoted cDNA samples from 10/7 and 10/8 into new tubes for Bioanalyzer/SOLiD cDNA library
Procedure:
Sample ID on tube (actual sample information):
- BB1 and DH1 (samples from 10/07/09, 3 preps (10/02, 10/05, 10/07) combined an cocentrated using Purelink Kit)
- BB2 and DH2 (samples from 10/08/09, this was a "fresh" ligation started 10/07 after the fragmented RNA was speed-vac'd, these are the inner pieces of the gel, amplified w/ 15 cycles)
- BB3 and DH3 (samples from 10/08/09, these samples also from the "fresh" ligation after speed-vac - BUT these were the outside gel pieces and 18 amplification cycles were performed)
10/09/09
Summary: Trial run w/ Sigma Aldrich Imprint Methylated DNA QUantification Kit. Standard curve, blank and 2 oyster samples
Procedure:
- prepared standard curve in DNA Binding Solution. Recommended standard curve range is: 10 - 100 ng control DNA
| Total ng added to well in 30µL |
stock conc. ng/uL |
vol of stock |
vol of diluent |
final conc. ng/µL |
| 100 |
50 |
2 |
28 |
3.33 |
| 50 |
50 |
2.5 |
72.5 |
1.67 |
| 25 |
1.67 |
37.5 |
37.5 |
0.83 |
| 12.5 |
0.83 |
37.5 |
37.5 |
0.42 |
| 6.3 |
0.42 |
37.6 |
37.5 |
0.21 |
- sample dilutions
- BB01 (jun09): 7.1uL sample @ 945.69ng/µL, 66.7uL H20---> 3uL @ 66.7nguL, 27uL DNA binding soln: load total @ 200ng
- DH07 (jun07): 5.3uL sample @ 1265.81ng/uL, 94.7uL H20--->3uL @ 66.7ng/uL, 27uL binding soln: load total @ 200ng
- NOTE: "each well can bind up to 200 ng total" , per manual
- NOTE: only get 1.5mL DNA binding soln. wanted to do a "pre-dilution" then 3 uL into 27uL of DNA binding soln to ensure matrix was mostly DNA binding soln (manual does not specify what % needs to be binding soln).
- followed the rest of the mfr's protocol:
- loaded 30uL of standard, sample and blank (blank is 30uL DNA binding soln)
- 37C (small incubator "shake & bake") for 60 min
- add 150 block soln, incubate 37C for 30 min
- wash 3x (150uL each)
- dilute capture antibody 1:1000 (1uL into 999uL 1x wash buffer)
- add 50uL/well
- incubate RT for 60 min
- wash 4x
- dilute detection antibody 1:1000 (1uL into 999uL 1x wash buffer)
- incubate RT for 30 min
- wash 5x
- add detection reagent - incubate in dark RT and "monitor for color change, 1 - 10 min
- added stop solution after 6 min. Samples were still VERY light, but top standard was quite blue so I didn't want to blow out the top of curve
- read plate at 450 in Seeb Lab
Excel worksheet using an exponential curve fit - here (R^2: 0.94)
Excel worksheet using a linear curve fit (200ng std. dropped) - here (R^2: 0.87)
Example curve from mfr - here (R^2: 0.97)
NOTES: The exponential curve appeared to fit the data a little better than the linear model (judging by R^2) . I should have stopped the reaction sooner to get the high standard in the lindear range - it appears to be a little saturated at 0.7OD. Nevertheless, the curve showed a good dose response. The curve was a little "squished" compared to the example in the manual. May need to increase # of washes or intensity of washes. The blank was very low (Unknown1), which was good. The samples, were outside of the range of the standard curve (too low, lowest std. 0.27OD, BB01 0.24OD, DH07 0.18 OD).
Conclusions/Next Steps:
Will need to run a different standard curve going to lower concentrations. Mfr protocol says LOD for this assay is 5ng fully methylated DNA, will see what curve looks like that low. Also need to run a few duplicates to see what precision is. All in all, I think this kit shows more promise than the Epigentek kit.
10/08/09
Summary: Finish ligation from 10/07/09, then complete SOLiD library protocol with speed vac'd BB and DH fragmented RNA samples. Ran 2 batches of PCR after size selection 1) inside pieces of gel/15 cycles, 2) outside pieces of gel/18cycles (to increase yield)
Procedure:
- stopped ligation at 7:30am >RT>purify>run gel and size select
- First PCR: per protocol ran the 2 inner pieces from each sample (BB and DH) in individual 100µL PCR rxns for 15 cycles, then purified (all per protocol)
- results were 6.7ng/uL for for samples. There was a small peak at 260 w/ a maxima of 0.15 ABD (NanoDrop report was not available)
- Second PCR: ran the 2 outer pieces from each sample (BB and DH) in individual 100µL PCR rxns for 18 cycles, then purified per protocol
- NOTE: protocol states to run 15 cycles as default, but a range of 12 - 18 cycles is acceptable
- results - see below
- Bioanalyzer:
- submitted 1.5µL of cDNA from first PCR (labeled BB & DH 10.8 15c)
- diluted cDNA from 2nd PCR to ~30ng/µL in 1.5µL (BB: 0.6µL cDNA, 0.9µL H20; DH: 0.7µL cDNA, 0.8µL H20), (labeled as BB & DH 10.8 18c)
1st PCR: 6.7ng/uL for BB and DH
2nd PCR (3 additional cycles): 75.4 and 64.1 ng/µL for BB and DH respectively (see Nanodrop data below)


Conc./Next Steps:
Appears that using more conc. sample prior to ligation helped increase yield (see 1st PCR). Running 3 additional cycles (18 total), helped quite a bit more for increasing yield! and still was within the range of the protocol.
Next steps, wait for bioanalyzer results before proceding.
10/07/09
Summary:
1. repeat size selection and purification of BB and DH cDNA for SOLiD library (since did not get any yield from first run; see 10/02 and 10/05 entries). Similar results were obtained today as previous
2. combine and concentrate eluates from 3 PCR rxns for BB and DH (10/07, 10/05 and 10/02). send out aliquot for bioanalyzer
3. concentrate (by speed vac) remaining fragmented ribo-, poly-A RNA and perform ligation rxn.
1. Procedure:
- followed protocol for pages 12 - 19: Purify cDNA, Size Select cDNA, Amplify cDNA, Purify Amplified cDNA, Assess yield
- used 5uL cDNA remaining after 1st gel was run 10/02/09. Recovered 5uL for BB, closer to 4 for DH
- ran 2 inside pieces of size selected gel in PCR for each sample, 2 outside pieces were saved at -20C
- saved gel from DH lane (>200bp and <100bp separate), saved gel from BB lane (>200bp, lost <100bp on the floor) @ -20C
- note: ran gel at 180V, had about 13mA. this was similar to 10/02


Conclusions:
results similar to 10/02/09. No peak observed at 260nm. Gel pieces were within the range as stated in the protocol.
other observations:
- I did not speed vac my samples: I has 42ng going into ligation rxn for BB and 60ng for DH
- in contrast, Sam's samples and Colleen's samples were all speed vac'd. quick calc's w/ Sam's samples show that if entire vol. was speed vac'd, then somewhere between 232ng and 780ng went into ligation reaction. Colleens is probably in the same range.
- HOWEVER, when Colleen and I measured our "pre-size" selected samples, we both had around 15ng/uL of cDNA - so amount going into ligation reaction may not matter.
- Maybe I could quant one or 2 of Sam's samples to see if those samples are also in the same range.
2. Procedure:
- combined the eluates from the 3 PCR reactions performed (10/02, 10/05 and 10/07) ~ 50uL total recovery from combining rxns
- followed PureLink Micro Kit Column protocol to concentrate cDNA:
- added 200uL binding buffer 2
- eluted in 10uL


- small peak at A260, maybe there is cDNA in my sample just a very low conc.
- aliquoted 1.5uL to a tube for Bioanalyzer
- took the remaining fragmented RNA from BB and DH ~16uL each and speed vac'd for ~ 15 min on "Low" w/ heater "ON"
- reconstituted in 3uL RNAse free water
- initiated hybridization/ligation procedure per p.10 of SOLiD cDNA library protocol.
- Ligation rxn initated at 3:30pm
10/05/09
Summary: tried to PCR and purify the remaining gel bands from 10/02/09 to get cDNA for SOLiD library. Made pieces smaller first since I think inhibition was the reason no cDNA on 10/02. No cDNA from outer bands.
Procedure:
- trimmed the ends (same on each) of the 2 outside gel pieces and put them each into a 0.2mL tube (4 tubes total; 2 BB, 2 DH)
- prepped mastermix for 4.1 rxns (page 17 of protocol)
- added 98uL mmix to each of 4 tubes
- added 2uL 3' PCR primer to each tube
- ran PCR per p. 18
- purified samples per p18 and 19
- spec'd:


Conclusions:
No detectable cDNA after PCR and purification. Less sure this time around if it was inhibition due to the amount of gel - or because the outside pieces did not have a lot of material to start with. Next step is to run the remaining 5uL on a new gel and size select again focusing on minimizing the amount of gel going into the reaction.
10/02/09
Summary: completed SOLiD library contruction protocol - sad day though, no cDNA at the end. Investigation points to cause: gel pieces were too big.
Procedure:
- followed protocol for pages 12 - 19: Purify cDNA, Size Select cDNA, Amplify cDNA, Purify Amplified cDNA, Assess yield
- NOTE: gel piece was still remaining in 0.2mL tube after PCR. Just sucked liquid out from around it.


- froze starting cDNA (5µL), 2 outside gel pieces, 3 post-PCR gel pices, and final cDNA samples (even though no cDNA!) at -20 in Mac's cDNA box.
- neither of my samples 'worked' meaning I had no quantifiable cDNA after size selection, amplification and purification
- Colleen processed her samples at the same time and had cDNA at the end @ 15 ng/uL
- we called tech support - she thought that Colleen's recovery was within the expected range and that I probably had too much gel in the reaction
- I went back to purified cDNA sample, pre-size selection (of which I had 5uL remaining) and quantitated on nano-drop for DH only - had about 15ng/uL
- also tried it w/ Colleen's sample and she start with about 18 ng/uL for her sample
- I also measured the left over gel piece for 1 BB PCR and it was about 1.2 x 8mm (protocol states size should be 1 x 6mm)
- visually, it looked like my gel pieces were larger than Colleen's
- most likely no cDNA after size selection due to inhibition by gel material. I think this because
- Colleen's sample was run same day as mine, with same starting conc. of sample loaded onto gel and her sample had expected recovery
- my gel piece measured slightly larger than protocol recommended
- next step would be to re-run gel w/ remaining 5uL and get smaller pieces. alternately - I can also chop out outside pieces a bit and try to PCR those too. Will check and see where reagents are limiting for the kit then proceed.
9/24/09
Summary: completed ligation and RT of BB and DH samples for SOLiD library construction. Nanochip data back.
Procedure:
- prepped mMix for RT per protocol (page 11). Prepped 2.5 rxns
- ended ligation incubation at 8am
- added 20uL mMix to each tube and incubated at 42C for 30 min
- froze cDNA at -20C in 'Mac's cDNA Box 2'
Nanochip Data


- nothing really new here, but now know: pico and nanochip give similar results (as do different dilutions of total RNA on the Nanochip ("d" stands for diluted in the lane IDs)
- total RNA and ribo minus RNA look about the same for oysters. confident now that ribominus kit does not work for removing ribosomal RNA from oyster samples.
9/23/09
Summary: proceeded w/ "Amplified library construction" procedure using SOLiD kit and DH and BB samples
Procedure:
- protocol cont. from 9/21/09
- started this step (page 9 of protocol) w/ 42ng fragmented DNA from BB sample, and 60ng DH samples (protocol says start w/ at least 50, but we decided to go forward w/o concentrating BB sample (which included speed vac)
- followed protocol on page 9 to hybridize and ligate the RNA
- ligation incubation started at 4:00pm
9/22/09
Summary: picochip data!


Conclusions:
- The size distribution of the BB and DH fragmented RNA samples are as expected, with most of the RNA being in the 100 - 200bp range.
- The ribominus kit does not appear to remove ribosomal RNA in oyster samples (still strong ribosomal band), but is does appear to remove ribosomal RNA in trout. Both of these finding should be confirmed by comparing to a total RNA sample
- fragmented RNA looks good, continue w/ library prep
9/21/09
Summary: completed mRNA isolation from ribosomal depleted RNA samples. RNAsed BB and DH samples for SOLiD cDNA library.
Procedure (Ambion protocol):
- completed precipitation step of Ambion mRNA isolation initiated 9/18/09
- mRNA was brought up in a total of 8uL
- quantified RNA on Nanodrop (see below for quant results)
- started the procedure for making cDNA libraries for SOLiD sequencing for BB and DH samples
- used total vol (8uL) in fragmentation reaction
- total starting ribo- mRNA for BB and DH: 0.9µg
- after fragmentation proceded to "Clean up the RNA" using the RiboMinus Conc. Module - followed procedure in SOLiD protocol
- used the nanodrop to assess yield (the protocol states to use the Quant-it RNA Assay kit, but we do not have a plate reader that reads at the required wavelenlengths

- total recovery from Nanodrop after fragmentation
- BB: 0.3ug (yield ~ 30%)
- DH: 0.4ug (yield ~ 40%)
- these yields are a bit lower than expected. manual says you can expect 50 -80% recoveries at this step
- diluted a small aliquot of the samples to 5ng/µL for Bioanalyzer to assess size distribusion
- froze the remaining fragmented RNA at -80C
9/18/09
Summary: Prepped samples for Bioanalyzer (total RNA and ribosomal depleted RNA). Isolated mRNA from ribosomal depleted RNA for BB and DH (2nd half of batch, Sam prepped 1st half also 9/18/09)
Procedure (Bioanalyzer sample prep):
- prepped new pools of total RNA for BB and DH to be sent for analysis on Bioanalyzer (used 1/10th the vol. from 9/15/09 prep)
- prepped new pools of GE and GC RNA for bioanalyzer (combined 3uL each of 3 tubes)
- aliquoted and diluted samples of total RNA (samples 1-8), ribosomal depleted RNA (9-12) for bioanalyzer (nano-chip)
- diluted ribominus samples (23 - 28) to 5ng/mL for picochip analysis (to compare to nanochip results)
- see preps and bioanalyzer sample submission sheets - here
- note: for sample IDs: the small letter 'd' indicates the sample is diluted. dilutions performed to approximate conc. of the ribosomal depleted samples)
- samples stored at -80C, will be sent for analysis on Monday
- followed Ambion protocol for mRNA isolation
- started w 1ug ribosomal depleted RNA from BB and DH samples
- prior to ethanol precipitation step combined mRNA from Sam's prep and added 21uL Ammonium acetate, 1uL glycogen and 577.5uL EtOH.
- froze samples at -80C
9/16/09
Summary: RiboMinus-ed the following RNA samples: RBC control, RBC poly I:C, GC (CAB), GE (CAB)
Procedure:
- RBC control (575.32 ng/µL): 15uL into RiboMinus kit = 8.6µg total
- RBC poly IC (379.69 ng/µL): 19uL into RiboMinus kit = 7.2µg total
- GE pooled (306.27 ng/µL): total vol added ~ 16µL = 4.9ug total
- GC pooled (301.07 ng/uL): total vol added ~8µL = 2.4µg total
- followed Mfr protocol for RiboMinus and Concentration module - protocol here
- quantitated on Nanodrop. Blanked w/ 10mM Tris-HCl buffer per RiboMinus Conc. module protocol.
Nanodrop results "pre"-RiboMinus (labeled pre) and "post"-RiboMinus (labeled post):

Nanodrop spectrum for post-RiboMinus samples:

Nanodrop spectrum for pre- and post- RiboMinus samples:

- RBC control 0.99ug total (in ~ 30uL), approx 12% recovery
- RBC poly I:C 1.5µg total (in ~30uL), approx 21% recovery
- GE pooled 0.8ug total (in ~30uL), approx 16% recovery
- GC pooled 1.9µg total (in ~ 30uL), approx 80% recovery
Very strange recovery for GC pooled. Tough to say what the issue is. Will run these samples on Bioanalyzer on Friday, so should have more information about quality then.
9/15/09
Summary: isolated 'ribosomal RNA (rRNA) - free' RNA from pools of gigas samples from Big Beef Creek and Drayton Harbor (April2009 collection)
Procedure:
- pooled 16 BB samples in equal quantities (0.625ug) each for a total of 10ug total RNA
- did the same thing for Drayton Harbor - calcs here for both sites
- performed EtOH precipitation to concentrate samples (wanted 10ug in 20uL for Ribominus kit)
- BB: 62uL sample, 6.2uL NaOac, 124uL EtOH ice cold
- DH: 56uL sampls, 5.6uL NaOac, 112uL EtOH ice cold
- mix - spin max 15 min - decant - wash w/ 0.5 mL 70% EtOH-mix -spin max 5 min-decant-add 18uL DEPC treated water
- final conc. ~ 10ug in 17uL (see spec results and plots below)
- followed Mfr protocol for RiboMinus (used all 17uL of RNA) - protocol here
- followed directly w/ RiboMinus Concentration Module protocol (did not spec here as conc. likely only ~ 2ng/ul)
- protocol was followed as stated for RIboMinus RNA (i.e. 530uL sample, 530uL binding buffer, 1060uL EtOH)
- NOTE: processed sample onto column by spinning 700uL at a time (x3 to process entire volume) at 2-8C,max speed. I should have been spinning at RT per the protocol and at 12000 x g.
- after washing w/ Wash Soln (EtOH added) added 30uL to the column and collected eluate
- spec results are below (top 2 readings are pre-Ribominus, bottom 2 readings are the same 2 samples after RiboMinus procedure and conc. step)


Results:
RiboMinus treated RNA concentrations:
- BB: 113.40ng/uL (in 30uL), or 3.4ug total
- DH: 91.49ng/uL (in 30uL), or 2.7ug total
- Samples were stored at -80C (top shelf in same box as original gigas samples used for pooling)
Recovery of RNA was about 30%. This is quite high since expected ~90% of RNA to be ribosomal. Maybe too much RNA to start with? 10ug is maximum for 1 reaction.
These samples will be sent out for analysis on Bioanalyzer to check for presence of ribosomal DNA bands and RNA integrity.
9/04/09
Summary: performed Methylamp DNA Methylation Quant Kit - standard curve only. Still having problems w/ standard curve.
Procedure:
- prepped 6 point standard curve using pos. control from kit:
| standard ID: |
A |
B |
C |
D |
E |
F |
| standard vol (µL) |
4 (neat) |
20 (stdA) |
20 (std B) |
16 (std C) |
20 (std D) |
16 (std F) |
| diluent (GU2) vol (µL) |
36 |
20 |
20 |
24 |
20 |
24 |
| final conc. (ng/µL) |
10 |
5 |
2.5 |
1 |
0.5 |
0.2 |
- load 2µL of each standard for final conc. of 20, 10, 5, 2, 1 and 0.4ng/well. and 2 blank wells (GU2 only)
- follow protocol per mfrs instructions
- incubated at 60C for 60 min (DNA binding) and all liquid was evaporated (protocol maxes out at 50 min, but tech said can go up to 1 hour. Went for max time because I can see no other explanation for NO dose response except problems w/ DNA binding)
- aspirated the liquid out of the plate during washes (instead of flicking, this is a lot more gentle)
- incubated the detection reagent for 3 min (this batch developed a lot slower than the previous ones, let it sit a few minutes to reach that med. blue color)
- waited 10 min to read after adding stop reagent
- read on Seeb lab plate reader at 450nm
- worse than last plate
- no dose response
| well ID |
OD |
| std A |
.294 |
| std B |
.386 |
| std C |
.472 |
| std D |
.267 |
| std E |
.945 |
| std F |
.406 |
| blank |
.288 |
| blank |
.317 |
- blanks are higher this time too.
09/02/09-09/03/09
Summary: run the remaining June hemolymph samples on the noradrenaline ELISA
Procedure:
Plate layout:

- loaded as much hemolymph as possible up to 250µL on the acylation plate. some samples did not have enough, so multiple volumes were loaded depending on available sample. See Excel spreadsheet w/ results for volume of each sample. Each sample was QS'd to 500µL.
- Acylation solution prep (1:60): 25uL acylation conc., 1.5mL acylation-diluent
- WASH STEPS - after dumping out soln. really banged the plate on paper towels to get all liquid out. Also performed 3 washes (instead of 2 as stated in the protocol). These were both suggestions from tech support after they looked at the data from the first curve.
- Enzyme solution was prepared per instruction manual 10 minutes before use. The remaining solution was frozen at -20C
- Step 6.5.4 in protocol starts a 15 - 20 hour incubation (w/ samples and standards in noradrenaline microtiter strips with noradrealine antiserum) at 2-8C. Incubation was initiated at 2:35pm
- 9/03/09 - incubation stopped at 10:35am
- completed protocol per mfr instructions (substrate incubation = 21 min), and read plate on plate reader at 450nm
- curve looks good
- duplicates look good
- pos control w/in expected range (2.36 and 12.5 ng/mL, expected is 2.5 and 11.5 ng/mL)

- samples: many of the samples were outside of the range of the std curve (NA conc. too low, not detectable)
- results can be found here on spreadsheet: Excel spreadsheet
- I am surprised so many of the samples were <LOD. Many of these samples had 250uL loaded. I can load up to 500uL/well, but the 2 previous runs I had loaded 250uL and all samples were within the range (except for 1 where there wasn't enough volume).
- Overall, the conc. of NA seem low, and it's possible that sample treatment and storage can be improved. The mfr states samples are stable at 4C for a few days, but there is a suggested "preservative" to use. Going forward I will use the preservative for sampling. Also, more vol should be loaded. If I can't get <500uL hemolymph from an oyster, and additional oyster should be sampled to more volume. Also will consider taking dry ice to freeze sample right away instead of keeping them cool.
- All in all, the assay appears to be working, but the sample conc. needs to be adjusted. I would like to try a few samples in the lab using the preservative and freezing v. cold samples for ~4hrs. (time it can take for me to get back to the lab)


8/28/09
Summary: run standard curve using Methylamp kit, to evaluate procedure - curve fit. Added additional point to std curve to evaluate final conc. to use. Evaluate reproducibility (compare to results from 8/17/09)
Procedure:.
- prepped 7 point standard curve using pos. control from kit:
| standard ID: |
A |
B |
C |
D |
E |
F |
G |
| standard vol (µL) |
4 (neat) |
20 (stdA) |
20 (std B) |
28 (std C) |
23 (std D) |
20 (std E) |
16 (std F) |
| diluent (GU2) vol (µL) |
36 |
20 |
20 |
12 |
17 |
20 |
24 |
| final conc. (ng/µL) |
10 |
5 |
2.5 |
1.75 |
1 |
0.5 |
0.2 |
- load 2µL of each standard for final conc. of 20, 10, 5, 3.5, 2, 1 and 0.4ng/well. and 2 blank wells (GU2 only)
- follow protocol per mfrs instructions, with emphasis on changes incorporated from run on 8/17/09:
- accidentally added 100µL of stop solution at the last step (instead of 50µL) - expect a depressed signal
No dose response observed. The OD's for this run are on the summary page image below. this is what I sent to tech support to get more advice. I expected a reduced signal due to the excess stop solution added, but it does not explain why there is no dose response in the upper end of the curve and the lower end of the curve has the same OD. Ahhrrgh! Tech support is supposed to call on Monday

8/25/09
Summary: completed NAD ELISA from 8/24/09
Procedure:
- stopped NA antiserum incubation at 9:55am
- incubated w/ Enzyme Conjugate for 37 min (protocol stated 30 min, but I had to drag it out until the plate reader was free to use)
- incubated w/ substrate 30 minutes, then waited 10 min to read plate
- curve fit using duplicate wells looks pretty decent with a 4P fit.


- link to excel spreadsheet for this assay
- the conc. of the curve back calculate well (within 1% of expected)
- Pos. controls are within the acceptable range.
- Control 1 range: 2.25ng/mL +/-40% (result 2.14 ng/mL),
- Control 2 range: 11.25 ng/mL +/- 40% (result 8.5 ng/mL)
- duplicate curves do not have great reproducibility. the backcalculated concentrations of the samples/controls are between 22 and 100% different if only 1 curve is used instead of duplicates. this suggests that running curve in duplicate is better. it is obvious visually that the curve in column 1 has a better fit to a 4P curve.
- SAMPLES: Samish Bay samples were run
- SB01 is outside the range of the curve, in other words, conc. is approximately 0 ng/mL
- SB03 has an aberrant reading, would like to rerun at a different dilution next time
- all other samples are acceptable and within the range of the standard curve.
- Curves are better in duplicate
- with the exception of SB03 (which will not be included in the current analyses), there is a trend toward increase NA levels in post stress samples, although the results are not statistically significant.
- may want to increase the number of oysters sampled for NA since results are showing quite a bit of variability.
8/24/09
Summary: run Noradreanline extraction kit/ELISA. Run duplicate standard curve and focused on shaking and washing steps to increase range of curve (per tech support instruction) Included June samples from Samish Bay in this run.
NOTES: After the first NA run (7/22/09) sent data to mfr. for feedback (pos control recovery was poor). They thought curve fit looked good but that range of curve was depressed (highest std. should be 22% of zero standard, but mine was a 35%). Recommended 'making lab mates wonder what you are doing' by banging plate on paper towels in between wash steps. Increasing # of washes, because it won't hurt, and 'emphasizing' shaking steps - meaning speed it up. Also recommend running duplicate curves to see if pipetting/reproducibility is an issue.
Procedure:
- Acylation solution prep (1:60): 12uL acylation conc., 720uL acylation-diluent
- WASH STEPS - after dumping out soln. really banged the plate on paper towels to get all liquid out. Also performed 3 washes (instead of 2 as stated in the protocol). These were both suggestions from tech support after they looked at the data from the first curve.
- Enzyme solution was prepared per instruction manual 10 minutes before use. The remaining solution was frozen at -20C
- Step 6.5.4 in protocol starts a 15 - 20 hour incubation (w/ samples and standards in noradrenaline microtiter strips with noradrealine antiserum) at 2-8C. Incubation was initiated at 2:55pm
| 1 |
2 |
3 |
|
| A |
StdA |
StdA |
SB05 |
| B |
StdB |
StdB |
SB06 |
| C |
StdC |
StdC |
SB08 |
| D |
StdD |
StdD |
SB21 |
| E |
StdE |
StdE |
SB22 |
| F |
StdF |
StdF |
SB23 |
| G |
Pos Cntrl1 |
SB01 |
SB24 |
| H |
Pos Cntrl2 |
SB03 |
SB25 |
8/18/09 - 8/21/09
August Field Data:
Big Beef Creek
Samish Bay
Drayton Harbor
Lynch Cove
North Bay
Willapa Bay
8/17/09
Summary: run standard curve using Methylamp kit (incorporating suggestions from mfr), to evaluate procedure - curve fit
Procedure:
- prepped 6 point standard curve using pos. control from kit:
| standard ID: |
A |
B |
C |
D |
E |
F |
| standard vol (µL) |
4 (neat) |
20 (stdA) |
20 (std B) |
16 (std C) |
20 (std D) |
16 (std F) |
| diluent (GU2) vol (µL) |
36 |
20 |
20 |
24 |
20 |
24 |
| final conc. (ng/µL) |
10 |
5 |
2.5 |
1 |
0.5 |
0.2 |
- load 2µL of each standard for final conc. of 20, 10, 5, 2, 1 and 0.4ng/well. and 2 blank wells (GU2 only)
- follow protocol per mfrs instructions, the following things were changed from the last time I ran the protocol 8/6/08:
- did not cover wells during 37C incubation
- incubated at 60C for 40 min (DNA binding) and all liquid was evaporated (last time I maxed out time and still had liquid in wells)
- aspirated the liquid out of the plate during washes (instead of flicking, this is a lot more gentle)
- only incubated the detection reagent for 1 min (this will actually be difficult to do w/ a whole plate)
- waited 10 min to read after adding stop reagent
- read on Seeb lab plate reader at 450nm
- tried a few different curve fits to see which was the best.


- Better results overall. Curve shows a dose response. Blank is lower 0.24OD (tech says it should be 0.1 - 0.2 range) and 20 ng std is around 1.2 OD (which is where it's supposed to be based on conv. w/ tech).
- Last time I had asked tech support about curve fit (after mentioning that their "example curve" in the manual was not linear), they said if you have nice curve fitting application use the curve that fits best, if not - most people find curve is linear up to 10 ng/well (I don't think that curve looks that linear - curve on bottom). 4-parameter curve on left seems to fit pretty well, and ODs back-calculated pretty well except for the 20ng point which back calculated to ~430 ng. Here are the other stadards and back calculated values in parenthesis: 20ng (432.7ng), 10ng (8.0 ng), 5 ng (5.4 ng), 2 ng (1.8 ng), 1 ng (1.1 ng), 0.4 ng (0.3 ng).
Not sure if I want to include 20 ng in curve going forward, I may drop that point and add it to the middle (3.5 ng) where the EC50 is. Other than that, should try to aim to have samples in the 0.2 to 0.7 OD range (after blank subtraction). I think this should be about right with what I ran before (100 ng), but could run a little less ~ 75 ng to avoid a few high ones. I think I'll stick w/ a 4P fit, it seems to fit the best. May want to run curve one more time though, since I have 1 more column and adjust/add a dilution.
8/06/09
Summary: isolated genomic DNA rom Jun09 gigas gill samples from SB and WB (samples 01 - 07 for each site), ran Methylmp kit for June09 samples form 6 sites
Procedure (gDNA isolation):
- gill tissue was stored in RNAlater and frozen at -80C
- ~ 100mg tissue was placed in 1 mL TRIreagent, homogenized and re-frozen @ -80 for RNA isolation
- ~50mg tissue was used to isolate gDNA using the Qiagen DNeasy Kit
- followed manufacturer's instructions, eluted in 100µL AE buffer
- quantitation performed on nanodrop blanked w/ AE buffer

Procedure (Methylamp Kit)
- diluted all gDNA samples to 50ng/µL- see dilutions here (also 'Nano-dropped' dilutions after the plate was loaded to get accurate readings, thought maybe I could do better than this)
- prepared standard curve per mfr recommendations -
- plate layout:
| 1 |
2 |
3 |
4 |
5 |
6 |
|
| A |
BB01 |
DH01 |
SB01 |
NB01 |
LC01 |
WB01 |
| B |
BB02 |
DH02 |
SB02 |
NB02 |
LC02 |
WB02 |
| C |
BB03 |
DH03 |
SB03 |
NB03 |
LC03 |
WB03 |
| D |
BB04 |
DH04 |
SB04 |
NB04 |
LC04 |
WB04 |
| E |
BB05 |
DH05 |
SB05 |
NB05 |
LC05 |
WB05 |
| F |
BB06 |
DH06 |
SB06 |
NB06 |
LC06 |
WB06 |
| G |
BB07 |
DH07 |
SB07 |
NB07 |
LC07 |
WB07 |
| H |
S1 |
S2 |
S3 |
S4 |
S5 |
BLANK |
- followed mfr instructions for kit - see workflow and dilutions here
- results - not good. curve was WAY off (highest and lowest dilution had the same OD!), the background was really high (0.6OD). I still calculated % methylation using Sam's calc (see Sam's notebook, 051909). although the samples are also probably not responding linearly - there may be some differences between sites (DH is sig diff than LC and WB).
The curve was non linear - this probably means the samples were non-linear as well. This is very disappointing. It was the first time I had tried running a standard curve. This is GOOD to know though, the procedure will need to be tweaked to get the best results. Overall trends in samples though show some differences between sites.
The next step is to run std. curve only with improved protocol - see notes from tech support below on how this will be accomplished.
NOTES: Talked to tech support on 8/11/09. Here are recommendations for improvements...
- do not cover wells for any incubations (I covered for the 1st 37C incubation, not good since trying to dry out solution
- increase the 60C incubation up to 1 hr (I told him I had a lot of soln left in the well after 40 min - this is probably biggest contrib. to problem)
- says you do NOT need to shake the plate for incubations (very weird for ELISA), but DNA must coat entire well b4 incubation w/ DNA
- Washing: wells should NOT be dumped out or plate inverted between washes - says to aspirate w/ pipette each wash (ugh - opposite of NA ELISA where I have to bang the heck out of the wells "make others in the lab wonder what you're doing" says tech supp)
- High blank value:
- shorten the development time to 1 min (I manually added reagent to each well, this took 3.5 min. In order to get a 1 min dev. time must use multichannel, make sure there is enough vol to do this)
- wait 5 - 10 minutes, after adding stop solution, prior to reading plate
- blank should be 0.1, 0.2 OD. 10ng/uL std should be 1.2ish
8/05/09
Summary: isolated genomic DNA rom Jun09 gigas gill samples from LC and NB (samples 01 - 07 for each site)
Procedure:
- gill tissue was stored in RNAlater and frozen at -80C
- ~ 100mg tissue was placed in 1 mL TRIreagent, homogenized and re-frozen @ -80 for RNA isolation
- ~50mg tissue was used to isolate gDNA using the Qiagen DNeasy Kit
- followed manufacturer's instructions, eluted in 100µL AE buffer
- quantitation performed on nanodrop blanked w/ AE buffer (repeated DH and BB samples from 8/04/09 because I blanked w/ H20)*


- results: yields were good (although quite variable) and quality looks good (A260/A280)
Calculations: for DNA methylation ELISA, samples will be diluted to 50ng/uL (load 2 µl for a total of 100ng/well). Calculations for today's samples can be found here
*before I ran samples I blanked w/ H20 then ran AE buffer alone. Result was 3.5ng/mL, so pretty low - but since I'm normalizing the samples for the ELISA I needed to have accuracy which is why I repeated yesterday's measurements.
08/04/09
Summary: isolated genomic DNA from June09 gigas gill samples from BB and DH (samples 01-07 for each site)
Procedure:
- gill tissue was stored in RNAlater and frozen at -80C
- ~ 100mg tissue was placed in 1 mL TRIreagent, homogenized and re-frozen @ -80 for RNA isolation
- ~50mg tissue was used to isolate gDNA using the Qiagen DNeasy Kit
- followed manufacturer's instructions, eluted in 100µL AE buffer
- results: yields were good (although quite variable) and quality looks good (A260/A280)

Next Steps: isolate gDNA from remaining sites for June samples (7 individuals each)
7/22/09 - 7/23/09
Summary: Noradrenaline ELISA Initiated. Samples from June for BB and DH
Procedure:
- 7/22/09
- Performed extraction of noradrenaline and ELISA following manufacturer's instructions
- let reagents reach RT before initiating per manufacturer's instruction
- Extraction Plate layout:

- Acylation solution prep (1:60): 12uL acylation conc., 720uL acylation-diluent
- Enzyme solution was prepared per instruction manual 10 minutes before use. The remaining solution was frozen at -20C
- Observations: Enzyme solution was light brown. when it was added to plate all wells turned light pink. After the 2 hr. incubation at 37C wells were still pink, there was some condensation on the lid, but was still easily able to pipette 100uL to ELISA plate
- Step 6.5.4 in protocol starts a 15 - 20 hour incubation (w/ samples and standards in noradrenaline microtiter strips with noradrealine antiserum) at 2-8C. Incubation was initiated at 2:30pm 7/22/09
- 7/23/09
- Let reagents reach RT per mfr instructions
- Incubation was stopped at: 10:20am (19hrs 50min incubation
- completed ELISA steps...substrate incubation can be 20 - 30 min, I incubated for 20 minutes
- plate was read on the VICTOR plate reader in the Seeb Lab at 450 nm
- data was analyzed using software associated w/ VICTOR plate reader
- per mfr instructions,std curve was generated (OD (linear, y-axis), concentation (logarithmic,x-axis) and fitted w/ a non-linear regression (akima*)
- *2 fit lines were tested: 4-parameter and akima: akima curve visually had best fit, highest Rsquared and lowest %diff from expected curve conc.

- samples were corrected for dilution and % diff from expected was calculated for the pos control. %spike recovery of the spiked sample was also calculated
- this .xls workbook can be found in Dropbox>Lab>Bioindicator>Mac NAD ELISA 02309

- curve was acceptable, pos. control value was not (9% of expected), spike recovery was low, but acceptable (60%)
- samples were within the range of the standard curve with the exception of BB23 and BB21 which were extrapolated. would probably run the same volumes next time, may just have to re-run samples that fall outside of range.
- overall the non-stressed samples had a lower NA conc. than the stressed samples within a site (results not. stat. sig.)
- the change in NA conc. between no stress and mechanically stressed oysters was higher for BB creek than for DH (1.6 ng/mL and 0.5 ng/mL respectively)
7/15/09
Summary: qPCR to test new C.gigas primers
Procedure:
- plate layout
- samples: C.gigas genomic DNA (gen), cDNA gill tissue (gill), cDNA hemolymph (T4)

X=amplification, -- = no amplification
Next Steps: Will want to try a temp gradient for SOD, HSP70 and GPX to see if getting non-specific peaks at 55C. Will need to investigate and reorder primers for SOD and MTIV. Am ready to go for HIF1a and MDR, low reproducibility in hemolymph sample for these genes (maybe due to low starting conc.?) - but will be using gill samples for this study, so will probably be ok.
6/22/09
June field data sheets
June 20 2009 to June 22 2009
June 23 2009
June field notes
ID's for research tags:
51(sub4) x 35(sub4) Rep 2: R015 (NB), R013 (SB), R026 (WB)
35 (sub4) x 51(sub4) Rep 2: R037(SB), R051 (WB), R061(NB)
6/18/09
Summary: qPCR to test new MV C.virginica primers; qPCR 18s primers
Procedure:
qPCR1:
- pooled cDNA from various virginica samples (in green oyster cDNA box). made 2 pools "A" and "B" about 70uL each
- primers: TIMP, CatL, CatY, CIAPIN, TLR
- plate set up
- Results: all primers amplified except TIMP - I'll need to check into that. See amp plots here. Melt curves show 1 peak.
- diluted MV cDNA plate 1:20 in water (1uL cDNA, 19uL H20)
- primers: Cv_18s
- plate set up
6/17/09
Summary: qPCRs for MV samples. primers HSP70, HMG
Procedure:
- qPCR using Heat Shock Protein 70 primers
- ran both a cDNA curve and genomic curve (see 6/16/09 for details, with the exception that the genomic curve was run more concentrated: neat, 1:10, 1:100, 1:1000)
- plate set up
- qPCR using high mobility group primers
- ran both a cDNA curve and genomic curve (see 6/16/09 for details, with the exception that the genomic curve was run more concentrated: neat, 1:10, 1:100, 1:1000)
- plate set-up
6/16/09
Summary: qPCRs for MV samples. primers BGBP and Cys B
Procedure:
- qPCR using beta-gal binding protein primers. See plate set-up for samples
- qPCR using Cystatin B primers.
- prepped 2 std curves.
- 1 w/ cDNA "A8" MV sample been using as a positive control. Ran neat, 1:10, 1:100 and 1:1000 (10uL total for eac conc.).
- 1 w/ genomic DNA prepped 6/15/09. Ran 1:10, 1:100, 1:1000 and 1:10,000
- plate set up
6/15/09
Summary: ordered primers to look for genomic in Aug 06 (MTIV promoter region, DQ354067, link to ref., prepped genomic DNA from 3398 B9 MV oyster gill samples for pos. control.

6/11/09
Summary: isolated RNA from r15 MV samples May 07(ID: 3326), DNAse treated and quantified RNA
Notes for samples: these samples did not have a separate "supe" tube. ~500uL in hemocyte sample, visually some were clear and some were light brown. All samples were spun at 800rpm for 10 min then supe was removed ~100uL was left in tube after decanting.
Procedure:
- added 1 mL TRIReagent to each tube, followed mfr protocol. Final volume 20uL in 0.1% DEPC H20
- used 10uL of RNA to DNAse, the remaining volume was frozen at -80C MV RNA box
- followed Manufacturer's instructions for Ambion's turbo DNA free kit
- 20uL reactions: 10uL RNA template, 2.0uL 10x buffer, 1uL DNase, 7uL H20
- incubated at 37C for 25 min
- added 2uL inactivtion reagent
- total vol RNA at the end ~ 15ul stored in MV RNA DNase Treated box @ -80C.
- quantitated samples on Nanodrop

- ran qPCR using 18s primers to detect any genomic carryover. pos was pos. neg were neg most samples were free of genomic carryover with the following exceptions: all sample ID 3326: B23, A25, B14, B22, A22, A21, A10
6/10/09
Summary: isolated RNA from remaining 14 MV samples Oct 2005 (ID: 2100), DNAse treated and quantified RNA
Notes for samples: these samples did not have a separate "supe" tube. ~100 - 300uL in hemocyte sample, not all had visible pellets.
Procedure:
- added 1 mL TRIReagent to each tube, followed mfr protocol. Final volume 20uL in 0.1% DEPC H20
- used 10uL of RNA to DNAse, the remaining volume was frozen at -80C MV RNA box
- followed Manufacturer's instructions for Ambion's turbo DNA free kit
- 20uL reactions: 10uL RNA template, 2.0uL 10x buffer, 1uL DNase, 7uL H20
- incubated at 37C for 25 min
- added 2uL inactivtion reagent
- total vol RNA at the end ~ 15ul stored in MV RNA DNase Treated box @ -80C.
- quantitated samples on Nanodrop

Results: RNA values are low, but not out of the range for the other samples processed. Again, the spectrum was variable @ 230nm among samples.
6/09/09
Summary: isolated RNA from MV samples Oct 2005 (ID: 2100), DNAse treated and quantified RNA, qPCR for genomic carryover (also included repeat of samples from 6/08/09). Samples are free from genomic carryover.
Sample ID for 14 samples:
A: A1, A2, A3, A5, A7, A8, A12, A14
B: B2, B3, B6, B7, B8, B9
Notes for samples: these samples did not have a separate "supe" tube. ~100uL in hemocyte sample, not all had visible pellets. Two samples had 400 -600uL, (B6 and B8) for those they were split into 2 or 3 tubes respectively for the RNA isolation then pooled at the end.
Procedure:
- added 1 mL TRIReagent to each tube, followed mfr protocol. Final volume 20uL in 0.1% DEPC H20
- used 10uL of RNA to DNAse, the remaining volume was frozen at -80C in MV RNA box
- followed Manufacturer's instructions for Ambion's turbo DNA free kit
- 20uL reactions: 10uL RNA template, 2.0uL 10x buffer, 1uL DNase, 7uL H20
- incubated at 37C for 25 min
- added 2uL inactivtion reagent
- total vol RNA at the end ~ 15 in MV RNA DNase Treated box @ -80C.
- quantitated samples on Nanodrop

Results: RNA values are low, but not out of the range for the other samples processed. The spectrum for one of the samples has a peak at 230 (some kind of carryover?). I thought this may be due to inactivation reagent - but I "spot checked" some of the samples before DNAse procedure including B1 and the profile was similar then. I have also seen this in some of the other samples (see Mac's notebook page for Environmental Physiology class: 2/18/09).
- qPCR to check for genomic carryover (Cv_18s primers)
- diluted RNA samples 1:4 (1uL RNA, 3uL H20)
- prepped mastermix and loaded plate -see details here
- loaded MV cDNA pos control and H20 neg controls
- samples were frozen at -80C in "MV Oysters RNA DNAse Treated" box 0.5 mL tubes labeled as "DNase TX"

Next Steps: isolate RNA from the 2nd half of Oct 2005 samples
06/08/09
Summary: DNAse'd RNA isolated 6/0/509. Checked for genomic carry-over by qPCR on RNA (18s primer)
Procedure:
- followed Manufacturer's instructions for Ambion's turbo DNA free kit
- 20uL reactions: 10uL RNA template, 2.0uL 10x buffer, 1uL DNase, 7uL H20
- incubated at 37C for 30 min
- added 2uL inactivtion reagent
- total vol RNA at the end ~ 15
- quantitated samples on Nanodrop

- qPCR to check for genomic carryover (Cv_18s primers)
- diluted RNA samples 1:4 (1uL RNA, 3uL H20)
- prepped mastermix and loaded plate -see details here
- loaded MV cDNA pos control and H20 neg controls
- samples were frozen at -80C in "MV Oysters RNA DNAse Treated" box 0.5 mL tubes labeled as "DNase TX"
Next steps: repeat qPCR
06/05/09
Summary: RNA isolation for MV samples -2nd half of ID: 3219 (Nov 2006) samples
Sample ID for 12 samples:
A: A1, A2, A3, A4, A11, A12, A13, A14, A15
B: B1, B3, B4, B10, B11, B12, B13
Notes for samples: these samples already had a separate "supe" tube. ~100uL in hemocyte sample, not all had visible pellets.
Procedure:
- added 1 mL TRIReagent to each tube, followed mfr protocol. Final volume 20uL in 0.1% DEPC H20

Next Steps: DNase treat the samples then check RNA for genomic carry-over (run RNA w/ 18s primers)
05/18/09
Summary: repeat of 05/15/09 run using Stratagene SYBR Mmix
Procedure: see plate layout and mmix prep
Results: melt curves looked good (single peak!) Can't guess as to why it looks different than the SensiMix/SYBR. y-axis on the graphs below represent copy number (not normalized to 18s).

Conc.: Although general trends were observed between the two sites, none of the results were statistically significant (astacin was the closest at p=0.1). However, may not be the case with a larger n (n=7 for this run).
05/15/09
Summary: real-time PCR for BB (7total) and DH (7 total) samples. primers: IL-17, PGE receptor, Cystatin B, TIMP, Astacin-like
Purpose: 1st real-time run w/ gigas samples from field. Sam isolated RNA, DNase treated and verified free of genomic (see Sam's notebook for prep)
Procedure: prepped mastermix (Syto plus SYBR) loaded plate - see details here
Results: Melt curve shows 2 peaks for many of the primer pairs (RNA was tested already for genomic carryover and are clean). Graphed results for the 2 groups anyway using Ct (acceptable as conc. of RNA going into cDNA rxns was normalized). The intra-site variability for Ct was highest for 18s.


Conc. and next steps: Using these 7 samples from each group, there does not appear to be significant differeneces in expression levels of these particular genes between these two sites. I would like to repeat this however because I don't have any experience with this SensiMix plus SYBR, so I would like to use the Stratagene mm to see if melt curve issues could be due to reagents.
April 2009: Field Data Report Sheets
Big Beef 04/25/09: page 1 page 2
Drayton Harbor 04/26/09: page 1 page 2
Lynch Cove 04/29/09: page 1 page 2
North Bay 04/29/09: page 1 page 2
Samish Bay 04/30/09: pages 1 and 2
Willapa Bay 05/01/09: pages 1 and 2
NOTE: mechanical stress = 5 min.
4/24/09
Summary: qPCR MV RNA isolated 4/21/09 to test for genomic carry-over - Cv_18s primers
Procedure:
- diluted RNA samples 1:4 (1uL RNA, 3uL H20)
- prepped mastermix and loaded plate - see details here
- loaded MV cDNA pos control and H20 neg controls
Next steps: prep cDNA
4/21/09
Summary: isolated RNA from MV samples Nov 2006 (ID: 3219), DNAse treated and quantified RNA
Sample ID for 12 samples:
A: A5, A6, A7, A8, A9, A10
B: B5, B6, B7, B8, B14, B15
Notes for samples: these samples already had a separate "supe" tube. ~100uL in hemocyte sample, not all had visible pellets.
Procedure:
- added 1 mL TRIReagent to each tube, followed mfr protocol. Final volume 20uL in 0.1% DEPC H20
- used 10uL of RNA to DNAse, the remaining volume was frozen at -80C in same box as original hemocyte and supe samples
- followed Manufacturer's instructions for Ambion's turbo DNA free kit
- 20uL reactions: 10uL RNA template, 2.0uL 10x buffer, 1uL DNase, 7uL H20
- incubated at 37C for 30 min
- added 2uL inactivtion reagent
- total vol RNA at the end ~ 15
- quantitated samples on Nanodrop
- samples were frozen at -80C in the original box w/ hemocytes and supe - 0.5 mL tubes labeled as "DNase TX"

Conc. and Next Steps:
Results look pretty decent (comparable to other hemocyte RNA isolations). I included a DNAse negative in the DNAse procedure just to see what it looked like on the nanodrop. I blanked on water and the DNAse blank had a bit of absorbance at A260 (came out at ~3ng/uL), this is most likely background absorbance and not contamination (260/280 is low). Just wanted to check :) Next step is to check for presence of genomic carry-over by running DNAse treated RNA in qPCR using Cv_18s primers.
4/01/09
Summary: summary of analysis for MV oysters Aug06 sampling

Conclusion: Did not have statistical significance at p=0.05 for any of the 5 genes analyzed, although HSP70 was close (p=0.06). There was a LOT of variability among individuals and I would like to follow up with some power analysis to see what kind of sample size would be required for sufficient power.
Next steps: I do have an additional set of primers I have not run yet (for toll-like receptor)that I could try.
Start processing samples for other time points when sample arrive.
MMMmmm, I also wonder if I should do a dilution curve with these primers to see what kind of linear range I have. Maybe with some pooled Cv DNA??
Bigger Picture: Now thinking about gigas and PS, would like to get samples as soon as possible to start getting an idea of variability within and between sites. Scary to think about # samples that may be required.
3/31/09
Summary: real-time of MV samples (originally tested 3/24/09 (see below)) using 18s primers to confirm results from 08/08/07
PCR plate layout
Results:

Conclusions: Wow, amplification EARLY for most samples - will not use this data for quantitiation as some samples are likely outside the dynamic range. However, the results for sample B5 and B11 are consistent with the original data from 08/08/07 (i.e. come up 10 to 15 Ct later than other samples). To note, the high Ct for sample A3 is likely due to a pipettting error. Analysis will go forward by normalizing samples to 18s data collected 08/08/07.
3/27/09
Summary: real-time data of remaining MV samples (8/06, ID: 3166)
-Sam ran cDNA of an additional 14 C.virginica samples collected 8/22/06 using the following primers: BgBL, BGPB, CysB, HMG, HSP70
(sample IDs listed below in this entry)
PCR plate layout
-Data were normalized to 18s gene (run performed: 08/08/07)
-Results were analyzed using PCR miner, and will also be analyzed using a standard curve equation.
PCR miner results:

-Will have to analyze w/ standard curve equation tomorrow to compare to the other half of the august 06 samples processed early march.
Question: B05 and B11 have really high gene expression results.
Next step: will repeat 18s to verify data (B05 and B11 had Ct values of 30 and 34 respectively - pretty high for 18s, the RNA for these samples were also among the highest for the group so that's a bit odd).
Sample ID:
List of 3166 samples in order of plate loading (from notebook #8)
| A1 |
B05 |
| A2 |
B06 |
| A3 |
B07 |
| A4 |
B08 |
| A5 |
B09 |
| A11 |
B10 |
| A12 |
B11 |
| A13 |
B14 |
3/05/09
Summary: re-analysis of Methylamp kit results
- accurate estimation of GC content of oysters: 28%, updated calculation
- calc. adjusted to account for correct ratio of pos control DNA/sample DNA. Example calc. in manual says to multiply OD of pos control by 10 (in example 10 times more DNA loaded in sample), so for yesterday's assay need to multiply by 2 instead of 10 (only 2 times more DNA loaded in sample)
- NOTE!: Mfr. recommends only running 10ng of pos control. ODs above 1.2 may not be linear (nice that protocol states to run 100 ng - but don't do it!), this being the case if samples were repeated run 100ng/well instead of 200ng/well to fall within the linear range.
- PS: Don't know if these results look odd (over 100% methylated) because outside linear range, or maybe estimation is not accurate??

3/04/09
Summary:
- finished EtOH precipitation of mantle samples from 3/03. Quantitated samples
- ran samples using global methylation kit
- finished EtOh precipitation: spin max speed 15 min, remove supe, wash w/ 0.5mL 70% EtOH, spin max 5 min. Remove supe - dry 5min. add 90uL H20. quant on Nanodrop

- samples didn't look a ton better, but will still run on kit.
- diluted the following samples (selected based on good purity ratios) to 100ng/uL to run in methylation kit
- Performed MethylAmp Global DNA Methylation Kit (Epigentek) per the manufacturer's instructions
- diluted the following samples to 100ng/uL: pacific oyster mantle, olympia oyster mantle, gill: untreated 1,2,3 and treated 1,2,4, mantle: untreated 1,2,3 and treated 1,2,4.
- loaded 2uL sample/well (200ng total) and 100ng pos control
- Accidentally loaded 2 samples in well H1 (added untreated 1 and 2 mantle to the same well)
Analysis:
I fudged the analysis a bit because I don't know the %GC content for gigas...so the calculation is:
OD(sample - blank)/X
OD (pos cntrl-blank) x 10
X= %GC content of species
10 = some dilution factor I think, but I need to call Epigentek (doesn't really matter since I made up 40% GC content too (human is 41%))

Conclusions:
So the final #'s may not be meaningful yet (until I estimate the true GC content), but comparisons can be made.
- Wild Pacific oyster mantle and untreated Taylor oysters mantle have slightly different % methylation, 24.6 and 22.6% respectively
- The wild Olympia oyster had the lowest methylation (17%)
- The experiment:
- gills: treated group may be slightly methylated
- mantle: can't really tell since I double loaded 1 well with 2 samples--but it appears that the untreated samples could be a lot lower than the other samples. Next step would be to run these mantle samples again (sadly).
3/03/09
Summary: isolated genomic DNA from oysters in "epigenetic experiment" (see 2/24/09). Plus 1 wild Pacific oyster mantle sample and 1 wild Olympia oyster mantle sample (18 samples total).
Procedure:
- weighed ~25mg of tissue into 1.5mL centrifuge tubes
- added 20uL of proteinase K, centrifuged and then spun down contents
- incubated samples at 55C for 3 hours
- followed mfr. instructions for washing and eluting (eluted in 100uL total AE buffer
- quantitated samples on Nanodrop
- results:
The gill samples all looked ok. The mantle samples, not so much - really low A260/230 ratios. I'm worried about running them in a new assay system, so I put the gill samples at -20 and initiated an ethanol precipitation for all of the mantle samples: 90uL eluate, 9uL 3M NaOac - mix - 198uL ice cold EtOH-mix-and store at -20C.
2/24/09
Sampled oysters from "epigenetic experiment" ~ 11am. Four control and 4 treated oysters - samples of gills and mantle from each. Samples were stored at -20C.
Image from Sam's notebook regarding treatment:

2/18/09
RACE sequences in for prostaglandin E receptor
summary: not a lot of sequence. only about 160 bp more than we knew before.

2/09/09
C.virginica project
summary: DNAse of 4 RNA samples ("other" samples), quantification of RNA, Reverse Transcription
-sample ID: (from box labeled Oyster Hemocytes RNA (6.12.06) in -80C freezer)
1) 7/11/06 oyster virginica RNA pool
2) 6.20.06 oyster hemocyte RNA curve
3) Tisbury North #1 hemocyte RNA (TRi)
4) Edgardown North #4 hemocyte RNA (TRi)
-DNAse treated 4 C.virginica RNA samples to use for testing primer sets. Used Ambion, Turbo DNA free kit.
-Each rxn contained: 5uL RNA, 1uL 10x DNAse buffer, 1uL DNAse, 3uL H20. After 20 min incubation at 37C added 2uL DNase inactivation reagent. Continued w/ protocol then quantified RNA on Nanodrop.
-
-reverse transcribed RNA samples, using 5 uL RNA for each sample. Followed procedure as performed on 2/03/09.
-stored cDNA at -20C in Mac's -20 box 2.
Perform RACE PCR for C. gigas prostaglandin E receptor cont. from 2/07/09
-Ran the 2nd half of the PCR rxns on a small gel and cut out bands (bands in the same order as 2/07/09). Results were not different, but easier to cut on the small gel since the bands were a bit more intense.
-Extracted DNA from agarose using millipore ultra-free-DA and stored at -20C.
-Will send out for sequencing on Friday.

2/06/09
Perform RACE PCR for C. gigas prostaglandin E receptor
designed 5' and 3' RACE primers from C. gigas EST EW777722. Below is overlay of C.gigas EST and D.rerio PGE receptor. Guess that 5' band is about 600 bp and 3' bnad about 1300 bp.

Performed RACE ready first strand cDNA synthesis (5' and 3') and RACE PCR per manufacturer's instructions
procedure page 1
procedure page 2
in summary: two things went not according to protocol. 1. did not use reverse trasncriptase from kit (didn't see it), so used Promega MMLV 2. accidentally added 3' gene specific primer to UPM negative control tube (oops- no longer a negative control). Held samples at 4C in thermal cycle over night.
2/07/09
ran products on gel
sample prep: 25uL sample, 5uL 5x loading dye (25uL of remaining rxn placed in Mac's -20 box)
gel prep: 150mL 1xTAE, 2g agarose, 12uL EtBr
gel: run at 100V ~ 50 min
image:
(note: this is a scan of a print out. bummer image)
Lane ID:
| 1. 100 bp ladder |
7. 3' Sam's cDNA |
| 2. 5' Sams cDNA (june 2008) |
8. 3' cDNA (MG) |
| 3. 5' cDNA (MG 2/6/09) |
9. pos control (both primers) |
| 4. 5' pos control (both primers) |
10. neg control (UPM only) |
| 5. 5' neg control (UPM only) |
11. neg control (3' primer only) |
| 6. 5' neg control (5' primer only) |
12. Hyperladder |


cut bands from lane 2. ~1500bp when compared to Hyperladder, lane 4. ~ 400 bp when compared to hyperladder, lane 8. ~1600 bp when compared to Hyperladder, lane 10. ~1600 bp when compared to Hyperladder (band is SO faint). Also saw very faint band concordant with the 1600 bp band in the 3' negative control for 3' primer only (lane 11). that was surprising.
Summary:
1) bands not observed consistently in 1 prep of cDNA. For the 5' samples only Sam's cDNA showed a band, for the 3' cDNA only Mac's cDNA showed a band.
2) bands not as expected. especially for the primer controls the size of the product is 3x bigger than expected - band is really faint. 5' band is a lot bigger than expected (lane 2), 3' band is a also a bit bigger than expected (lane 8).
3) I still have half the product left. Would like to run it again (maybe on smaller well size? for a denser band width), to try to get better images.
Thoughts....
02/04/09
Test for Genomic Carryover in RNA from plated hemocytes – cont. from 2.3.09
-diluted RNA 1:5 (should have diluted 1:4, but realized that too late) to represent the total dilution performed during reverse trancription
-ran diluted RNA in real-time PCR w/ PGS_g primers. If genomic carryover then expect to see amplifcation in RNA samples.
Results: (sample ID and Ct)
1. 37.01
2 . 36.33
5. 36.33
6. 39.6
7. N/A
9. N/A
genomic. 31.2
water. N/A
water. N/A
Melting Curves:

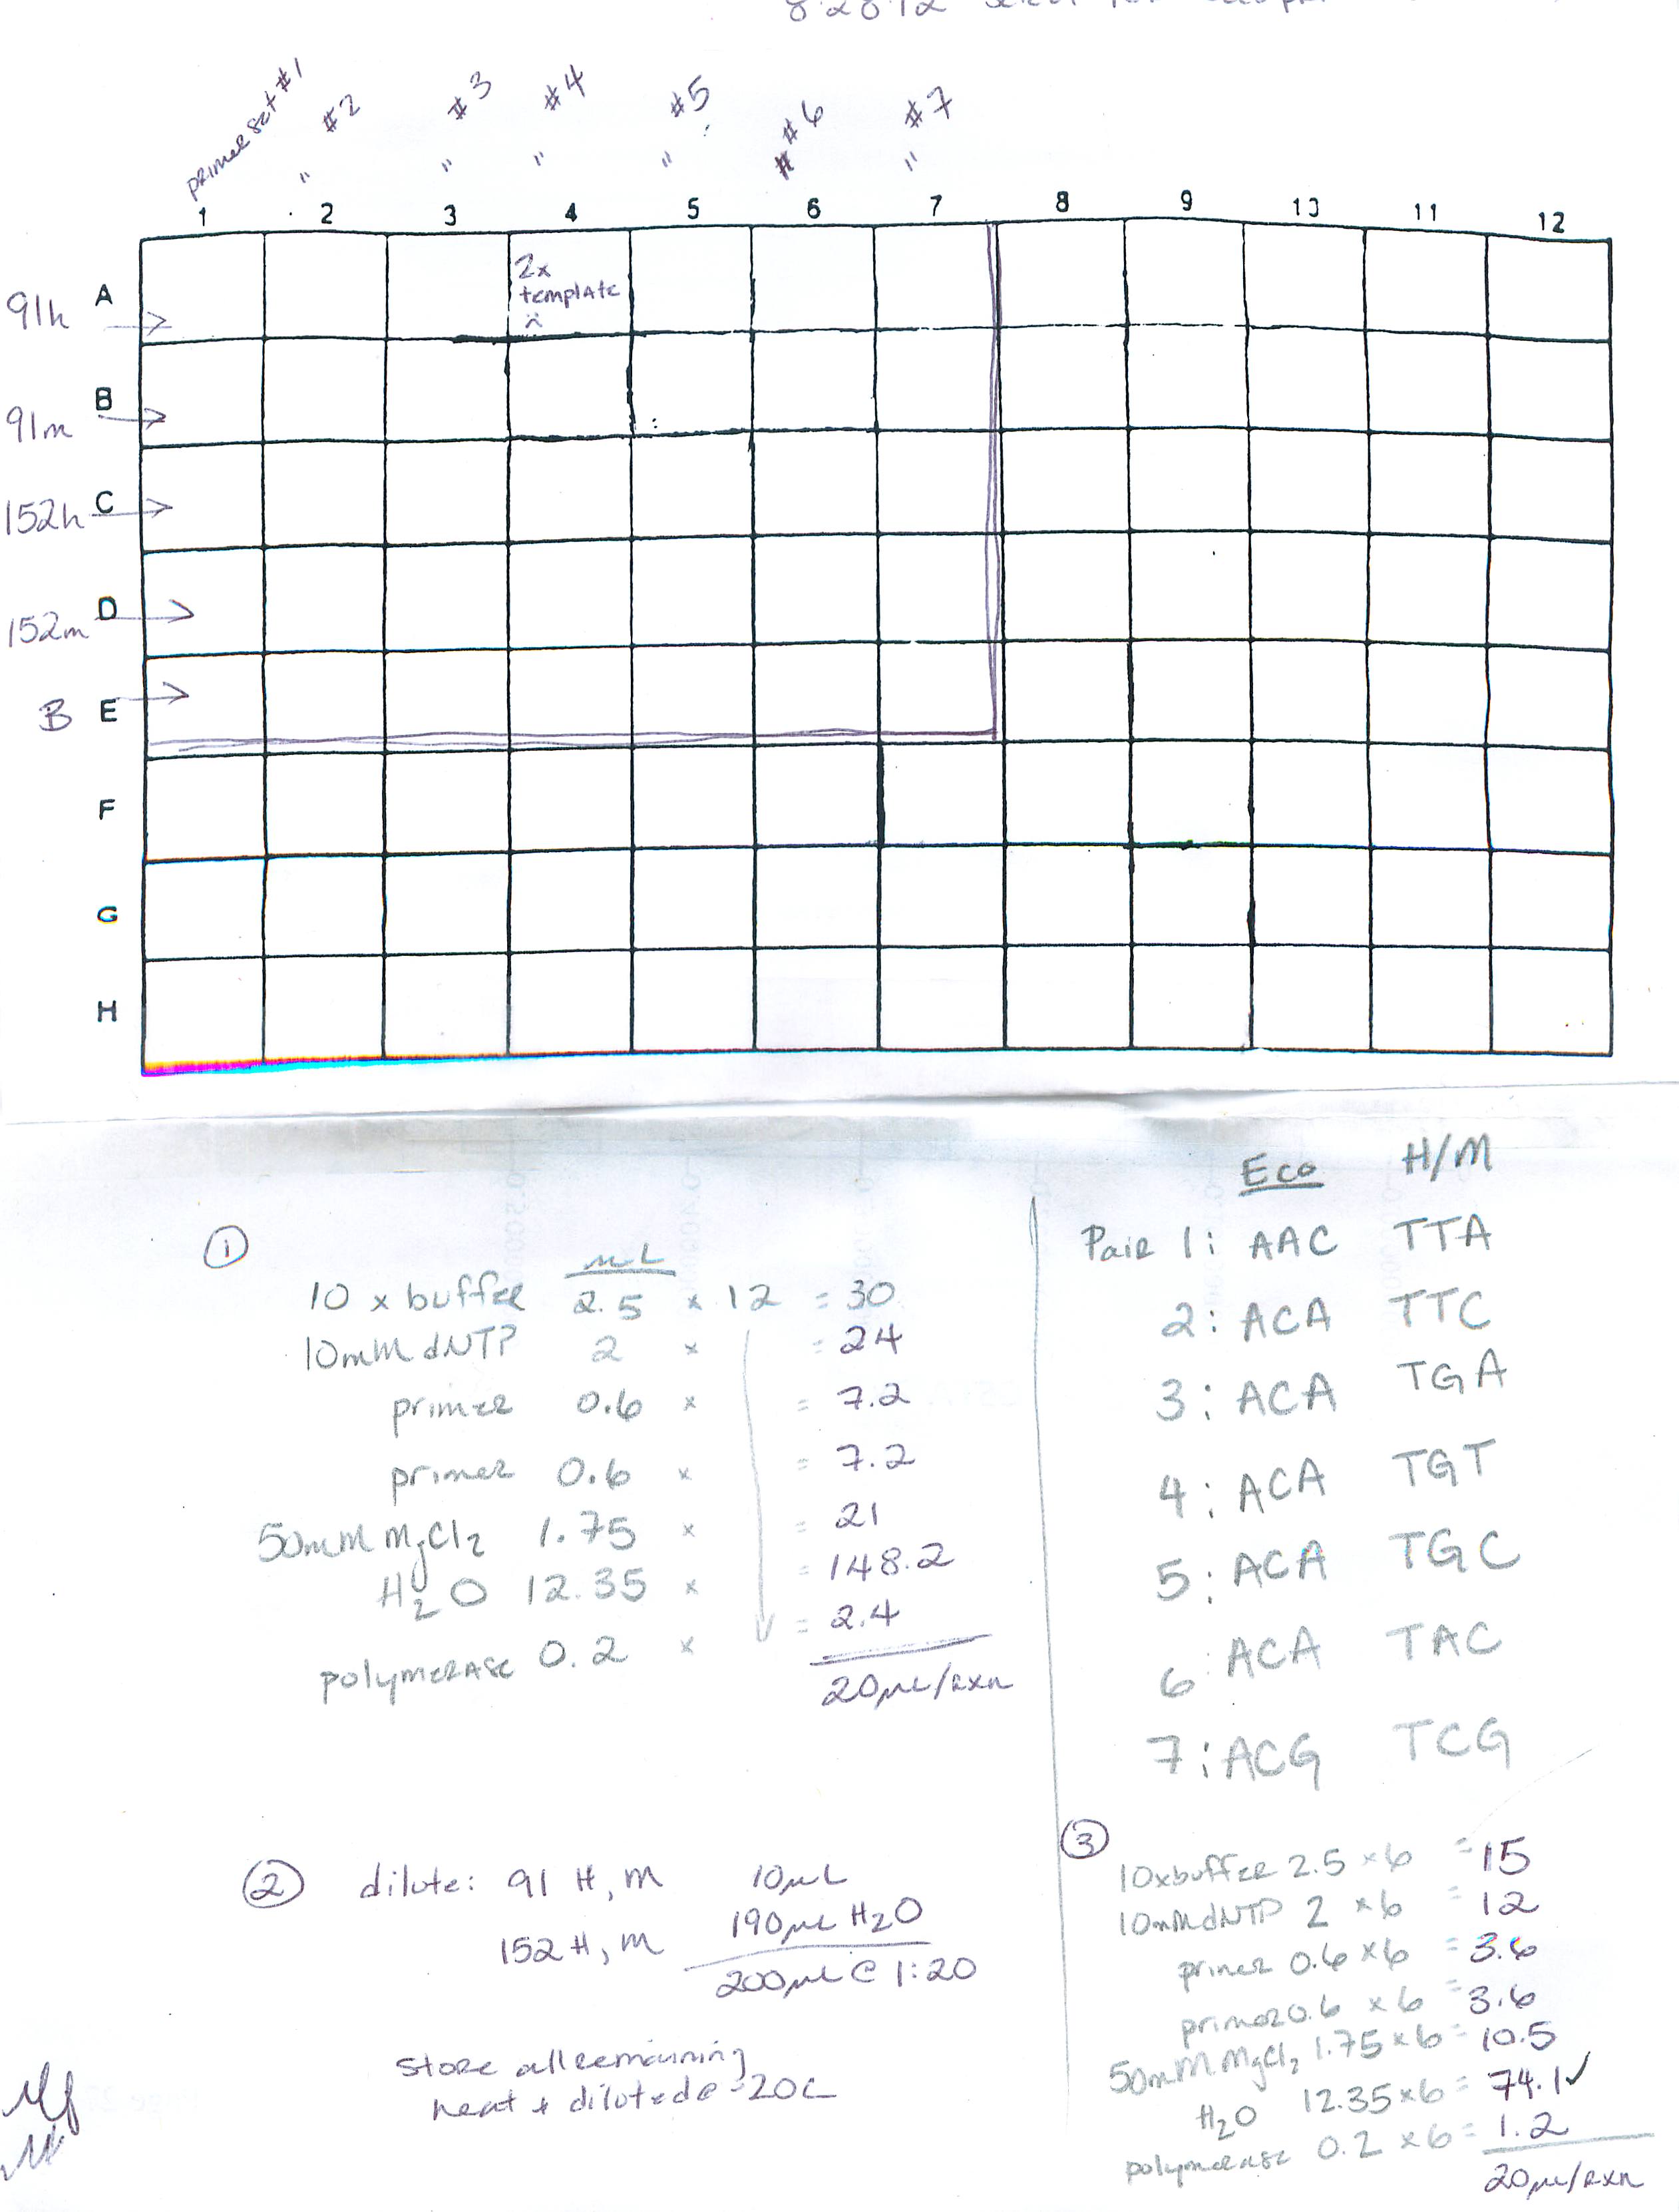
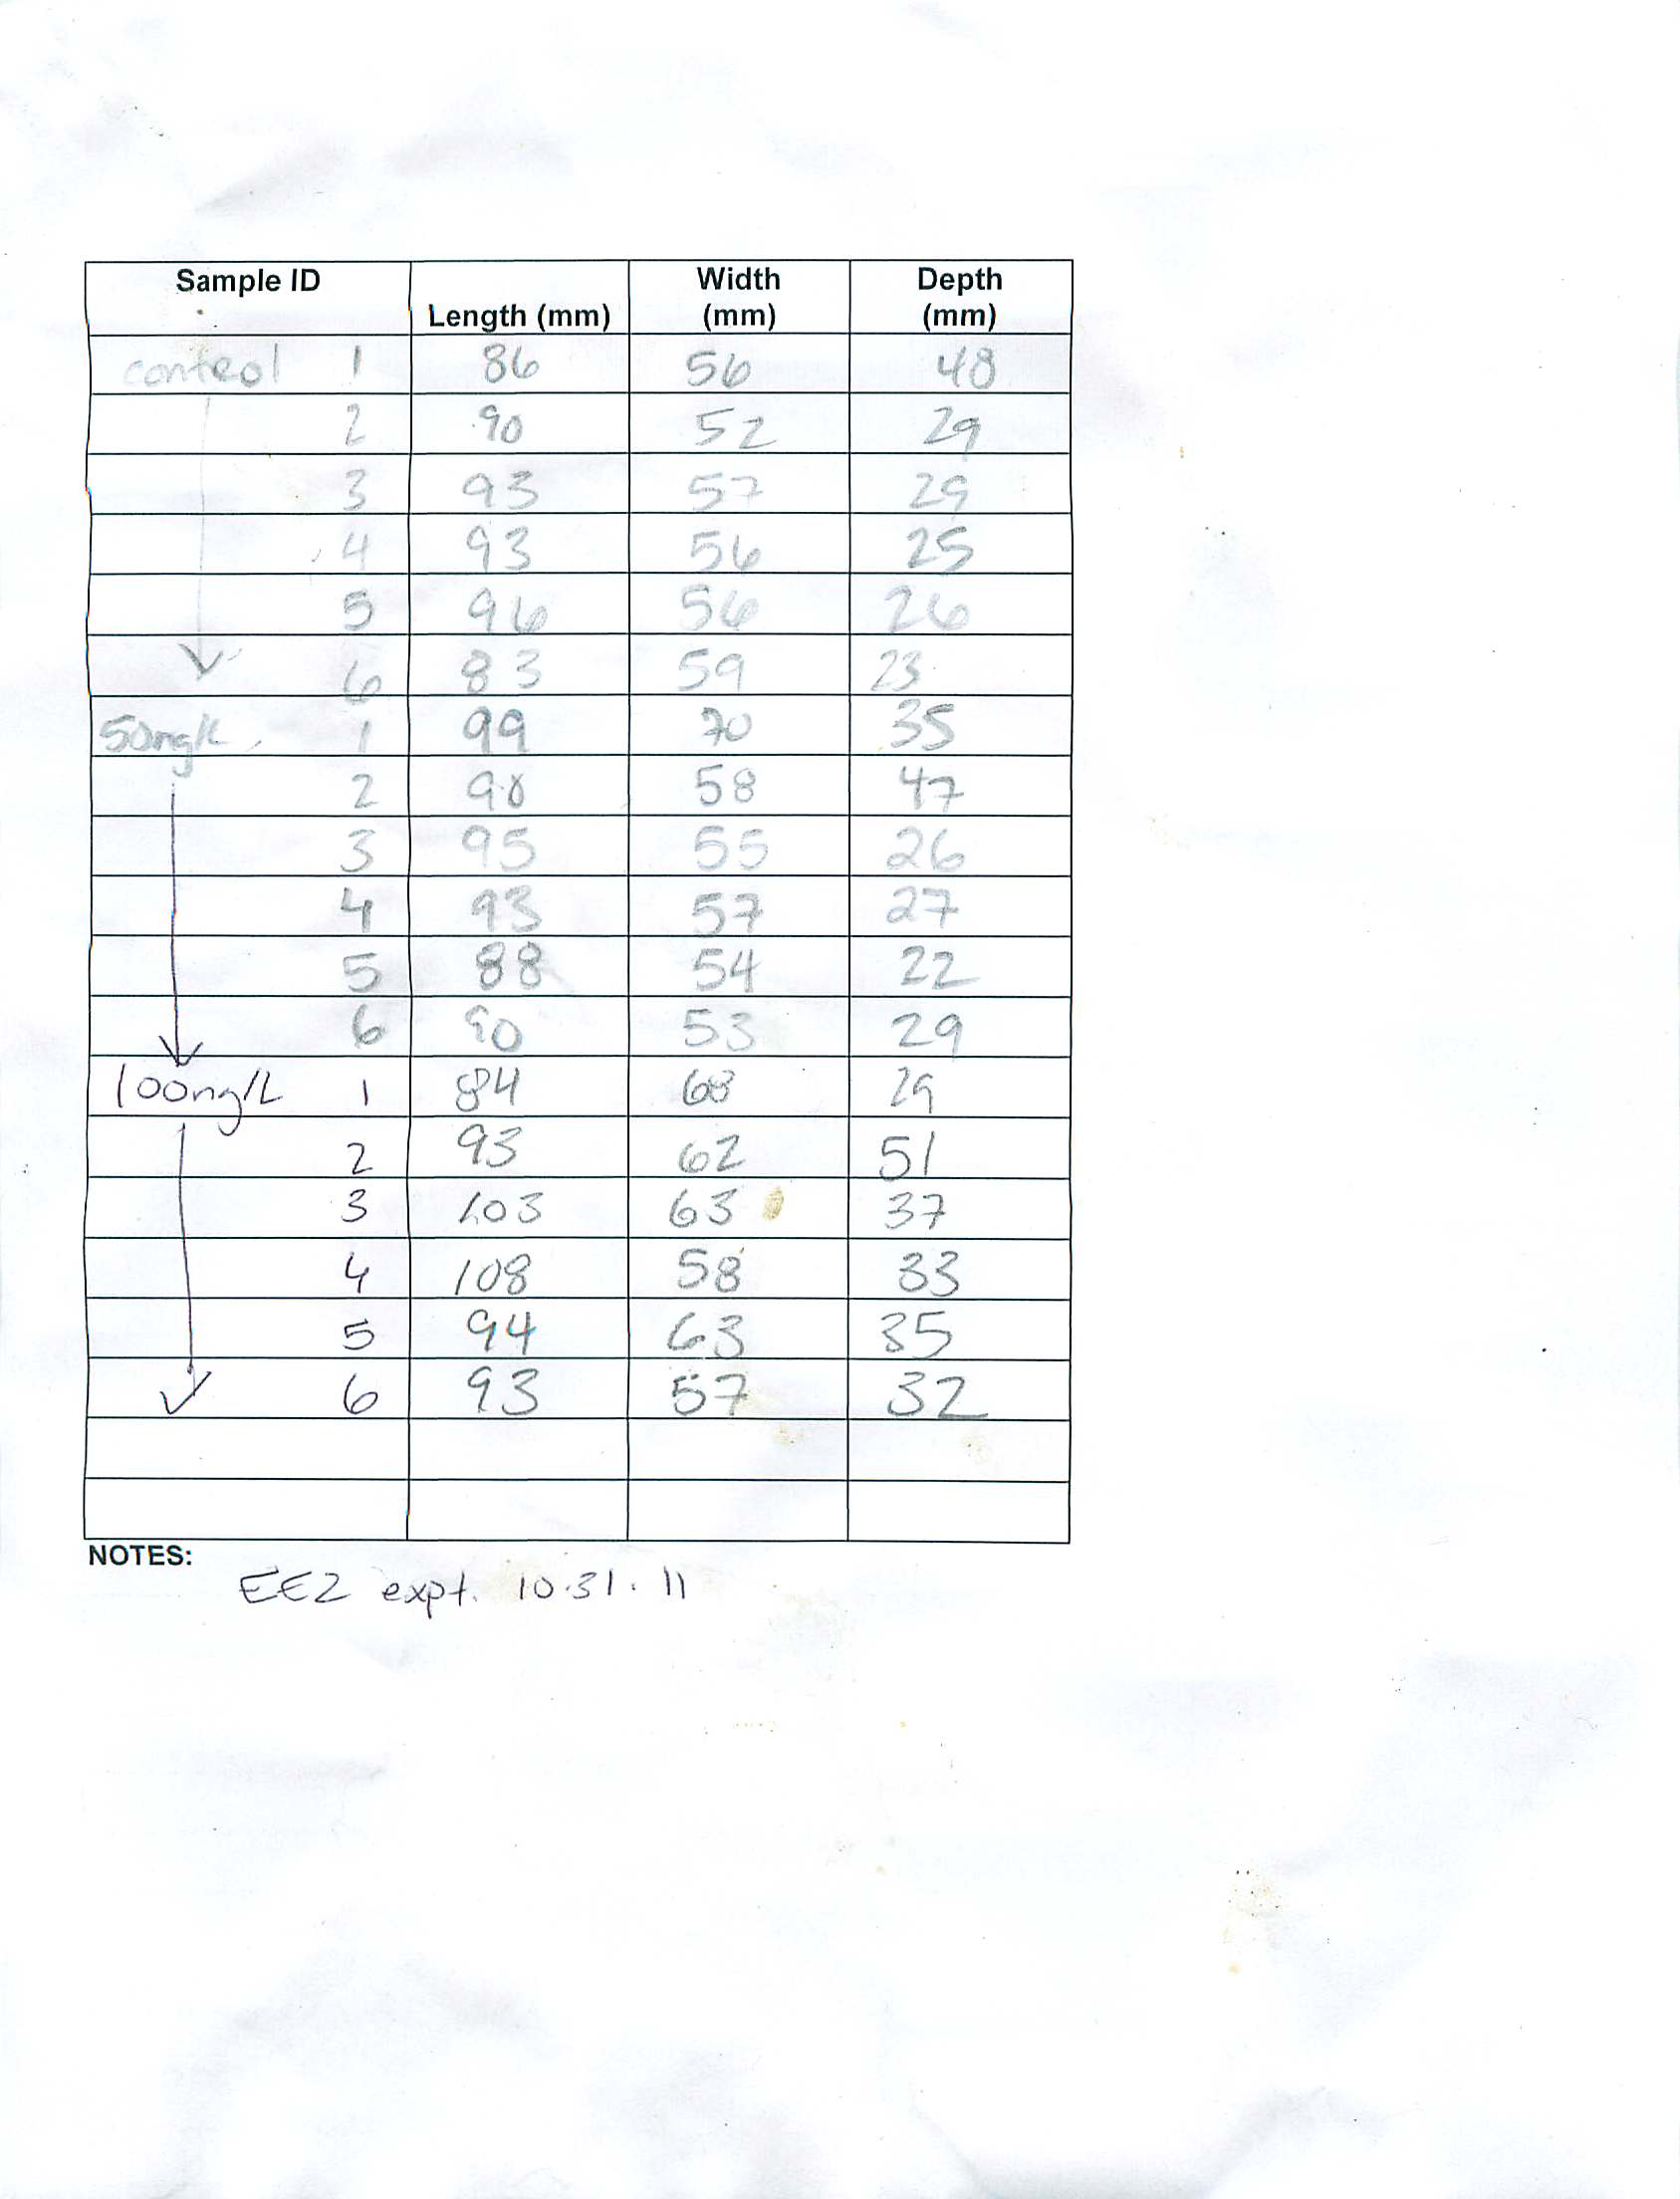
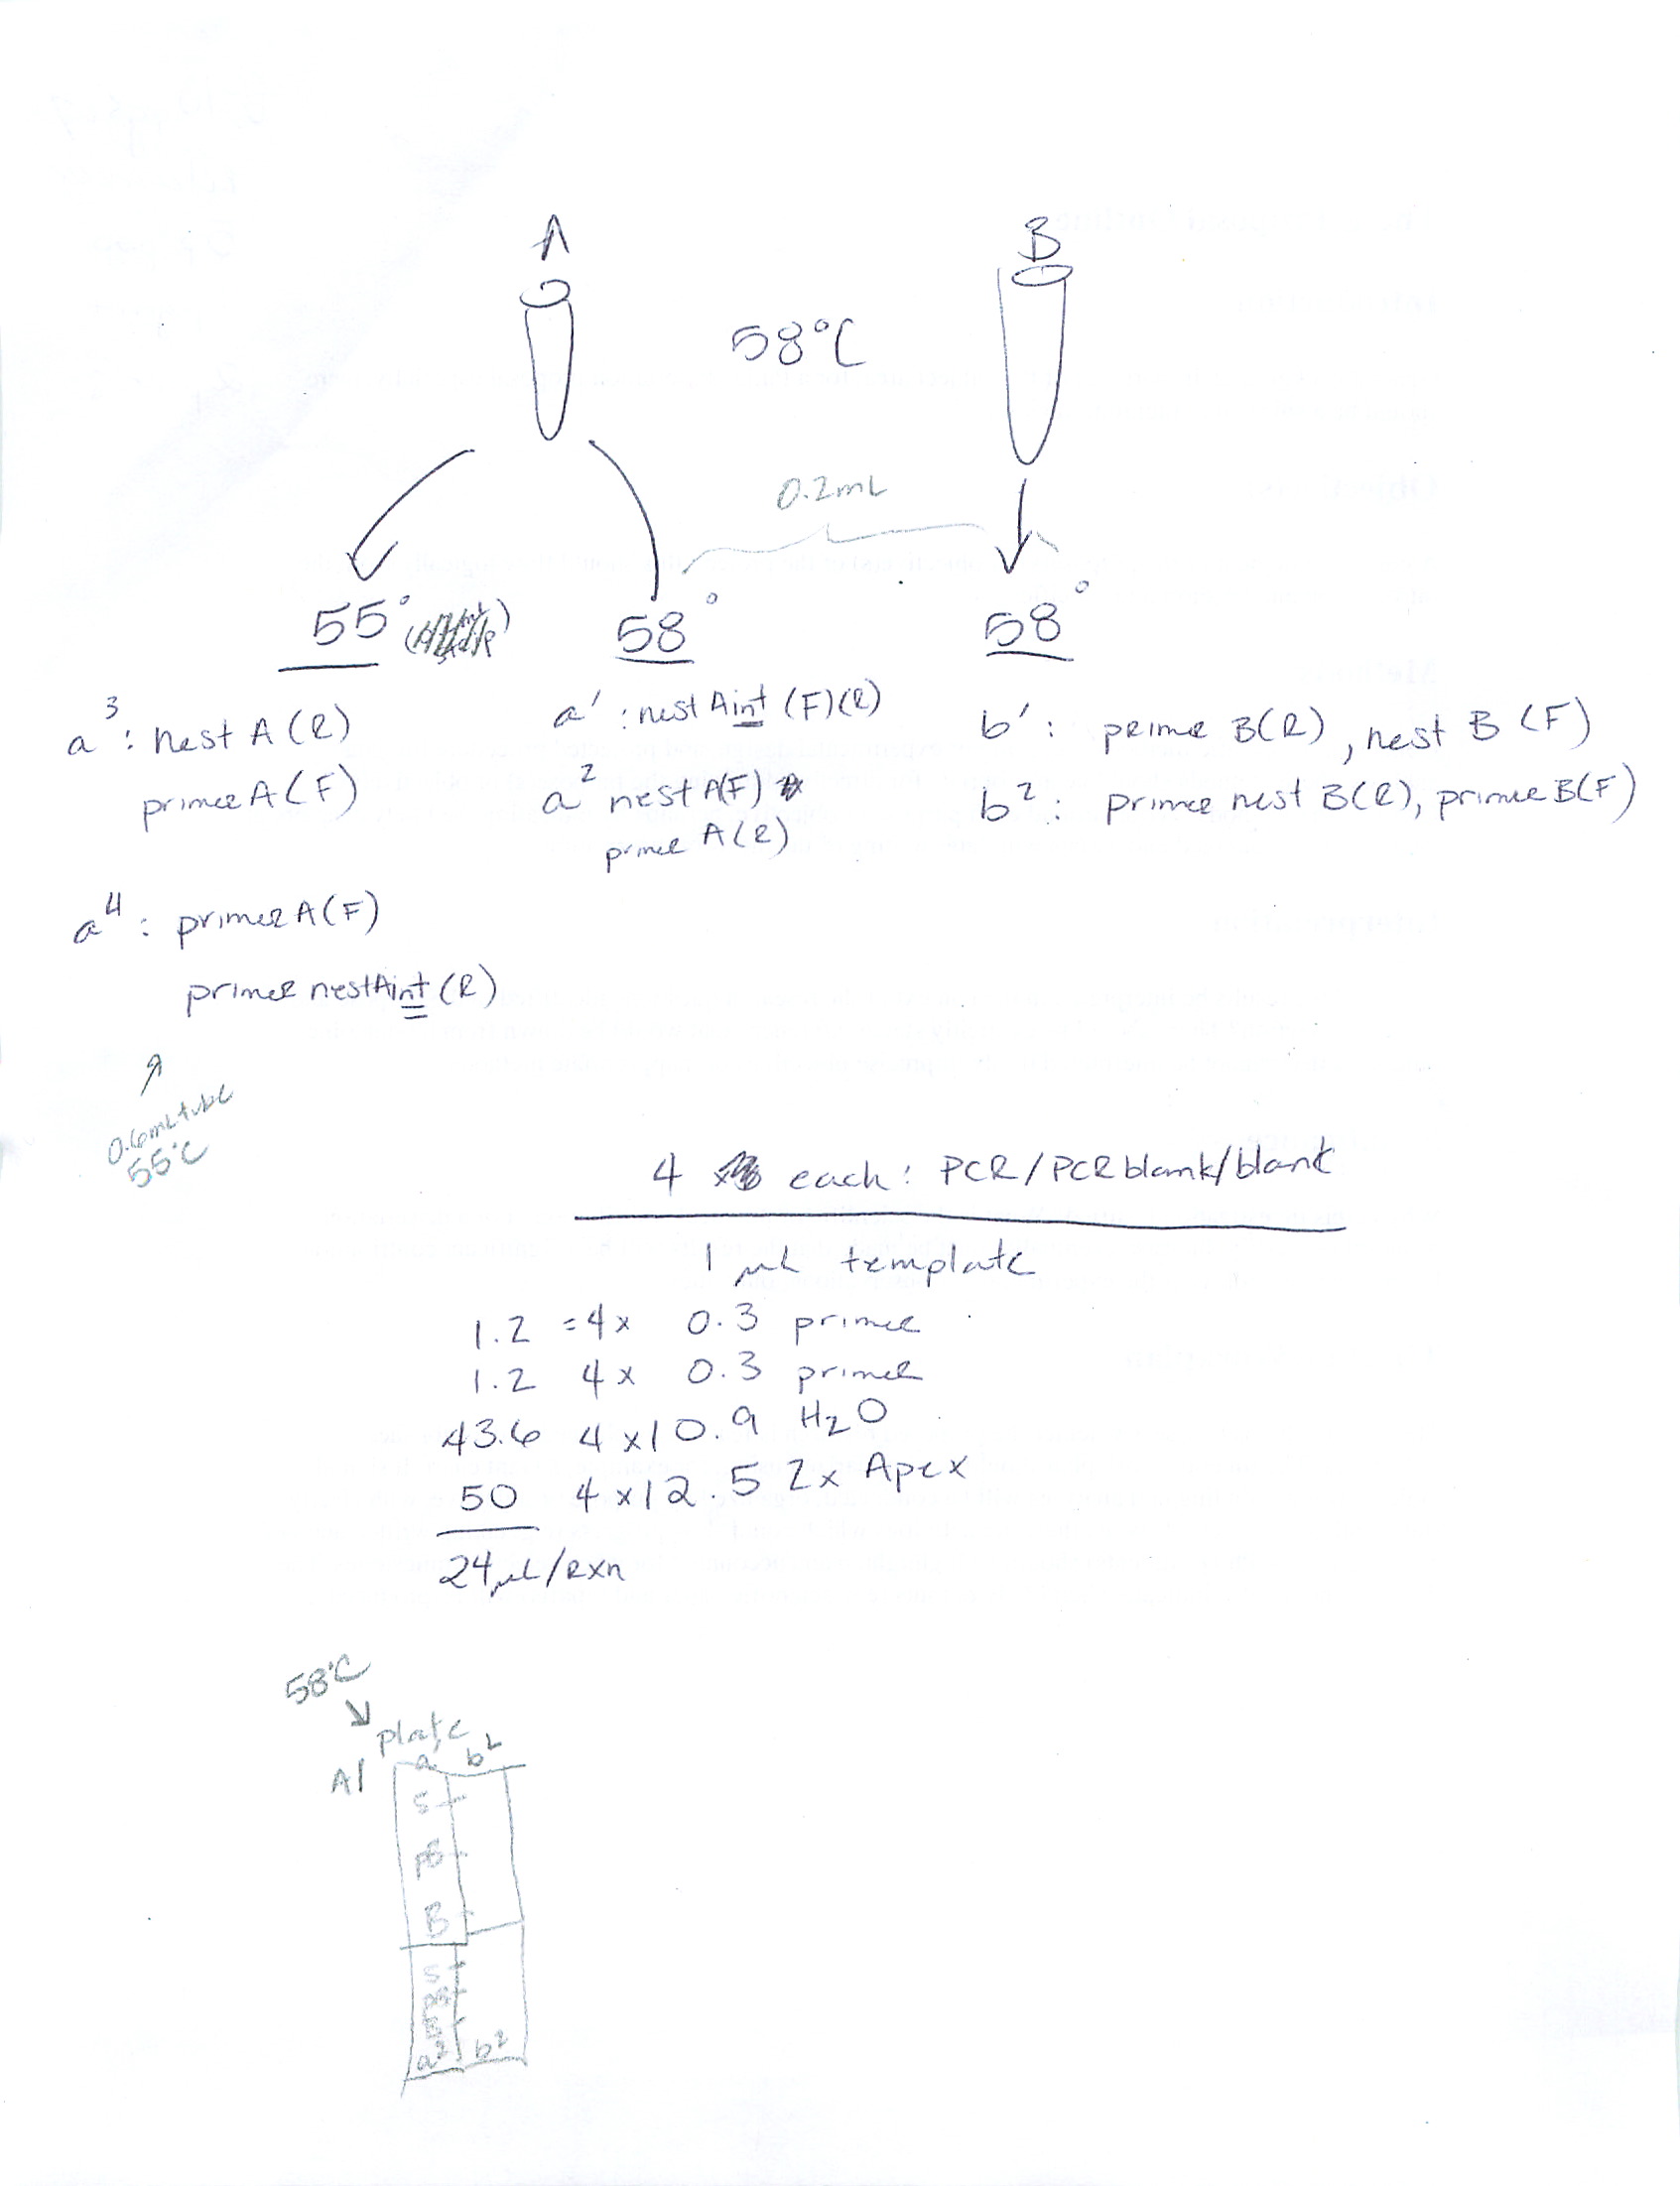
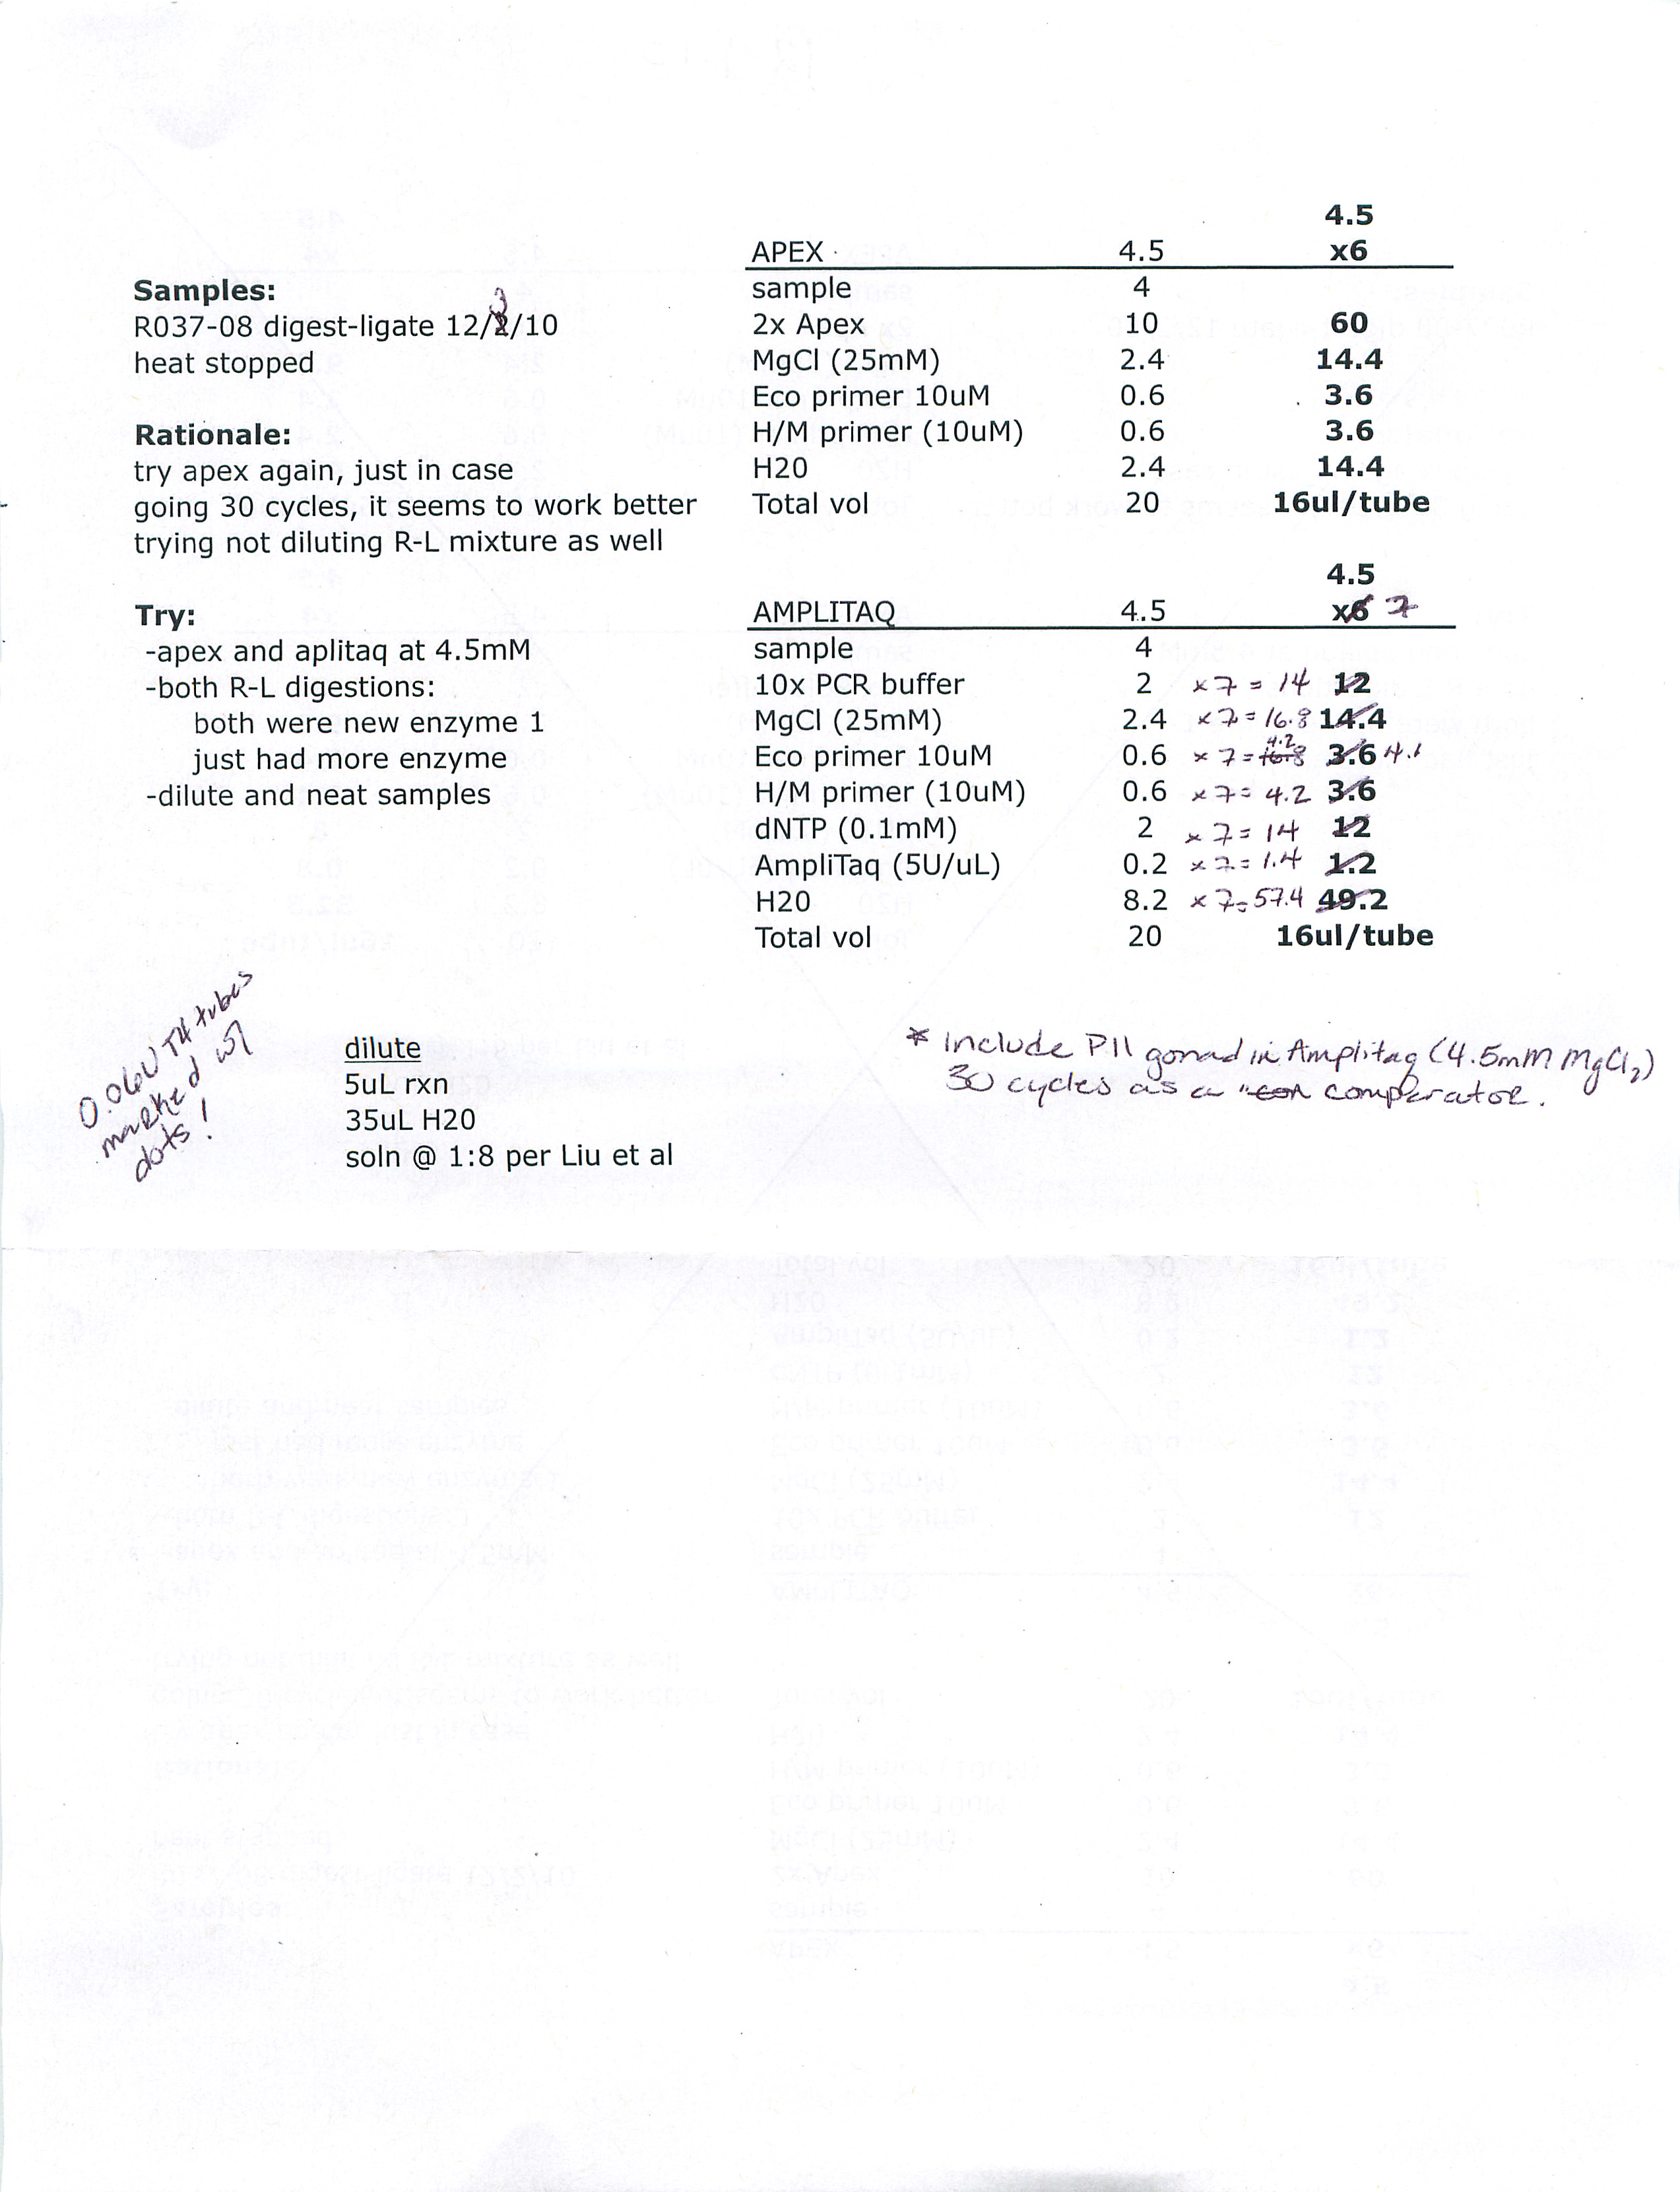
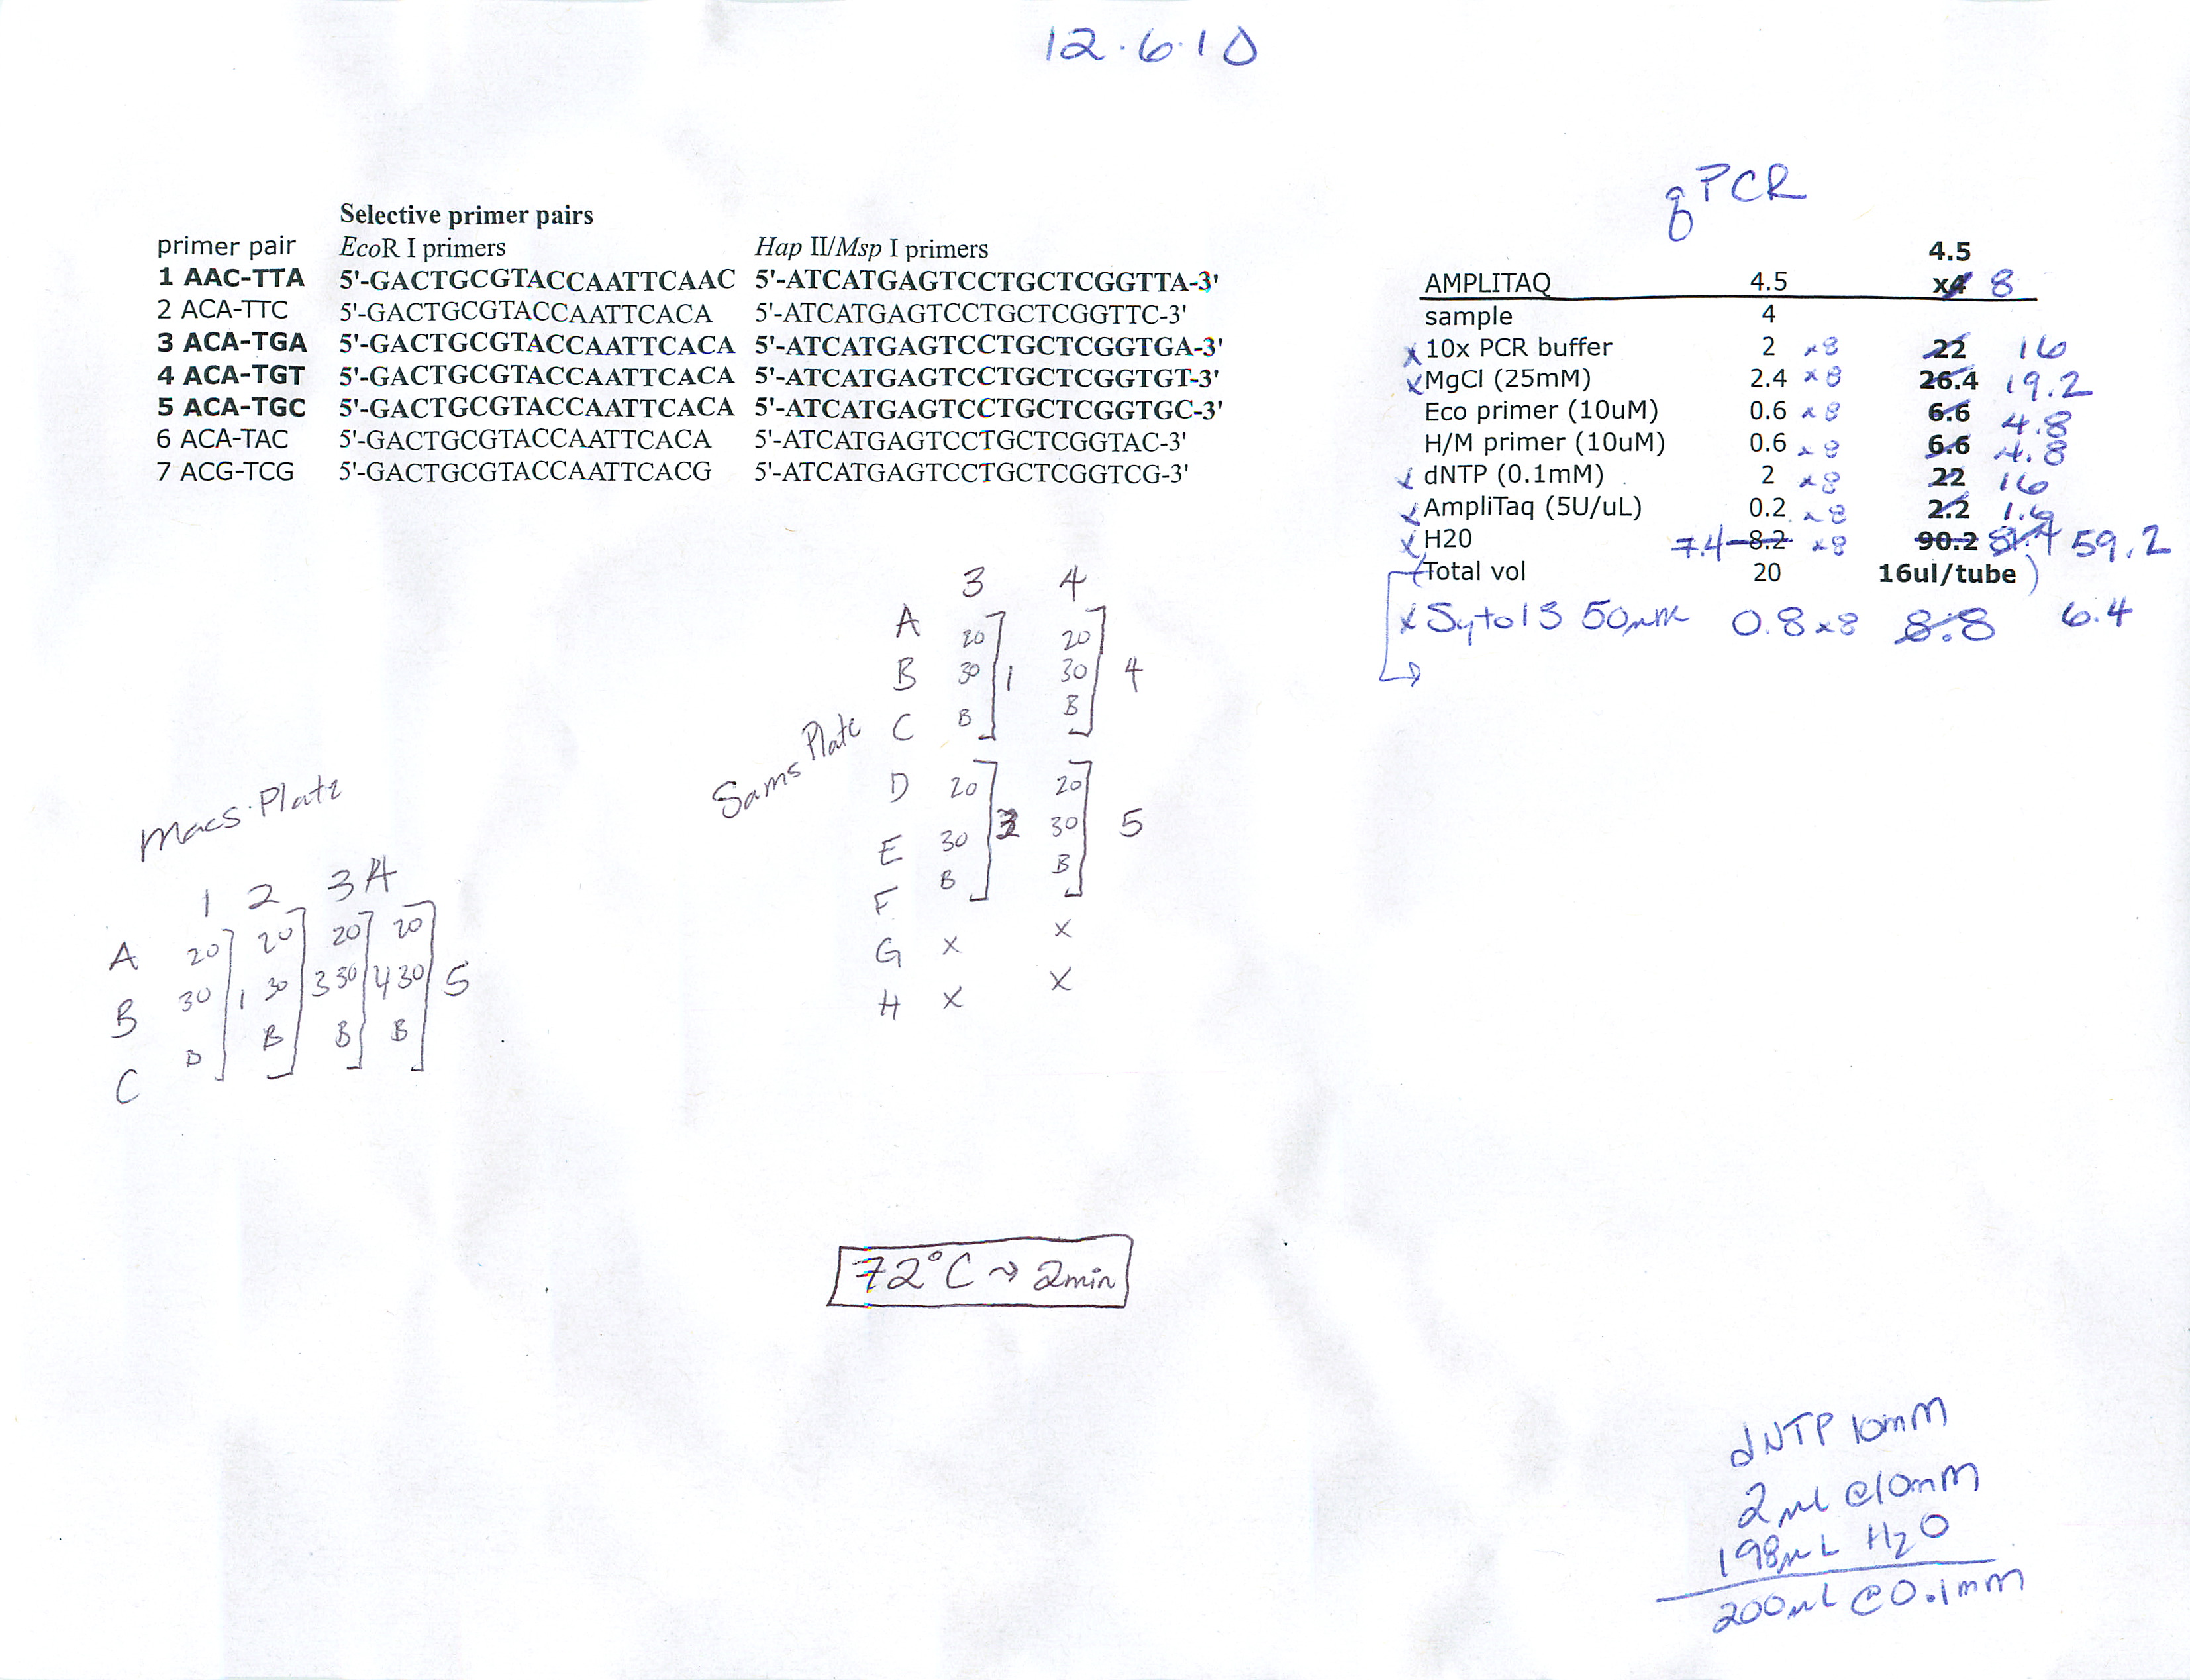
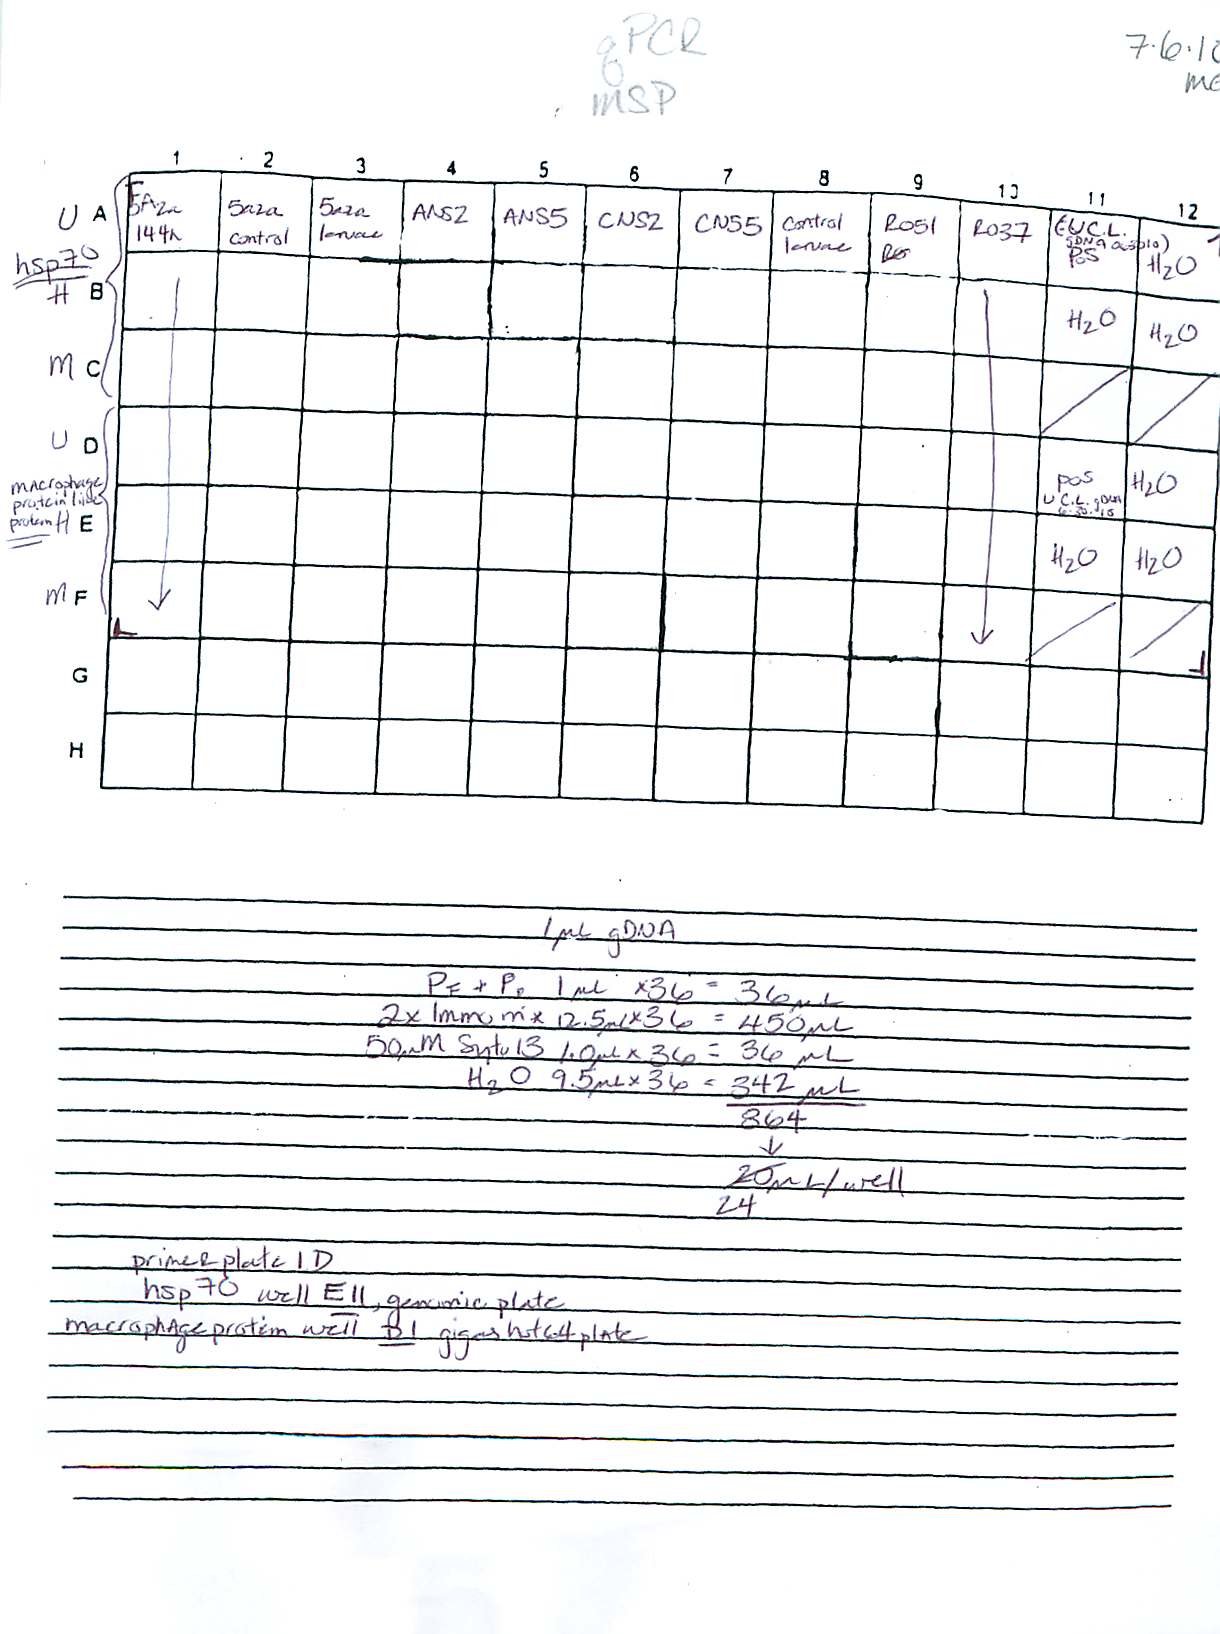
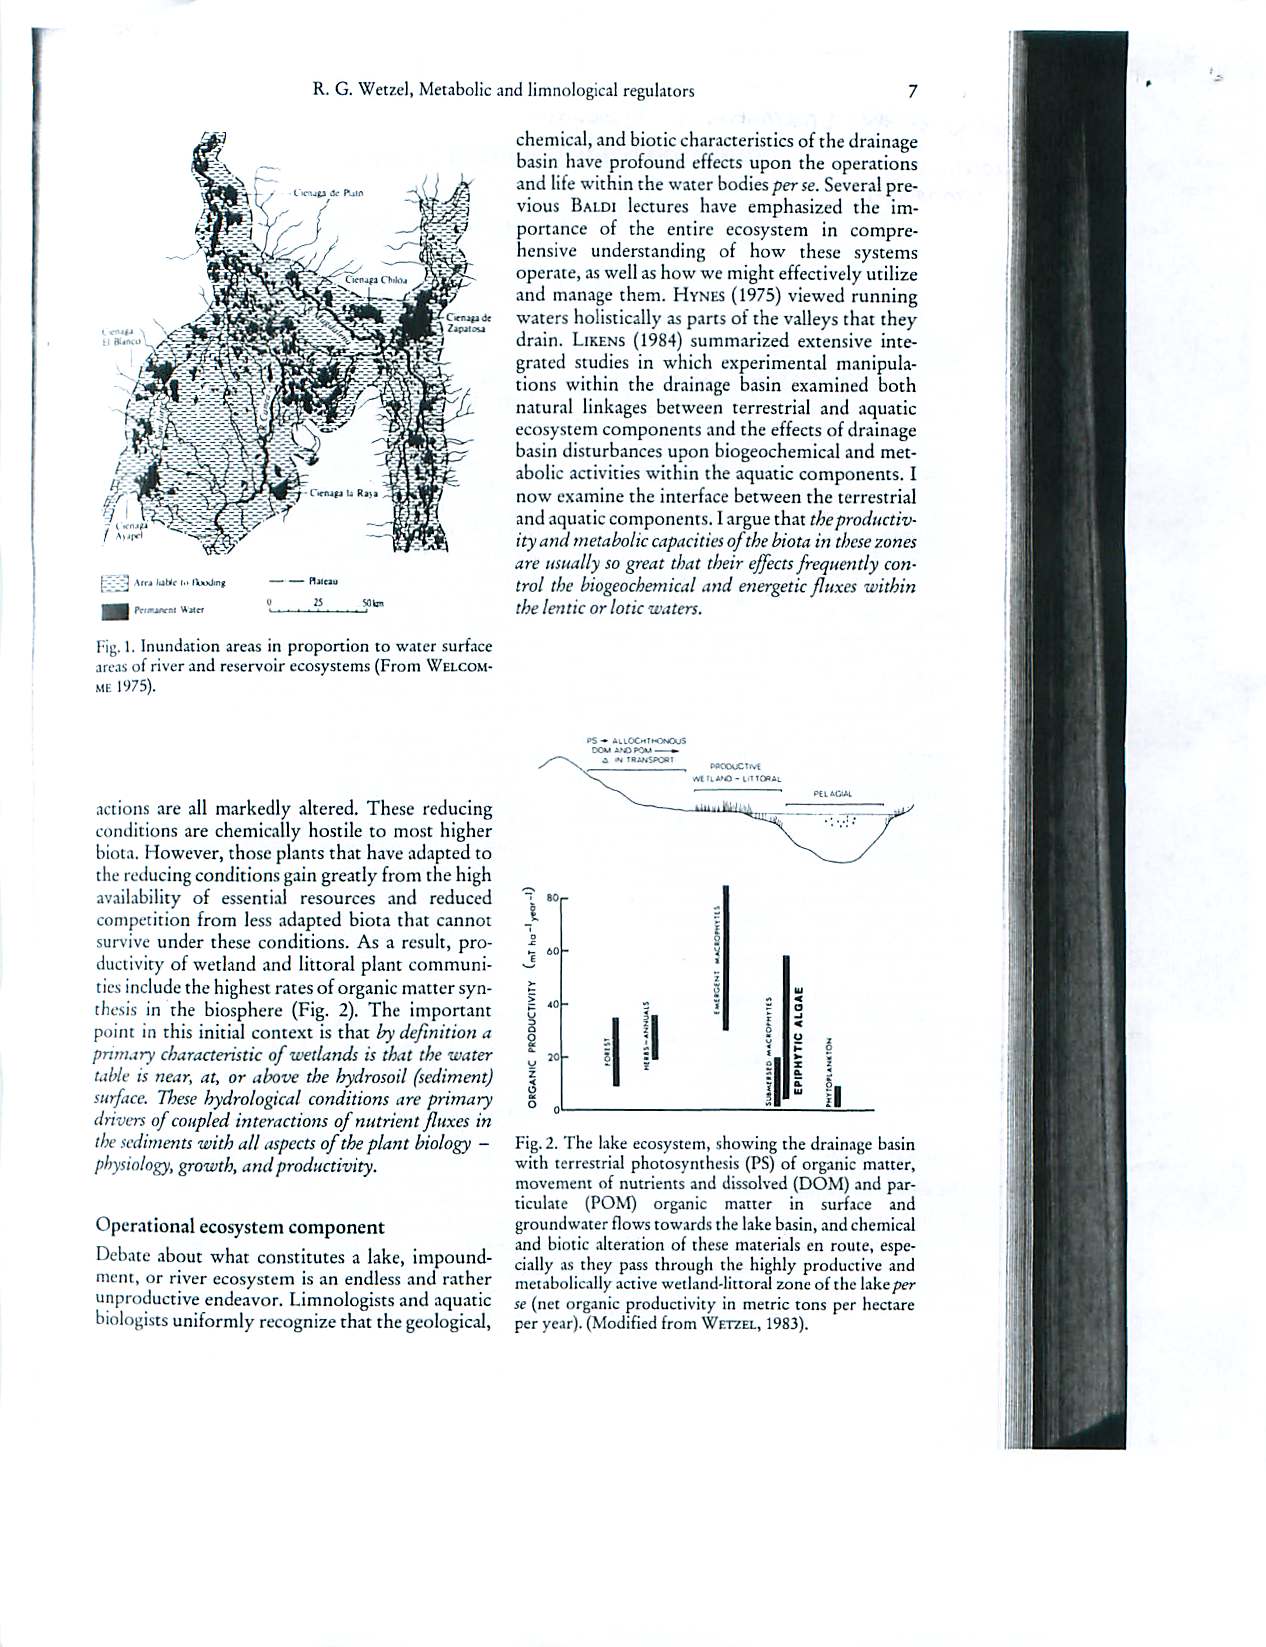
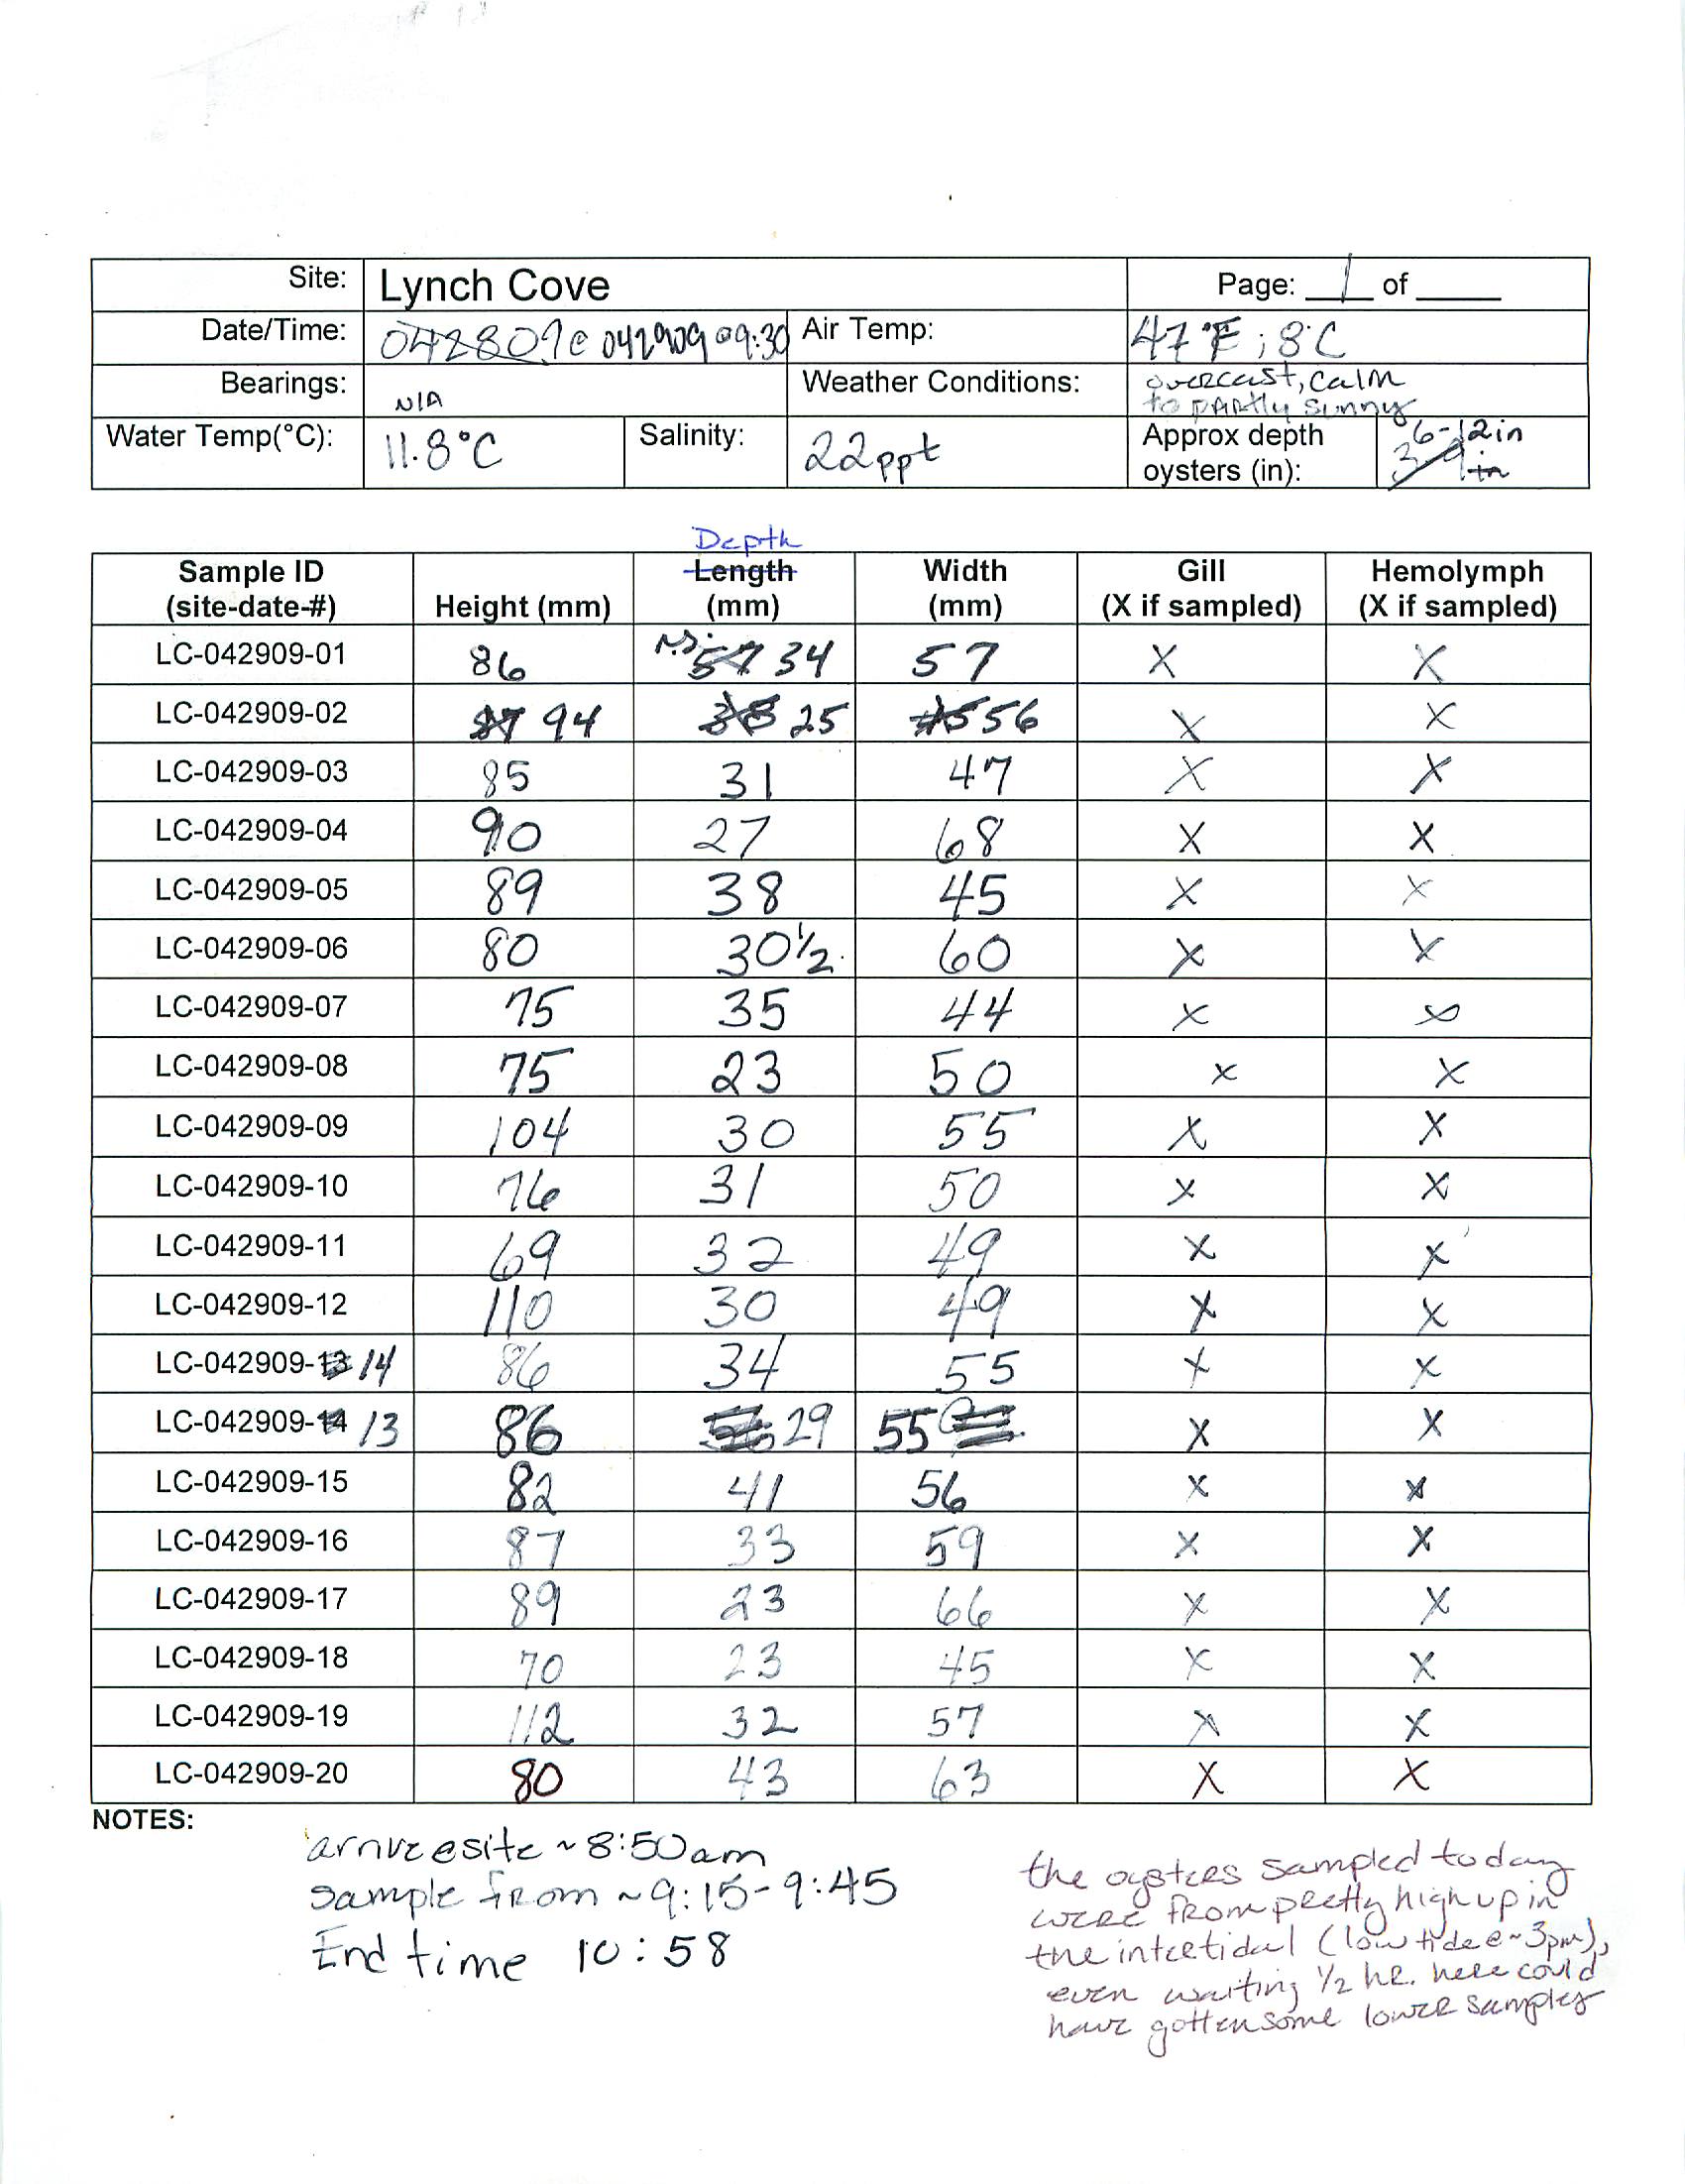
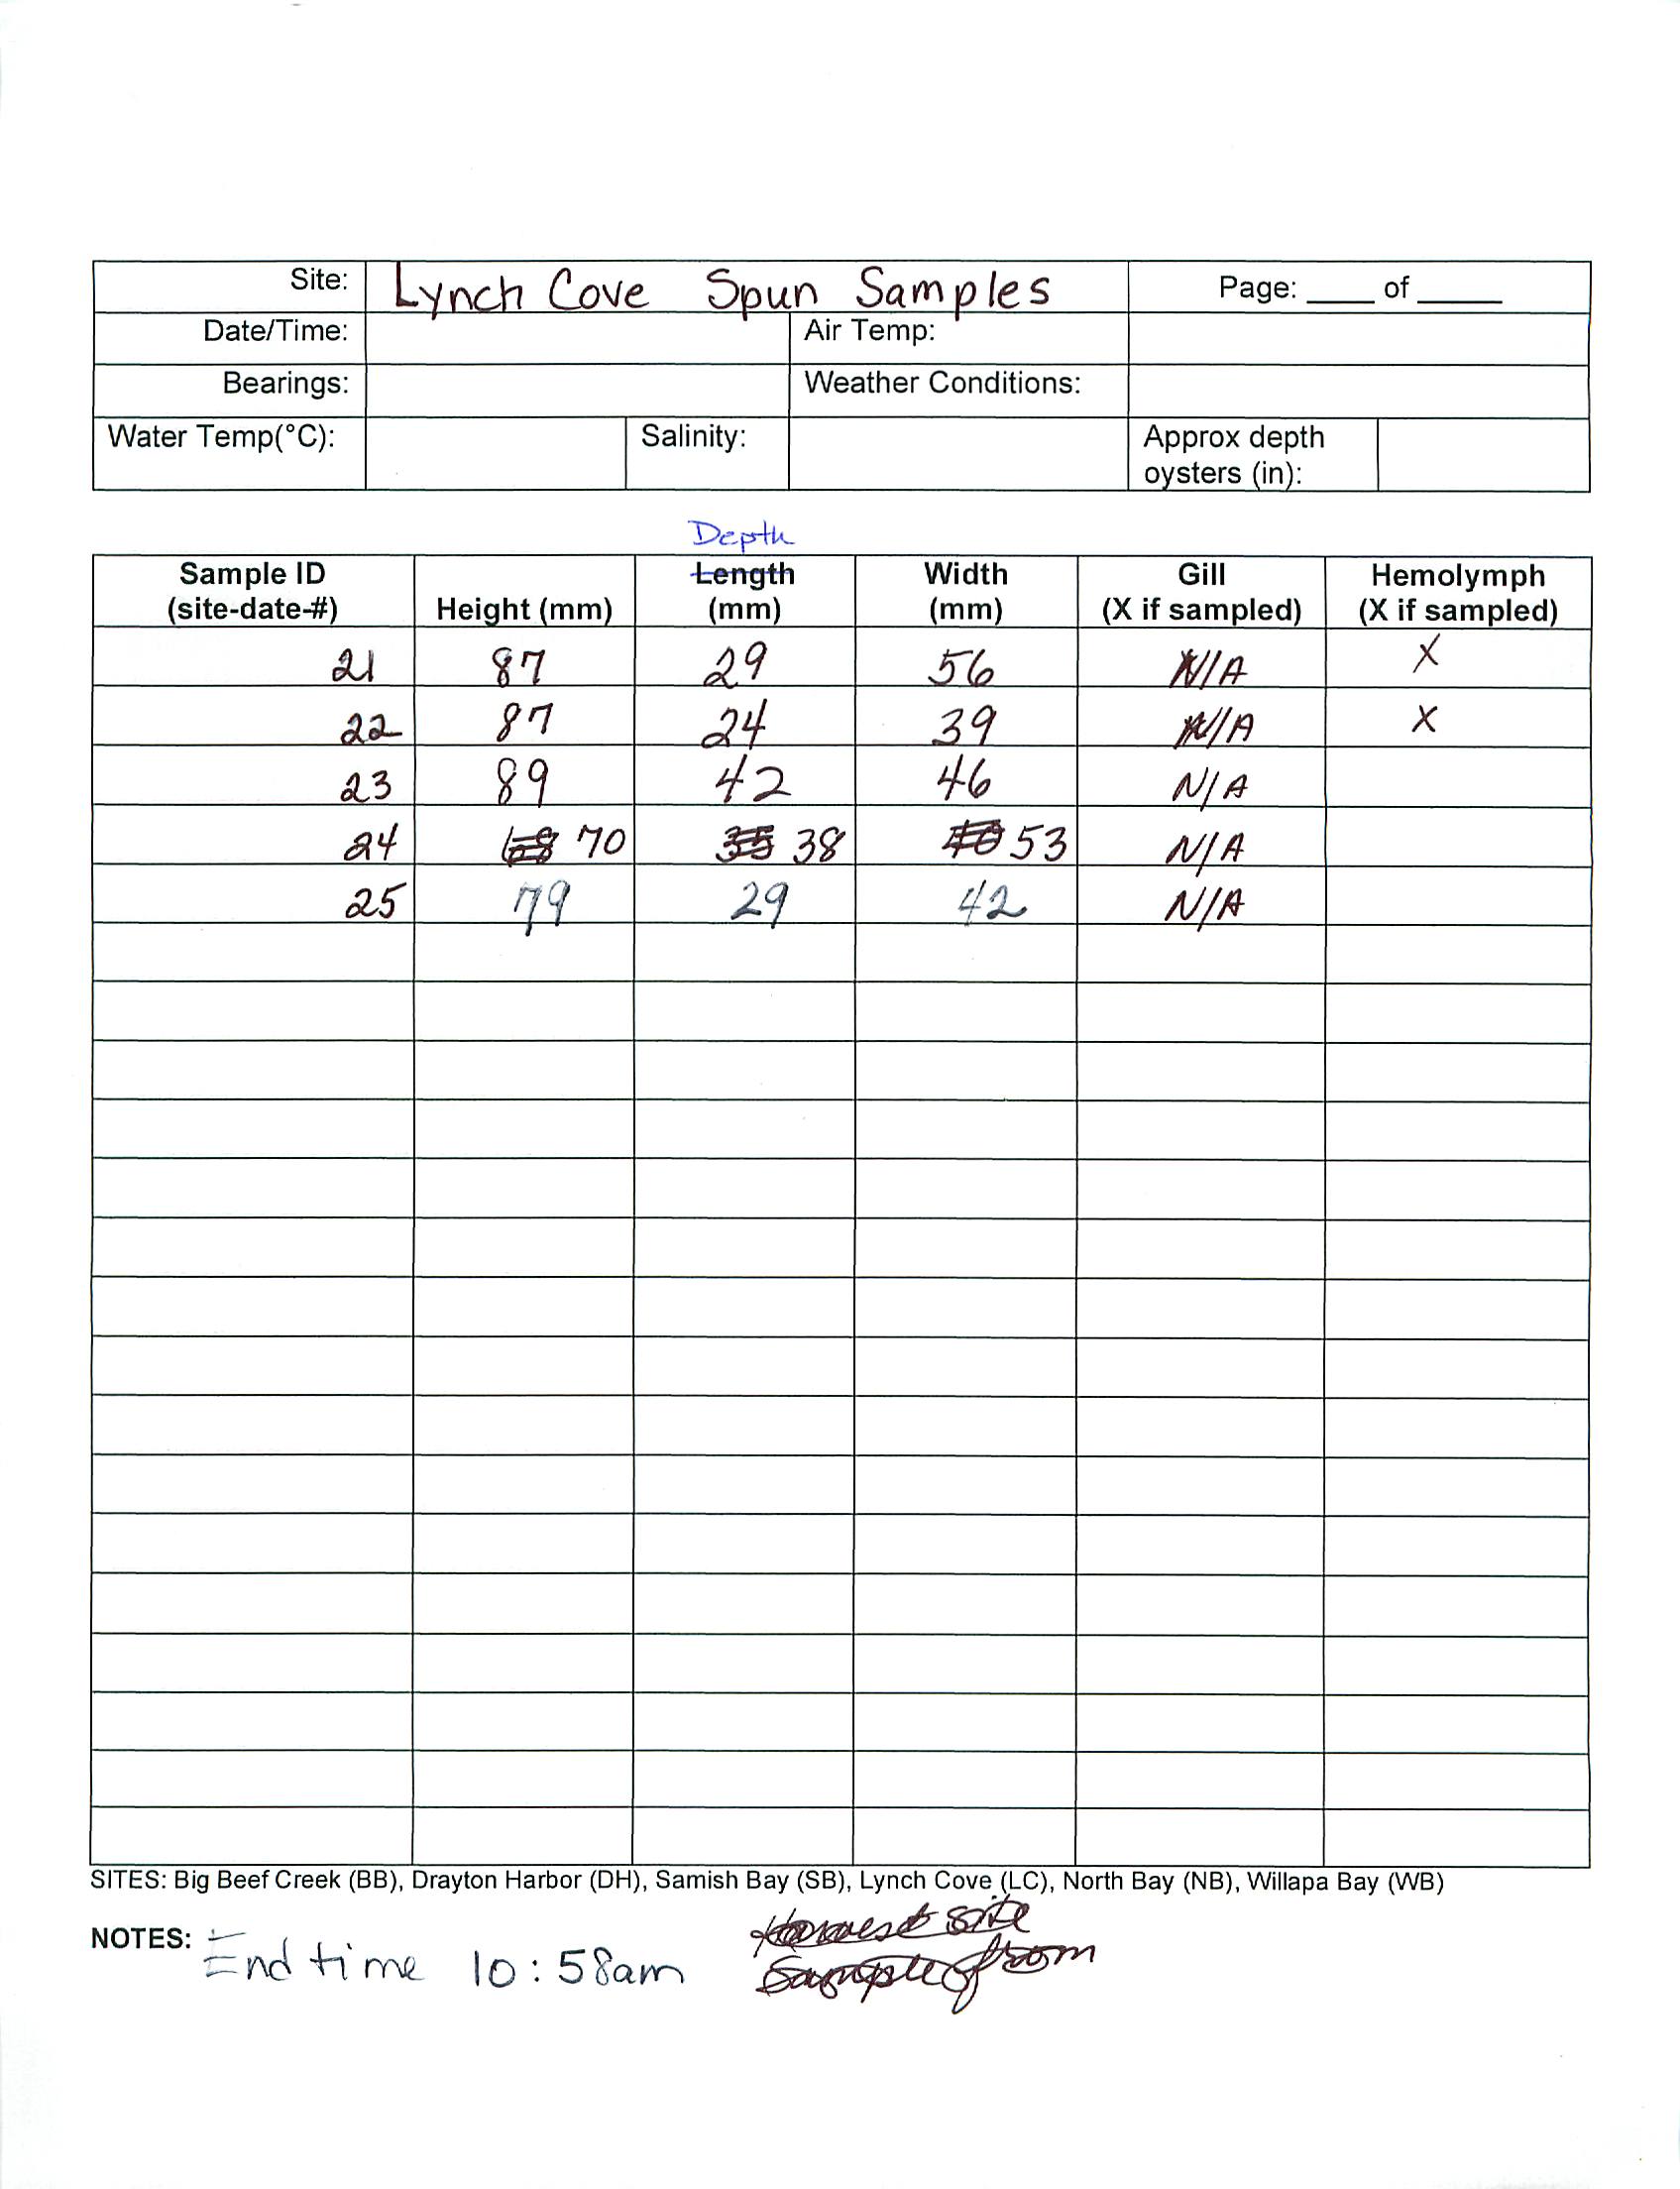
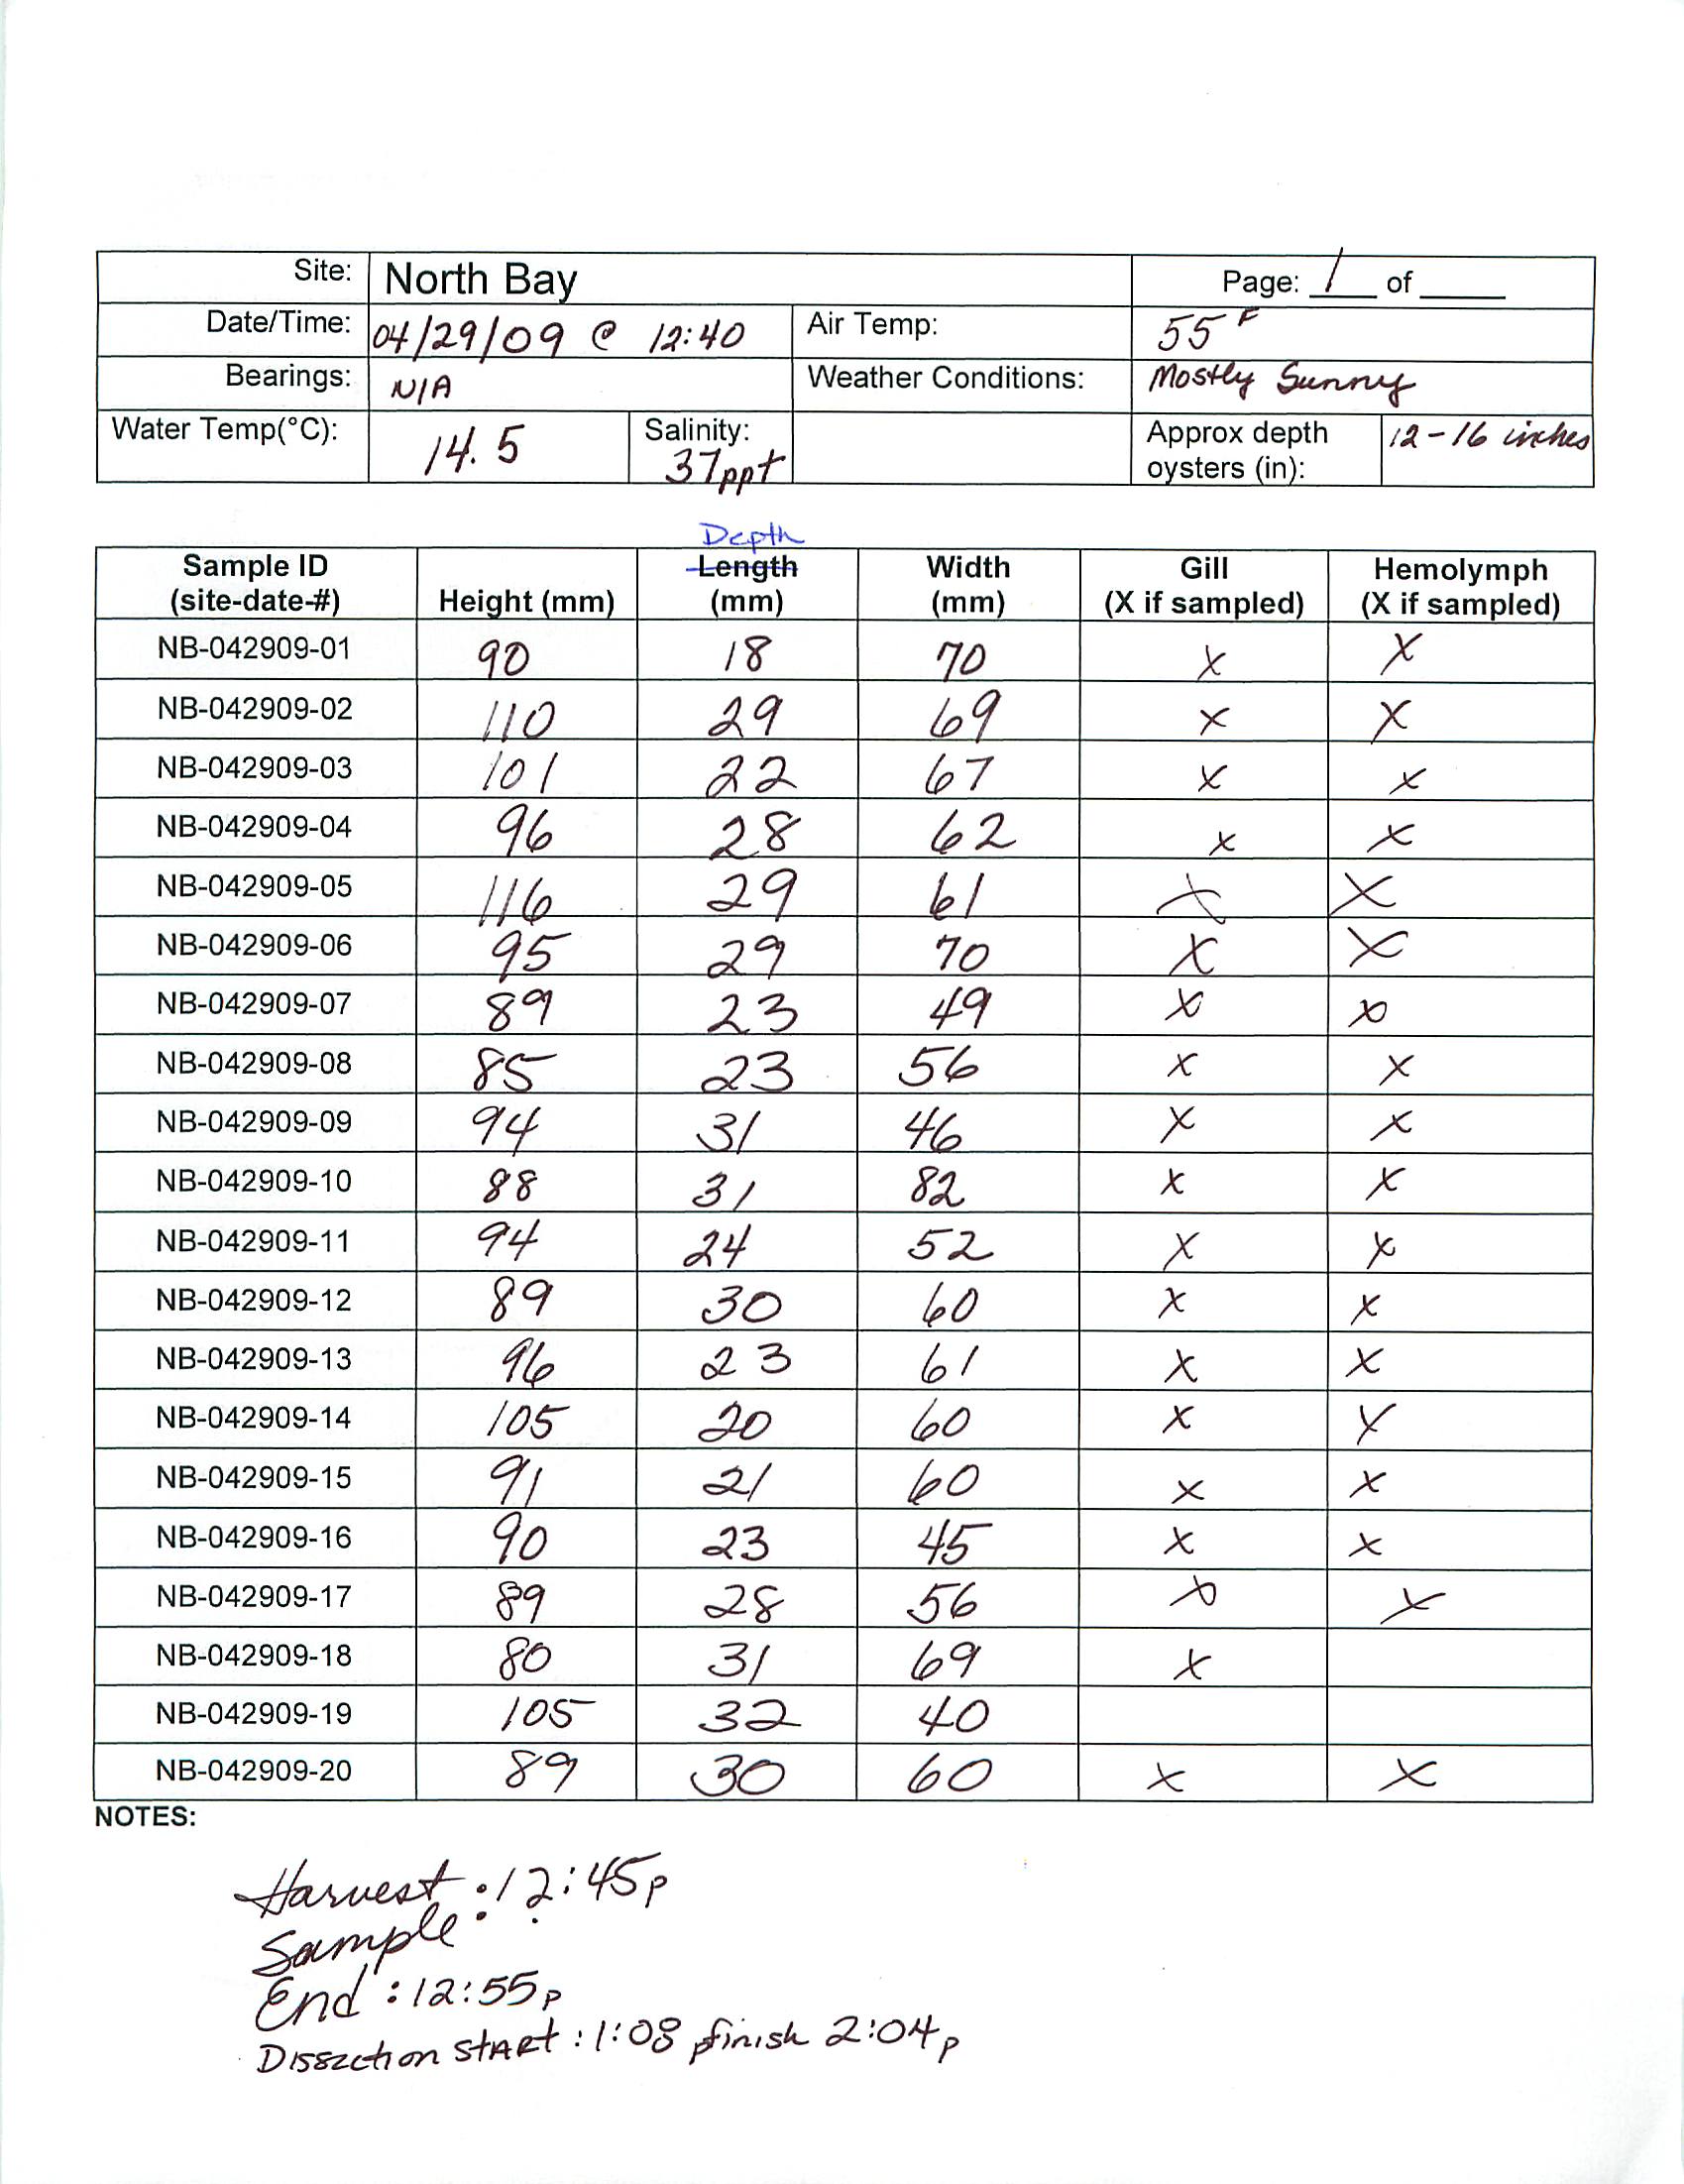
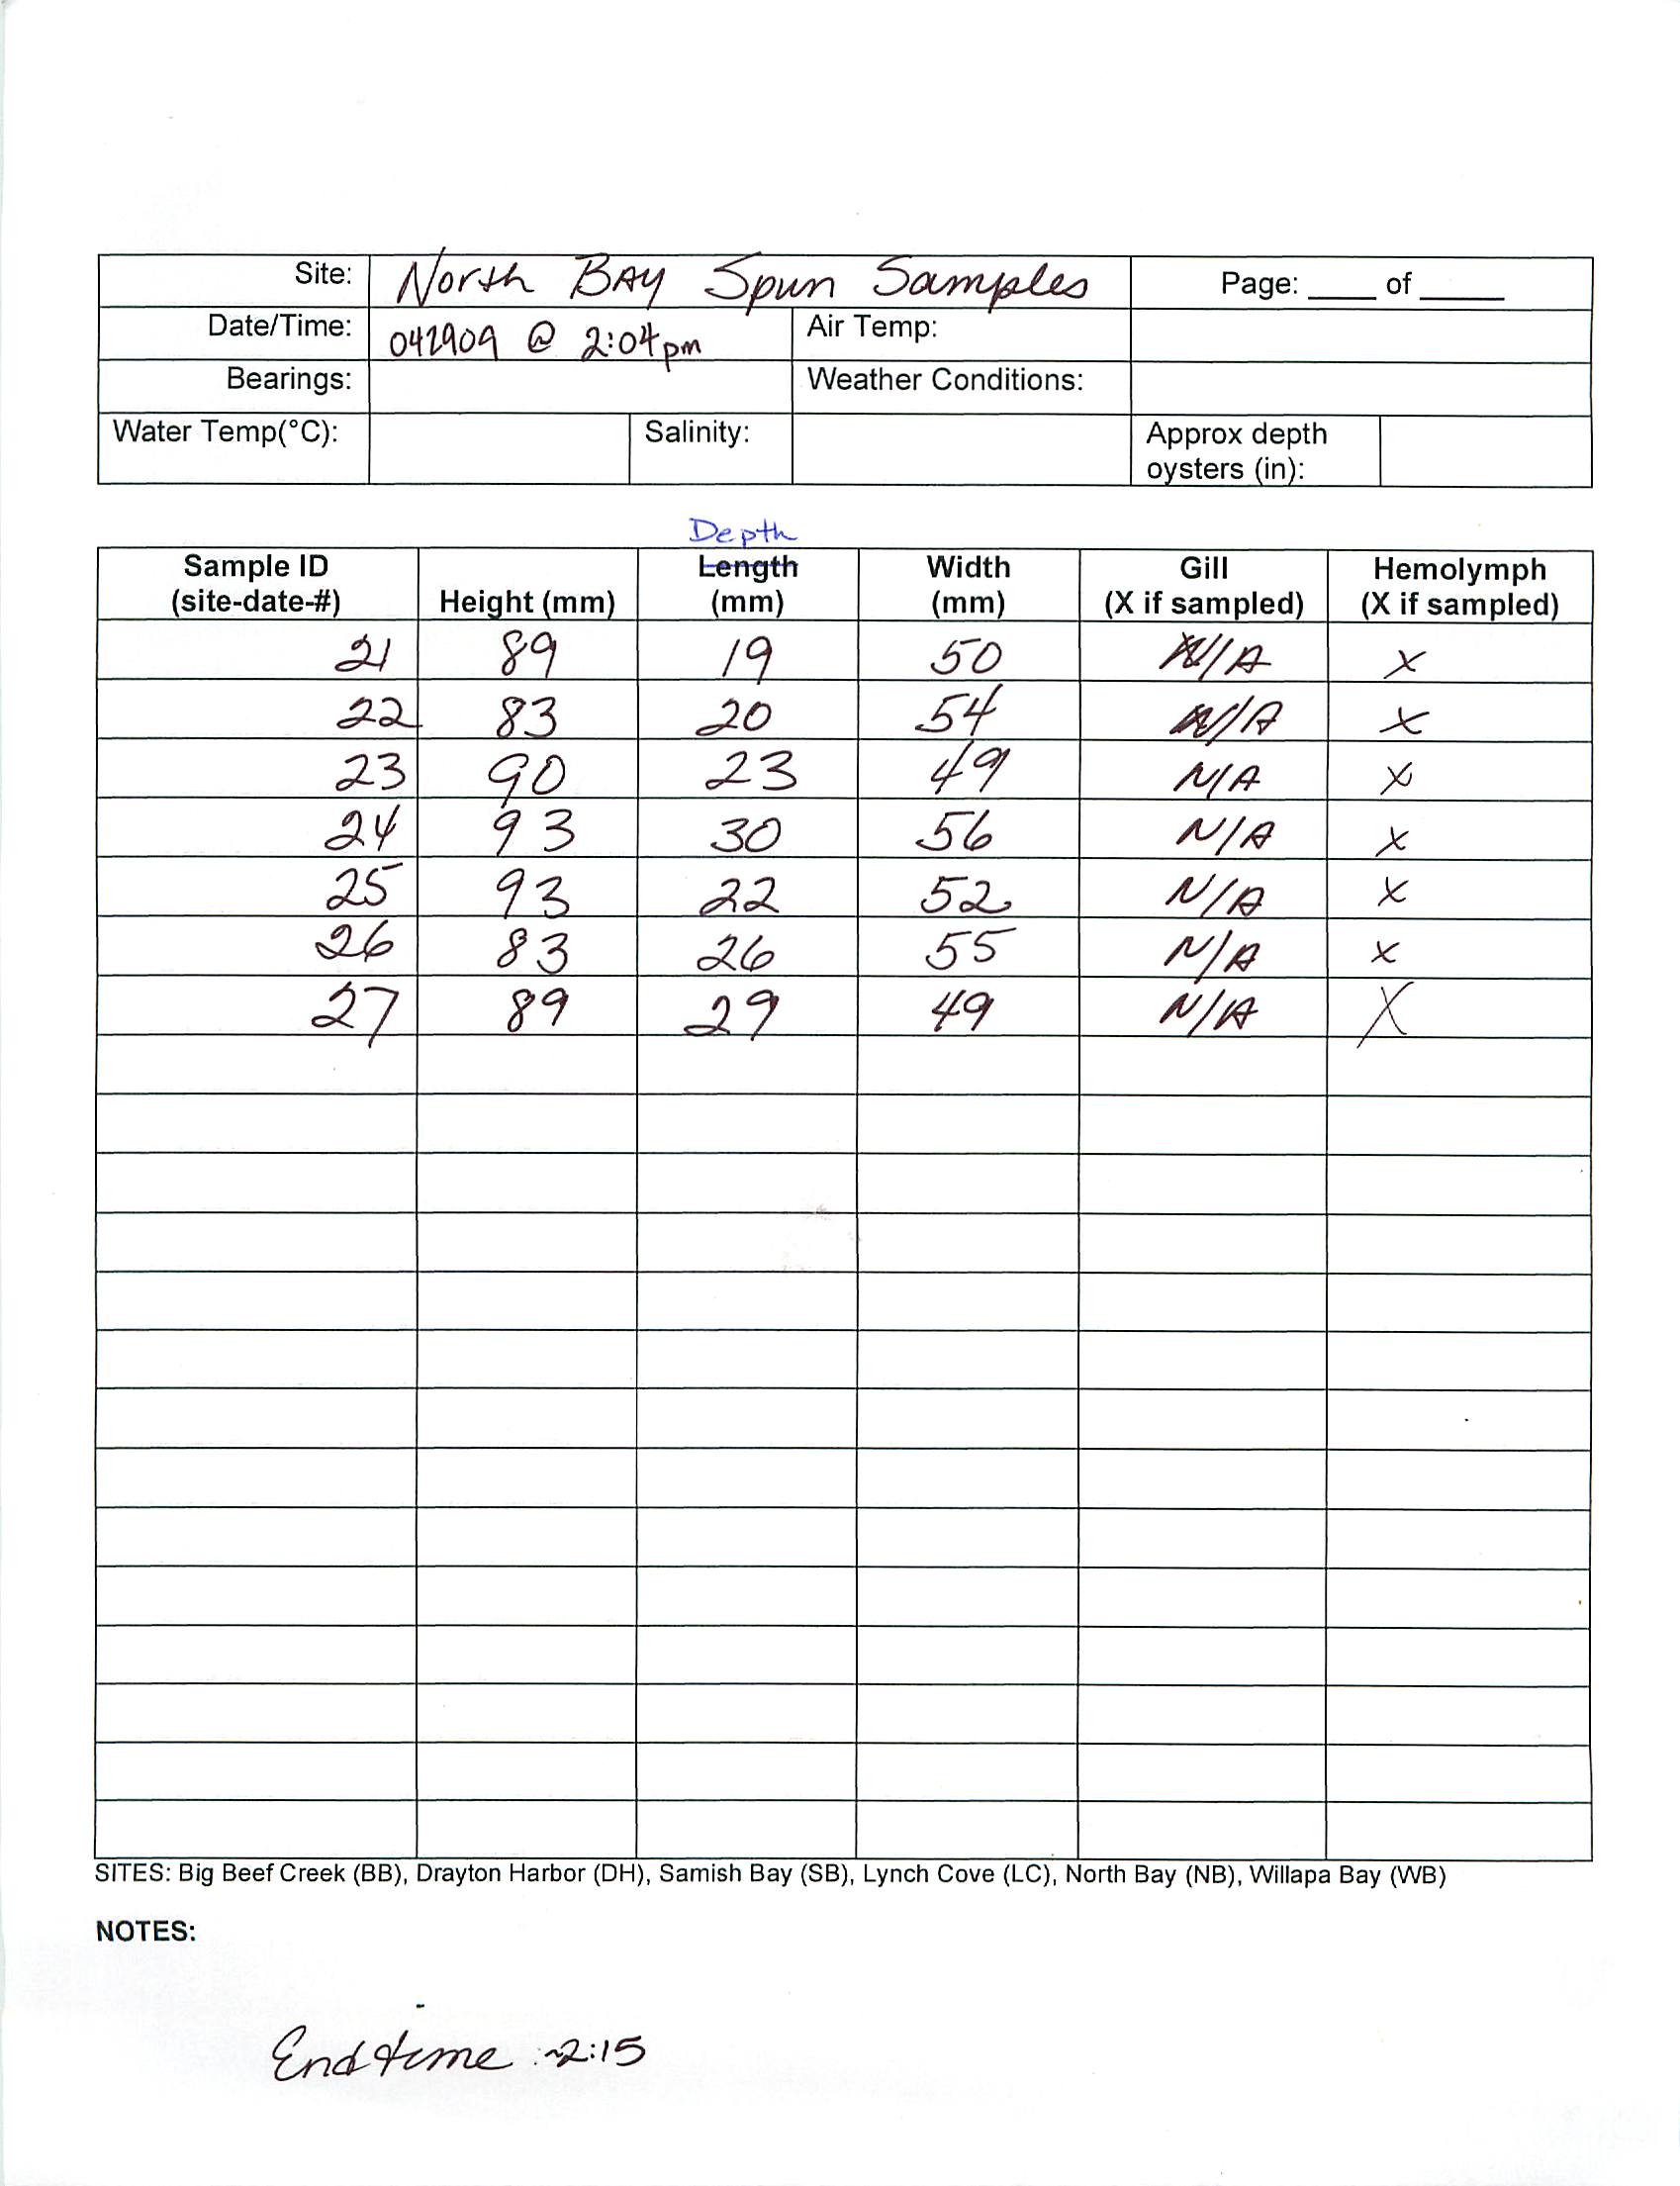
Conclusion: There is carryover DNA present in 4 of the 6 samples. This is surprising since the kit used had a DNAse step. If I were to compare the performance of this kit to TRIreagent I would say that this kit is not any better for isolating RNA from small amounts of tissues
2/03/09
Plating C.gigas hemocytes - cont. from 01/29/09
RNA quantification
Thawed RNA samples from 1/30/09 (Tubes 1 - 9) and quantitated RNA on the nano-drop. In summary, not a lot of RNA. THe 260/280 was high, the the 260/230 was horrible!. The isolation procedure includes a de-salting step and a few washes, I was kinda disappointed in the 260/230. I don't know what to say about sample 8. Huge peak at 230 nm.


Reverse Transcription
picked duplicate wells from each treatment that had the most decent nanodrop data.
prepped cDNA for duplicate tubes from each treatment: 1,2. controls 5,6. + PGN-SA 3µg/mL, 7,9. +PGN-SA 10µg/mL
- Added 5uL total RNA to 0.5 mL tube
- Heat at 75C for 5 min in thermocycler
- Put directly on ice for 5 min or longer
- Make Master Mix:
4 ul 5x Buffer (MMV RT Buffer)
8 ul dNTPs (10 mM total)
1 ul MMV RTranscriptase
1 ul Oligo dT Primer
1 ul RNase free water
Total = 15 ul
- Add MM to tube with diluted mRNA in it (total volume now 20 ul)
- Incubate at RT for 10 min
- Incubate at 37C for 1 hr in thermocycler
- Heat inactivate @ 95C for 3 min
- stored samples in Mac's PCR reagents box in small -20C
ran 6 samples in real-time PCR run using PGS_g primers and 18s primers (SYBR Green M.mix)
1/30/09
Plating C.gigas hemocytes - cont. from 01/29/09
Treatments
-cells visible on plate and similar in density to what has been previously observed. Lots of bacteria still alive in dish
-rinsed each well with 1 mL sterile seawater, then added 1mL fresh sterile seawater to well
-viewed wells again and observed very little if any Brownian motion (bacteria).
-prepared PGN-SA solutions: at 3 ug/mL and 10 ug/mL from 1 mg/mL stock.
-aspirated sterile seawater from 9 wells and added 1 mL sterile seawater - control (3 wells), 1 mL PGN-SA at 3ug/mL (3 wells), 1mL PGN-SA at 10ug/mL (3 wells). The threee remaining wells were not used.
-incubated plate at 12C for 3 hours.
Isolate RNA
Prepared solutions Nucleospin RNA kit (Machery-Nagel) per manufacturer's instructions page 14, '5.1 Total RNA purification from culured cells'.
A few notes on this procedure: this was a sample kit. The cool thing about it is that it is supposed to be specific for isolating RNA from small amounts of cells and the first buffer lyses the cells. One observation: after aspirating the media you add the buffer to the well then mix is around and collect it into the tube - well it looks like a little layer (poly-D-lysine?) gets sucked into the pipette along with the liquid. I assume this happened before with the Tri-Reagent, but you probably just can't see it as well because it's red. Not sure what effect this could have on the RNA isolation process.
This procedure took me about 1.5 hours to do 9 samples. Because these are microcolumns it is very important to keep track of labels on tubes because there is a lot of tube swapping. There is the option of doing a filtration of the lysate in this procedure, I did perform this step for my samples, but I think I could have skipped it (protocol states it can be skipped if < 1e5 cells).
Tube ID:
1, 2, 3. control wells (sterile seawater)
4, 5, 6. +PGN-SA 3 µg/mL
7, 8, 9. +PGN-SA 10µg/mL
1/29/09
Plating C.gigas hemocytes
Prepare Plate
-bled 5 oysters ~10 mL hemolymph extracted
-prepared stock of sterile seawater and antibiotics (added 40µL Pen Strep stock (10,000U/mL Pen, 10 mg/mL strep to 4 mL sterile seawater)
-added 4 mL sterile seawater +antibiotic solution to the 10 mL of hemolymph and plated 1mL/well in a poly-D-lysine coated plate.
-incubated plate at 12C, covered overnight
NOTES on bleeding: extracted hemolymph from 4 oysters the "normal" way (syringe into notch and draw at muscle). Then shucked an oyster to see where exactly the syringe was. When the syringe is directly in the muscle, no liquid can be withdrawn. So needle is probably close to the muscle, but not directly in it. Tried to extract cells from the heart, but it shrinks when punctured-not a lot of luck there. Colleen came over from the Friedman lab to show Sam how they bled the oysters. They shuck the oyster very gently then extract ~ 0.5 mL from the pericardial cavity (not puncturing the heart).
-counting: did a 1:2 dilution of hemolymph and Trypan blue to count cells. Performed with the pooled hemolymph as well as the heart sample I attempted to take. Both samples again had the ginormous blue particles that made counting cells impossible (see image below 01/09/09 for example of ginormous blue particles).
1/20/09
Western Blot anti-HSP70 antibody
Procedure p1
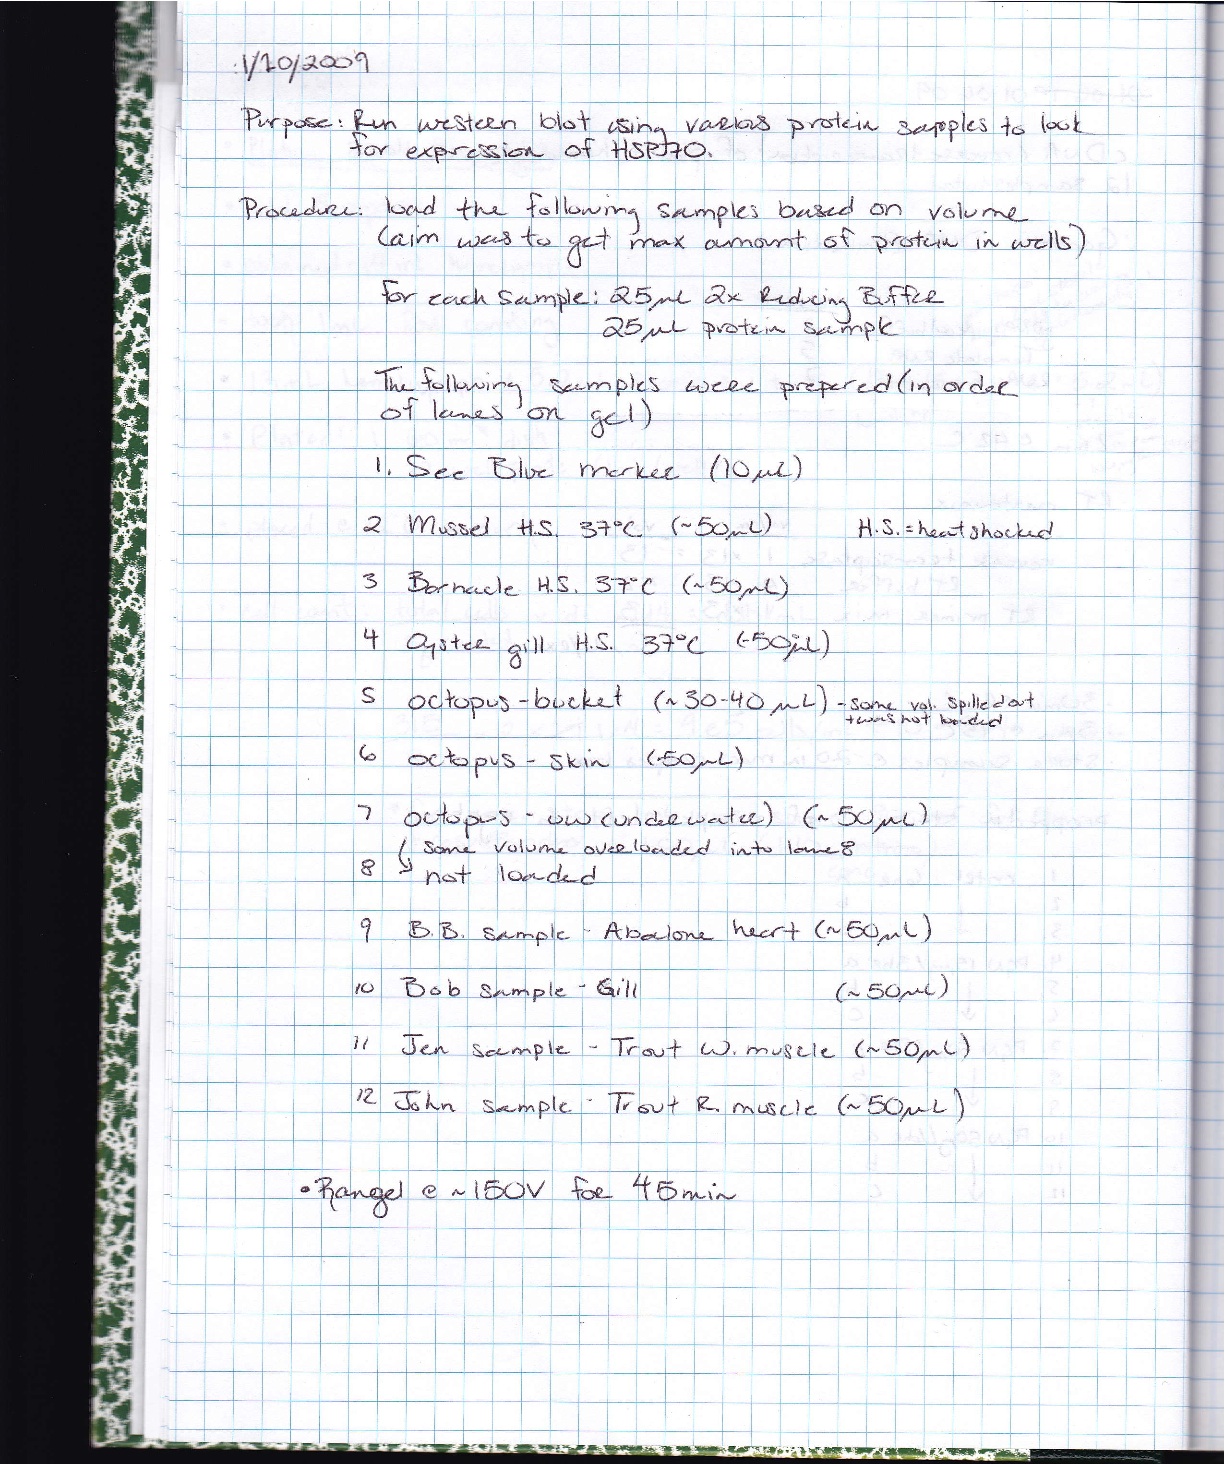
Procedure p2
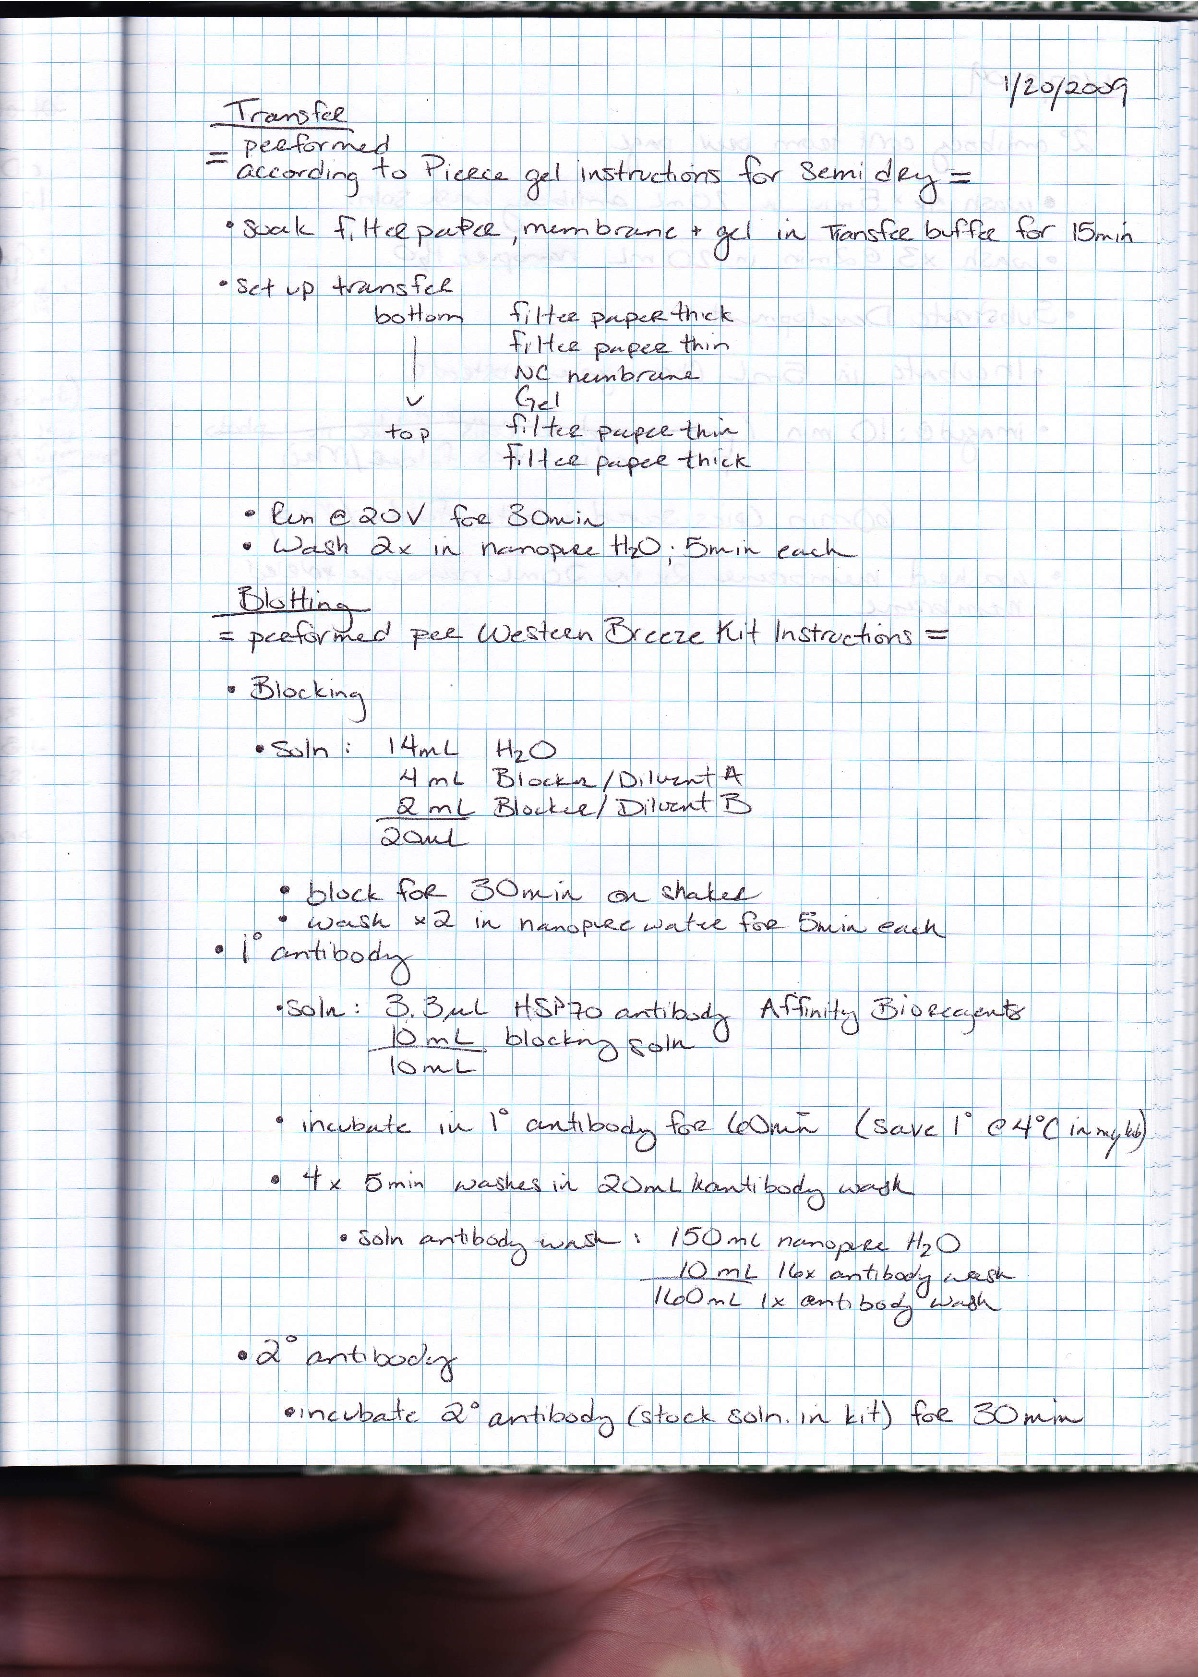
Procedure p3
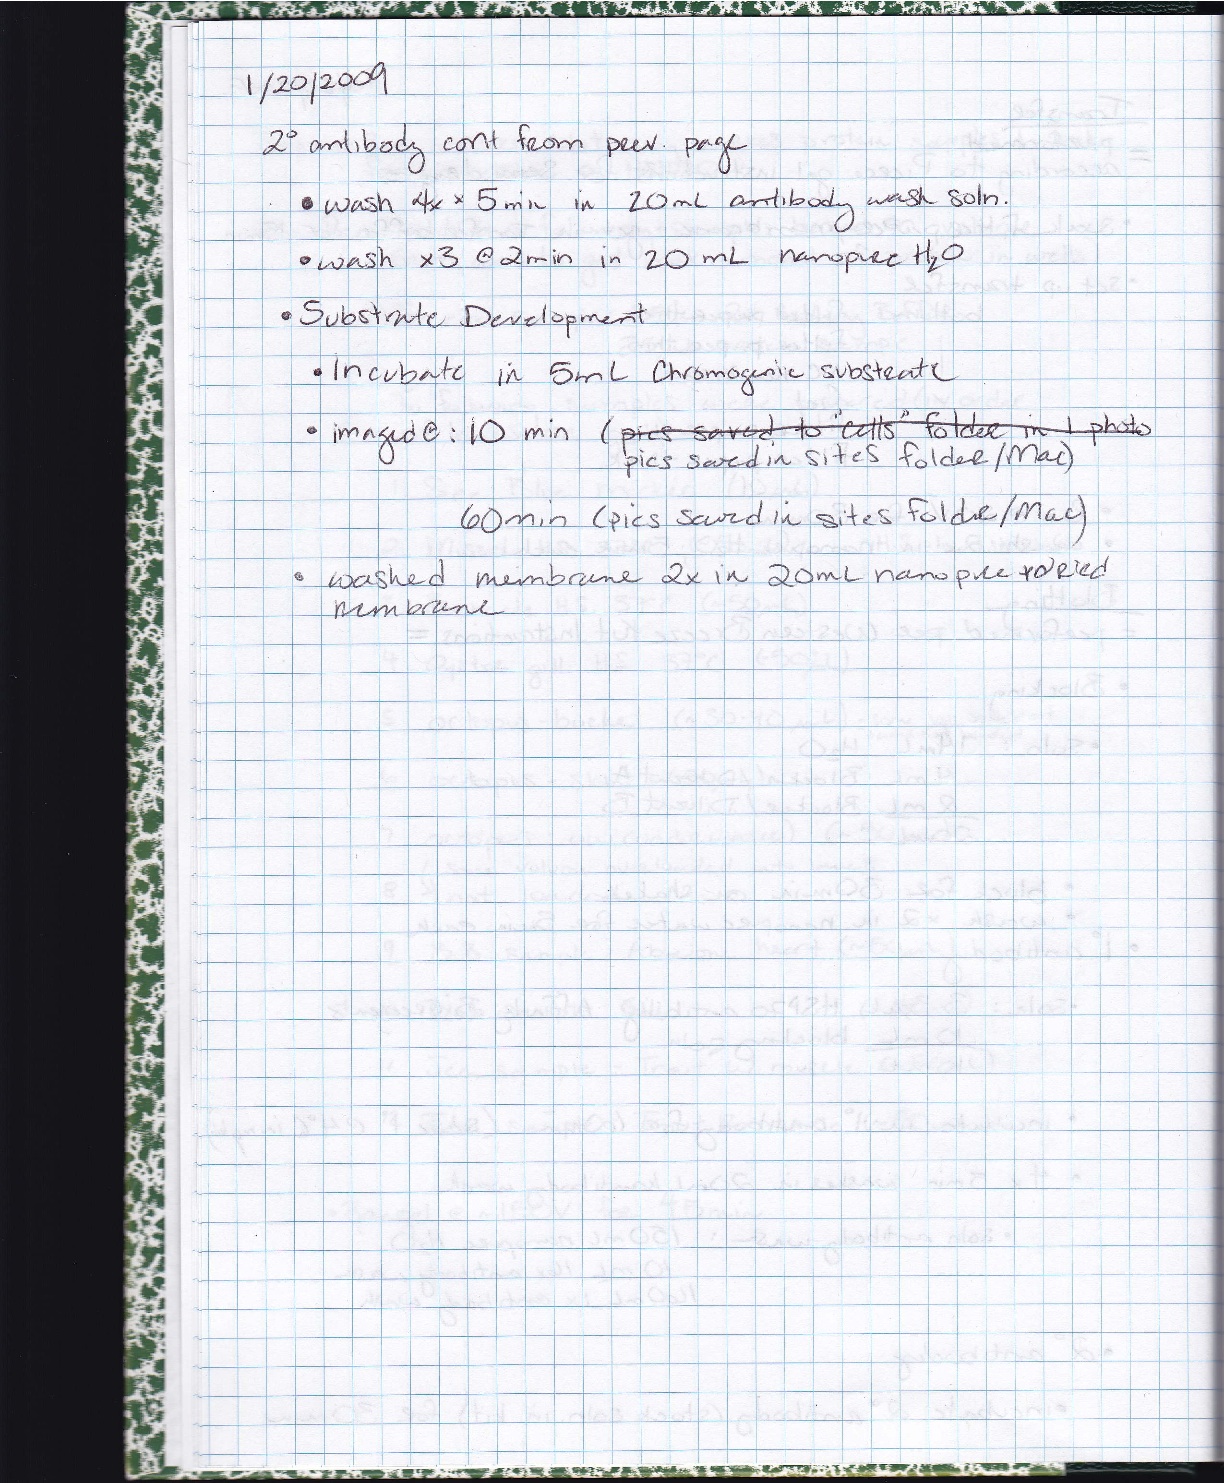
Coomassie image
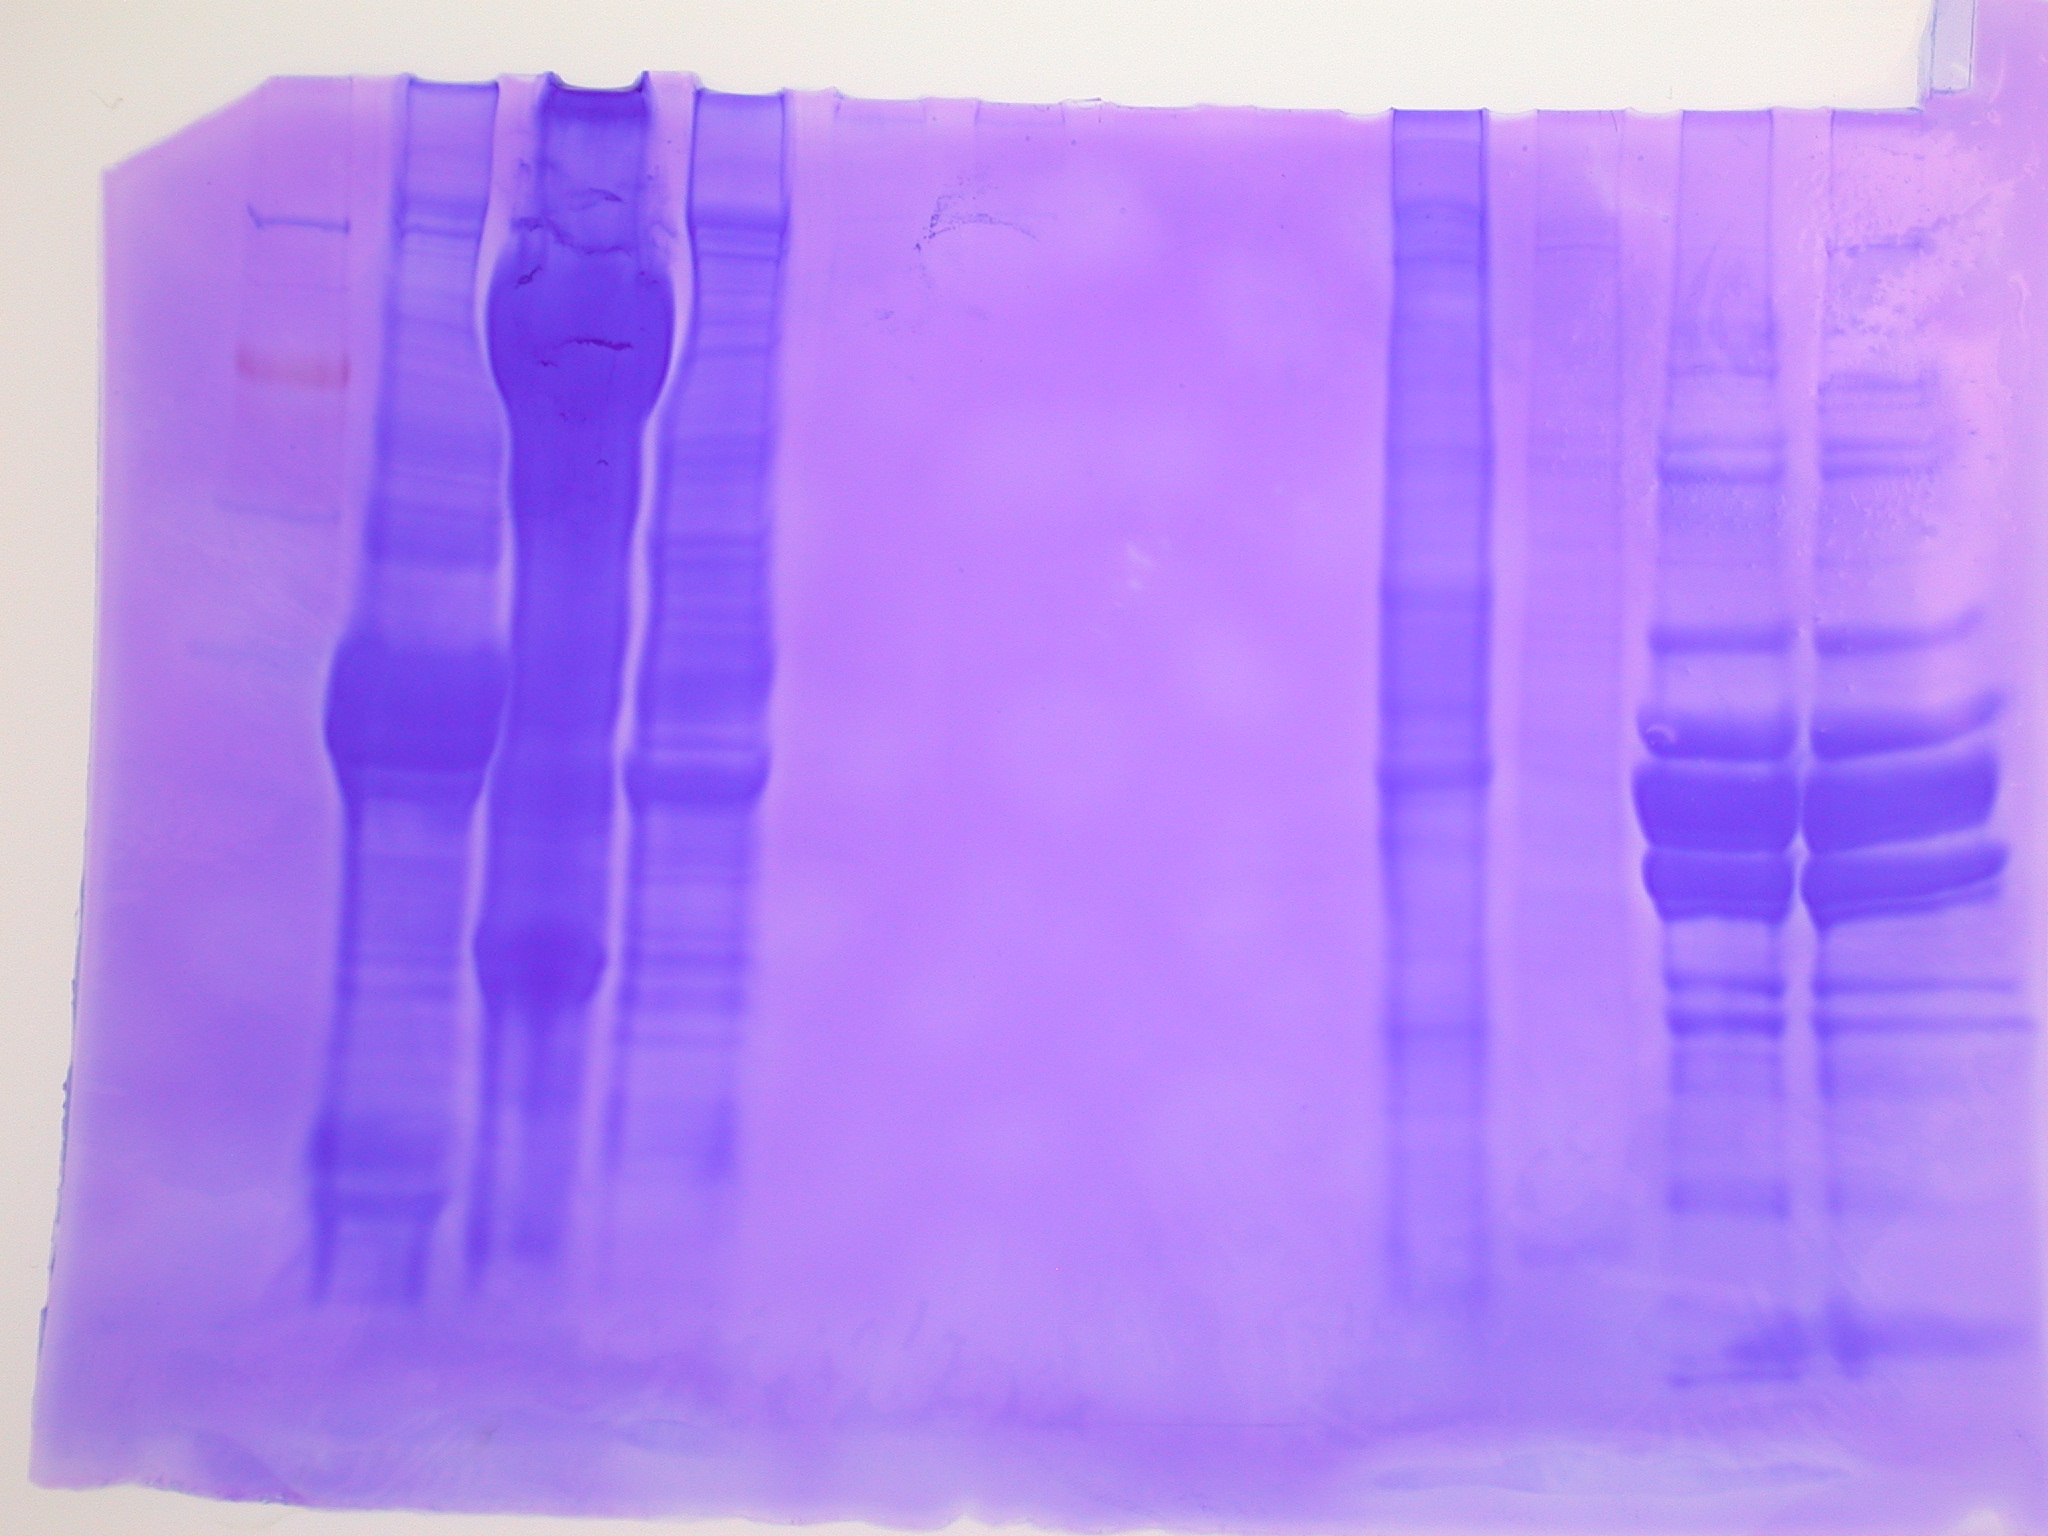
Membrane just after transfer(to help with ladder visualization)
Lane ID
1. See Blue Ladder
2. Mussel - HS @37C
3. Barnacle- HS @ 37C
4. Oyster gill-HS @ 37C
5. Octopus - bucket
6. Octopus - skin
7. Octopus - underwater
8. not loaded (due to overflow from lane 7)
9. Abalone - heart
10. Fish gill
11. Trout w.muscle
12. Trout r.muscle (I think)
Image 10 min development
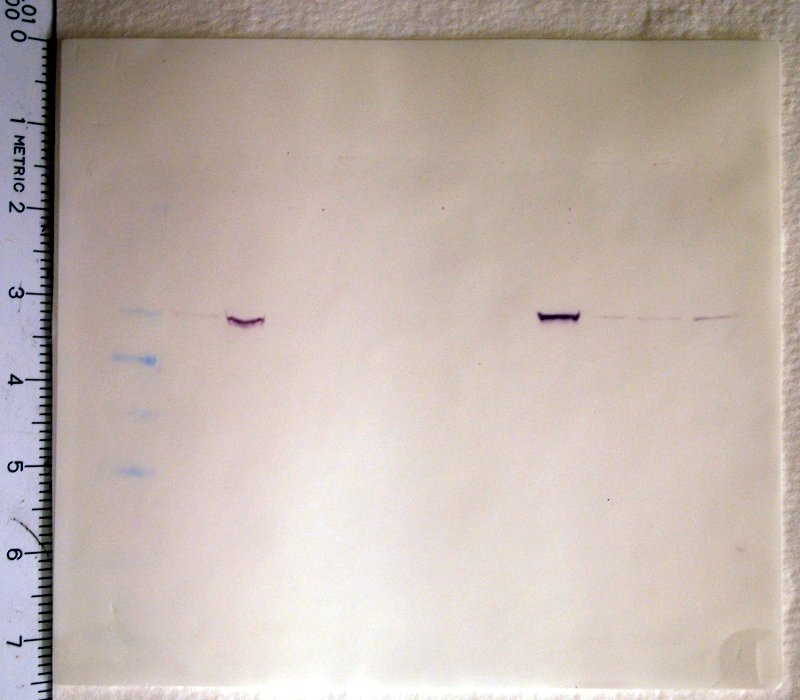
Image 60 min development
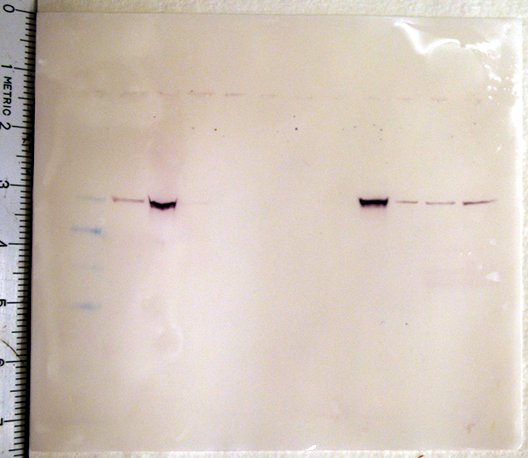
Conclusions:
After 10 minutes, the HS mussel, HS barnacle, Abalone heart, fish gill, and 2 trout muscle samples showed bands. After 60 minutes, the HS oyster sample also showed a faint band.
1/14/09
Troubleshooting hemocyte samples from real-time run 1/09/09
Part II repeat real-time PCR performed 1/12/09 was repeated with a more "sensitive" melt curve to see if differences between genomic and cDNA could be improved. Included a "spiked" genomic sample
Results: results similar to 1/12/09 run. The differences in the melt curves is not enough to be able to distingush presence of genomic DNA. Spiked sample was not easily distinguishable from the original cDNA sample. NOTE: Something weird was going on with Syto 13 dye. The melt curve showed 2 peaks and the gel was very smeared.
1/12/09
Troubleshooting hemocyte samples from real-time run 1/09/09
Part I:
trying a different master mix/dye: SYBR Green
compare amplification efficiencies and melt curves using SYBER Green (master mix, dye included) versus Immomix/Syto 13 dye which is what I've been using
here is an image of the amplification curves. the left batch of curves is using the SYBR Green m.mix, the right batch of curves are the exact same samples using the Immomix/Syto13 m.mix. The SYBR Green m.mix has a larger exponential range and higher overall flourescence.

The next images shows the melt curve of these same samples. the top is the SYBR Green, the bottom the Immomix/Syto 13 m.mix. The SYBR green melt curves are consistent with the gel below in Part II (i.e. one peak in melt curve = one band in sample). What is not clear is why the bands of different sizes (~100bp different) have the same melt temp, or why the Immomix + Syto 13 m.mix shows 2 peaks.

Take home message - go forward with SYBR Green dye.
Part II:
trying to figure out if this cDNA is contaminated with genomic DNA
approach: use real-time PCR/melt curve analysis to look for multiple products using primers that cross an intron. Primers used "PGS_g", the picture below shows the primers (gray arrows) the lower sequence is the ORF, the upper sequence is from sequence analysis results from genomic DNA.

results: ok, no real answers from this run. melt curve analysis did not really provide any answers - both genomic and cDNA samples showed double peaks. I added loading dye (6uL each) to the 25uL rxns - Immomix/Syto 13 reactions (the SYBR green samples were NOT run on the gel) and ran them on a 1% agarose gel.
1. hyperladder 2. cDNA hemocytes control a
3. cDNA hemocytes +PGN 15ug/3h a 4. cDNA hemocytes + PGN 50ug/3h a
5. genomic DNA sample A 6. genomic DNA sample D
7. H20 8. 100bp ladder


next steps:
can't tell, could be faint genomic band in this gel. I think since there is sequence data for the intron, I could design 1 primer within the intron then use 1 PGS_g primer to see if I can get any amplification in the cDNA samples. If yes, then confirms presence of genomic DNA.
1/09/08
Hard Clam Hemacytomer images - what is that blue stuff?? (100x)

Plating gigas hemocytes (12 well plates vs. 60mm dish) cont. from 12/16/08.
-ran real-time PCR on samples using primers for PGE receptor (ID: PGLANDIN_E2), IL-17 (ID: IL-17 Iso D),18s (gigas 18s).
Samples run in duplicate on the plate
results:
NOTE: the 2 samples that go off scale are at ~25 fold/minimum. I believe these high values are an artifact of some kind so I didn't bother to scale them into the results graph.
conclusions:
-all 12 samples crossed the threshold w/in 1 Ct of each other. This seems rather fishy - maybe genomic DNA contamination?
-the 2 replicates that are ~25 fold/minimum had late amplification of the 18s primers, I think this is an artifact. Still seeing low efficiency with this primer set, will likely change to elongation factor for normalization gene to get better amplification efficiency.
next steps: determine if samples have genomic contamination. Compare melt curves for these samples with melt curves from genomic DNA. If contamination is present should see two peaks in samples, one of those peaks should match genomic DNA peak. Will use PGS_g primers that cross a 100bp intron.
-


1/07/08
Plating gigas hemocytes (12 well plates vs. 60mm dish) cont. from 12/16/08.
-prepared cDNA using Quantitect kit
12/16/08
Plating gigas hemocytes (12 well plates vs. 60mm dish) cont. from 12/16/08.
-washed all 12 wells 2x with 1mL sterile seawater.
-added PGN to wells in the following order 7:25 am
(note: same samples as 11/18 and 11/11 to compare results to what has previously been observed wit PGN-SA) :
3 wells: control (1mL sterile seawater),
6 wells: PGN-SA at 50ug/mL (1 mL) - 3 for 3 hour, 3 for 6 hour time points
3 wells: PGN-SA at 15ug/mL (1 mL)
no pics today, but cells looked normal. I compared the 5 mL dish with the wells of the 12 well plate and the looked similar. For both the dishes and the plates the cells in the middle of the well are more adherent while the cells are a lot more sparse on the edges of the well and it appear to me that there is more rounding of the cells in this region.
at 10:25, 3 hours after treatments, supernatant from 3 of the 50 ug/mL PGN-SA wells and the 3 15ug/mL PGN-SA wells. 1 mL of tri reagent was added and tubes were stored at -80C in gigas hemocyte box.
at 1:25, 6 hours after treatments, supernatant from 3 of the 50 ug/mL PGN-SA wells and the 3 control wells. 1 mL of tri reagent was added and tubes were stored at -80C in gigas hemocyte box.
Hemocyte "washing"
-extracted 7.2 mL hemolymph from 3 lg. Pacific oysters
-pulled off 0.2 mL in centrifuge tube for cell count
-added 3 mL sterile seawater +pen/strep to 7mL hemolymph
-added 5 mL/well to 60mm dish, and plated at 12C protected from light
-with the additional 5 mL: centrifuged at 800 rpm for 5 min. Supe was pulled off and pellet resuspended in 5 mL sterile seawater +pen/step (repeated for a total of 3 washed)
-final resuspension, vortexed genly and plated 5 mL at 12C protected from light.
-cell count: 1:2 dilution of 200uL hemolymph w/ Trypan blue. Cells were not countable. Similar to observation from 12/09/08. Weird.
-will visually observe cells at 1 hr and 24 hr after plating to see if cell # and amount of 'other' material is similar between washed and unwashed cells.
observations: lost most of cells, maybe one tenth of cells remaining (but so was the 'other' stuff!). Just like last time though when are the blue particle stuff was observed; the cells in the unwashed plate were clumpier than usual.
12/16/08
Plating gigas hemocytes (12 well plates vs. 60mm dish)
-plating cells in 12 well plates and 60mm dish-
-surface area of 60mm dish is 28.26 sq cm., surface area of well in 12 well plate is 3.8 sq. cm (7.43x smaller). Plate 5 mL in 60mm dish and 1 mL/well in 12 well plate
-extracted 14 mL hemolymph from 7 lg. Pacific oysters (already notched from 12/9/08). Was able to extract between 2 and 4 mL per oyster.
-pulled off 1 mL in centrifuge tube for cell count
-added 5.2 mL sterile seawater +pen/strep to 13mL hemolymph
-added 1 mL/well to all wells of a 12-well plate
-added 5 mL/well to 60mm dish
-placed plate at 12C protected from light.
-cell count: spun 1 mL hemolymph at 800 rcf for 5 min. Resuspended in 100uL water. Added 100 uL Trypan blue and looaded hemocytometer
counted 315 cells in 7 large squared (16 small squares/large square)
315 cells/7 squared*2df*1e4= 9e5cells/mL (divide by 10 to account for concentration of volume from 1 mL to 100uL) = 9E4 cells/mL in original solution
-observed wells ~ 3hr later.
12/12/08
Plating gigas hemocytes (12 well plates)-cont. from 12/10/08
-isolated RNA from all 12 tubes. total vol 20uL for each. NOTE: did not see pellet in any tubes, 260/280 ratios are not good. 260/230 ratios are really bad.

-prepared cDNA from "1 mL samples" (6 samples total)using Quantitech kit . (I didn't do the other samples because I wanted to just get an idea of how duplicate wells looked)
-ran real-time PCR for the 6 samples using the following primers primers for PGE receptor (ID: PGLANDIN_E2), IL-17 (ID: IL-17 Iso D),18s (gigas 18s) and COX (gigas_pglandin). Also repeated samples from 12/04/08 run, but for the PGN 5ug/mL sample I ran out of cDNA and could only do 1 rep of 18s and no reps of IL-17. Annealing temperature for this run at 60C.
-notes: 18s melt curves are not very good. the peak is very broad. plate duplicates are also not very tight for this primer set (maybe pipetting?). finally the efficiency for 18s is ~0.69. 18s always have the lowest efficiency when I run these (<0.85), but this is really quite low.
RESULTS for 12/1/08 samples:
CONCLUSION: there is no dose response curve with increasing PGN-SA concentration (25 - 75 total ug/well) for these 3 genes


RESULTS for 12/9/08 samples
CONCLUSION: duplicate wells in the cell culture plate are not consistent. This is not at all surprising since cells were clumping therefore there iwas no way to control for even distribution of cells across the different wells.

12/10/08
Plating gigas hemocytes (12 well plates)-cont. from 12/09/08
-washed all 12 wells 2x with 1mL sterile seawater. Even visually the wells still had "stuff" in them after washing.
-added PGN to wells in the following orde11:40 am:
3mL cell wells: 1 control (1mL sterile seawater), 2 PGN-SA at 50ug/mL (1 mL)
2mL cell wells: 1 control (1mL sterile seawater), 2 PGN-SA at 50ug/mL (1 mL)
1mL cell wells: 2 control (1mL sterile seawater), 2 PGN-SA at 50ug/mL (1 mL), 2 PGN-SA at 15ug/mL (1 mL)
no pics today (couldn't find camera), but I will note that I could not tell the differerence between wells with 1, 2 or 3mL of suspension. this is probably because the cells were very "clumpy". Cells were heavy in areas in the middle of the well, but very light in areas toward the outside of the well. The cells in the clumpy areas were spreading normally; whereas the cells in the sparse areas were starting to round up.
at 2:40, 3 hours after treatments, supernatant was removed from all 12 wells. 1 mL of tri reagent was added and tubes were stored at -80C in gigas hemocyte box.
For single cell suspensions (and/or getting rid of large particles) could try.....
Cellector (from Robyn's heart cell protocol)
Quick centrifugation: 30sec. ~4 - 800rpm - versus cell washing, which would be pelleting and resuspending cells multiple times in fresh sterile seawater to get rid of bacteria/etc. The here could be getting aggregates (because I have no other explanation for why cells looked different this time around).
12/09/08
Plating gigas hemocytes (12 well plates)
-playing around with plating cells in 12 well plates (what is well surface area? find out-
-extracted hemolymph from 8 lg. Pacific oysters (new stock). Was able to extract between 2 and 4 mL per oyster.
-cell counts:
-kept samples separate at first to try cell counts from each sampling. did a 1.5 dilution (200uL hemolymph, 100uL 0.4% Trypan blue) for each samples for counting, but the dye did not distribute evenly in solution, most of is was incorporated into large particles which made counting individual cells difficult since these large particles (didn't look like cells) covered ~1/2 of the viewing area.
-pooled samples (~18mL) and spun at 800rpm for 4min. Added 2 mL sterile seawater to sample and pulled to do a cell count. This was even worse because the particles were not just more concentrated (go figure). Tried to do a count off the supernatent, (just to see if the cells pelleted) and it appears they did
-added the supernatant back to the 2 mL pellet, then added 8 mL sterile seawater + Pen/Strep (28 mL total)
-added suspension to plate. Not sure how much volume to add to each well, so tried 1, 2 and 3mL (6, 3 and 3 wells respectively) to see what looks consistent to what has been observed in the 60mm dishes.
-placed plate at 12C protected from light.
-observed wells ~ 3hr later. it doesn't look like any of the wells have as many of the cells as what has been observed previously. Also can see bacteria are present.
12/06/08
troubleshooting melt curves from 12/04/08 run (cont from 12/5/08)
-real-time PCR repeating samples from 12/5/08 using on PGLANDIN_E2 fresh primers. Ran the plate as a "gradient" from 55 - 61C and plated samples in duplicate to compare results with 55C anneal (column 1) and 60C anneal (column 9).
Results of melting curve analysis:
The results from the 55C anneal are consistent with the run from 12/05/08, so it appears that I did not load the plate wrong on 12/5 but it does not explain why the 10/23 samples are now showing 2 peaks. However, the good news is at increasing the anneal temp to 60C results in 1 peak for all samples and nice looking Ct curves to boot. For future runs, use 60C
12/05/08
troubleshooting melt curves from 12/04/08 run
-real-time PCR using fresh stocks of 10uM IL-17 IsoD and PGLANDIN_E2. Also used PGLANDIN_E2 stocks from 12/04/08
samples: 2 samples from 12/4/08 (control and PGN-SA 5ug/mL), 2 samples from 11/18/08 (control and PGN-SA 3hr), 2 samples from 10/23/08 (control and PGN-SA 4hr). The samples from 11/18 and 10/23 were used as "controls" since both primers were used for these samples and showed expected results 1 single peak in melt curve.
Results of melting curve analysis:
IL-17: all 3 sets of samples (including the 12/4/08 samples which had 2 peaks in melt curve from first run) had only 1 peak in the melt curve using the new 10um primer stock. The old stocks were discarded.
PGLANDIN_E2: 2 sets of samples (11/18 and 12/04) showed only 1 peak on melting curve using both primer stocks ("fresh" and stocks from 12/04 run). However, the 10/23 samples (control and PGN-SA 4hr) showed 2 peaks on melting curve using both primer stocks.
Conclusions:
Although the data for IL-17 looks much better, the PGLANDIN_E2 data is confusing. I'm worried I loaded the samples in the wrong wells because the samples that showed 2 peaks on 12/4 show only 1 peak now, whereas the samples from 10/23 which were supposed to be "controls" showed 2 peaks. I am going to repeat the experiment with the PGLANDIN_E2 "fresh" stocks to verify results.
12/04/08
Plated Hemocytes cont. from 12/1/08
-prepared cDNA using Quantitect kit
-ran real-time PCR on samples using primers for PGE receptor (ID: PGLANDIN_E2), IL-17 (ID: IL-17 Iso D),18s (gigas 18s) and COX (gigas_pglandin). Samples run in duplicate on the plate
-results: melt curves showed 2 peaks for IL-17isoD, PGLANDIN_E2, and 18s. Will run troubleshooting plate to try to determine cause.
Gigas tissue from Vibrio tubiashii exposure and controls (10/23/08)
-ran real-time PCR using primers for COX (gigas_pglandin). Samples run in dplicate on the plate.
12/03/08
Plated Hemocytes cont. from 12/1/08
-isolated RNA from hemocytes plated 12/01/08 (4 samples). Final volume ~20uL RNA in H20.

12/02/08
Plated Hemoctes cont. from 12/1/08
plated hemocytes from oysters in FSH tanks
-after 16 hours at 12C (covered from light) plates were washed with 5 mL sterile seawater and 1 of the following treatments was added for 3 hours. After incubation the supe was removed to perform the ELISA (see below) and cells were washed off the plate w/ 1 mL TriReagent and stored in microcentrifuge tubes at -80C in 'gigas hemocyte' box:
1) 5mL sterile seawater (cell only control) - 3hours
2) 5mL PGN-SA at 5ug/mL - 3 hours
3) 5 mL PGN-SA at 10ug/mL - 3 hours
4) 5 mL PGN-SA at 15ug/mL - 3 hours
5) 5 mL PGN-SA at 15ug/mL (no cells control) - 3 hours
NOTE: control cells did not get 5 mL sterile seawater as stated. Cells had only a small amount of liquid covering them at 3 hrs. Some cells still alive (see pic below), but I'm sure they are quite stressed out. Do not appear to be quite as happy as plates with lower doses of PGN.
plated black abalone hemocytes:
-after 16 hours at 12C (covered from light) plates (1 with 2 mL abalone cells, 1 with 2 mL oyster cells) were washed with 5 mL sterile seawater and cells were washed off the plate w/ 0.5 mL TriReagent and stored in microcentrifuge tubes at -80C in 'gigas hemocyte' box. See photos below for cells "pre-wash". Cells were examined again post-wash to ensure cells were still adhered (which they were).
Pre-wash images:

Post wash images:

PGE2 ELISA
Performed pilot PGE2 EIA, standards only, per protocol.
Results from 90min read:


Summary of results:
-no dose response was observed
-PGN only sample (NO CELLS) showed response similar to samples with cells. Something weird going on there since spike recovery of PGN only was 33%. Why would PGN only have lower spike recovery than the same conc. of PGN +cells?
-it should be noted that the reagents were past their expiration date. May account for low R2 and/ or high %CV's between wells?
12/1/08
Plating C.gigas and abalone hemocytes
plated hemocytes from oysters in FSH tanks
-bled 8 C.gigas oysters and pooled hemolymph (~17.5mL)
-added 7mL sterile seawater containing (10U/mL penicilin 0.1 mg/mL streptomyocin)
-pipetted 5mL of hemolymph + antibiotic solution onto 4, 60mm culture plates coated with poly-d-lysine
-pipetted 5mL sterile sea water onto an additional plate to use as a control for the ELISA tomorrow
-placed plates in incubator at 12C at 4:30pm.
plating black abalone hemocytes:
-bled black abalone ~ 1mL
-added 1 mL sterile seawater containing (10U/mL penicilin 0.1 mg/mL streptomyocin)
-pipetted 2mL of hemolymph + antibiotic solution onto 1, 60mm culture plates coated with poly-d-lysine
-pipetted 2mL of C.gigas onto a second plate to compare cell density
-placed plates in incubator at 12C at 4:30pm.
Thoughts on plating oyster hemocytes for future experiments...
I would like to look into concentrating the hemocytes before plating so I can do a cell count and dilute to a known amount - maybe 1E6 cells/mL (or something) before plating. Then, I could potentially use smaller volumes per well for plating and use 12 well plates instead of individual dishes (only ~1 mL required). Just trying to think of ways to get more reps in, maybe more consistent results.
11/20/08
Graduate Student Symposium Presentation
11/18/08
Plated Hemocytes
-isolated RNA from hemocytes plated 11/13/08 (8 samples). Final volume ~40uL RNA in H20.
[[image:11:18_conc.jpg width="711" height="161"]]
-prepared cDNA using Quantitect kit
-ran real time PCR on samples using primers for PGE receptor (ID: PGLANDIN_E2), IL-17 (ID: IL-17 Iso D),18s (gigas 18s) and elongation factor1 (EF1). Samples run in duplicate on the plate
results:

Summary:
-results for EF1 reps are questionable. The melt curves appear to have different peaks (different melt temps) for the 2 reps.
-well F1 (small plate control rep 2) is anomalous and should be excluded. PCR efficiency is only 40%
-in general, I do not have a lot of confidence in the "small" plate data since there were not a lot of cells present when the plates were viewed under the microscope, in addition a large # of bacteria were observed
-The data from the big oysters: IL-17, PGE receptor and 18s look good (agreement between reps, consistent melt curve), therefore I am confident in the anlysis of the results.
-The results for IL-17 expression in this experiment for PGN-SA 10ug/mL 3 hours, are consistent with the results from the previous experiment (see results 11/11/08), but the PGE receptor data is 35 fold higher than control in this experiment and 6 fold higher than control in the experiment 11/11/08.
11/14/08
Plated Hemoctes
-after 22 hours at 12C (covered from light) plates were washed with 5 mL sterile seawater (photos taken see below) and 1 of the following treatments was added (experiments were separated based on "big" or "small"), and incubated for either 1, 3 or 6 hours. After incubation the supe was removed and cells were washed off the plate w/ TriReagent and stored in microcentrifuge tubes at -80C in 'gigas hemocyte' box
"big"
1) 5mL sterile seawater (control) - 6hours
2) 5mL PGN-SA at 10ug/mL - 3 hours
3) 5 mL PGN-SA at 10ug/mL - 6 hours
4) 5 mL PGN-EC at 10ug/mL - 3 hours
5) 5 mL PGN-EC at 10ug/mL - 6 hours
"small"
1) 5mL sterile seawater (control) - 3 hours
2) 5mL PGN-EC at 10ug/mL - 1 hour
3) 5 mL PGN-EC at 10ug/mL - 3 hours


Comments on pics:
pre-wash and post wash pictures on a different magnification
post-wash small was taken w/o flash
small plates to do not have a lot of attached cells
cell adherence at 6 hours appears the same for control and PGN treated plates (i.e. did not kill cells)
11/13/08
Plating C.gigas Hemocytes
-plated hemocytes from 2 groups of oysters in the FSH tanks: "big" and "small"
-plating "big":
-bled 6 C.gigas oysters and pooled hemolymph (~20mL)
-added 8 mL sterile seawater containing (10U/mL penicilin 0.1 mg/mL streptomyocin)
-pipetted 5mL of hemolymph + antibiotic solution onto 5, 60mm culture plates coated with poly-d-lysine
-placed plates in incubator at 12C at 1:30pm.
-plating "small":
-bled 6 C.gigas oysters and pooled hemolymph (~15mL)
-added 6 mL sterile seawater containing (10U/mL penicilin 0.1 mg/mL streptomyocin)
-pipetted 5mL of hemolymph + antibiotic solution onto 3, 60mm culture plates coated with poly-d-lysine
-placed plates in incubator at 12C at 1:30pm.
-also prepared V.tubiaschii in 5 mL of LB broth (2 conicals prepared) for use in challenge
(follow up on 11/14/08: NO GROWTH! plated additional LB plates to get 'fresh' colonies)
11/11/08
Plated Hemocytes
-performed real-time PCR on samples using primers for PGE receptor (ID: PGLANDIN_E2), IL-17 (ID: IL-17 Iso D) and 18s. samples run in duplicate on the plate
-results:

Thoughts on why genomic DNA did not amplify using PGS_g primers (see 11/06/08): I was using the D.rerio COX gene to look for possible introns, and also used it to estimate size of gene (~5kb). However, the top blast hit for the C.gigas COX gene is the soft coral G. fruticosa which is a bit larger (~20kb). I would need to adjust the extension time per the Clontech protocol to amplify something this big.
Paper related to project topic:
Combined pesticide exposure and bacterial challenge: in vivo effects on immune response of Pacific oyster.
11/10/08
Plated Hemocytes
-isolated RNA from plated hemocytes (4 samples). Final volume ~50uL RNA in H20. NOTE: the 3ug/mL sample has a very low 260/230 ratio. A second reading was performed as confirmation. both results were consistent.

-prepared cDNA from plated hemocytes using the Quntitect kit (4 samples).
Follow up: conc./profile check for 3 ug/mL and 10 ug/mL 24 hour samples (just to make sure weird profile of 3 ug/mL sample did not afect cDNA prep)

11/08/08
Plated Hemocytes
-24 hours after treatment the 5 mL of PGN-SA or seawater only solution was aspirated from plates 1-3 and 1 mL of TriReagent was added to each plate. Cells were washed down the plate with TriReagent and the entire volume was placed in labeled microcentrifuge tubes and stored at -80 (Gigas Hemocyte box).
Trees Cont.
C.gigas PGS closest invertebrate relationship is to soft coral (COX A and B), closest vertebrate relationship is lancelet (COX-4), closer to "constitutive" COX-1 form in vertebrates. However, Havird paper states that Coral COX A and B do not represent COX-1 and -2 of vertebrates. Same case for C.gigas?


11/07/08
Plated C.gigas Hemocytes
-after 24 hours at 12C (not covered from light) plates were washed with 5 mL sterile seawater and 1 of the following treatments was added:
1) 5mL sterile seawater (control)
2) 5mL PGN-SA at 3ug/mL
3) 5 mL PGN-SA at 10ug/mL
4) 5 mL PGN-SA at 10ug/mL (duplicate of 3)
-3 hours after treatment the 5 mL of PGN-SA solution was aspirated from plate 4 and 1 mL of TriReagent was added. Cells were washed down the plate with the TriReagent and the entire volume was stored at -80 (Gigas Hemocyte box).
image pre-washed plate (11:30am)

image 10ug/mL plate (2:30pm)

11/06/08
Oyster Tissues
-verify purity of cDNA prepared 11/04/08 using Quantitect kit, by performing GoTaq PCR on cDNA prepared 11/04/08 using PGS_g primers.
(if there is contaminating genomic DNA it should show up as a 350bp band above the expected 250 bp band)
-GoTaq PCR rxns were performed for the following samples:
1)digestive gland (Quantitect cDNA prepared 11/04)
2)gill (Quantitect cDNA prepared 11/04)
3)gonad (Quantitect cDNA prepared 11/04)
4)mantle (Quantitect cDNA prepared 11/04)
5)muscle (Quantitect cDNA prepared 11/04)
6)gonad (cDNA prepared 10/21/07, 2 bands were observed on gel)
7)genomic A (prepared 10/22/08)
8)genomic D (prepared 10/22/08)
9-11) H20 blanks
-PCR rxn: each rxn contained 25 uL 2x GoTaq, 0.5 uL each F and R primer, 22 uL H20, 2uL template
-PCR annealing temp: 55C
-note: samples were placed in thermocycler and inadvertently left at 30C for ~ 60 min before PCR was initiated
-Results:
see top half of gel image below. Lane 1) hyperladder (8uL) Lanes 2 - 12) samples 1 through 11 in order stated above (30uL each).
The 2 bands observed in the gonad tissue from the PCR performed 10/21/08 were also observed on this gel as expeced (lane 6). The 2 genomic DNA samples (lane 8 and 9) showed the expected 350 bp band. The 5 tissue samples prepared using the Quantitect kit (lanes 2-6) showed 1 band at 250bp indicating that the samples are free from contaminating genomic DNA. The H20 blanks were free of bands (lanes 10-12).
-Conclusions:
The cDNA samples prepared 11/04/08 are free from contaminating genomic DNA.
PGS ORF amplification
-primers were generated that flanked the PGS ORF (ID: PGS_ORF). PCR was performed using Clontech Advantage Genomic LA Polymerase Kit with cDNA from C.gigas tissues (gill, gonad, mantle (prepared 11/04/08) and C. gigas genomic DNA (prepared 10/22/08)
-PCR rxn:
master mix (for 7 rxns)
5u/uL polymerase mix: 1.75 uL
10xGenomic LA buffer: 17.5 uL
10uM dNTP mix: 7.0 uL
10uM forward primer: 7.0 uL
10uM reverse primer: 7,0 uL
H20: 124.5 uL
--->23.5uL mastermix 1.5 uL template/rxn.
-PCR conditions:
94C, 1min
30 cycles
94C, 30s
55C, 1min
68C, 4 min
68C, 3min
RESULTS: See lower half of gel image below.
Lane ID: 1) Hyperladder, 2) gill, 3) gonad, 4) mantle, 5) genomic A, 6) genomic D, 7) H20 blank
The expected size of the PGS ORF is ~1700 bp. A band was observe in the gill tissue at the expected size. A faint band was observed at ~1700 bp in the mantle sample, but not in the gonad sample. It appears that all 3 samples have a HMW DNA band (genomic? this does not agree with results from PCR above). No bands were observed in either the genomic or blank lanes. The band observed from the gill tissue was exised and will be sent for sequencing.

Plating C.gigas Hemocytes
-bled 7 C.gigas oysters and pooled hemolymph (~15mL)
-added 6 mL sterile seawater containing (10U/mL penicilin 0.1 mg/mL streptomyocin)
-pipetted 5mL of hemolymph + antibiotic solution onto 4 60mm culture plates coated with poly-d-lysine
-placed plates in incubator at 12C at 4:20pm.
11/05/08
Oyster Tissues
-performed real-time PCR on oyster tissue cDNA generated 11/04/08
used the following primers: prostaglandin receptor (ID: PGLANDIN_E2), PGS (ID: PGS_g), 18s (ID: gigas 18s)
Results: the highest expression for both the receptor and the enzyme was observed in the gill, followed by the mantle tissue. The lowest expression was observed in the muscle for both the receptor and the enzyme. Within each tissue, the pattern of expression of the receptor and enzyme was "consistent" (i.e. either both up or both down within each tissue).

Trees Cont.
(take 2 in Geneious, imported some sequences based on NCBI tree (what is closest to sequence and other species w/ muliple forms of COX and PGS)

11/04/08
Oyster Tissues
-prepared new cDNA from 5 oyster tissue samples using Quantitect Kit (Qiagen).
Followed protocol from manufacturer: using 0.5 uL template (~0.4 - 1 ug RNA/rxn), and incubated max time at 42 for RT rxn (30 min)
Prostaglandin "Trees"
attemped to make trees using genious (top) and NCBI (bottom). Not sure what to make of them - I need to read up on what I'm doing.
.jpg")

10/31/08
Oyster Hemocytes
real-time PCR
-ran duplicates of plated hemocytes with PGE receptor primers.
-results summarized below include data for plated hemocytes from all 3 days. Only day 10/31/08 was plated in duplicate.

Oyster Tissues
-ran RNA diluted (1:4) using 18s primers. All 5 samples showed amplification, indicating the presence of contaminating DNA. Next steps: generate new cDNA using Quantitect Kit which includes a DNase step.
10/30/08
gigas genomic DNA
PCR using 3 sets of PGS primers
-amplify genomic DNA using Clontech Advantage Genomic LA Polymerase Mix
-used genomic DNA from C. gigas prepared 10/22/08 (see reference in this notebook from 10/22)
-samples A (large volume) and D (small volume) were selected for amplification (because I broke the tubes for B and C in the centrifuge (which was cleaned well afterwards)
-3 primer sets are available for the current working PGS sequence:
-"PGS_g_F/R" (#504/505 in primer database).
-"gigas_plandin-Rv/Fw" (#412/413)
-"PGScompleteF/R" (#470/469)

-based on the genomic data from the Danio rerio, the expeced genomic band sizes are:
-PGS_g: ~750 bp
-gigas_pglandin: ~250 bp
-PGS_complete: ~4.1kb
PCR rxn:
master mix (for 2 rxns)
5u/uL polymerase mix: 0.5 uL
10xGenomic LA buffer: 5.0 uL
10uM dNTP mix: 2uL
10uM forward primer: 2uL
10uM reverse primer: 2uL
H20: 35.5uL
47uL ---> 23.5uL mastermix 1.5 uL template/rxn.
PCR conditions:
94C, 1min
30 cycles
94C, 30s
62C, 1min
68C, 4 min
68C, 3min
(this is based on Clontech recommendation for expeced sizes <5kb, note: Clontech recommended at 2 step cycle, but suggested if annealing temps were <65C to do a 3 step cycle)
Gel:
(added 5uL Bioline loading dye to each rxn. (except lane 2 which was loaded without dye), loaded entire vol. ~30uL/well)
Lane ID
1. Hyperladder (Bioline)
2. genomic A / PGS_g prim
3. genomic D / PGS_g primers
4. genomic A / gigas_plgandin primers
5. genomic D / gigas_pglandin primers
6. genomic A / PGScomplete primers
7. genomic D / PGScomplete primers
8. Hyperladder (MW for lower set of marker bands from bottom: 200bp, 400bp, 600, 800, 1000bp)

Results:
The band size for PGS_g primers is smaller than expected (~400 bp). THe band size for gigas_pglandin primer is as expected. No bands present for PGScomplete primers (why?: not sure. wrong sequence, wrong PCR conditions?)
Bands from lane 3 and 4 were excised and will be sent for sequencing.
10/27/08
Oyster Hemocytes
real-time PCR
-duplicated real-time PCR 10/23
-in addition, included duplicate preps using IL17 iso D primers (gene: interleukin 17)
Results: -for oyster hemocytes from bacterial challenge experiment see below for data from this run as well as initial run on 10/23/08.

-for plated hemocyte samples (PGE receptor primer) data see summary of results under 10/31/08
-for IL-17 results see summary below

10/23/08
Oyster Hemocytes
cDNA Preparation
-prepared new cDNA using Qiagen Quantitect kit which includes a DNAse step to eliminate genomic DNA
-repeated real-time PCR using the new cDNA (PGE receptor pimers (ID: PGLANDIN_E2, 18s)
results: reference summary results under 10/30/08.
Oyster Tissue Distribution
Ran gel from GoTaq PCR performed 10/22/08
-ran samples from GoTaq PCR prepared 10/22/08 on a 1.4% agarose gel and included Hyper ladder (Bioline)
1) DNA ladder in-house prep (20uL)
2) digestive gland (20 uL)
3) gill (25uL)
4) gonad (25uL)
5) mantle (25uL)
6) muscle (25uL)
7) water blank (25uL)
8) genomic A (25uL)
9) genomic A (25uL)
10) genomic A (25uL)
11) genomic A (25uL)
12) Hyper ladder (8uL)

Results:
The band estimated to be ~250 bp when compared to the Hyperladder (concordant with the 'lower band' in the 10/22 gel) was observed in the digestive gland and gill sample only. No bands were observed in the gonad, mantle or muscle sample. In addition, no bands were observed in the genomic samples.
10/22/08
Oyster Tissue Distribution
Re-run gel from 10/21
-re-ran samples from GoTaq PCR prepared 10/21/08 on a 1.4% agarose gel and included Hyper ladder (Bioline)
1) DNA ladder in-house prep (20uL)
2) digestive gland (20 uL)
3) gill (20uL)
4) gonad (20uL)
5) mantle (20uL)
6) muscle (20uL)
7) water blank (20uL)
8) Hyper ladder (8uL)

Results:
results are consistent with 10/21/08 gel. The lower band observed in all 5 samples migrated just below the 100bp ladder band and the upper band observed in the gonad sample migrated just below the 200bp band. However, there is some discrepancy between the 2 ladder at the band IDs on the Bioline Hyperladder estimate the observed bands to be ~250 and 350 bp respectively.
Conclusions:
The expected size of the PCR product is ~250 bp. If comparing the result to the Hyperladder, the expected product is observed in all 5 tissues. There is a second band at at ~350 bp which is observed in the gonad sample only. These PGS_ g primers were designed around and intron to be able to detect potential carryover genomic DNA. No large bands were observed in these samples, so it appears that there is no carryover, however genomic DNA should run as a positive control. There is some discrepancy in the size estimation between the 2 ladders, not sure why.
Next steps:
The original PCR was performed with a 50C annealing temperature (based on annealing temp of 53C for forward primer and 57C for reverse primer and temp of 50C was chosen). The PCR will be repeated using an annealing temperature of 60C (based on recommended temperature from primer design software (NCBI)) to increase specifcility. Four genemic DNA samples will be included as controls.
GoTaq PCR
-performed GoTaq PCR of orignal 5 samples above and 4 geneomic controls*. Increased annealing temperature from 55C to 60C for this run.
50uL reaction (25uL 2x GoTaqMM, 0.5uL Pf, 0.5 uL Pr, 22 uL water, 2 uL template). Annealing temperature was 60C.
stored samples at -20C (in Mac's samples box)
*genomic control preparation:
genomic DNA was prepared from frozen (-20C) C. gigas using 10% Chelex. A small amount of tissue was placed into individual microcentrifuge tubes
and ~ 0.5 mL of 10% Chelex was added. Samples were heated to 95C for 20 min, then cooled to 4C for ~10min before removing from the minicycler.
tubes were centrifuged at max speed for ~5 min. 2uL of supernatant were used for PCR reactions.
Tubes labeled at "gigas genomic A - D" and placed frozen at -20 (in Mac's samples box)
Oyster Hemocytes
real time PCR:
rtPCR C. gigas hemocytes - Prostaglandin E2 receptor
-Real-time was performed using prostaglandin E2 receptor primers and 18s primers.
Results: not reported since samples showed presence of contaminating DNA. (see below)
rtPCR C. gigas hemocytes - 18s
-Real-time was performed on same 12 samples using primers for 18s. To control for presence of genomic DNA in the samples. The origninal RNA was diluted 1:4 (1uL RNA, 3uL water) to mimic dilution used to prepare cDNA (5uL RNA, 15uL master mix). 1 uL of either cDNA or diluted RNA was added.]
Results: amplification was observed indicating presence of DNA. Next step: make new cDNA using Quantitect Kit (Clonetech) which includes a DNase step.
10/21/08
Oyster Tissue Distribution
rtPCR - gigas tissue distribution
-performed real-time PCR using new PGS primers (ID: PGS_g). Water blanks came up positive results are inconclusive.
-note: also attempted to run PGE receptor primers (ID: pglandin), but sequence wasn't correct compared to 2008 paper.
GoTaq PCR - gigas tissue distribution
-performed GoTaq PCR using the new PGS primers (ID: PGS_g),
50uL reaction (25uL 2x GoTaqMM, 0.5uL Pf, 0.5 uL Pr, 22 uL water, 2 uL template). Annealing temperature was 50C.
-Ran products on 1.2% agarose gel, ~30uL loaded for each sample, 20uL for ladder
Lane ID:
1) DNA ladder (in-house prep)
2) digestive gland
3) gill
4) gonad
5) mantle
6) muscle
7) water blank
insert picture here ~~
Results:
1 band observed in all tissues at ~100bp according to the ladder. A second band observed at ~200 bp in gonad
Conclusions:
The expected size of the PCR product is ~250bp. The results of this gel are not consistent with the expected band sizes.
Next steps:
The gel will be re-run using a 1.4% agarose gel along with a second DNA ladder, Hyperladder (Bioline)
Oyster Hemocytes
RNA Isolation
-isolated RNA from the following 12 samples:
8 samples collected from bacteria challenged oysters and controls on 10/09/08 (ID: U1, U2, U3, U4, T1, T2, T3, T4)
4 samples collected from plated hemocytes. Reference: Sam's notebook 10/17/08, 10/18/08 (ID: plated hemocytes control,
plated hemocytes +PGN-SA 15 ug, 4hr, plated hemocytes + PGN-SA 15 ug, 24hr, plated hemocytes + V.t. 3 hr)
stored RNA at -80C (shellfish RNA box 4)
concentration of samples:

cDNA
-prepared cDNA for all 12 samples
stored at -20C (in Mac's samples box)
10/20/08
-prepared cDNA from RNA isolated from oyster tissues on 10/17/08

10/17/08
-isolated RNA from tissues of untreated oyster sampled 10/09/08.
-samples: digestive gland, gill, gonad, mantle, muscle
-stored samples at -80C, shellfish shelf, shellfish box #5
-still need to quantitate concentration and evalute for purity
10/09/08
Gigas V. tubiashii continued from 10/08/08
-pulled hemolymph samples from both treated (T) and untreated (U) oysters (4 oysters each condition)
-sample ID: T1 (large oyster), T2 (large), T3 (small), T4 (small), U1 (large), U2 (large), U3 (small), U4 (small)
-spun samples at ~400RCF for 15min
-removed supe (i.e. hemolynph) for PGE ELISA
-excess supe and hemocytes frozen at -80C (shellfish shelf)
-tested 2 "best" hemolymph samples from treated (T2 and T4) and untreated (U2 and U3) groups to run in PGE ELISA (1:2 dilution using EIA buffer).
-reference protocol 10/02/08.
PGE2 ELISA
Results:
-all 4 samples showed decreased absorbance (OD) compared to maximum binding wells (%binding sample =OD sample/OD max binding well * 100%) indicating the presence of PGE2 in the samples (T2 and T4 ~60% of max binding, U2 and U3 ~40% of max binding).
-spike recoveries of the samples tested 1:2 were ~50% for all 4 samples indicating some type of inhibition from the sample matrix.
-samples T4 and U3 were tested neat for additional information. It was expected that the results of the neat samples would be 2x that of the 1:2 samples, but that was not observed (both samples were ~70% of max binding). The cause is most likely due to inhibition of the sample matrix (NOTE: it is not recommended to run samples neat in the ELISA manual).
Conclusions:
-It appears that PGE2 is present in C.gigas samples
-There is some inhibition using a 1:2 sample dilution in EIA buffer. Future analysis should include a higher dilution.
-Future assays would also benefit from having a "sea water negative control" to verify the sample response is specific to PGE2.
Screenshot of results spreadsheet:
results ELISA.tiff
note: curve values used were "expected" values from manual, therefore reporting results in terms of pg/mL is not recommended
spike recovery calculation using back calculated results: (sample+spike - sample)/spike alone * 100%
10/08/08
Gigas V. tubiashii continued from 10/07/08 (Sam's notebook):
-added 2 small oysters to each tank
-quantified amount of V. tubiashii: bacteria/mL = (OD of sample at 550nm) * 5E8 bacterial/mL
-determined to have: =1.633*5e8bacteria/mL = 8.2E8bacteria/mL*1000mL=8.2E11 bacteria
-inoculated 1 tank w/ 8.2E11 bacteria at 2:45pm
10/03/08
Reverse transcription of RNA isolated 9/30/8 from plated gigas hemocytes. Stored cDNA at -20C
10/02/08
Performed pilot PGE2 EIA, standards only, per protocol. Read plate at 405 nm on Victor3 plate reader in the Seeb's lab. Exported data into template provided by Cayman Chemical. Curve at 65 min read has R2=0.88, at 90 min the R2=0.99. (note to self: I need to take a closer look at the macro from Cayman to see how the data are presented.)
Results 65 min read
Results 90 min read
notes about procedure:
-I think the standard curve could be improved by using different pipette tips when loading standard. The kit protocol specifies to use the same tip when loading the standards, but the soln. was kind of viscous and I think it impacted accuracy.
-Both the 65 and 90 min reads were in the range of the protocol (AU of maximum binding wells between 0.3-1.0 AU), but I find higher readings reduce variability between wells and smooths out curves. I recommend doing both reads for future plates.
10/01/08
Prepared some reagents for the PGE2 EIA (Cayman Chemical). It should be noted that the kit has an expiration date of 28Sep2008. Bummer. Will still plan on running pilot plate with standards only tomorrow.
9/30/08
Isolated RNA from gigas hemocytes plated by Sam on 9/29/08. Images of cells were obtained prior to isolation. 20µL of sample @ 54 ng/µL ( ~ 1ug) was stored at -80C.
notes about procedure:
-pellet was really small and hard to see with less than recommended amount of tissue. it's pretty stable at isopropanol step (i.e. not too worried about sucking up the pellet) but be more careful at ethanol step.
-even though total tissue amount was less than suggested in protocol all volumes used were the same, except! final step where sample was dissolved in 20µL of water (instead of recommended 50 - 100uL).
9/26/08
Real-time PCR Vibrio Experiment
Samples:
a) gigas plated hemocytes/Vibrio:
1.gigas plated only
2. V.t. 3 hrs;
3. gigas plated hemo + V.t.
4. gigas plated hemo + V.t. supe
b) gigas hemo/Vibrio liquid
5.V.t.; Marine broth (MB)
6.V.t.; MB; seawater
7. gigas hemo + V.t.;MB
8.gigas hemo;MB
Genes:
gigas 18s
Results:
The results of this experiment are inconclusive. All 8 samples showed amplification with the 18s primers. Since 18s should be specific to oyster, it was unexpected to see amplification in the vibrio only control samples (i.e. samples 2, 5 and 6). This experiment should be repeated.
09/24/08
Real-time PCR Vibrio Expt
@ Mac : lets start scanning as images (not pdfs) -
Samples:
a) gigas plated hemocytes/Vibrio:
1.gigas plated only
2. V.t. 3 hrs;
3. gigas plated hemo + V.t.
4. gigas plated hemo + V.t. supe
b) gigas hemo/Vibrio liquid
5.V.t.; Marine broth (MB)
6.V.t.; MB; seawater
7. gigas hemo + V.t.;MB
8.gigas hemo;MB
Genes:
prostaglandin E2 receptor (primer name: TBD)
prostaglandin synthase (primer name: TBD
Results:
Both genes showed amplification in one or more of the samples. However no conclusion can be made until a normalizing gene has been run (see 9/26/08). As a side note, sample 2. V.t. 3 hrs. showed amplification with both genes. This is unexpected as the sample is a vibrio only control.