Date: 03/07/09
Summary: qPCR with the following primer sets for the August '06 samples: 18s, CysB, BGPB, BgBL, HSP70, HMG
Procedure:
- link to mastermix prep and plate layout
Date: 03/02/09
Summary: qPCR with the following primer sets for the August '06 samples: 18s, CysB, BGPB, BgBL, HSP70
Procedure:
- link to mastermix prep and plate layout
Results:
- note that 3 outliers were left out of these analyses: CysB_A9 (fold/min: 526), CysB_B15 (fold/min: 337), BgBL_B15 (fold/min: 228)
- for BGBP primers many of the wells did not amplify above threshold, those wells were not included in analysis
Conclusions/Next Steps:
Even with excluding outliers, standard deviations are high. These samples should be run in duplicate to determine precision. Even still, it appears that there may be higher expression of the bacterial recognition proteins (BGBP, BgBL) in the EDG population.
Date: 02/28/09
Summary: test for presence of genomic carryover in DNAse treated C.virginica samples from 8/22/06
Procedure:
- diluted 14 DNAse treated RNA samples 1:4 in water (1uL RNA, 3uL H20) to normalize for amount of RNA that goes into RT reaction
- prepped master mix using 18s primers
- loaded 1uL/RXN of diluted RNA and A8 cDNA for a positive control (also included "EDG other" as a control-this did not amplify on 2/24 run)
- link to Master Mix prep and plate layout
Positive control: A8 cDNA was positive as expected
Negative control: H20 negative control wells were negative as expected
RNA samples: The only sample which showed amplification was A8.
Conclusions and Next Steps:
All samples, with the exception of A8 are free from genomic carryover and can be used for further analysis by qPCR. A8 should not be used for qPCR as genomic carryover will skew the results. The amplification of the diluted RNA was much later than the cDNA sample indicating that the amplification of the cDNA sample is RNA as well as genomic DNA. I am not really too disappointed about this since this sample was strange anyway. Looking back at notes from 2/12, this sample had a piece of tissue in it, so was not pure hemocytes anyway. The only negative thing about this is that the sample sizes for the 2 groups are not the same.
Next Steps: Start qPCRs with the 7 selected primer sets in duplicate. Run 18s normalizing primers on each plate.
order new TLR primers first - since original pair was for a >400bp product
Date: 02/24/09
Summary: real-time qPCR with cDNA prepared with "other" C.virginica samples, 3166 samples cDNA prepared 2/12/09 and B1 and B2 samples cDNA prepared 2/18/09.
Procedure:
link to MasterMix prep and plate layout
Results:
Melt Curves:
Date:02/18/09
Summary: DNAse treated MV samples labeled as B1, B2, B3, B4 - in Aug box assume reference is still 3166. Quantitated RNA afterwards. Profile not normal with peak at 240nm. Quantitated DNase treated RNA from 2/12/09 (because I had only quantatited prior to DNase treatment). Those profiles were as expected - still had a maximum at 270 (probably phenol still?). Reverse transcribed B1, B2, B3, B4
Procedure:
- followed Manufacturer's instructions for Ambion's turbo DNA free kit
- 10uL reactions (B1, B2 - volume limited): -
macgaverysheet is at home w/ rxn
- 25uL reactions: 15uL RNA template, 2.5uL 10x buffer, 1uL DNase, 6.5uL H20
- incubated at 37C for 30 min
- 10uL reactions (B1, B2 - volume limited): -
- total vol RNA at the end ~ 10uL B1 and B2, ~20uL B3 and B4
- quantitated samples on Nanodrop (also included DNAse treated RNA samples from 2/12/09 for comparison)
- Reverse Transcription
- 5uL RNA placed into 0.5 mL tubes and heated at 75C for 5 min for reverse transcription
- prepared Mmix: 20uL 5x AMV buffer, 40uL dNTP, 5 uL AMV-RT, 5uL oligo dt primer, 5uL H20
- ---> 15uL/rxnfollowed by 60 min at 37C, and 95C for 3 min.
- placed cDNA in Mac's cDNA samples box at -20C
Next steps:
I'm definitely concerned about the quality of the samples B1 - B4. I wonder if the DNAse inactivation reagent absorbs at 240nm an maybe that's what the problem is. I will try one or two of these sample in qPCR using reference gene primers along with the samples from 2/12 to help evaluate quality of cDNA. Not sure what else to do but go forward.
Date: 02/17/09
Summary: real-time PCR first run w/ new virginica primers using cDNA from "other" samples (see Mac's notebook 2/9/09).
Procedure:
- prepped master mixes for 11 primer sets using Bioline "Sensi-Mix"
- 28s (reference gene), CysB (cystatinB), BGBP (beta gal binding protein), BgBL (beta gal binding lectin), TLR (toll like receptor), HSP 70 (heat shock protein 70), CatL (Cathepsin L), HMG (high mobility group protein),IL-17 (primers for gigas (just to see)), PGER (primers for gigas), PGS (primers for gigas)
- diluted RNA 1:4 to run w/ 28s primers to check for genomic carry-over (these samples have been DNase treated)
- see plate layout for mmix preps and layout
Results:
Not a lot. Most primer sets did not have any amplification. Only the sample in row C (Cvirginica EDG7 (TRi)) showed amplification for 28s, -
Next Steps:
- verify correct primer sequences were ordered (check, the sequences were all correct)
- verify PCR conditions for primer sets referenced by Tanguy paper (check, not real-time PCR but: anneal was 58C, 25 to 30 cycles). THese primer sets are BgBL (size of product 257) and TLR (size of product 414) - maybe pick a new primers for a smaller sized product?
- Maybe it's the samples? so run same samples plus cDNA from 2/16 samples using 28s and HMG primers using SensiMix and Stratagene SYBR green.
- order a second set of reference gene primers (check, 18s primers were ordered)
Date 02/16/09
Summary: DNase treated and reverse trasncribed 10 oyster hemocyte RNA samples isolated 02/12/09.
Procedure:
- followed Manufacturer's instructions for Ambion's turbo DNA free kit
- 25uL reactions: 15uL RNA template, 2.5uL 10x buffer, 1uL DNase, 6.5uL H20
- incubated at 37C for 28 min
- total vol RNA at the end ~ 20uL (15uL was frozen at -80 as "DNase Tx" RNA in MV Hemocyte box)
- 5uL RNA placed into 0.5 mL tubes and heated at 75C for 5 min for reverse transcription
- prepared Mmix: 44uL 5x AMV buffer, 88uL dNTP, 11 uL AMV-RT, 11uL oligo dt primer, 11uL H20
- ---> 15uL/rxnfollowed by 60 min at 37C, and 95C for 3 min.
- placed cDNA in Mac's cDNA samples box at -20C
Date 02/12/09
Summary:isolated and quantified RNA from 10 samples placed in TriReagent on 02/11/09
Procedure:
- followed the Manufacturer's recommended procedure for isolating RNA using TriReagent(same procedure as followed 01/14/09, see below)
- final volume used to solubilize RNA was 20µL.
NOTE: sample A8 had a chunk of tissue (I'd guess ~50mg) in it. supposed to be hemocytes so that was a bit odd - processed sample same as others
- quantified RNA on the nanodrop. results:
Conclusions: RNA was isolated. The 260/280 ratios are less than ideal. There is a peak at 270 which may indicate phenol carry-over. I looked this up to see if it would have an effect on any of the downstream activities and the only thing I found was that it could affect sequencing, not much other information. I will spin the RNA down for ~5 minutes before I do the DNAse step to see if there is any separation of the sample which may indicate phenol carryover. I plan on proceduing with DNAse and cDNA preparation with these 10 samples.
Date: 02/11/09
Summary: put Martha's Vineyard (MW) hemocyte samples from 8/22/06 sampling into TriReagent and placed back at -80C
Samples:
3166 A6
3166 A7
3166 A8
3166 A9
3166 A10
3166 A14
3166 A15
3166 B12
3166 B13
3166 B15
Procedure: thawed samples (~100µL each) and added 1 mL TriReagent vortexed samples thoroughly and placed in -80C (Box: MV Edgartown & Tisbury Hemocytes Aug 22, 2006)
Date: 02/04/09
Purpose:
Perform Lab 5: "Quantitative PCR"
Methods and Materials:
see link
Procedure:
-Prepared 2 master mixes to run qPCR using oyster gill cDNA prepared 01/21/09 using primer sets for glutathione S transferase (GST) and LBP/BPI (LBP/BPI).
-Master mix (prepared 7 rxn each: RNA prep 1 (P1) in duplicate, RNA prep 2 (P2) in duplicate, negative control (H20 only) in duplicate, 1 extra rxn for recovery
| Component |
Volume/rxn |
Total Volume |
Final Conc. |
| Master Mix, 2X (Immomix) |
25µL |
175µL |
1x |
| Syto-13 dye (50uM) |
2µL |
14.0µL |
2 - 5µM |
| upstream primer, 10μM |
1μl |
7.0µL |
0.2μM |
| downstream primer, 10μM |
1μl |
7.0µL |
0.2μM |
| Ultra Pure Water |
19uL |
133.0µL |
NA |
GST primers row A wells 1-6
LBP/BPI primers row A well 7 - 12
Added 2 µL of template or H20 to each well
See results below for well IDs
Results:
Conclusions:
No amplification was observed for either primer set. This is not surprising since the GoTaq PCR performed01/20/09 (see below) using the samples and primers did not show any PCR products. Possible causes, genes are not expressed in these samples, reverse transcription wasn't successful (see 01/29/09 procedure was not followed correctly). I suppose I also could have screwed up the primers when I ordered them. Next steps would be to repeat reverse trasncription following the correct procedure and double checking the primers.
Date: 01/28/09
Purpose:
Perform Lab 4: "Western Immunoblots". This includes a Western Blot of the oyster gill protein isolated 01/07/09 to look for te presence of Heat Shock Protein 70 (HSP70)
Methods and Materials:
see link
Protein Gel
Oyster gill samples (Prep 1 and Prep 2) were prepped to run on SDS-PAGE gel. The same steps from Lab 2 were followed, only for this preparation 25 uL of sample was mixed with 25uL of 2X Sample Reducing Buffer. The entire volume was loaded onto the gel - very slowly-and the gel was run at 150V for ~45 minutes (until the dye front was at the bottom of the gel)
Lane ID:
1. Ladder (See Blue)
2. Mac - oyster gill Prep 1
3. Mac - oyster gill Prep 2 -note: about half of this sample spilled into lane 4 during loading
4. "Blank"
5. Lisa - Prep 1
6. Lisa - Prep 2
7. Brianna - Prep 1
8. Brianna - Prep 2
9. Rachel - Octopus (labeled: octo leg 1/28)
10. - 12. Not Loaded
Transfer Proteins to membrane
1. Cool the transfer buffer to 4°C.
2. Soak the filter paper, membrane and gel in Transfer Buffer for 15 minutes.
3. Assemble the blotting sandwich in a semi-dry blotting apparatus as follows:
• Anode (+++)
• Filter paper
• Nitrocellulose Membrane
• Gel
• Filter paper
• Cathode (– – –)
- membranes, filter paper were rolled with a pipette to remove air bubbles.
4. Transfer the blot for 30 minutes at 20V.
5. Remove the gel from the sandwich and rinse with transfer buffer.
NOTE: After transfer, the gel was Coomassie stained for 5 minutes and destained in 10% acetic acid. Images of the gel were captured the next day after destaining overnight in 10% acetic acid.
Western Blotting Protocol
Western Breeze Manufacturer's Protocol
Followed Western Breeze Manufacturer's Protocol (solutions prepared for Nitrocellulose membranes page 9) with the following exception:
- the primary antibody (1:3000 HSP70 antibody in Antibody wash solution) was incubated overnight on a rocker at 4C.
The procedure was continued as stated in the protocol (step 4)the next morning (1/29/09).
Results:
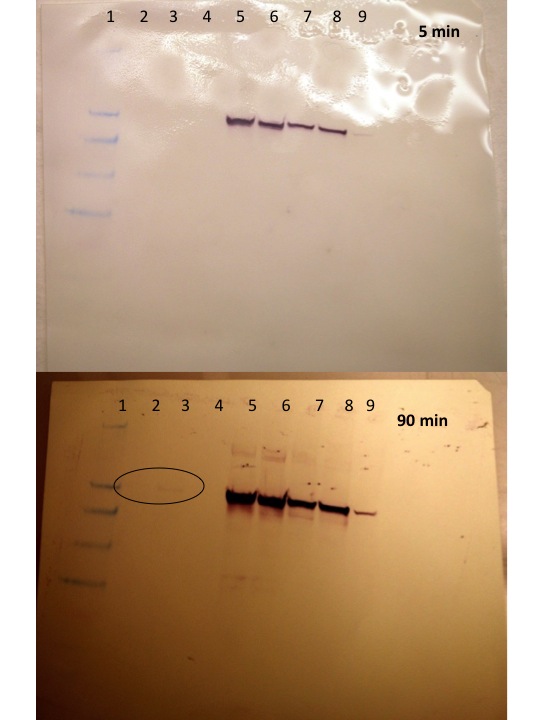
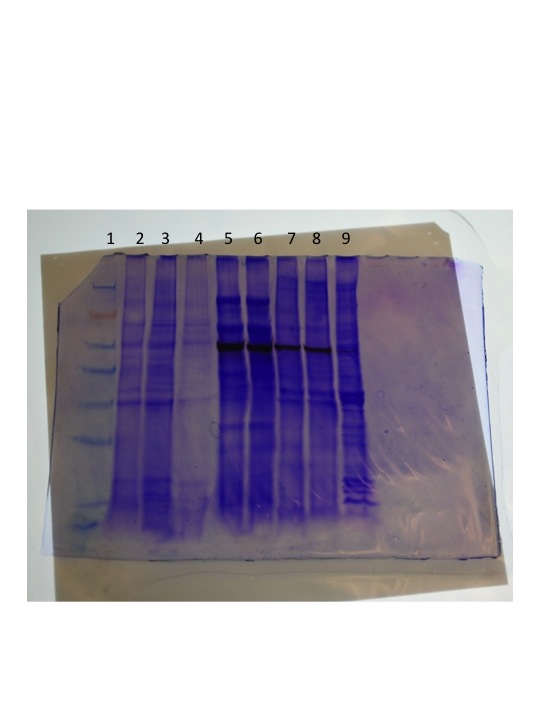
The first picture was taken 5 min after the chromogenic solution was added. No bands were observed for the oyster gill samples (prep 1 or prep 2). The second picture was taken ~90 minutes after the chromogenic solution was added and a faint band (circled) was observed for the prep 2 sample that was concordant with the bands in the other lanes (abalone and octopus) and approximated to be ~ 62kDa based on the ladder (weights are based on running gel on a 4 - 12% Bis-Tris Gel with MES). The coomassie gel was overlayed on the membrane which helped to visualize the ladder a bit better.
Coomassie gel overlaid on the membrane:
Conclusion:
Heat Shock Protein 70 was present in the oyster gill sample as determined by Western blotting with an anti-HSP 70. Interestingly, the band was only visible on the sample with a higher protein concentration (lane 3), and then only after > 1hr incubation in the detection reagent, whereas the other samples that were run in the class: abalone, octopus, trout muscle, trout brain developed quickly (~5 min) regardless of conc. loaded. Also, I find it kind of odd that the HSP70 band as it appears on the Coomassie gel that this is a relatively dark band - I'm surprised it took so long to develop. Maybe there is something about the oyster protein that is not that compatible with this antibody? This observation is only relative to some of the other samples run in class where the band observed on the western was only a faint band on the coomassie gel.
Date: 01/21/09
Purpose:
Perform Lab 3: "Reverse Transcription and PCR". This includes reverse transcription and PCR of the oyster gill RNA isolated 01/14/09
Methods and Materials:
see link
RNA Quantitation:
quantitated RNA from oyster gill samples.
Prep 1: 536.3 ng/mL
Prep 2: 532.2 ng/mL
Reverse Transcription Procedure:
1. Mix your stock RNA sample by inverting tube several times.
2. Transfer 25ug of your RNA (.25ug of mRNA) to a fresh PCR tube. Transferred 5uL of RNA from prep 1 and prep 2. NOTE: Loaded by volume because samples were < the max RNA to used in the rxn (25ug) Prepared a blank w/ 5uL H20
3. Incubate tube at 75C for 5mins in thermal cycler. -steps 3 and 4 were not performed. MasterMix prepared below per step 5 was added directly to the tube.
4. Transfer tube IMMEDIATELY to ice and incubate for at least 5mins.
5. Make Master Mix
PER RXN
4 ul 5x Buffer (AMV RT Buffer) x3 = 12
8 ul dNTPs (10 mM total) x3 = 24
1 ul AMV RTranscriptase x3 = 3
1 ul Oligo dT Primer x3 = 3
1 ul RNase free water x3 = 3
Total = 15 ul 45uL ----->added 15 uL to each of the 3 tubes
- Add MM to tube with diluted RNA in it (total volume now 20 ul)
- Vortex
- Spot spin
- Incubate at RT for 10 min
- Incubate at 37C for 1 hr in thermocycler
- Heat inactivate @ 95C for 3 min
- Spot spin
- Leave on ice or store then stored at –20C in FISH 441 box
GoTaq PCR
Two Primer sets were used in this experiment: C. gigas_GutathioneS Transferase (GST) and C.gigas_LBP/BPI
First I prepared the primers by reconstituting the lyophilized primers to a 100uM concentration. Then prepared a working stock solution of each primer at a 10uM concentration.
Then I prepared 2 master mixes (1 for each primer set):
GST: Prep 1 in duplicate, Prep 2 in duplicate, RT blank in duplicate, PCR blank (H20 and mastermix only) in duplicate
LBP/BPI:Prep 1 in duplicate, Prep 2 in duplicate, RT blank in duplicate, PCR blank (H20 and mastermix only) in duplicate
For a 50μl reaction volume:
| Component |
Volume |
Final Conc |
of rxns |
Total Volume |
| GoTaq®Green Master Mix, 2X |
25 |
1x |
9 |
225 |
| upstream primer, 10μM |
0.5–5.0μl |
0.1–1.0μM |
9 |
9 |
| downstream primer, 10μM |
0.5–5.0μl |
0.1–1.0μM |
9 |
9 |
| DNA template |
1–5μl |
<250ng |
9 |
189 |
Load reactions into thermocycler. Anneal temp was set to 55C.
Make Agarose Gels:Prepared EtBr gel by adding 2g agarose and 150 mL 1x TAE. Solution was boiled for 3 min. When soln had cooled abit 12uL of EtBr was added.
Date: 01/22/09
Run out PCR products on agarose gels and photograph.
Gel:
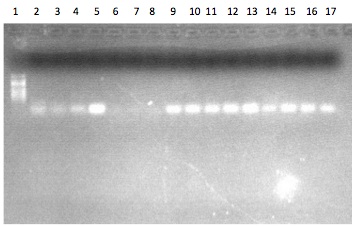
Lane ID: 1. 100bp ladder 2. Prep 1a-GST, 3. Prep 1b-GST, 4. Prep 2a-GST, 5. Prep 2b-GST, 6. RT Blank a-GST, 7. RT Blank b-GST, 8. PCR Blank a -GST, 9. PCR Blank b - GST, 10. Prep 1a-LBP/BPI, 11. Prep 1b-LBP/BPI, 12. Prep 2a-LBP/BPI, 13. Prep 2b-LBP/BPI, 14. RT Blank a-LBP/BPI, 15. RT Blank b-LBP/BPI, 16. PCR Blank a, 17. PCR Blank b
Results and Conclusions:
No bands were observed in any of the samples (or the blanks for that matter). This may be due to the fact that the RT procedure was performed incorrectly (initial 75C denaturation step was not performed). However, this seems unlikely because Lisa and Bob also performed the procedure without the denaturation step and their gels showed bands. It could be that the gene specific RNA has a different tertiary structure which prohibited the RT from working (but that's not worth figuring out, as it would be easier to just repeat reverse transcription and re-run the PCR. It could also be that these genes were not being expressed in the samples that were tested. This could be the case for the LBP/BPI gene which responds to bacteria, however I believe the GST is expressed constitutively. Because the RT procedure was not followed, the next step would be to repeat the procedure correctly and re-run the PCR.
Date: 01/14/09
Purpose:
Perform Lab 2. "Tissue Extraction II". This includes final steps of RNA extraction (cont. from 01/0/09) of oyster gill tissues and protein quantification and SDS-PAGE gel of protein extracted from oyster gill tissue.
Methods and Materials:
see link
Procedure:
RNA EXTRACTION:
followed the procedure below for the 2 oyster gill tissues in Tri Reagent from 1/09/09:
7. Incubate tube at room temperature (RT) for 5 mins.
8. In the fume hood, add 200uL of chloroform to your sample and close the tube. NOTE: Due to the high volatility of chloroform, pipetting needs to be done carefully and quickly. Have your tube open and close to the container of chloroform before drawing and chloroform into your pipette tip.
9. Vortex vigorously for 30s. You are vortexing correctly if the solution becomes a milky emulsion.
10. Incubate tube at RT for 5 mins.
11. Spin tube in refrigerated microfuge for 15 mins. @ max speed.
12. Gently remove tube from microfuge. Be sure not to disturb the tube.
13. Slowly and carefully transfer most of the aqueous phase (the top, clear portion) to a fresh microfuge tube. Do NOT transfer ANY of the interphase (the white, cell debris between the aqueous and organic phase).
14. Close the tube containing the organic and interphase and properly dispose of the liquid inside the tube as well as the tube itself at the end of the lab.
15. Add 500uL isopropanol to the new tube containing your RNA and close the tube.
16. Mix by inverting the tube numerous times until the solution appears uniform. Pay particular attention to the appearance of the solution along the edge of the tube. If mixed properly, it should no longer appear viscous/"lumpy".
17. Incubate at RT for 10 mins.
18. Spin in refrigerated microfuge at max speed for 8 mins.
19. A small, white pellet (RNA and salts) should be present. If not, do not fret. Continue with procedure.
20. Remove supernatant.
21. Add 1mL of 75% EtOH to pellet. Close tube and vortex briefly to dislodge pellet from the side of the tube. If the pellet does not become dislodged, that is OK.
22. Spin in refrigerated microfuge at 7500g for 5mins.
23. Carefully remove supernatant. Pellet may be very loose. Make sure not to remove pellet!
24. Briefly spin tube (~15s) to pool residual EtOH.
25. Using a small bore pipette tip (P20 or P200 tips), remove remaining EtOH.
26. Leave tube open and allow pellet to dry at RT for no more than 5mins.
27. Resuspend pellet in 100uL of 0.1%DEPC-H2O by pipetting up and down until pellet is dissolved.
28. Incubated tube at 55C for 5mins. to help solubilize RNA.
29. Remove tube from heat, flick a few times to mix and place sample on ice. This will be your stock RNA sample.
30. Samples were stored at -80C.
SDS-PAGE gel:
1. Begin boiling water on hot plate.
2. Thaw you protein extract from last week. Mix well by inverting tube several times.
3. In a fresh, 1.5mL SCREW CAP tube add 15uL of your protein sample and 15uL of 2X Reducing Sample Buffer.
4. Mix sample by flicking. Briefly centrifuge (10s) to pool liquid in bottom of tube.
5. Boil sample for 5 mins.
6. While sample is boiling, observe assembly of gel box and gels. Rinse gel wells thoroughly as demonstrated.
7. When sample is finished boiling, immediately centrifuge for 1min. to pool liquid.
8. Slowly load your entire sample into the appropriate well using a gel loading tip.
9. Put lid on gel box and plug electrodes into appropriate receptacles on the power supply.
10. Turn power supply on and set voltage to 150V. Run for 45mins.
11. Add ~150mL (does not have to be measured - just need enough to cover the gel) of Coomassie Stain to a designated container.
11. Turn off power supply and disconnect gel box from power supply.
12. Remove lid from gel box.
13. Disengage the tension wedge.
14. Remove gel from gel box.
15. Carefully crack open cassette to expose gel.
16. Trim wells at top of gel.
17. Notch a designated corner of the gel to help you remember the correct orientation of the gel (i.e. which is the top/bottom of the gel, which is the right/left side(s) of the gel)
18. Place gel into container with Coomassie Stain.
19. Incubate on shaker/rocker for 5 mins.
20. Carefully pour stain back into original container. Be careful not to dump out gel!
21. Rinse gel briefly with 10% acetic acid and pour this wash down the drain.
22. Add ~250mL (no need to measure) 10% acetic acid to container with gel. Incubate on shaker/rockers for 15mins. Change out buffer and repeat until bands become clearly visible. This may need to incubate O/N. If so, cover container with plastic wrap and leave on shaker/rocker.
gels were left overnight in 10% acetic acid
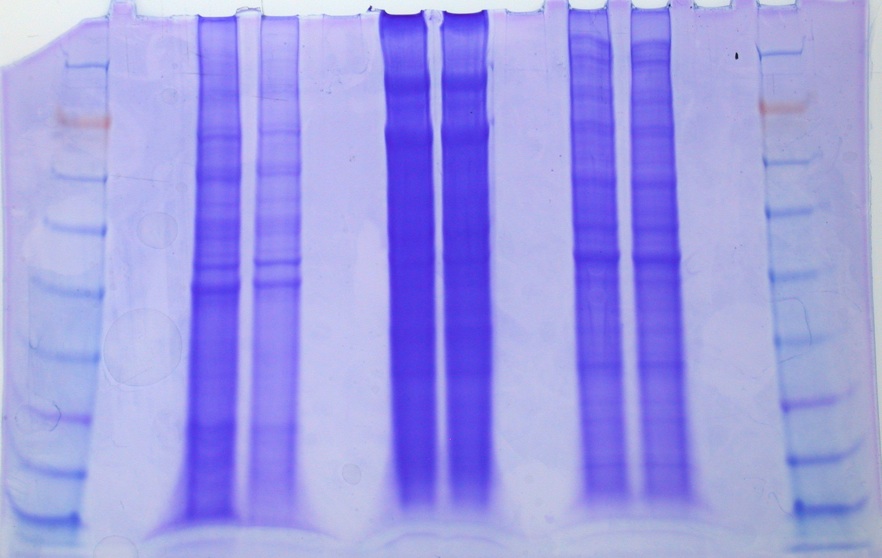
LANE ID:
1. ladder
2. blank
3. Brianna
4. Brianna
5. blank
6. Lisa
7. Lisa
8. Blank
9. Mac (14.5ug/lane)
10. Mac (32.4 ug/lane)
11. blank
12. Ladder
FRONT GEL
NOTE: LANE 1 IS ON THE FAR RIGHT!
BACK GEL
NOTE LANE 1 IS ON THE FAR RIGHT!
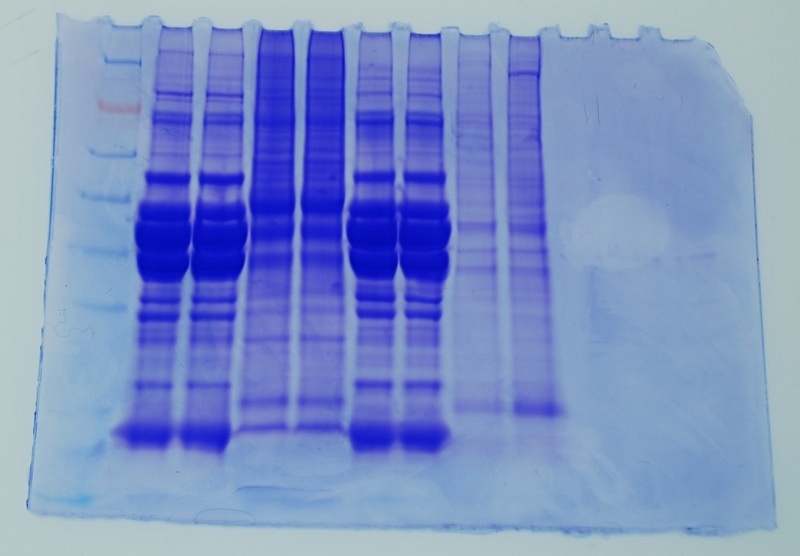
Conclusions: Both samples showed multiple bands with most of the major bands being between 38 and 62kDa. Both loads are acceptable (i.e. bands are clearly observed in both loads). I would be comfortable loading future samples with 14 - 32 mg/lane of protein
Date: 01/07/09
Purpose:
Perform Lab 1. "Tissue Extraction II". This includes: initial steps of RNA extraction and protein extraction/quantitation using oyster gill tissues.
Methods and Materials:
see link
Procedure:
RNA extraction procedure:
1. obtained frozen (-80C) oyster gill tissue.
2. Added 500uL of TriReagent to two 1.5mL snap cap tube. Stored on ice.
3. Using a clean razor blade, cut 2 pieces of frozen tissue weighing 53 mg (prep 1) and 56 mg (prep 2) each.
4. Carefully homogenized the tissue using a disposable pestle.
5. Added an additional 500uL of TriReagent to each tube.
6. Vortex vigorously for 15s.
7. At this step both tubes were labeled and stored at -80C.
Protein Extraction Procedure:
1. Added 0.5mL of CelLytic MT solution to two 1.5mL snap cap tube.
2. Weighed oyster gill tissue for two protein extractions: 23 mg (prep 1), 32 mg (prep 2) and added the tissue to the CelLytic MT solution.
3. Homogenized the tissues with a disposable pestle.
4. Inverted the tube several times to mix.
5. Centrifuged both samples for 10mins. @ max speed in refrigerated microfuge. Pellet was visible after centrifugation.
7. Transferred supernatant to labeled tubes and stored tube on ice.
8. Added 1.5mL of Coomassie reagent to three labeled tubes
9. Added 30uL of each protein extract to a tube. To the third tube added 30uL of CelLytic to use as a blank.
10. Inverted tubes several times to mix then incubate at RT for 10mins.
11. Mixed the tubes several times and transferred 1mL of each tube to a plastic, disposable cuvette.
12. Blanked the instrument using the Coomassie + Cell Lytic as the blank.
13. Measured the absorbance of each prep (1 and 2) at 595nm in duplicate.
14. Protein extraction tubes, prep 1 and prep 2, were stored at -20C.
Results:
Protein Concentration Results:
Prep 1:
0.801 ABS at 595nm
0.788 ABS at 595nm
Average: 0.795 ABS at 595nm
Prep 2:
1.338 ABS at 595nm
1.331 ABS at 595nm
Average: 1.335 ABS at 595nm
NOTE: The absorbance values are outside of the range of the standard curve (see below). Therefore, conc. may not be accurate. Before continuing with these samples the protein extractions much be diluted and reanalyzed to fit in the standard curve.
01/13/09
Purpose:
Repeat protein concentration procedure from 01/09/09 but include a dilution of the original sample prior to incubation with coomassie reagent.
Procedure:
Same as that followed for protein concentration on 01/09/09 however prior to adding 30uL of protein to 1.5 mL coomassie a dilution was performed:
for prep 1: diluted 20uL sample into 20uL DI water (2x dilution)
for prep 2: diluted 20uL samples into 40uL DI water (3x dilution)
Results:
equation for protein conc in mg/mL: y=1011.9x
Prep 1:
0.484 ABS at 595nm
0.477 ABS at 595nm
Average: 0.481 ABS at 595nm = 486.72 ug/mL * 2x dilution = 973.4 ug/mL = 0.973 ug/uL
Prep 2:
0.759 ABS at 595nm
0.762 ABS at 595nm
Average: 0.711 ABS at 595nm = 719.46 ug/mL * 3x dilution = 2158.4 ug/mL = 2.158 ug/uL**


