Rest of the samples (1-8) with blank were finished with positive results.
Arbitrary expression value calculations:
#1: Arbitrary expression value = 10^(-(0.3012*Ct)+11.434)
10^(-(0.3012*22.46)+11.434)
46671.10#2: Arbitrary expression value = 10^(-(0.3012*Ct)+11.434)
10^(-(0.3012*26.68)+11.434)
2500.25#3: Arbitrary expression value = 10^(-(0.3012*Ct)+11.434)
10^(-(0.3012*26.77)+11.434)
2348.96#4: Arbitrary expression value = 10^(-(0.3012*Ct)+11.434)
10^(-(0.3012*28.45)+11.434)
732.59#5: Arbitrary expression value = 10^(-(0.3012*Ct)+11.434)
10^(-(0.3012*27.17)+11.434)
1779.90#6: Arbitrary expression value = 10^(-(0.3012*Ct)+11.434)
10^(-(0.3012*27.90)+11.434)
1072.80#7: Arbitrary expression value = 10^(-(0.3012*Ct)+11.434)
10^(-(0.3012*27.01)+11.434)
1988.79#8: Arbitrary expression value = 10^(-(0.3012*Ct)+11.434)
10^(-(0.3012*26.04)+11.434)
3897.1911/19/13 -- Reverse Transcription and Primer Test
Lab 2 procedure was used for reverse transcription and procedure from Lab 5 was used for qPCR.
Primers were diluted as follows:
Forward --- with 325 µL nuclease free H2O
Reverse --- with 244 µL nuclease free H2O
Both primers were diluted even further in 1.5 mL tubes as follows:
10 µL of Forward primer + 90 µL nuclease free H2O
10 µL of Reverse primer + 90 µL nuclease free H2O
0.5 mL PCR tubes were labeled as follows:
#1 -- Ec1-0
#2 -- Ec1-3
#3 -- E1-1
#4 -- E1-2
#5 -- E1-3
#6 -- Ec2-0
#7 -- Ec2-3
#8 -- E2-1
#9 -- E2-2
#10 -- E2-3
Test tubes #9 and #10 with blank were used to test primers on qPCR with positive results.
Arbitrary expression value calculations:
#9: Arbitrary expression value = 10^(-(0.3012*Ct)+11.434)
10^(-(0.3012*24.09)+11.434)
15069.26#10: Arbitrary expression value = 10^(-(0.3012*Ct)+11.434)
10^(-(0.3012*25.36)+11.434)
6245.5111/14/13 -- RNA Quantification
RNA was quantified based on procedure from Lab 2.
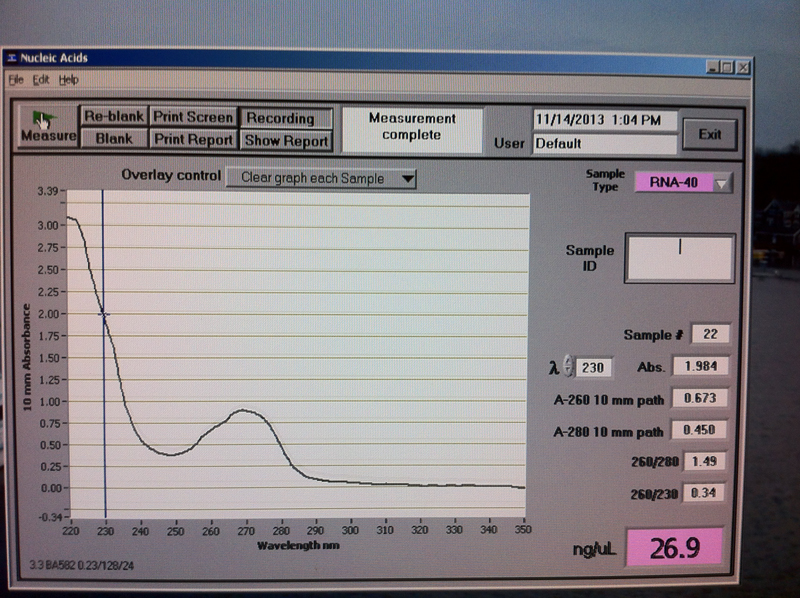
Figure 1. Vc1-0 hr RNA quantification results.
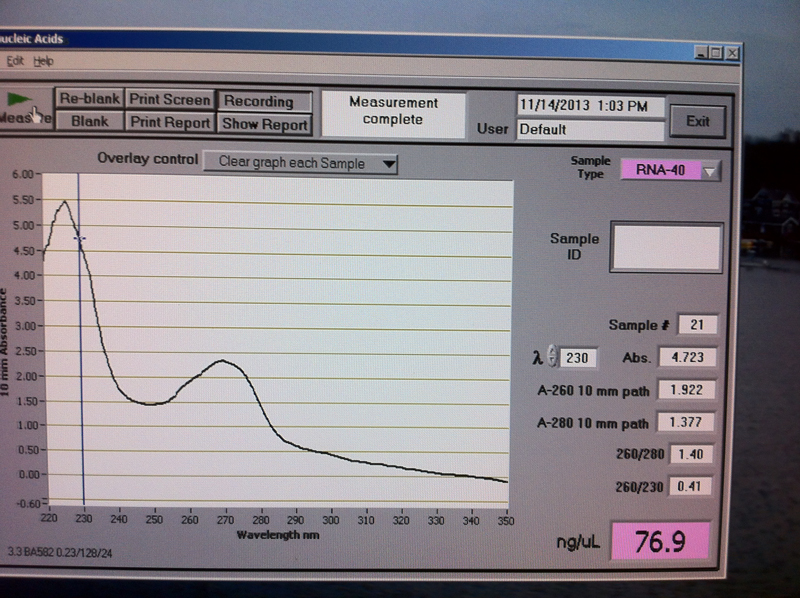
Figure 2. Vc1-3 hr RNA quantification results.
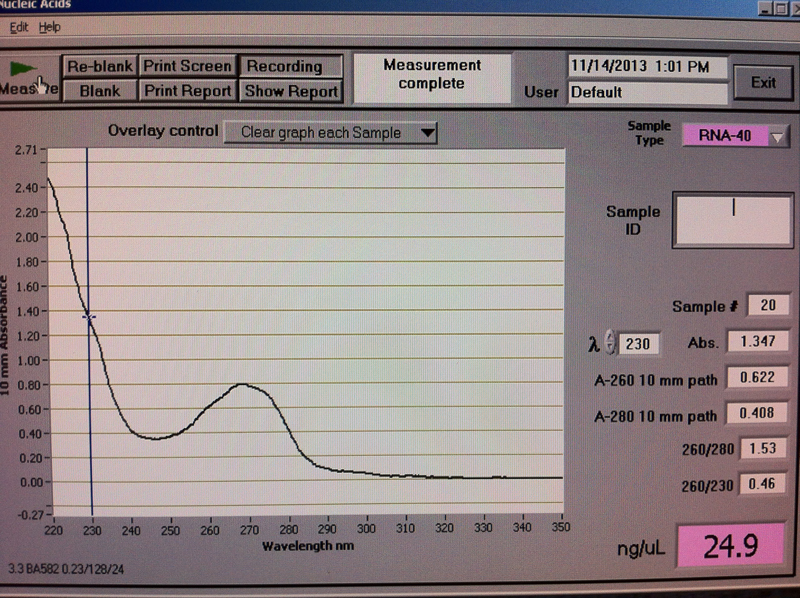
Figure 3. V1-1 hr RNA quantification results.
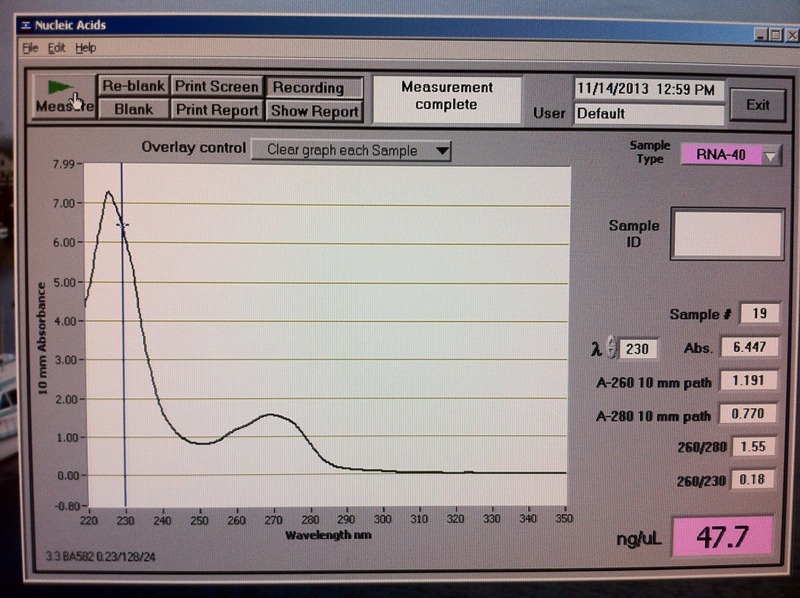
Figure 4. V1-2 hr RNA quantification results.
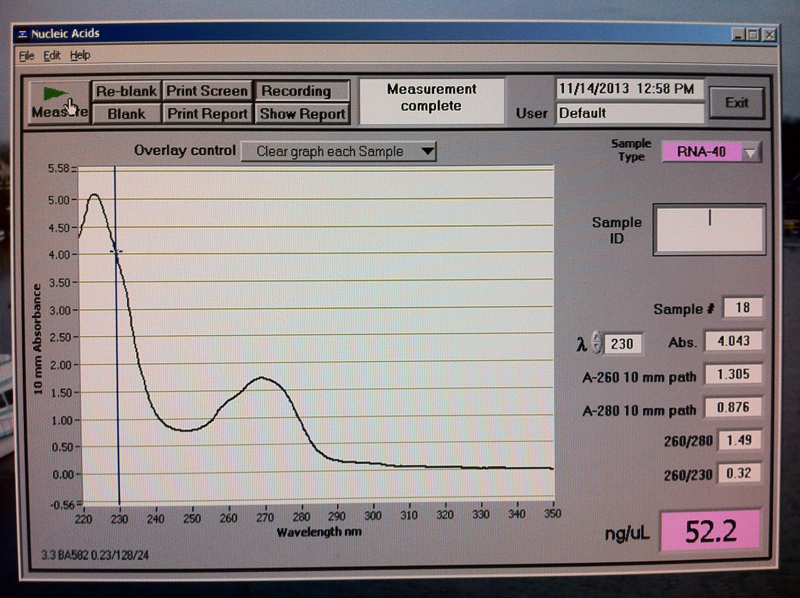
Figure 5. V1-3 hr RNA quantification results.
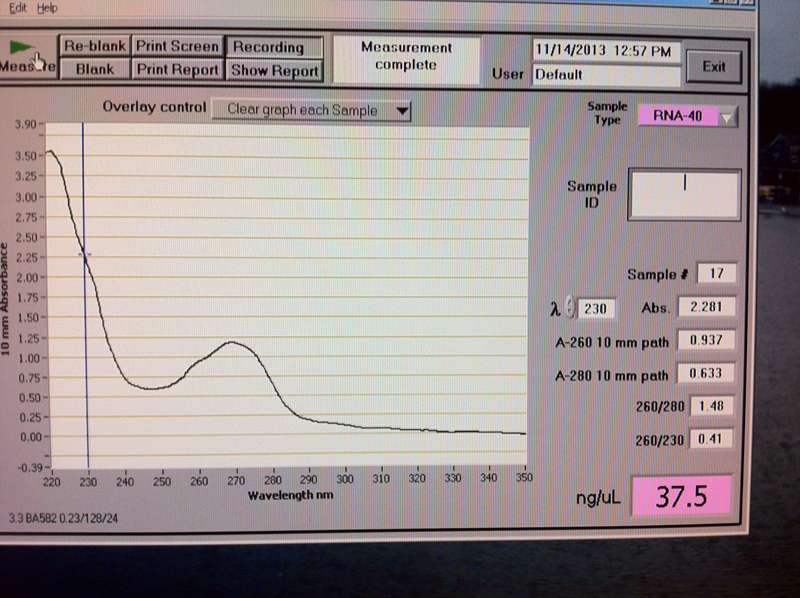
Figure 6. Vc2-0 hr RNA quantification results.
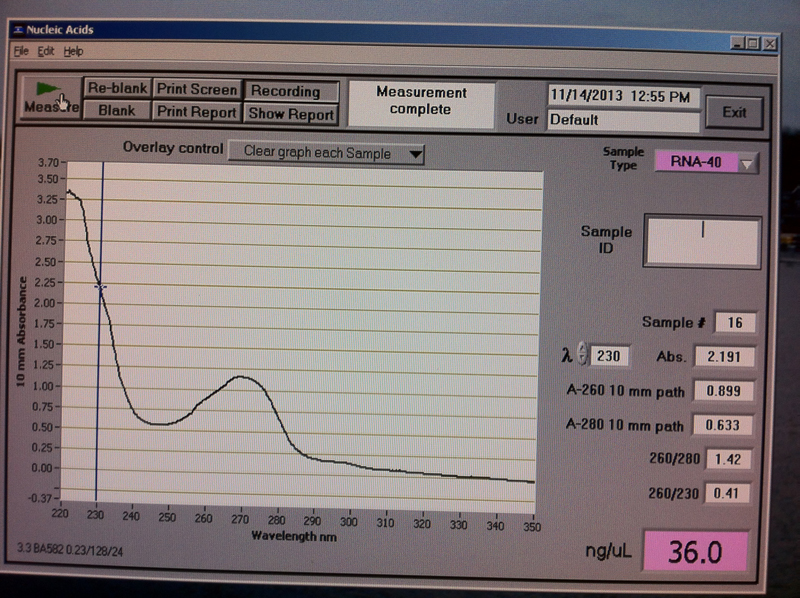
Figure 7. Vc2-3 hr RNA quantification results.
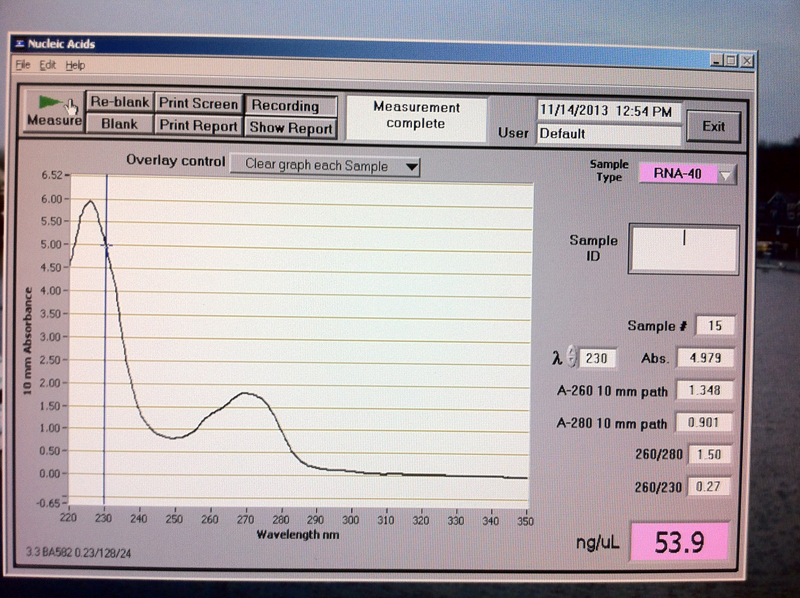
Figure 8. V2-1 hr RNA quantification results.
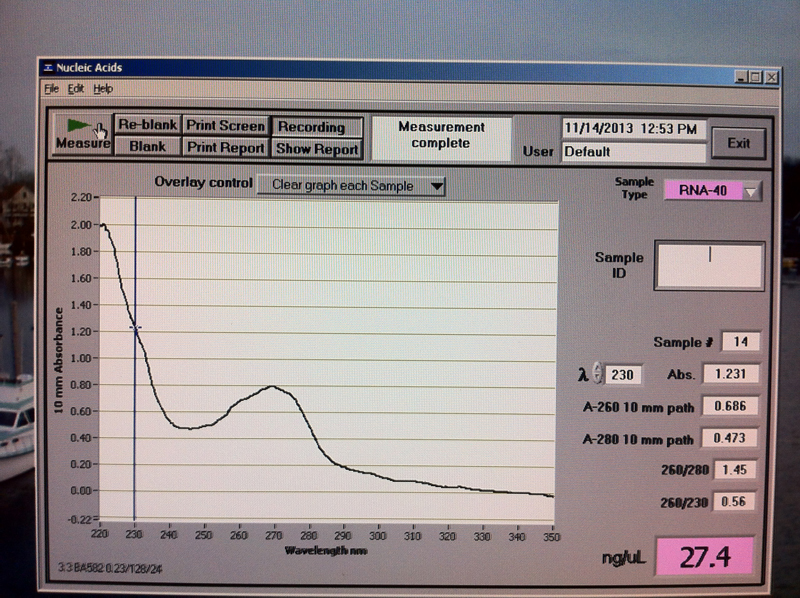
Figure 9. V2-2 hr RNA quantification results.
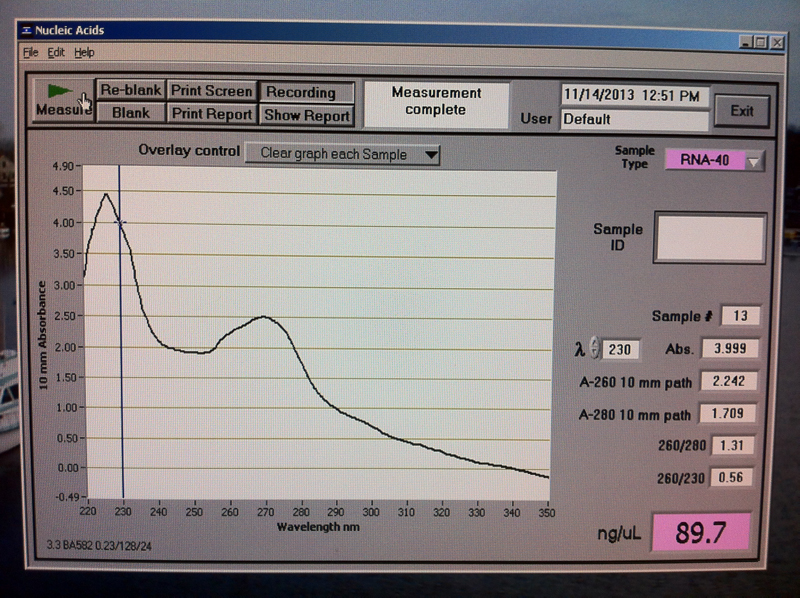
Figure 10. V2-3 hr RNA quantification results.
11/12/13 -- RNA Isolation and Extraction
RNA was isolated based on the procedure from Lab 1 and extracted based on procedure from Lab 2.
11/7/13 -- Semi-independent Research Experiment, "dry run"
E. coli grew, broth was cloudy.Vibrio broth was still clear indicating that bacteria did not grow.
Table 1. Layout of number of samples needed for the experiment.
| Flask 1 |
Flask 2 |
|||||||
| Treatment 1 |
Control |
Treatment |
Control |
|||||
| Time |
V1 (mL) |
V2 (mL) |
Vc1 (mL) |
Vc2 (mL) |
E1 (mL) |
E2 (mL) |
Ec1 (mL) |
Ec2 (mL) |
| 0 hr |
1.5 |
1.5 |
1.5 |
1.5 |
||||
| 1 hr |
1.5 |
1.5 |
1.5 |
1.5 |
||||
| 2 hr |
1.5 |
1.5 |
1.5 |
1.5 |
||||
| 3 hr |
1.5 |
1.5 |
1.5 |
1.5 |
1.5 |
1.5 |
1.5 |
1.5 |
Tubes were marked with permanent marker as follows:
Vc1-O hr, MAK, 11/7/13
Vc1-3 hr, MAK, 11/7/13
Vc2-0 hr, MAK, 11/7/13
Vc2-3 hr, MAK, 11/7/13
V1-1 hr, MAK, 11/7/13
V1-2 hr, MAK, 11/7/13
V1-3 hr, MAK, 11/7/13
V2-1 hr, MAK, 11/7/13
V2-2 hr, MAK, 11/7/13
V2-3 hr, MAK, 11/7/13
Ec1-0 hr, MAK, 11/7/13
Ec1-3 hr, MAK, 11/7/13
Ec2-0 hr, MAK, 11/7/13
Ec2-3 hr, MAK, 11/7/13
E1-1 hr, MAK, 11/7/13
E1-2 hr, MAK, 11/7/13
E1-3 hr, MAK, 11/7/13
E2-1 hr, MAK, 11/7/13
E2-2 hr, MAK, 11/7/13
E2-3 hr, MAK, 11/7/13
Vibrio did not grow, so it was not used today.
1.5 mL of E. coli control was transferred into marked tubes, centrifuged at 10000 rpm for 1 minute to pellet bacteria.
Supernatant was pipetted out and pellets were frozen at -80C
At 1 hr UV treatment 2 of 1.5 mL was transferred into corresponding tubes, centrifuged at 10000 rpm for 1 minute to pellet bacteria.
Supernatant was pipetted out and pellets were frozen at -80C.
Same steps were repeated at hour 2 and 3.
11/6/13 -- Bacteria transferred into broth for growth.
Additional empty flasks (8) were autoclaved by Claire in preparation for transfer of both bacteria into LB broth for growth. Meghan transferred both bacteria into a corresponding flask containing 50 mL of LB broth with a toothpick. All 4 flasks were incubated at 37°C for 16 hours and stirred on a stir plate at 75 rpm.11/05/13 -- Additional Calculations
After additional calculations and consultations with Claire, it was determined that original plans for collecting samples with controls and duplicates in both treatments, UV and heat, were becoming too intense for processing of 36 samples in a very short time and it was decided to compare response to a UV exposure only between two bacteria, which will decrease the number of samples to 20.
11/04/13 -- LB broth preparation
Made LB broth in two flasks by mixing the following for E. coli:5 g NaCl
5 g Bactotryptone
2.5 g Yeast Extract
After 500 mL of D/W was added, the mixture was stirred with a stir bar on a stir plate homogenization.
LB broth for Vibrio t. in additional two flasks was prepared the same way + additional 5 g of NaCl.
All flasks were labeled accordingly and sterilized in Autoclave.
10/29/2013 -- Lab 5: Semi-independent Research Experiment Finalization
Summary of the labThe main purpose of this lab was to finalize the details of the semi-independent research project with the lab partners, Meghan Rosewood-Thurman and Craig Banta, and get approval from Professor Roberts to begin the experiment. The organism of choice for this experiment is a bacteria that will be cultured and exposed to various stressors, such as UV radiation and heat, and each partner will be checking for various stress expressions by the bacteria. We selected two bacterias, Escherichia coli (Ec) and Vibrio tubiashii (Vt), as an organism of choice (depending on the growth rate of each culture). I will be investigating expression of heat shock proteins, hsp70 in particular, by the bacteria after it is exposed to environmental stressors.
Materials and Methods
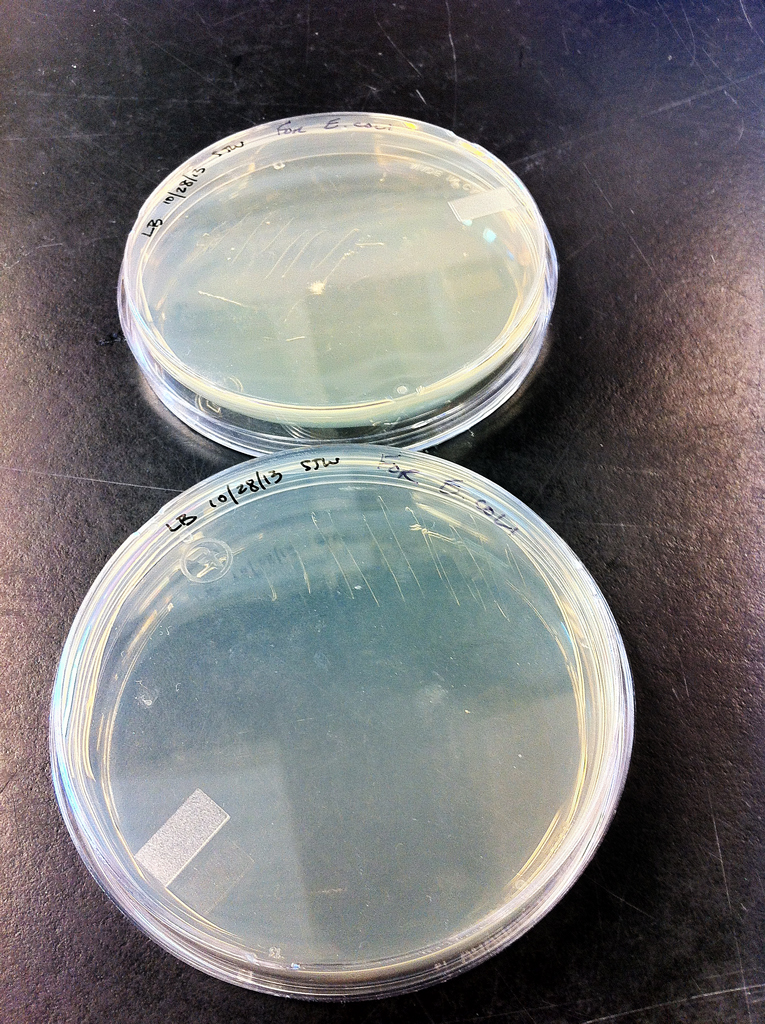
Both cultures, Ec and Vt were obtained from the UW Roberts lab, from a cloning kit and purchased from ATCC respectively. Vt was chosen as a backup for the experiment in case the Ec would not respond to growing after its virulence genes were removed. Both cultures were spread on two agar plates: Ec on Lysogenic Broth and Vt on Lysogenic Broth with 1% NaCl. Plates were placed in storage at 4°C after they were incubated for 16 hours at 37°C (Figures 1 and 2).
Culture plates were labeled as follows:
2 x Escherichia Coli --- LB 10/28/13 SWJ For E. coli
2 x Vibrio tubiashii --- LB t /./. 10/28/13 SJW For Vt RE22
The following primers were ordered:
MK_EscherichiaColi_hsp70_AE005174.2.1F TCCTACCAGGAAGCGATGGA
MK_EscherichiaColi_hsp70_AE005174.2.1R TTTGCGGAACGCAGAAACTG
MK_ATCC 19106_hsp70_fw CCAGGCCATGACTTCACCAT
MK_ATCC 19106_hsp70_rv TCATGTTGGGGACGAACTGG
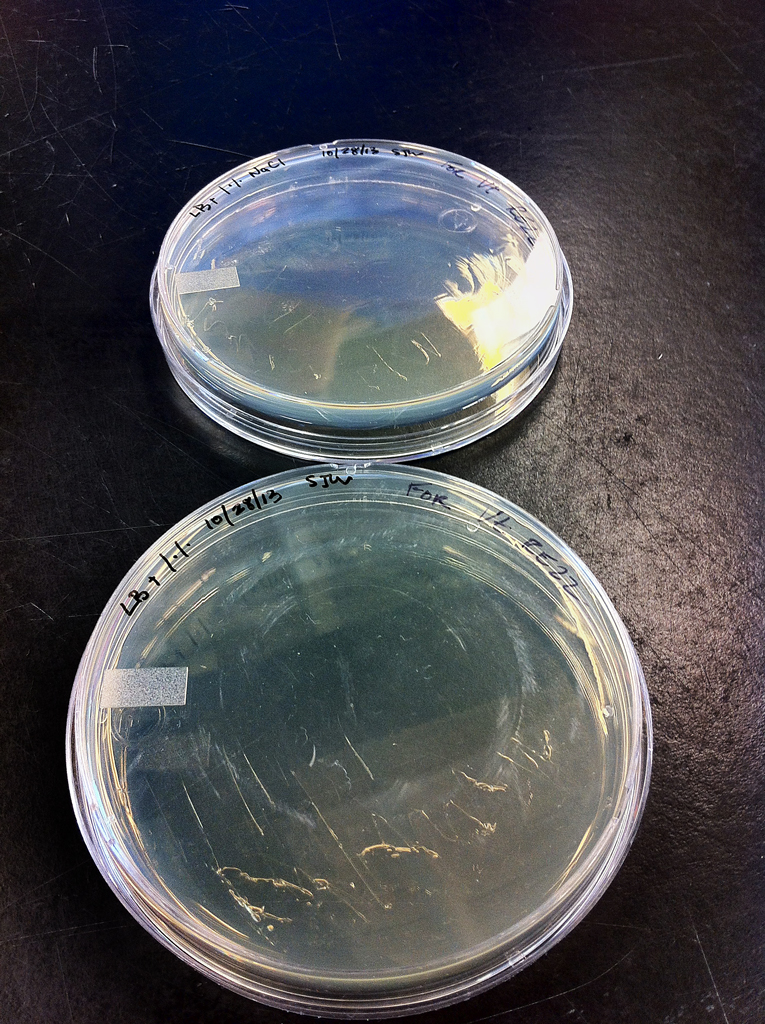
Figure 2. Vibrio tubiashii --- LB t /./. 10/28/13 SJW For Vt RE22 cultures
Results
N/A
Conclusions
A meeting was scheduled for 11/04/2013 at 0830 hrs to transfer cultures to the nutrient broth for growth and discuss a "dry run" to figure out any potential issues that might arise during the experiment.
Reflection
It is very exciting to create and conduct an experiment!
10/22/2013 -- Lab 4: Protein SDS/PAGE and Western blot, analyze conventional PCR via agarose gel and qPCR data
Summary of the labThe main purpose of this lab was to continue learning techniques in conducting SDS/PAGE gel and Western blot procedures, analyzing conventional PCR on an agarose gel and discussing analysis from qPCR.
Materials and Methods:
Making an agarose gel (kindly prepared by Claire in advance)
| Micropipettes (1-1000 µL) |
Tip waste jar |
Lab coat |
| Sterile filter pipette tips (1-1000 µL) |
1 L flask |
Safety glasses |
| 1X TAE |
Microwave |
Gloves |
| Agarose |
Gel rigs |
Kimwipes |
| Ethidium bromide |
Agarose gel electrophoresis
Combs were removed from the wells, after prepared gel was placed in a gel box and covered with 1X TAE buffer, making sure all wells are fully covered. Well #7 was loaded with 20 µL of PCR sample and 7µL 100bp ladder was loaded in the well #1. Gel was electrophoresized for 1 hour at 100V and visualized on the UV transilluminator.
Protein extraction and Analysis Part 2
SDS-Polyacrylamide Gel Electrophoresis (SDS-PAGE)
Materials and methods:
| Micropipettes (1-1000 µL) |
Tube float |
Lab coat |
| Sterile filter pipette tips (1-1000 µL) |
Protein gel box |
Safety glasses |
| Sterile gel loading tips |
SDS/PAGE gels |
Gloves |
| 1.5 mL screw cap tubes |
Tray for staining gel |
Lab pen |
| Microcentrifuge tube rack |
Power supply |
Timers |
| Heating block |
Platform rocker |
Light box |
| Water bath with a float |
Gel running buffer |
Digital camera |
| 2X SDS reducing sample buffer |
Protein ladder marker |
Plastic wrap |
WesternBreeze Chromogenic Western Blot Immunodetection
Materials and methods:
| Primary antibody solution |
Nanopure water |
Lab coats |
| Secondary antibody solution |
Gel staining tray |
Safety glasses |
| Chromogenic substrate |
Blocking solution |
Gloves |
| Trsi-Glycine transfer buffer |
Rotary shaker |
SDS/PAGE gel |
| Nitrocellulose membrane |
Antibody wash |
Filter paper |
| Semi-dry transfer station |
Timers |
- Anode (+++)
- Filter paper
- Membrane
- Gel
- Filter paper
- Cathode (---)
The following steps were kindly performed by Claire:
- Transfer the blot for 30 minutes at 20V
- Remove the gel from the sandwich and rinse off adhering pieces of gel with transfer buffer.
- Wash membrane 2 times, for 5 minutes each, with 20 mL of pure water.
- Put the membrane in the plastic box and add 10 mL of Blocking Solution. Cover and incubate overnight on a rotary shaker set at 1 revolution/second.
- Your TA will do the rest of the steps. After class tomorrow you can come and see your results.
- Decant liquid.
- Rinse the membrane with 20 mL of water for 5 minutes, then decant. Repeat.
- Incubate the membrane in 10 mL of Primary Antibody Solution. Decant the solution.
- Rinse the membrane with 20 mL of Antibody Wash for 5 minutes, then decant. Repeat 3 times.
- Incubate the membrane in 10 mL of Secondary Antibody Solution for 30 minutes. Decant.
- Wash the membrane for 5 minutes with 20 mL of Antibody wash, then decant. Repeat 3 times.
- Rinse the membrane with 20 mL of pure water for 2 minutes, then decant. Repeat twice.
- Incubate the membrane in 5 mL of Chromogenic Substrate until a purple band appears. This will occur between 1-60 minutes after adding the Chromogenic Substrate.
- Dry the membrane on a clean piece of filter paper to the open air.
Results
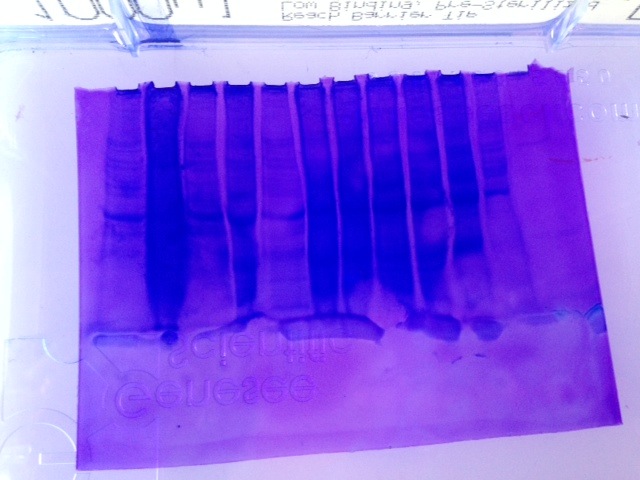
Figure 1. SDS/PAGE gel electrophoresis results.
Figure 2. Western blot results.
The gel plate was reversed and the well #7 is sixth from the left. There is no clear indication of hsp70 expression.
Conclusions
In both procedures, SDS/PAGE and Western blot, hsp70 was not expressed clearly indicating that either the organism was not under stress when its tissue was collected thus lacking hsp70 or the very little experience in protein extraction had an adverse effect on the results. In the case of the latter, this could be perfected with additional runs of procedures which will favorably affect the protein extractions in the future.
Reflection
Procedures, SDS/PAGE and Western blot, are very tedious and their results could be affected by a minute error at any step of the procedure. In addition, as indicated in the previous labs, additional practice on working with small quantities of liquids or tissues is very crucial in perfecting such skills.
10/15/2013 -- Lab 3: Reverse transcription (last week) and qPCR, analyze qPCR (via computer data and agarose gel), Primer design and preparation for the Experiment and Protein extractions
Summary of the lab
The main purpose of this lab was to continue learning techniques and perfecting skills in the reverse transcription of RNA to cDNA (completed in Lab #2), qPCR of the obtained cDNA samples, running them on agarose gel and designing primers, and performing a quantitative PCR.
Materials and Methods
Quantitative PCR
| cDNA sample from Lab#2 |
SYTO-13 Dye |
Ice buckets |
| 1.5 mL microfuge tubes (RNAse free) |
Microfuge tube racks |
Lab pens |
| Nuclease free water |
Timers |
Safety glasses |
| Filter tips |
Tip waste jar |
Gloves |
| Opticon thermal cycler |
Lab coat |
Kimwipes |
| 2 x Immomix Master Mis |
Ultra pure water |
Forward primer |
| Master Mix (SsoFast EvaGreen supermix) |
Reverse primer |
Calculations for master mix (four reactions and one for volume recovery, total of five):
| Component |
Volume |
Final Conc. |
| Master Mix (SsoFast EvaGreen supermix) |
12.5 µL |
1 x 5 |
| Forward primer, 10 µM |
0.5 µL |
2.5 µM |
| Reverse primer, 10 µM |
0.5 µL |
2.5 µM |
| Ultra pure water |
10.5 µL |
N/A |
| Total: |
24 µL x 5 portions |
= 120 µL |
Master mix was prepared for five reactions, two reactions + two negative controls + one for volume recovery, totaling in 120 µL, with 24 µL going into each well of a white PCR plate with optically clear caps. 1 µL cDNA was added to each reaction well and 1 µL of ultra pure water was added to the negative control wells. After wells were securely capped, they were loaded onto the plate and ran under the following PCR conditions:
1. 95°C for 10 minutes
2. 95°C for 15 seconds
3. 55°C for 15 seconds
4. 72°C for 15 seconds (+plate read)
5. Repeat steps 2-4 39 times
6. 95°C for 10 seconds
7. Melt curve from 65°C to 95°C, at 0.5°C for 5 seconds (+plate read)
Making an agarose gel (Kindly prepared by Claire in advance.)
| Micropipettes (1-1000 µL) |
Tip waste jar |
| Sterile filter pipette tips (1-1000 µL) |
1 L flask |
| Agarose |
1X TAE |
| Ethidium bromide |
Microwave |
| Gel rigs |
Kimwipes |
| Lab coat |
Safety glasses |
| Gloves |
2 g of agarose was mixed with 150 mL 1X TAE in a 1 L flask and microwaved for ~3 minutes (the solution should be clear without any precipitate or bubles). After the solution was cooled, 12 µL of ethidium bromide (EtBr) was added and mixed thoroughly by swirling and poured into a gel tray. After gel combs were added, gel was checked for air bubbles (if bubbles were present they were popped by using a clean pipet tip).
Protein extraction I
| Micropipettes (1-1000 µL) |
Refrigerated microfuge |
Lab coat |
| Sterile filter pipette tips (1-1000 µL) |
Ice buckets |
Vortex |
| Sterile (RNase free) 1.5 mL microcentrifuge tubes |
Gloves |
Lab pens |
| Sterile 2 mL screw cap microcentrifuge tubes |
DI water |
Safety glasses |
| Nanodrop spectrophotometer |
Microfuge tube racks |
Kimwipes |
| Cuvettes for spectrophotometer |
Tip waste jar |
|
| CellLytic MT Cell Lysis Reagent (with Protease Inhibitor Cocktail added) |
Commassie Protein Assay Reagent |
Disposable pestle |
NOTE: The weight of the tissue from sample #Pac 11g (gill tissue) could not be recorded because scales were broken.
After the snap cap tube with tissue sample was initialed and dated with a marker and 500 µL of CellLytic MT solution to the tube tissue was homogenized with a sterile disposable pestle. Then tube was spunned in a refrigerated microfuge for 10 minutes at maximum speed after it was inverted several times. Developed supernatant was transferred to a new tube marked "protein" and stored on ice.
All methods were completed as indicated in the lab manual without any deviations.
Results
At the end of this lab the protein was isolated from a gill tissue of sample Pac 11 g and prepared for Protein SDS/PAGE and Western blot during the next lab. Quantitative PCR procedure was completed and the results will be analyzed during the next lab as well.
Conclusions
During this lab skills in microtechniques such as transfer of small amounts of supernatant and protein extraction were developed.
Reflection
As indicated in the previous labs, additional practice on working with minute quantities of liquids or tissues is very crucial in perfecting such skills.
10/08/2013 -- Lab 2: RNA Isolation, Part 2 and Reverse Transcriptase (preparation for Lab#3)
Summary of the labThe main purpose of this lab was to continue learning various techniques in the isolation of RNA and to complete its extraction from the tissue of the Pacific oyster.
Sample id #36g-PAC-35C-10/23/12 (a gill tissue of the Pacific oyster) was continued to be used for RNA isolation.
RNA was quantified by using a NanoDrop spectrophotometer.
Materials and Methods
RNA Extraction
| RNA sample from Lab#1 |
Refrigerated microfuge |
Lab coat |
| Chloroform |
Vortex |
Ice buckets |
| Isopropanol |
Nanodrop spectrophotometer |
Lab pens |
| Sterile filter pipette tips (1-1000 µL) |
Heating block @ 55°C |
Safety glasses |
| Sterile (RNase free) 1.5 mL microcentrifuge tubes |
Microfuge tube racks |
Gloves |
| Micropipettes (1-1000 µL) |
Tip waste jar |
Kimwipes |
Reverse transcriptase (preparation for Lab#3)
| Nuclear free water |
Thermal cycler |
| M-MLV reverse transcriptase |
PCR tubes (0.5 ml; thin walled) |
| Oligo dT |
PCR tube racks |
| dNTPs |
All methods were completed as indicated in the lab manual without any deviations.
Results
After the spinning at maximum speed in a refrigerated microfuge for 15 minutes, a clear aqueous phase containing RNA was located on the bottom of the tube instead of a top as indicated in the lab manual. A NanoDrop spectrophotometer analysis yielded the following results: A260/280 ratio=2.04, A260/230 ratio=4.02 and -107.7 ng/µL concentration. At first it was suspected that the negative value for the ng/µL concentration was caused by an air bubble on the Nanodrop pedestal, so the quantification was conducted 3 times. All three times the results were identical = - 107.7 ng/µL concentration (Figure 1).
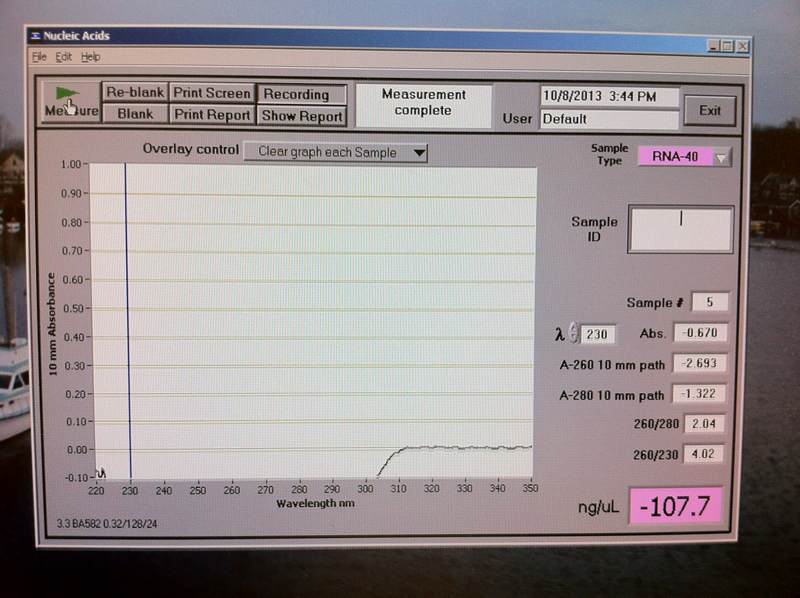
Figure 1. RNA quantification results.
Conclusions
Pure RNA has an A260/280 ratio of 2.0. This sample resulted in a A260/280 ratio = 2.04, A260/230 ratio = 4.02 and concentration = -107.7 ng/µL, which are too far from the expected pure RNA results. Therefore, the results were not as expected indicating the lack of skills in pure RNA extraction. Review of the troubleshoot manual for the Nanodrop spectrophotometer revelead the following possible reasons for the above results: "Negative values associated with some spectra indicate that either the pedestals were very dirty when the blank measurement was made or that a sample was used to make a blank or reblank measurement." Two additional measurements were taken with new pipette tip and thorough cleaning of the pedestals with a clean wipes. However, the results did not change indicating some other issue than dirty pedestals.
To obtain a purified sample of RNA it is recommended to develop necessary skills in RNA extraction first, and then re-purify the sample by ethanol precipitation or to run the sample on an agarose gel.
Time allowed for a part of Lab3# (reverse transcriptase) to be completed during this lab section as well.
Reflection
It is believed that the purpose of this lab was to introduce students to the technique of RNA extraction by using TriReagent followed by the NanoDrop spectrophotometer analysis.
It is speculated that these methods could be used for purified RNA isolation which could be potentially used for diagnostics for genetic conditions or birth defects, or in archeology, paleontology, anthropology or criminal investigations.
The procedure was very clear, however, it appears that the purity of RNA highly depends on the skills of the student, in this case mine.
10/01/2013 -- Lab 1: DNA isolation; initiate RNA isolation
Summary of the lab
The main purpose of this lab was to learn various techniques in the extraction of DNA, RNA and proteins from the tissue of the Pacific oyster. In general, 25-50 mg of tissue is need for DNA extraction and 50-100 mg for RNA extraction.
Sample id #36g-PAC-35C-10/23/12 (a gill tissue of the Pacific oyster) was used to isolate RNA using TriReagent, which allows for separation of RNA from other cellular components, including DNA. The TriReagent consists of the following: (1) guanidine isothiocyanate to denature the protein, (2) phenol, an organic solvent, to make the proteins insoluble, and (3) low pH to keep the DNA out of solution while RNA is still soluble. A chloroform, an organic solvent, was used to separate phenol and DNA and proteins from RNA.
Sample id #32g-PAC-35C-10/23/12 (a gill tissue of the Pacific oyster) was used for isolation of DNA using DNazol, which hydrolyzes RNA and selectively precipitate DNA from the cell. DNA was purified with a 75% ethanol.
DNA and RNA were quantified by using a NanoDrop spectrophotometer.
Materials and Methods
RNA Isolation
| Micropipettes (1-1000 µL) |
Sample tissue |
Ice buckets |
| Sterile filter pipette tips (1-1000 µL) |
Gloves |
Lab pens |
| Sterile (RNase free) 1.5 mL microcentrifuge tubes |
Sterile disposable pestles |
Safety glasses |
| TriReageent |
Vortex |
A tissue sample was obtained and kept on ice, after being labeled with initials and the date, with 500 µL of TriReagent in a 1.5 mL snap cap tube. A disposable pestle was used to homogenized the tissue and 500 µL of additional TriReagent was added to the snap cap tube. A prepared homogenized sample was stored in a freezer until next lab after it was vigorously vortexed for 15 seconds.
DNA Isolation (DNazol)
| Micropipettes (1-1000 µL) |
Sample tissue |
Ice buckets |
| Sterile filter pipette tips (1-1000 µL) |
Gloves |
Lab pens |
| 1.5 mL microcentrifuge tubes |
Sterile disposable pestles |
Safety glasses |
| Microcentrifuge tube rack |
Vortex |
Kim wipes |
| Microcentrifuge (room temperature) |
100% ethanol |
75% ethanol |
| Nanodrop |
DNazol |
0.1% DEPC water |
A tissue sample was obtained and kept on ice, after being labeled with initials and the date. Sample was homogenized in 05. mL of DNazol in a 1.5 mL microcentrifuge tube. After sample was incubated for 5 minutes at the room temperature it was spinned at 10,000 x g for 10 minutes to form a pellet. Next, 0.5 mL of 100% ethanol was added to the sample and tube was inverted 8 times and stored at room temperature for 1 minute. After DNA precipitated as a very small pellet it was washed with 1 mL of 75% ethanol twice. After all of the ethanol was removed, 300 µL of 0.1% DEPC water was used to dissolve the DNA pellet. After the pellet was dissolved a NanoDrop spectrophotometer was used to quantify DNA.
All methods were completed as indicated in the lab manual without any deviations.
Results
A very small, about a size of a fine tip of a ball pen, pellet was formed during the DNA extraction only after the sample was centrifuged at 5,000 x g for 5 minutes at the room temperature after addition of 0.5 mL of 100% ethanol. A NanoDrop spectrophotometer analysis yielded the following results: A260/280 ratio=2.05, A260/230 ratio=0.36 and 29.9 µg/ µL concentration.
Conclusions
Pure DNA should have a A260/280 ratio of 1.7-1.9, however, the results of the NanoDrop spectrophotometer showed a A260/280 ratio of 2.05. Therefore, it appears that this particular DNA sample was contaminated by RNA, as pure RNA has an A260/280 ratio of 2.0. In addition, pure DNA should have a A260/230 ratio that is higher than the respective A260/280 ratio. In this particular sample a A260/230 ratio of 0.36 appears to be very low, which could be an indication of the presence of contaminants (e.g. salts or some solvents) which absorb at 230 nm. Therefore, the results were not as expected indicating the lack of skills in pure DNA extraction.
To obtain a purified sample of DNA it is recommended to develop necessary skills in DNA extraction first, and then re-purify the sample by ethanol precipitation or to run the sample on an agarose gel, which is probably the most accurate way to determine RNA contamination. However, above all it is recommended to have an adequate amount of time for performing necessary tasks on DNA extraction.
Reflection
It is believed that the purpose of this lab was to introduce students to the technique of DNA and RNA extraction by using DNazol and TriReagent respectively followed by the NanoDrop spectrophotometer analysis.
It is speculated that these methods could be used for purified DNA and/or RNA isolation which could be potentially used for diagnostics for genetic conditions or birth defects, or in archeology, paleontology, anthropology or criminal investigations.
The procedure was very clear, however, it was very intense for the allotted time block at the lab. In addition, more explanation on the background information and demonstration of the technique would have been more helpful.
Additional assignment: "Name genes you might be interested in and why"
The whole assignment on what kind of experiment I should be coming up with is still somewhat hard to grasp. I have no experience in genetics or molecular labs and this is very difficult for me.
