We analyzed the qPCR results and filled out the spreadsheet. We are on the process of doing ANOVA to see if our results are statistically significant. We also started talking about how we are going to do our presentation and how we will finalize our final paper.
Lab 9: Week 4 of group project
We diluted our reverse transcribed cDNA in order to make sure we have enough. We tested out all of our primers to see if we get amplification. We also chose our gene of interested and set up and ran the qPCR.
Lab 8: Week 3 of group project
This week, we found the samples that were in another box in the freezer and did everything to them that we did to our other samples and we got all of the samples to the same step. We reverse transcribed them and DNased the samples that had some carry over.
Lab 7: Week 2 of group project
On Monday, November 15, the RNA samples were quantified.
On Tuesday, November 16, we diluted all of RNA samples and tested for DNA carryover.
On Thursday, November 18, we DNased all of the samples that showed some carry over (samples 11, 25, 28, 32, 41, 42, 45, 58, 59, 61, 76, and 77) using the manufacture's protocol, and we also reverse transcribed samples 75-92, 111-112 including the ones that were DNased.
Our primers will be here on Tuesday and we will run a qPCR to test of they work.
The progress our group has been making is very good. Everyone is doing their part and helping out. We have been meeting outside of our regular lab time. We are also following the timeline we set up relatively closely.
Tuesday, November 9, 2010
Lab 6: Week 1 of group project
During this lab, the Salmon Group came up with a schedule that we will follow for the rest of the quarter regarding our project. Throughout the following weeks, we will design and order primers, quantify our RNA, make dilutions, test out our primers, do reverse transcriptade, and run our qPCR. For today's lab sections, we all chose our genes of interest and designed primers for them. The gene I chose is the Coho salmon growth hormone (Gen Bank Accession #: M24768). I chose this gene because it will be a good gene to look at in order to observe how the fish's growth may be affected by the pesticides and/or pathogen mimics to which the fish was exposed. I also made the wiki page that our group can use to communicate and share ideas.
Tuesday, November 2, 2010
Lab 5: Quantitative PCR and Epigenetics (continued)
Summary
We performed qPCR to measure gene expression and we also developed the dot blot we started working on last week to measure DNA methylation in different species under diffrent treatments.
WesternBreeze Chromogenic Immunodetection (continued from last week)
Last week, we prepared 20mL of Blocking Solution (see Lab 4 entries). After placing the membrane in 10mL of Blocking Solution, during this lab, we incubated for 30 minutes on a rotary shaker set at 1 rev/sec. We decant the Blocking Solution, rinse the membrane with 20mL of water for 5 min, decant, then repeat. We then prepared 10mL of Primary Antibody Solution (1:5000 dilution) using 10mL of Blocking Solution and 2uL of 5-MeC antibody. We incubated the membrane with 10mL of Primary Antibody Solution for 1 hour. We decant the primary antibody and washed the membrane for 5 mins with 20mL of TBS-T. We decanted and repeated 3 more times. We incubated the membrane in 10mL of secondary antibody solution for 30 mins and decanted. We washed the membrane for 2 mins with 20mL of TBS-T, decanted and repeated 2 more times. We rinsed the membrane with 20mL of water for 2 mins, decanted, and repeated twice. We then incubated the membrane in 5mL of Chromogenic Substrate until color begins to develop. We rinsed the membrane with 20mL of water for 2 mins, decanted, and repeated twice. Then, we dried the membrane on a clean piece of filter paper.
Quantitative PCR
Primer reconstitution
We re-hydrating the primers we designed. My forward (F) primer was 24.2nm, so I multiplied that by 10 and added 242uL of nuclease free water to it. My reverse primer (R) was 30.1nm, so I added 301uL of nuclease free water to it. I labeled the two tubes 100uM. These are our 100uM stocks.
To make 10uM working stock to use for qPCR, we use the formula C1V1=C2V2. For C1, we plug in the concentration our current stock has (100uM). For C2, we plug in the concentration that we want to make (10uM). For V2, we plug in the volume of our working stock we want to make (100uL). Based on these values, we calculated V1, the volume we need to take out of our 100uM stock. V1= (C2V2)/C1 = (10uM*100uL)/100uM = 10uL.
So, we take 10uL out of our 100uM stock and add 90uL of water to it in order to make the total volume 100uL.
Preparing our Master Mix
We prepared enough Master Mix for 7 reactions in order to make sure that we have enough for 6.
For a 50uL reaction volume, we used the following:
| Component |
Volume/Rxn |
Final Conc. |
Volume Added |
| Master Mix, 2X (Immomix) |
25µL |
1x |
175µL |
| Syto-13 dye (50µM) |
2µL |
2µM |
14µL |
| Upstream primer, 10µM |
2.5µL |
2.5µM |
17.5µL |
| Downstream primer, 10µM |
2.5µL |
2.5µM |
17.5µL |
| Ultra Pure Water |
16µL |
NA |
112µL |
We added 48uL of Master Mix to each of the six wells (labeled 1-6) of our white PCR plates. In wells 1 and 2 each, we added 2uL of our cDNA template. In wells 3 and 4 each, we added 2uL of our RNA. In wells 5 and 6 each, we added 2uL of pure water. Afer spinning the strips to pull everything to the bottom, I loaded my plates in Row F, Colums 7-12 (tube 1 in column 7; tube 6 in column 12). A lab research scientist then ran the samples.
Results
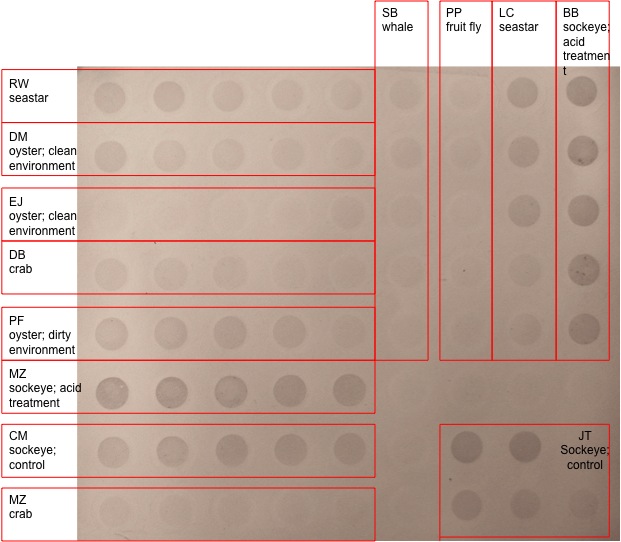 |
| Dot Blot Results. MZ sockeye; acid treatment is mine. |
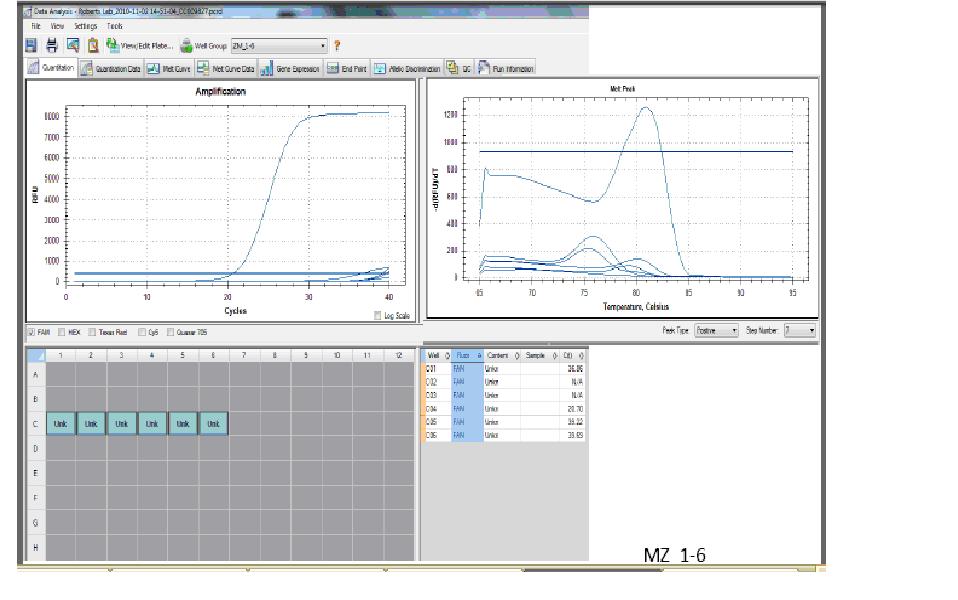 |
| qPCR Results |
Conclusion
The results of the dot blot was what was expected because the acid treated sockeye salmon showed more methylation (more dense, darker dots) that the species that were not treated with acid. This makes sense because acid alters gene expression patterns in cells. The different dilutions that I used, however, did not make much of a difference visually. They all seem very similar.
For the qPCR, one of cDNA samples worked well (it had a C(t) that is acceptable). The other, however, did not work, because I can't see the graph for it. My C(t) value for the sample that worked is about 20, which is low, which means that gene expression is high (since exponential growth was reached fast). It shows that I have many copies of my template. The graph for my RNA samples is low (around 0), so my RNA is not contaminated from DNA carryover. The graph for the water is also the same, which means there was no contamination.
Reflection
Why is it that the different dilutions resulted in different denisity of dots in some people's samples but not on the 2 acid treated sockeye salmon samples? It makes sense that the acid treated samples are more methylated but how come the different dilutions don't show different darknesses?
Interpreting the qPCR results is difficult. I'm not sure why one of my cDNA samples did not work. One of them worked, which means I have amplification and that my primers worked. But for the other sample, I don't know why I can't see the graph. Could it be that the two graphs completely overlapped and it just looks like there is only one when there is really two?
Besides that, everything was clear. Dot blotting and qPCR are very interesting techniques and they both can be very useful to analyze how an organism's genes are being expressed differently in response to environmental stresses and changes.
Tuesday, October 26, 2010
Lab 4: Epigenetics
Summary
In this lab, we ran our PCR product from Lab 3 on the agarose gel we made to check if amplification was successful. We also measured cytosine methylation of the DNA sample of our choice using dot blot and chromogenic immunodetection methods.
Agarose Gel Electrophoresis
We placed the gel we made last week in a gel box filled with 1x TAE buffer and removed the combs. We loaded 5ul of 100bp ladder (hyper ladder 1) in the far left lane. I loaded 25ul of my PCR sample into the gel and the gel was run at 100V for 55 minutes, at 150V for 69 minutes, and at 85V for about 45 minutes. During these breaks, we looked at the gel on the UV transilluminator to see the patterns produced.
Methylated Cytosine Dot Blot
DNA Dilutions
For my DNA sample, I chose the sockeye acid treatment #2 sample. I labeled five snap cap 1.5mL tubes with my initials and "DNA" and numbered them 1 through 5. The number of the tubes corresponds with the dilution number listed in the following table.
| Dilution |
Target concentration |
ul of H2O |
ul of 20X SSC |
uL of 50ng/ul DNA sample |
| 1 |
0.8ng/ul |
124 |
60 |
16 |
| 2 |
0.4ng/ul |
132 |
60 |
8 |
| 3 |
0.2ng/ul |
136 |
60 |
4 |
| 4 |
0.1ng/ul |
138 |
60 |
2 |
| 5 |
0.05ng/ul |
139 |
60 |
1 |
Dot Blotting
We cut a nylon membrane to fit 72 wells of manifold. We soaked the nylon membrane in 6X SSC for 10 min. Then, we wet a filter paper in 6X SSC and assembled manifold with the membrane on top of the filter paper. I put my DNA in boiling water for 10min to denature it and transferred it to ice after that. We switched the vacuum on and applied 500ul of 6X SSC to each well and allowed SSC to filter through. We spun the DNA down for 5min. I applied my DNA samples 1-5 to wells 1-5 (correspondingly) in Row F. All samples were allowed to filter through. While that was happening, we soaked filter paper in denaturation buffer. Once the samples filtered through, we dismantled manifold and transferred membrane to the filter paper we soaked in denaturation buffer and let it sit for 10min. We then let it set on naturalization buffer for 5min. We placed the membranes on dry filter member so they can dry. We wrapped dryed blot in plastic wrap and placed it DNA-side-down on UV transluminator for 2mins at 120kJ in order to immobilize the DNA.
WesternBreeze Chromogenic Immunodetection
First, we prepared 20mL of Blocking Solution using 14mL of ultra filtered water, 4 mL of blocker/diluent (part A), and 2mL of blocker/diluent (part B). We then placed the membrane in 10mL of the Blocking Solution in a covered plastic dish. It was incubated for 30min on a rotary shaker set at 1 revolution/sec. The Blocking Solution was decant, and the membrane was rinsed with 20mL of water for 5min, then decant, then repeated. We prepared 10mL of Primary Antibody Solution (1:5000 dilution) using 10mL of Blocking Solution and 2uL of 5-MeC antibody.
Next week, we will continue this procedure by first incubating the membrane with 10mL of Primary Antibody Solution for 1 hour. We will then decant primary antibody and wash the membrane for 5min with 20mL of TBS-T, then we will decant and then repeat this 3 more times. We will incubate the membrane in 10mL of secondary antibody solution for 30mins and then decant. We will wash the membrane for 5min with 20mL of TBS-T, decant and repeat this 3 more times. We will rinse the membrane with 20mL of water for 2min, decant, and repeat twice. Then, we will incubate the membrane in 5mL of Chromogenic Subtrate until we begin to see the color developing (1-60mins). We will rinse the membrane with 20mL of water for 2min, decant, repeat twice. Finally, we will dry the membrane on a clean piece of filter paper and analyze the results.
Results
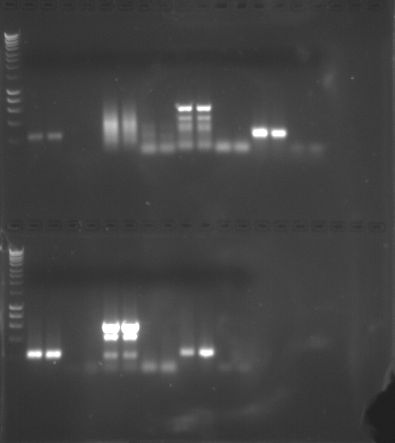 |
| PCR Results Gel 1 |
PCR Results Gel 1 (Mine is on the top - columns 14-17)
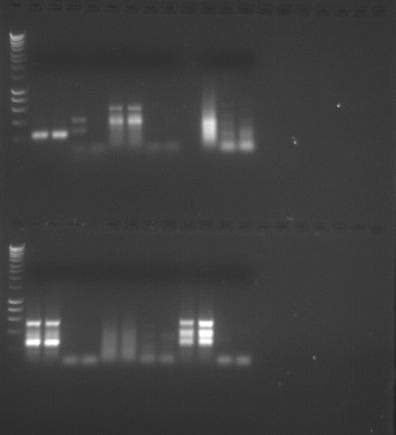 |
| PCR Results Gel 2 |
PCR Results Gel 2
Conclusion
The results are what I expected because I can see bands in rows 14 and 15 (where my amplified cDNA was placed) and no band in rows 16 and 17 (where the negative control was placed). This shows that the PCR was successful and cDNA was amplified correctly. We can perform quantitative PCR since we have learned that amplification is successful.
Reflection
The chromogenic immunodetection portion of this lab was confusing, but it's probably because we didn't finish it and were rushing through the last parts that we did. It will probably make more sense next week. The rest of the lab, however, was pretty clear. The methylated cytosine dot plot procedure can be useful in detecting methylation or changes on the DNA that occur on an organism and can therefore be used in epigenetic studies and to see whether the environment is the cause for those changes. It can be used to see how the environment is causing changes in gene expression and if those changes are passed on to future generations.
Tuesday, October 19, 2010
Lab 3: Reverse Transcription and End-point PCR
Summary
In this lan, we learned how to transcribe the RNA we previously extracted into complimentary DNA. We also chose a gene and set it up for end point polymerase chain reactions. Lastly, we made an agarose gel that we will use next week for agarose gel electrophoresis.
Reverse Transcription Protocol
I put 5ul of my RNA, 1ul of oligo dT, and 4ul of nuclease free H2O into a 0.5mL PCR tube labeled "cDNA." I incubated the mixture for 5 min at 70C on the thermocycler. I transfer it to ice, then briefly centrifuged. I added 5ul of M-MLV 5X Reaction Buffer, 5ul of dNTPs, 1ul of M-MLV RT, and 4 ul of nuclease free H2O into my PCR tube. After incubating the mixture for 60 min at 42C, I put it in the thermocycler at 70C for 3 min. I spun in down in the centrifuge, and then stored on ice at -20C.
PCR Protocol
In a 1.5mL microcentrifuge tube labeled "MM," I added 250ul of GoTaq Green Master Mix, 2X; 15ul HSC 71 forward primer, 10uM; 15ul HSC 71 reverse primer, 10uM; and 108ul of nuclease free H2O.
I pipetted 48ul of my master mix in to each 4 of my PCR tubes labeled 1 through 4. In tubes 1 and 2each, I added 2ul of cDNA. In tubes 3 and 4 each, I added 2ul of nuclease-free H2O. I spun the tubes to pool liquid at the bottom of the tubes, and I put them into the thermocycler. The samples would be put through steps of denaturation (95C, 5min, 1 cycle), denaturation (95C, 30sec), annealing (55C, 30sec, 40 cycles), extension (72C, 90sec), final extension (72C, 3min, 1 cycle), and holding (4C, 1 cycle) before being stored at -20C.
Making an agarose gel
We weighted 2g of agarose and mixed it with 150mL 1x TAE in a 1L flask. The solution was microwaved in intervals until it turned clear. After cooling it, we added 12ul ethidium bromide (EtBr). We swirlled the flask to mix, then we pour it out into the gel tray and added gel combs. After the gel was set, it was wrapped in plastic wrap and placed in the fridge for Lab 4.
Results
We did not collect data during this lab. It was mostly a set up for the next lab.
Conclusion
From the cDNA we made through reverse transcription, we can do downstream applications such as measure gene expression. For the PCR, we will check if our DNA was successfully amplified by running the PCR product on the agarose gel we made during the next lab.
Reflection
The purpose of this lab was to teach us basic laboratory techniques, specifically DNA template amplification through PCR, reverse transcription to make cDNA out of RNA (since cDNA is much more stable), and making agarose gel in order to run PCR products and other products to test them out. Reverse transcription is necessary to change RNA into cDNA in order to use it to measure gene expression and for other applications. This can be used to measure how an organism may be affected by changes in the environment. For example, gene expression would show a decline if an organism's environment is significantly polluted. PCR is also necessary because it is difficult to obtain a significant amount of the DNA you are interested in studying, therefore amplifying it would make it easier to obtain and use for many analysis. Making your own agarose gel is also important because it is cheap and can be done very easily. The gel can be used to run many products in order to visually see if you amplified your DNA correctly (you would see a clear band that indicates your gene and you would see no bands at your negative controls. This lab was clear and understandable. Making the agarose gel was really interesting.
Tuesday, October 12, 2010
Lab 2: RNA Extraction and Protein Analysis, Part 2
Summary
In this lab, we ran the protein we extracted (in Lab 1) on SDS-PAGE Gel. We also finished the RNA extraction we started last week, and look more into how to select sequences and genes for primer design.
SDS-PAGE Protocol
I mixed 1.5 microliters of my protein stock with 15 microliters of 2X Reducing Sample Buffer inside of a 1.5mL screw cap tube labeled "Protein+2X R" and my initials. After mixing and centrifuging the sample, I boiled it for 5 mins. I centrifuged it again for 1 min to pool liquid. Then, using a gel loading tip, I loaded the sample into well #2 (in the backside) of the gel box. Caroline put the lid on it and plugged in the electrodes and turned it on to run at 150V for 45 mins.
Enough Coomassie Stain to cover the gel is added to the container. The power supply is then turned off and disconnected from teh gel box. The gel is removed from the box and exposed. Wells at top of the gel are trimmed and one corner of the gel is marked to signal the orientation. The gel is placed into a container with Coomassie Stain and incubated on the rocker for 5 mins. The stain is poured out and the gel is rinsed with 10% acetic acid. Enough acetic acid to cover the gel is added and the gel is incubated again on the rocker for another 15 mins. This rinsing is repeated until bands become easy to see. The gel is incubated overnight.
RNA Extraction (Part 2) Protocol
Continuing from last week, I added 200 microliters of chloroform into my homogenized sockeye salmon tissue sample. I vortex it for 30s then incubated it at RT for 5 mins. I spinned it in the microfuge for 15 min. I transfer the clear portion to a fresh microfige tube. This new tube is labeled "RNA+chlo clear." I added 500 microliters of isopropanol to this tube and mixed it by inverting many times. After incubating for 5 mins, I spun it in the microfuge for 8 mins. I removed the supernant without disturbing the pellet at the bottom. I added 75% EtOH to the pellet and vortexed the tube. I spun it in the microfuge at 7600g for 5 mins. I removed the supernatant and spun the tube for 15s to remove residual EtOH. I then removed the EtOH and left the tube open for 5 mins to let pellet dry. I put the pellet in 100uL of 0.1%DEPC-H2O and dissolved it. I incubated the tube in the hot water bath (55C) for 5 mins, mixed it, then placed in on ice.
Using the Nanodrop spectrophotometer, I quantitated RNA yield. Caroline blanked the instrument using 2uL of 0.1%DEPC-H2O. I pipetted 2uL of my RNA sample onto the Nanosrop pedestal and lowered the arm. I clicked "Measure" and recorded the important values (dicsussed under Results). I gave my sample to Caroline to store at -80C.
Results
1. SDS-PAGE


Gel 1
"Lane 1 is on the left and molecular weight decreases from top to bottom" for both gels.
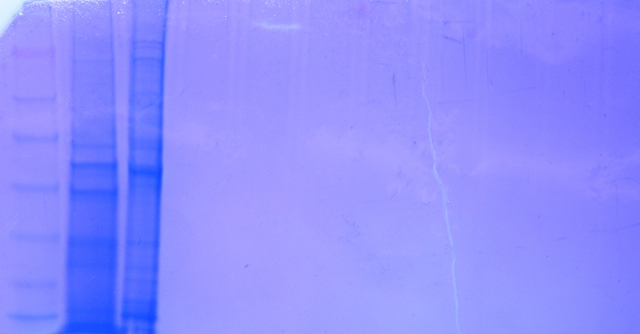
Gel 2. Lane 2 in this picture is my sample and is from a pH treated sockeye tissue sample.
2. RNA Quantification
RNA concentration = 882.9 ng/uL
A260/A280 ratio = 1.87
A260/A320 ratio = 2.26
Conclusion
In the gels, the blue bands that are seen are proteins. Since we used a non-selective stain, all of the proteins are visible. Most of my the bands in my sample have travelled all the way down, which indicates that it contains many proteins that have low molecular weights. The bands from most of the pH treated sockeye samples look very similar. Proteins are separated by molecular weight, therefore the ones at the top have high molecular weights, while the ones at the bottom have lower molecular weight. To figure out what proteins the bands represent, we can use a more selective stain in future experiments. We can also use the Western blotting method instead of staining in order to detect specific proteins. Good -
For the RNA Quantification portion, my A260/A280 ratio us 1.87, which is within the acceptable range (1.8-2.0). My A260/A320 is 2.26 and it is a bit too high for the acceptable range (1.5-2.0). This indicates that my RNA was not very pure and may contain phenol, ethanol, or high salt.
Since the next lab is about reserve transcriptions and end-point PCR, we will use our RNA samples to do that experiment.
Reflection
This lab taught me basic procedures on how to analyze protein and extract RNA. SDS-PAGE is a common method that is used in many fields such as genetics, forensics, biochemistry, and molecular biology to separate proteins according to their molecular weight. It can be used to single out a single protein to be studied or for many other things. RNA extraction and testing out its purity using the Nanodrop spectrophotometer is also important, because poor quality RNA would lead to problems when performing reverse transcription and labeling and will afftect data quality. Therefore, it is important to quanitify the RNA before moving on to do reverse transcription. In this lab, everything was clear. I am not completely sure how to calculate the RNA concentration but I have tried to follow the protocol. Besides that, everything makes sense.
Primer Design
Gene: Oncorhynchus nerka mRNA for beta actin, partial cds
Accession #: AB111057
The primer I have chosen to use is the first pair.
Tuesday, October 5, 2010
Lab 1: RNA Extraction and Protein Analysis, Part 1
Summary
The purpose of this lab was to extract RNA (using TriReagent) and protein (using CellLytic MT) from a tissue from a juvenile sockeye salmon. Concentration of protein in the sample was calculated using the Bradford protein assay. The lab also provides an introduction on how to design primers for selected gene sequences.
RNA Extraction
The tissue sample I chose was that of the juvenile sockeye salmon (pH treatment B) and it was contained in a 1.5mL snap cap. To isolate the RNA from this sample, I used 500 microliters of TriReagent and I homogenized the tissue by using a pestle and then by vortexing it. Then, I added another 500 microliters of TriReagent, vortexted the tube, then stored it at -80 degree Celcius. The sample is labeled "sockeye acid B."
Protein Extraction and Analysis
To start with, I had 27 mg of tissue from the sockeye salmon. I added 500 microliters of CellLytic MT solution to the 1.5mL snap cap containing my tissue. I homogenized the tissue by using a pestle and by vortexing for about 10 seconds. Then, the tube was spinned (for 10 mins) in a refrigerated microfuge at max speed. When the spinning was complete, I transferred as much of the supernatant as possible (without disturbing the debris at the bottom) to a new tube labeled "Protein."
I put 15 microliters of my protein sample into a 2 mL screw cap tube and mixed 15 microliters of DI water into it. I labeled this "Protein BA." As my control, I put 30 microliters of DI water into another 2 mL tube labeled "blank". To both tubes, I added 1500 microliters of Bradford reagent. I mixed them well and incubated for 10 mins at room tempertature. I transferred 1000 microliters of each sample to a cuvette. After zeroing the spectrophotometer using my blank sample, I measured the absorbance of my protein+water+BA sample (in a cuvette) at 595 nm. It was 0.152. After mixing again, I took another measurement, which turned out to be 0.189.
The average of my two absorbance values is 0.1705, and that is equal to "x" on the standard curve for calculating protein concentration. Using the equation y=1013.9x, y=1013.9*0.1705, y=172.87ug/mL. Since I diluted the protein sample 1:2 in water, this y value needs to be mutiplied by 2, resulting in 345.7 ug/mL as the protein concentration.
The protein sample is now stored at -20 degree Celcius.
Good job! Your methods section is clear and succinct. -
Result
The weight of my tissue was 27000 ug. The protein concentration in my sample is 345.7 ug/mL.
Primer Design Great initive designing primers. The sequences you have designed primers for represent an entire gene sequence (not just mRNA or cDNA) which contains both the introns and exons (the expressed regions transcribed into RNA). We will only be able amplify exonic (since it is RNA) regions using qPCR so primers designed off of this sequence might not work because we do no where the exons are. Try searching for nucleotide sequences by entering "sockeye salmon HSP70 (any gene will do)" and then select sequences of either cDNA, mRNA, or exons. For gene ideas check out this paper: Veldhoen, N., M.G. Ikonomou, C. Dubetz, N. MacPherson, T. Sampson, B.C. Kelly, and C.C. Helbing. 2010. Gene expression profiling and environmental contaminant assessment of migrating Pacific salmon in the Fraser River watershed of British Columbia. Aquatic Toxicology 97: 212-225. -
Also, when designing primers specify the product length: 150-300bp-
(Data in this section was obtained using the NCBI Database)
Gene name: Oncorhynchus nerka pvalb1 gene for parvalbumin beta-1
Accession #: FN555149
Accession #: X67308
Accession #: DQ267490
Conclusion
I think the concentration of protein I got is enough for future labs.
Reflection
The purpose of this lab was to teach us basics about extracting protein and RNA as well as making primers that we can use for PCR and DNA sequencing. These methods are used to study the response of an organism to changes in the environment. This is done by analyzing how an organism's genes change in response to these changes. Yes! -