11/25
Summary:
The purpose of this lab was to run qPCR on our extracted samples.
Materials and Methods:
Primers that worked from lab 5 (10/28) were used: Sophie's HSP 70B and HIF 1a, Sean's Superoxide Dismutase, and Elongation factor as a control. qPCR reactions were set up using the following profile:
SSOFast 12.5*8=100µL
Forward: .5*8=4µL
Reverse: .5*8=4µL
H2O: 10.5*8=84µL
cDNA (or H2O for control): 1µL
EF and SOD were loaded into plate 1. HSP and HIF were loaded into plate 2 but it was spilled and discarded.
Results:
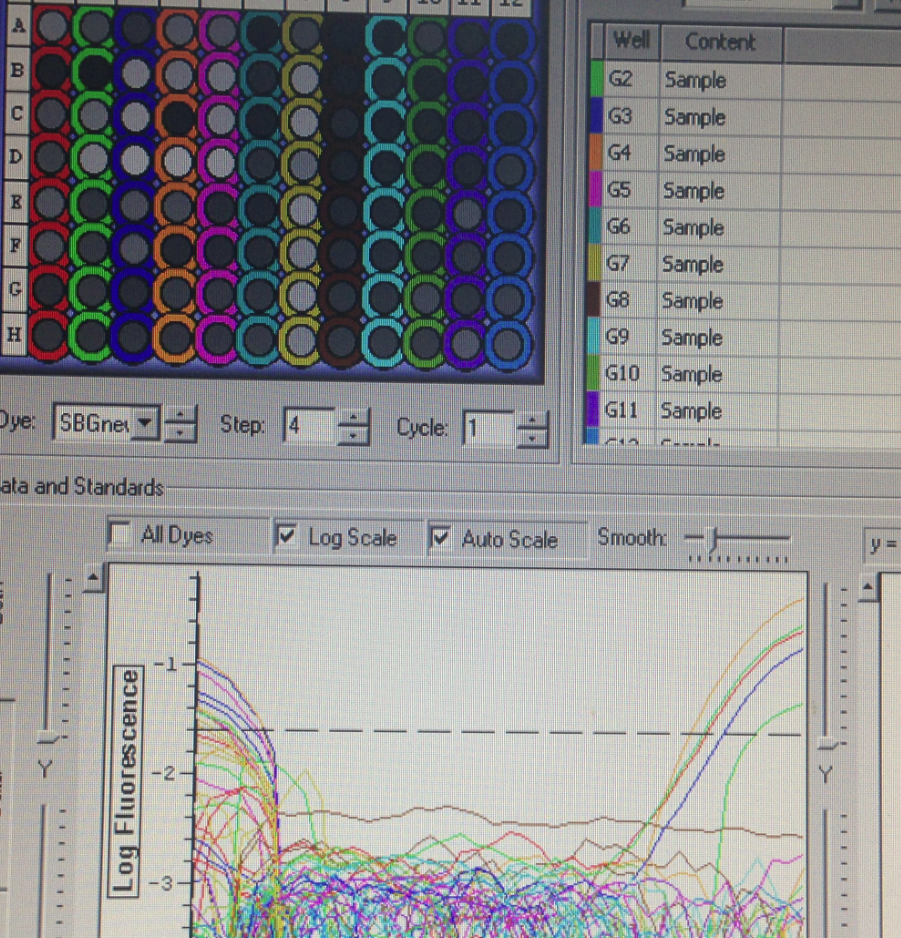
There was some amplification, however it was only in a few samples.
Conclusions:
These results are not exactly what was expected since many of the EF wells did not amplify. This may be from a number of factors; failed RT, poor extraction, RNA degradation, etc.
The purpose of this lab was to get data back from our research project. These procedures are used throughout the biological sciences to get information on protein expression without having to isolate the proteins themselves.
Lab 7
11/18
Tissue extractions from each group of oysters were taken, placed in TRI-Reagent. After homogenization, RNA extraction was completed according to protocol. The C. Virginica and Mechanical then heat groups were then tested for DNA contamination and neither showed carryover DNA, so we concluded that there was no contamination in the samples.
Lab 7
11/17
40 Oysters were prepared for proposed experiment. 8 treated with heat, 8 with mechanical stress, 8 with heat then mechanical stress, 8 with mechanical then heat stress, and 8 controls (no stress)
LAB 6
11/4
Summary:
The purpose of this lab was to test how well our primers amplified Crassostrea cDNA as well as to evaluate the effects of dilution of cDNA on primer effectiveness.
Materials and Methods:
Primers ordered in Lab 5 (information on primers in 10/28 entry) were diluted to 100µM to create a stock solution and then to 10µM for a working solution. qPCR was prepared for 7 Reactions as well as a blank as follows:
SSOFast 12.5*8=100µL
Forward: .5*8=4µL
Reverse: .5*8=4µL
H2O: 10.5*8=84µL
cDNA (or H2O for control): 1µL
cDNA samples were differentially diluted and loaded into wells as follows:
A1: Full
B1: 1:10
C1: 1:100
D1: 1:1000
E1: 1:10000
F1: Control
G1: Control
Results:
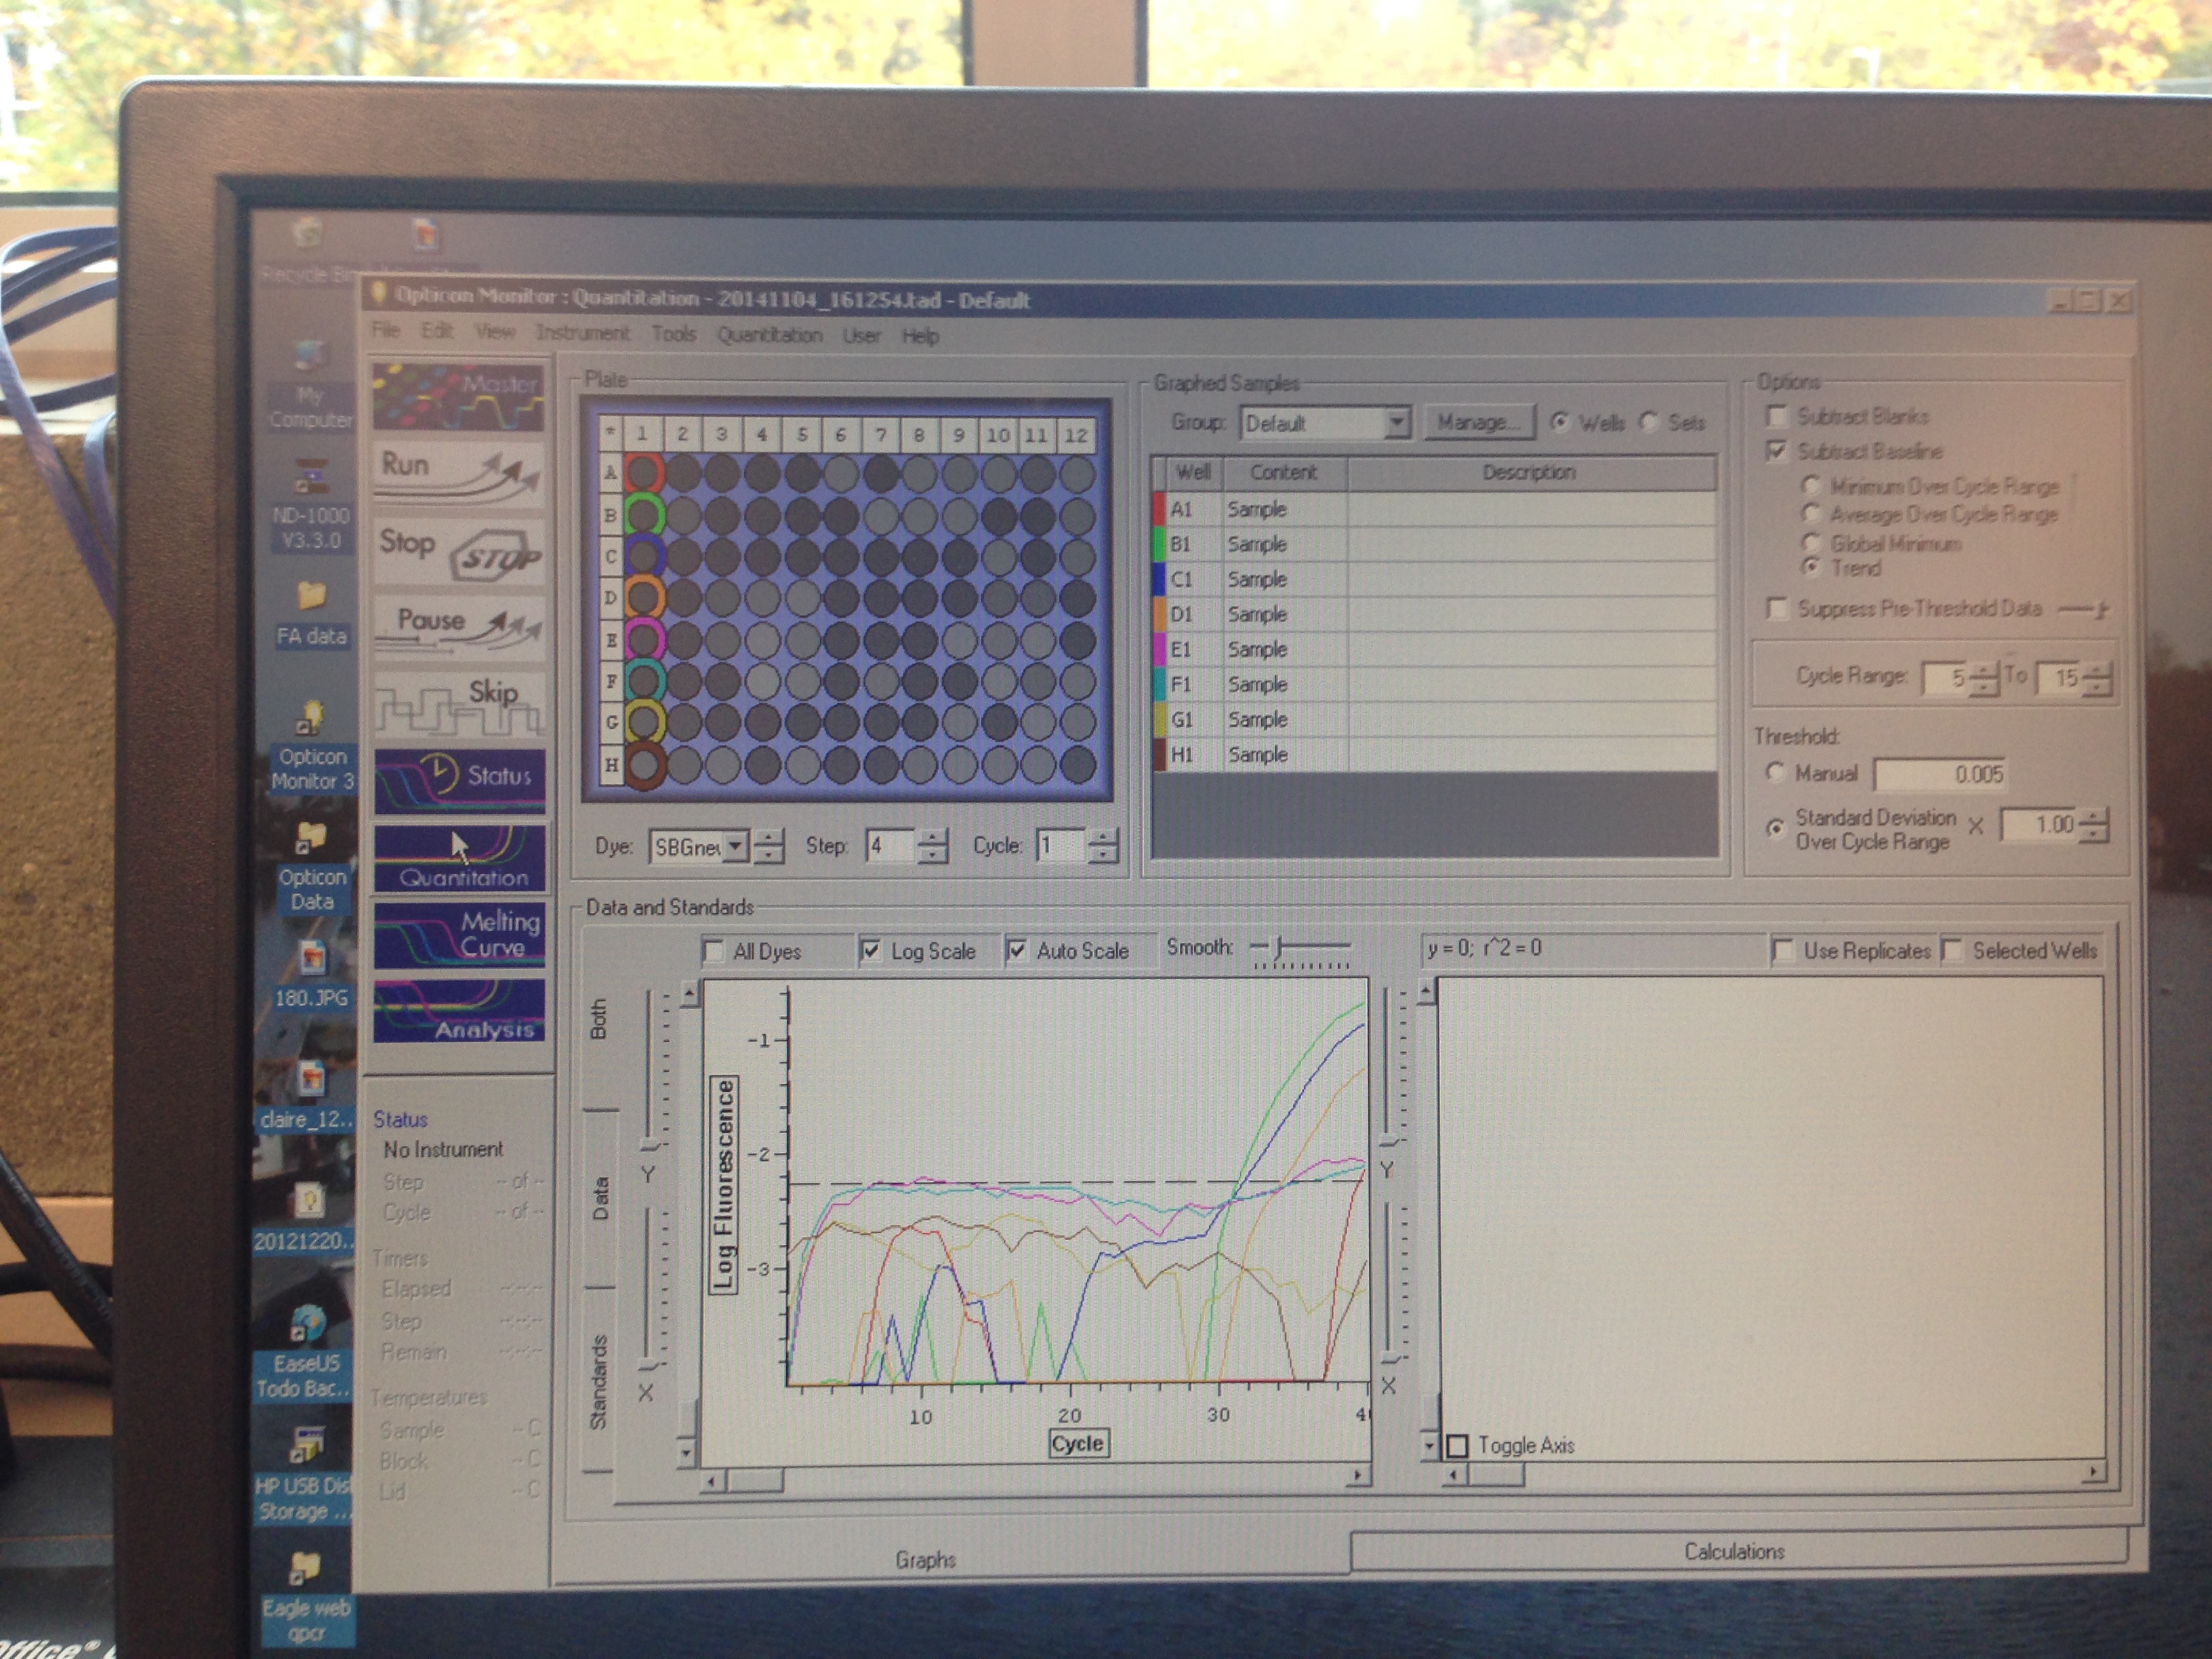
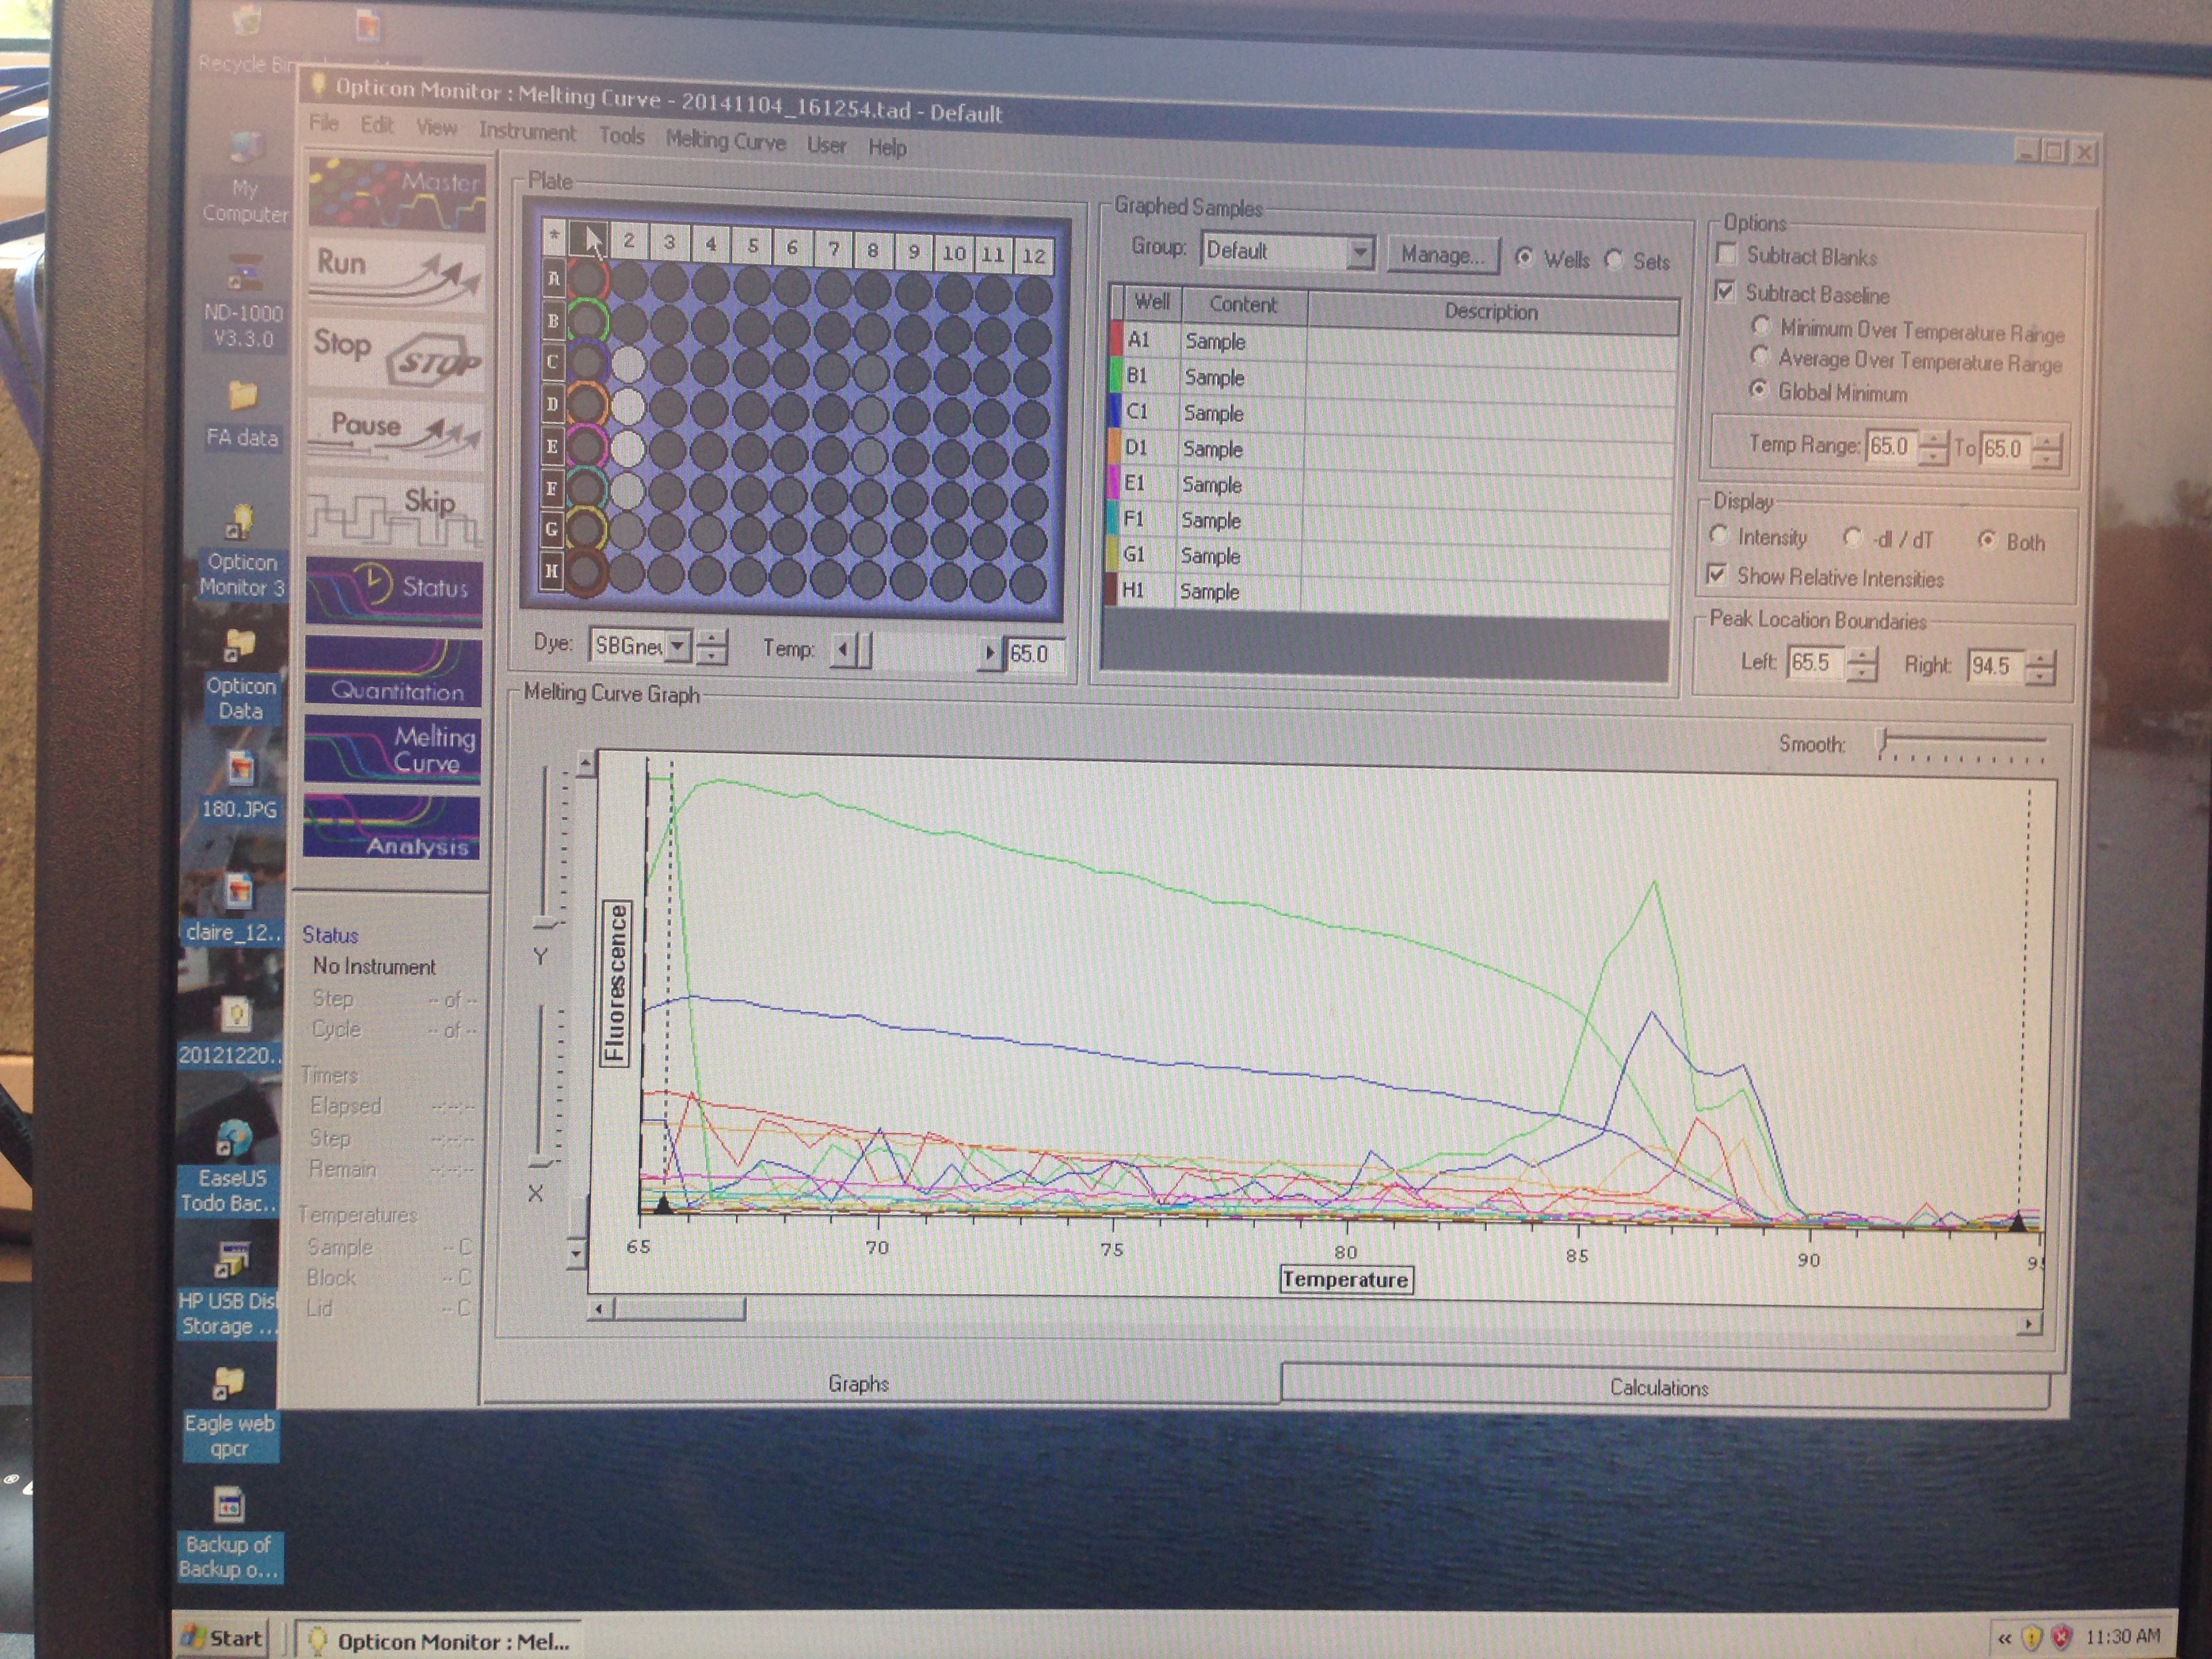
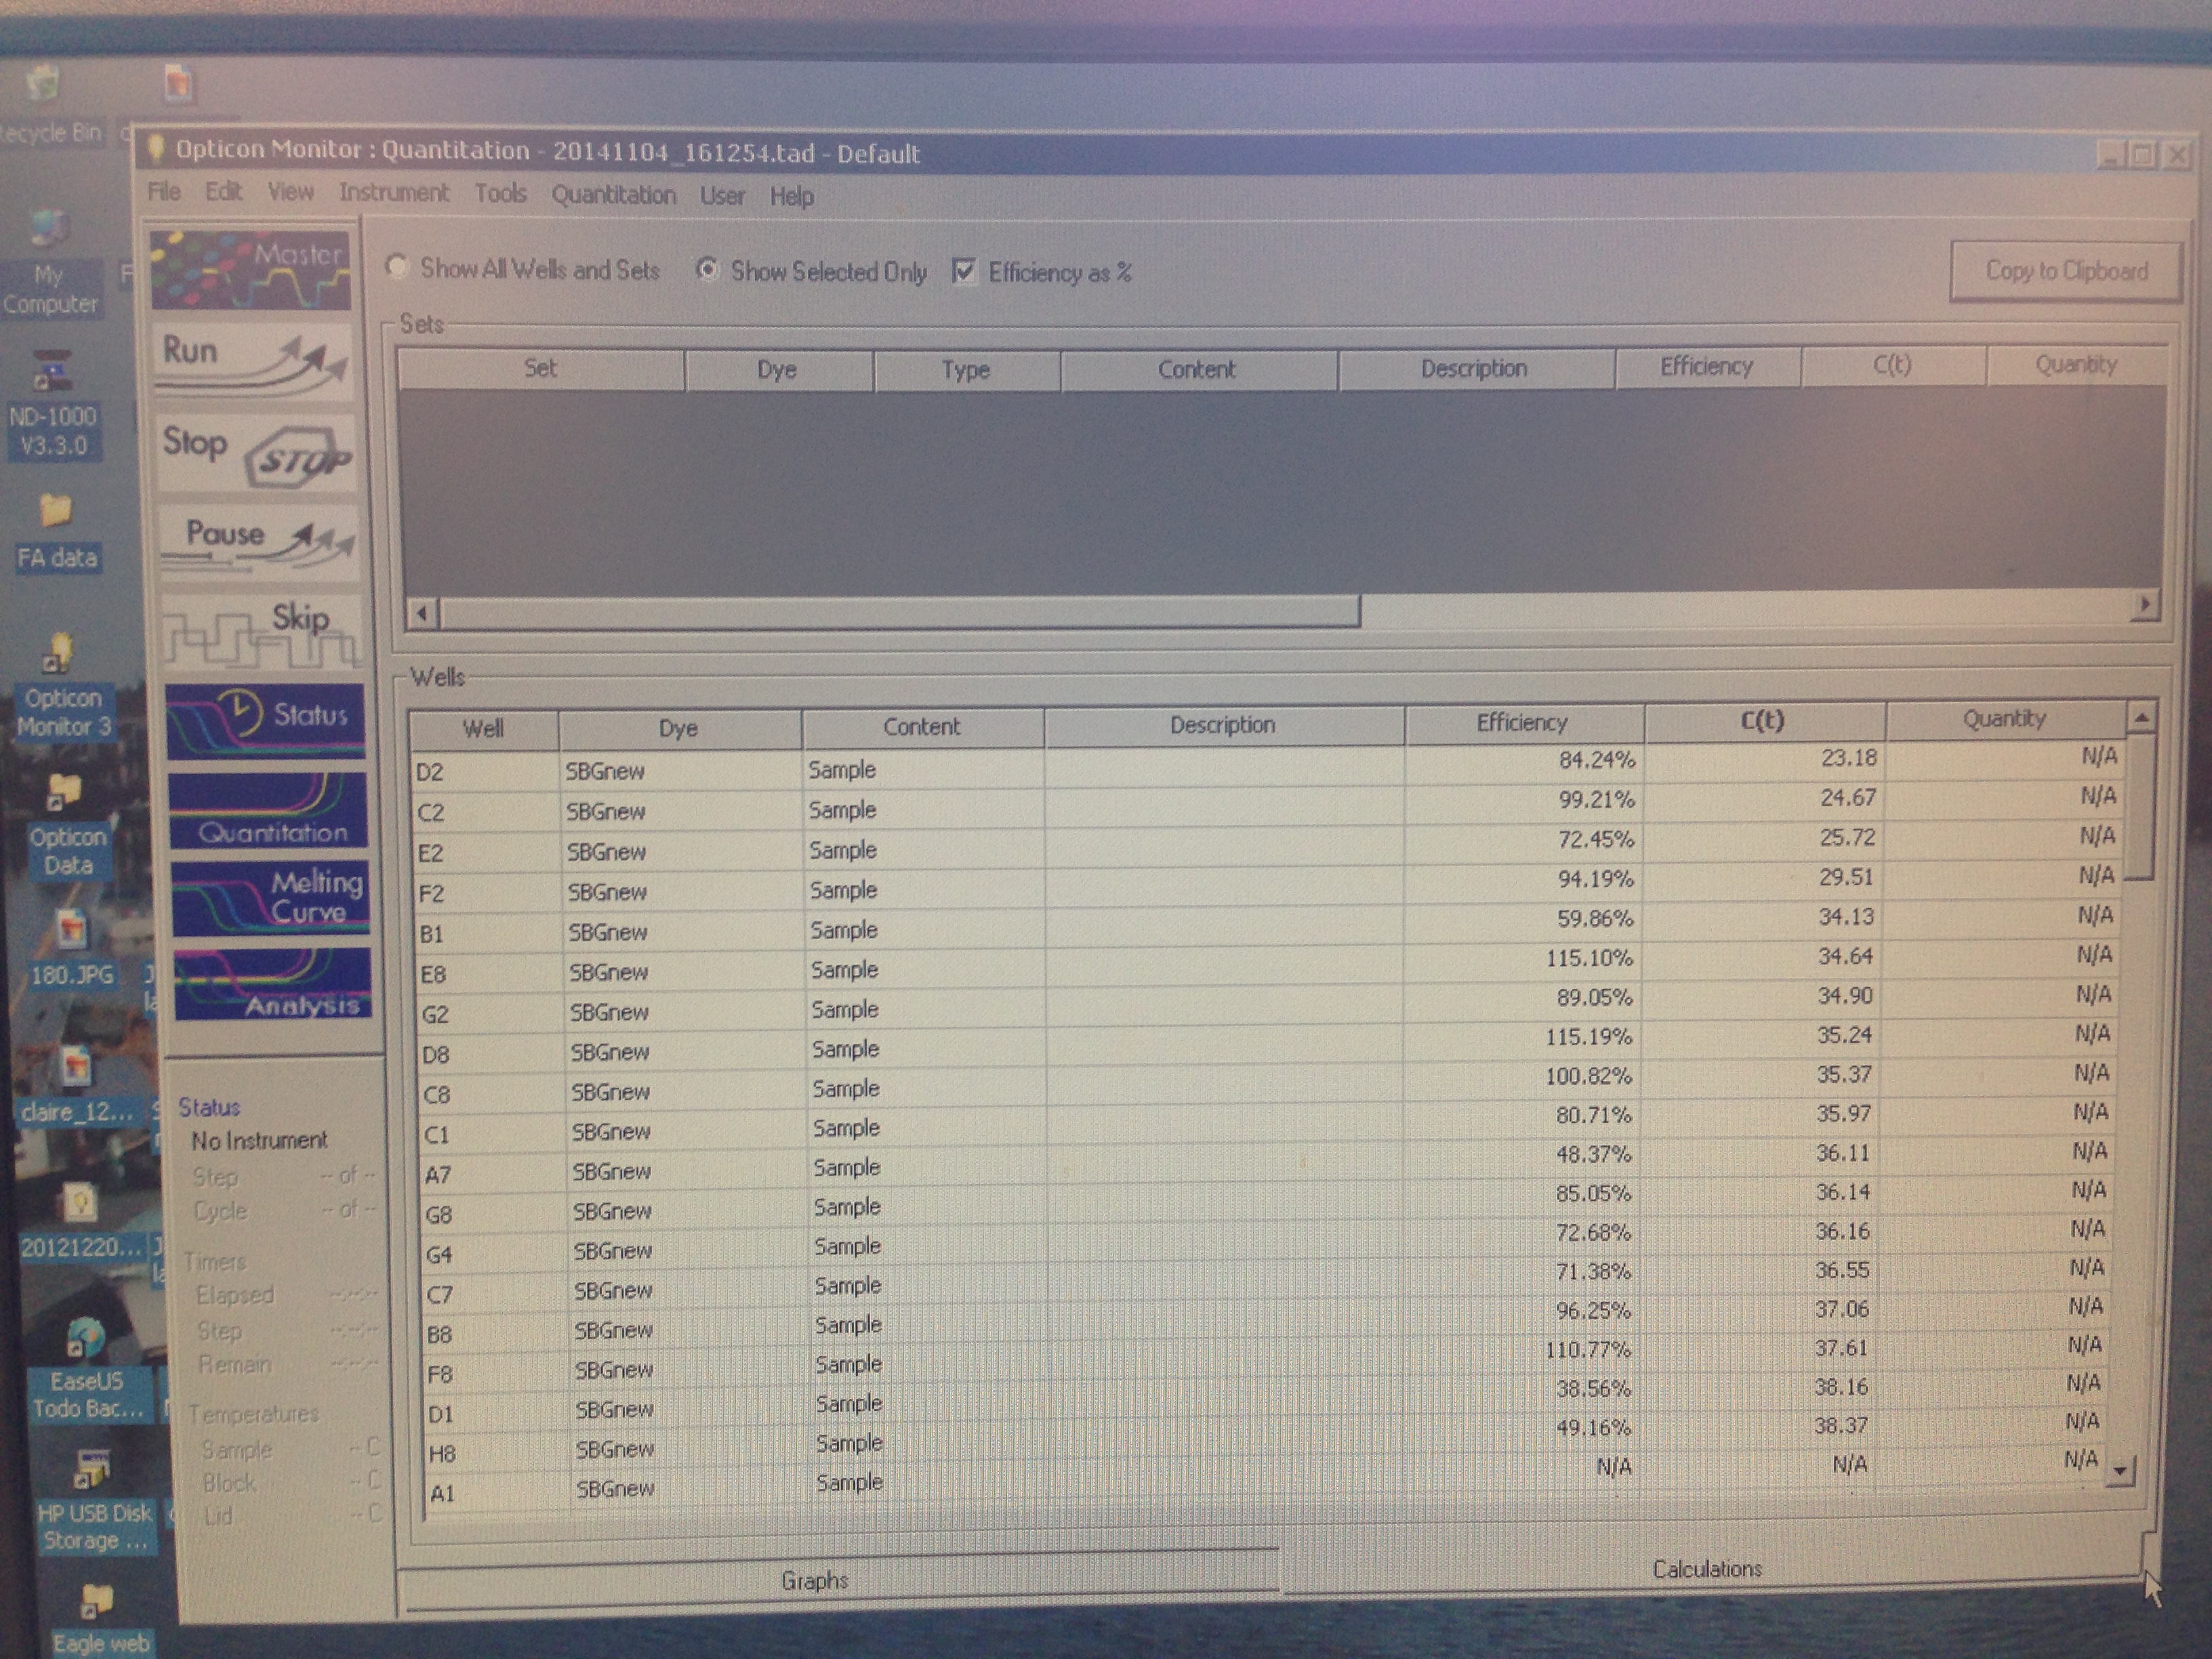
Results indicate that amplification was successful but that there was perhaps some errors in the dilution process.
Conclusions:
These results were not entirely what was expected. The lower dilutions had the general trend that they went above threshold fluorescence later as they got more dilute, however that is not the case seen always (A1 did not amplify). One caveat to this information is that the cDNA may not have been formed in the first place since it only accounts for the transcriptome so this was not a good way to qualify how well our primers worked. Based on the amplification seen, these primers will be used in the research portion of the class to study HIF-1a expression in the stressed Crassostrea.
The purpose of this lab was to test how well our primers worked. This is done in genetic studies all the time to troubleshoot results that are unexpected to make sure that it is not just a bad primer. There was nothing unclear about this lab since it was just a qPCR as performed in Lab 3 and I do not need to request additional information.
LAB 5
10/28
Summary:
The purpose of this lab was to lay groundwork for the upcoming research project as well as to learn how to design primers.
Materials and Methods:
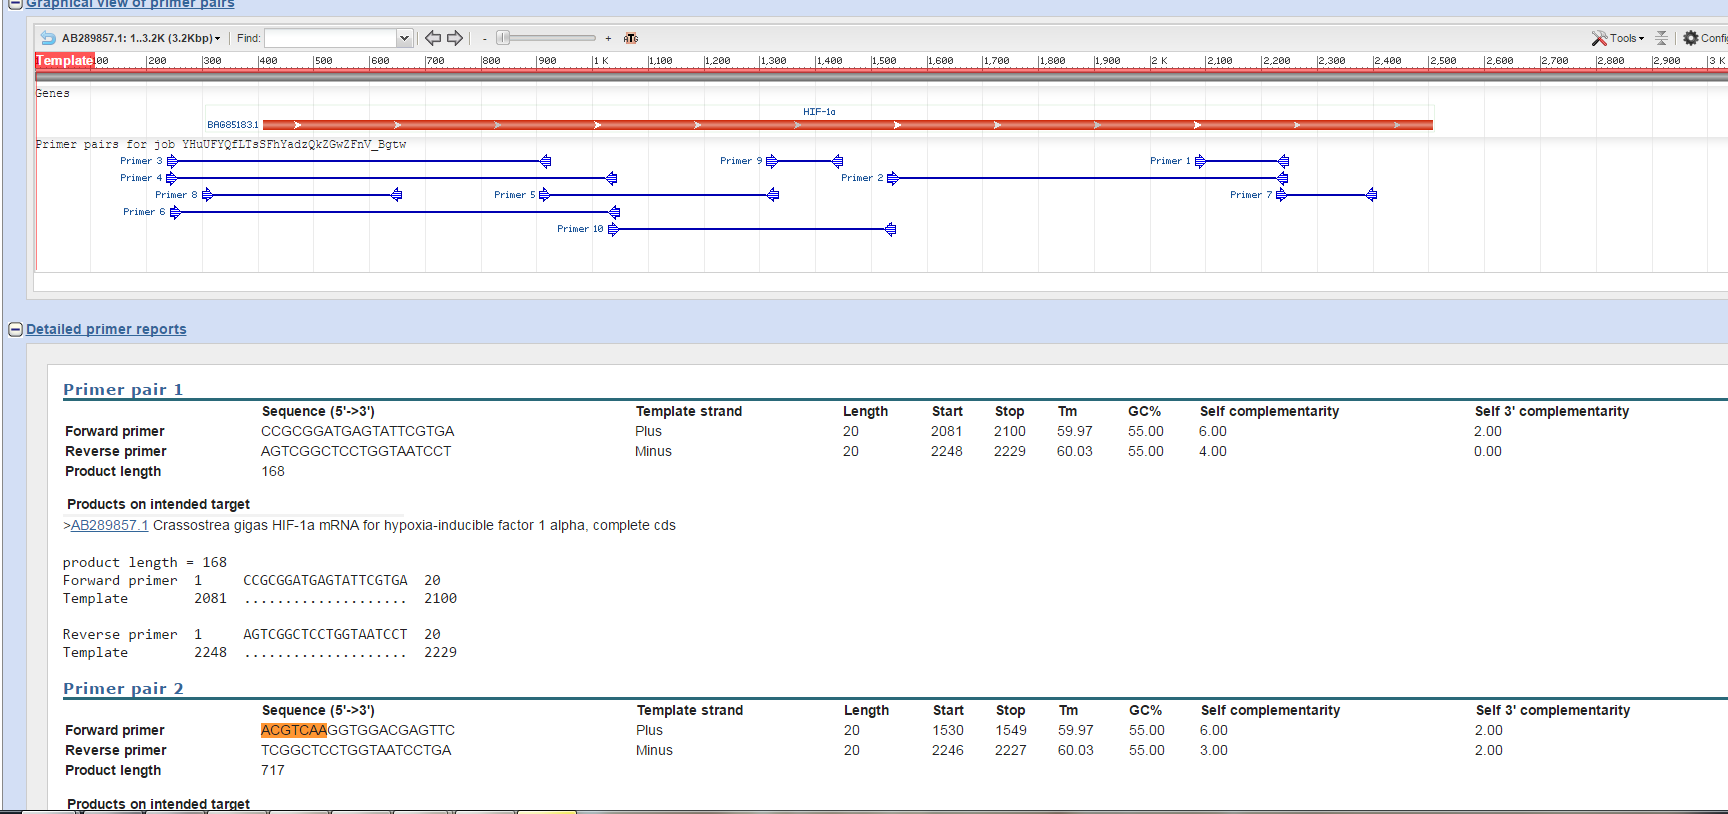
Using the NCBI gene database, mRNA sequences from Crassostrea Gigas were accessed. Primers were designed using the HIF-1a mRNA (gene accession number AB289857.1) and the Primer Blast function using the nr database and comparing against C. Gigas.
Results:
Primers chosen were designated PM_Cg_HIF1a_F and PM_Cg_HIF1a_R and had sequences ACGTCAAGGTGGACGAGTTC and TCGGCTCCTGGTAATCCTGA respectively. Primers should yield a product 717 bp long (primer pair 2 in picture).
Conclusions:
The results were what was expected and the product length was chosen to be a good match for a PCR amplification and gel electrophoresis. Based on these results and the results of others, a research proposal will be made to best use all of the primers.
The purpose of this lab was to familiarize ourselves with the online resources available at NCBI, specifically the Nucleotide search and Primer BLAST functions. These sorts of procedures are used by geneticists, evolutionary biologists, enzymologists, and physiologists to make primers for any number of different purposes. The only part of the lab that was mildly confusing is how exactly the BLAST function works. Given that it may be a very difficult algorithm, it seems like a bit of a black box as of now.
Research Proposal
LAB 4
10/21
Summary:
The purpose of this lab was to perform SDS-Polyacrimide Gel Electrophoresis (SDS/PAGE) on the protein samples extracted from Lab 3 (Performed on 10/14) and run a Western blot in order to test for HSP 70 presence in 2 sets of oyster. Additionally, part of the lab's purpose was to run a PCR reaction with our cDNA from Lab 3 so that it could be visualized using a UV transilluminator.
Materials and Methods:
SDS/PAGE:
15µL of protein stock (from sample NB 29) was added to a screw cap tube along with 15µL of 2x Reducing Sample Buffer. The mixture was flicked to mix and centrifuged for 10s. The sample was then boiled for 5 minutes to denature quaternary and tertiary protein structure. The sample was then centrifuged for 1 min immediately after boiling step. Sample was then loaded into gel well 3 (Ladder was well 1) and the gel was run at 150V for (Deviation) 35 min.
Western Blot:
Membrane and SDS/PAGE Gel were soaked in Tris-Glycine Transfer Buffer for 15 min (Deviation) filter paper was not soaked. The materials were then assembled as follows: anode, filter paper, membrane, gel, filter paper, cathode. The blot was then run at 20V for 30 minutes. (Deviation) Staining was used using Invitrogen WesternBreeze Chromogenic Western Blot Immunodetection Kit at this point and protocol in lab was disregarded. Membrane was placed in 10mL of blocking solution and incubated in rotary shaker at 1 rev/sec (same for all following steps) for 30 minutes and then blocking solution was decanted. Membrane was rinsed with 20mL of H2O on rotary shaker for 5 minutes and then re-rinsed for 5 minutes. Membrane was then incubated with 20mL of Antibody Solution for 1 hour and then solution was decanted out. Membrane was washed for 5 minutes with 20mL of Antibody Wash and decanted out, this was repeated 3 times. Membrane was then incubated in 10mL of Secondary Antibody Solution for 30 minutes and then the solution was decanted out. Membrane was then rinsed with 20mL of Antibody Wash for 5 minutes and decanted off, this was repeated 3 times. Membrane was then rinsed with 20mL of H2O for 2 minutes and decanted, this was repeated 2 times. Membrane was then incubated in 5mL of Chromogenic Substrate until bands would form.
PCR product Gel Electrophoresis:
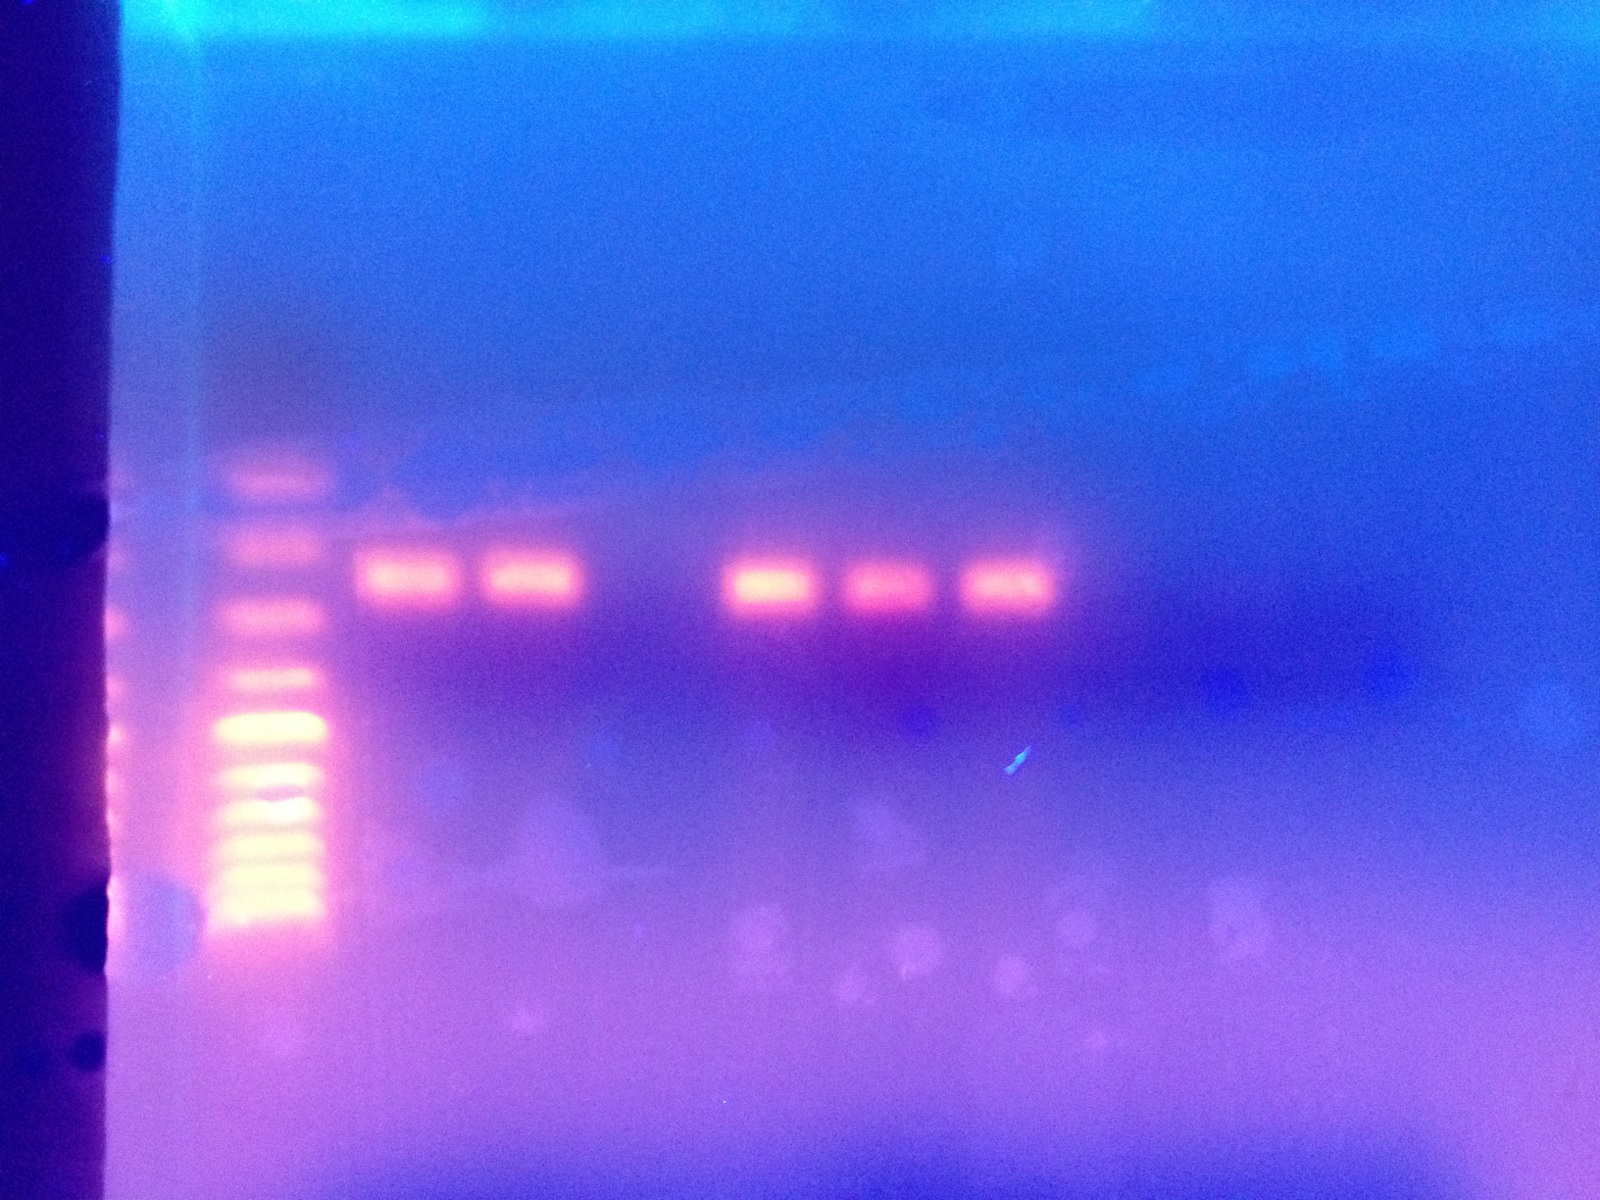
2µL of 10x Loading dye was added to PCR product from lab 3 and then 20µL of sample was loaded into the second well of the agarose gel. 7µL of 100 bp ladder was placed in the 1st well. Gel was run at 100V for 1 hr. Gel was then removed and visualized on the transilluminator.
Results:
The SDS/PAGE gel indicates presence of HSP, however it is hard to discern what is what. (Lane 3 from left)
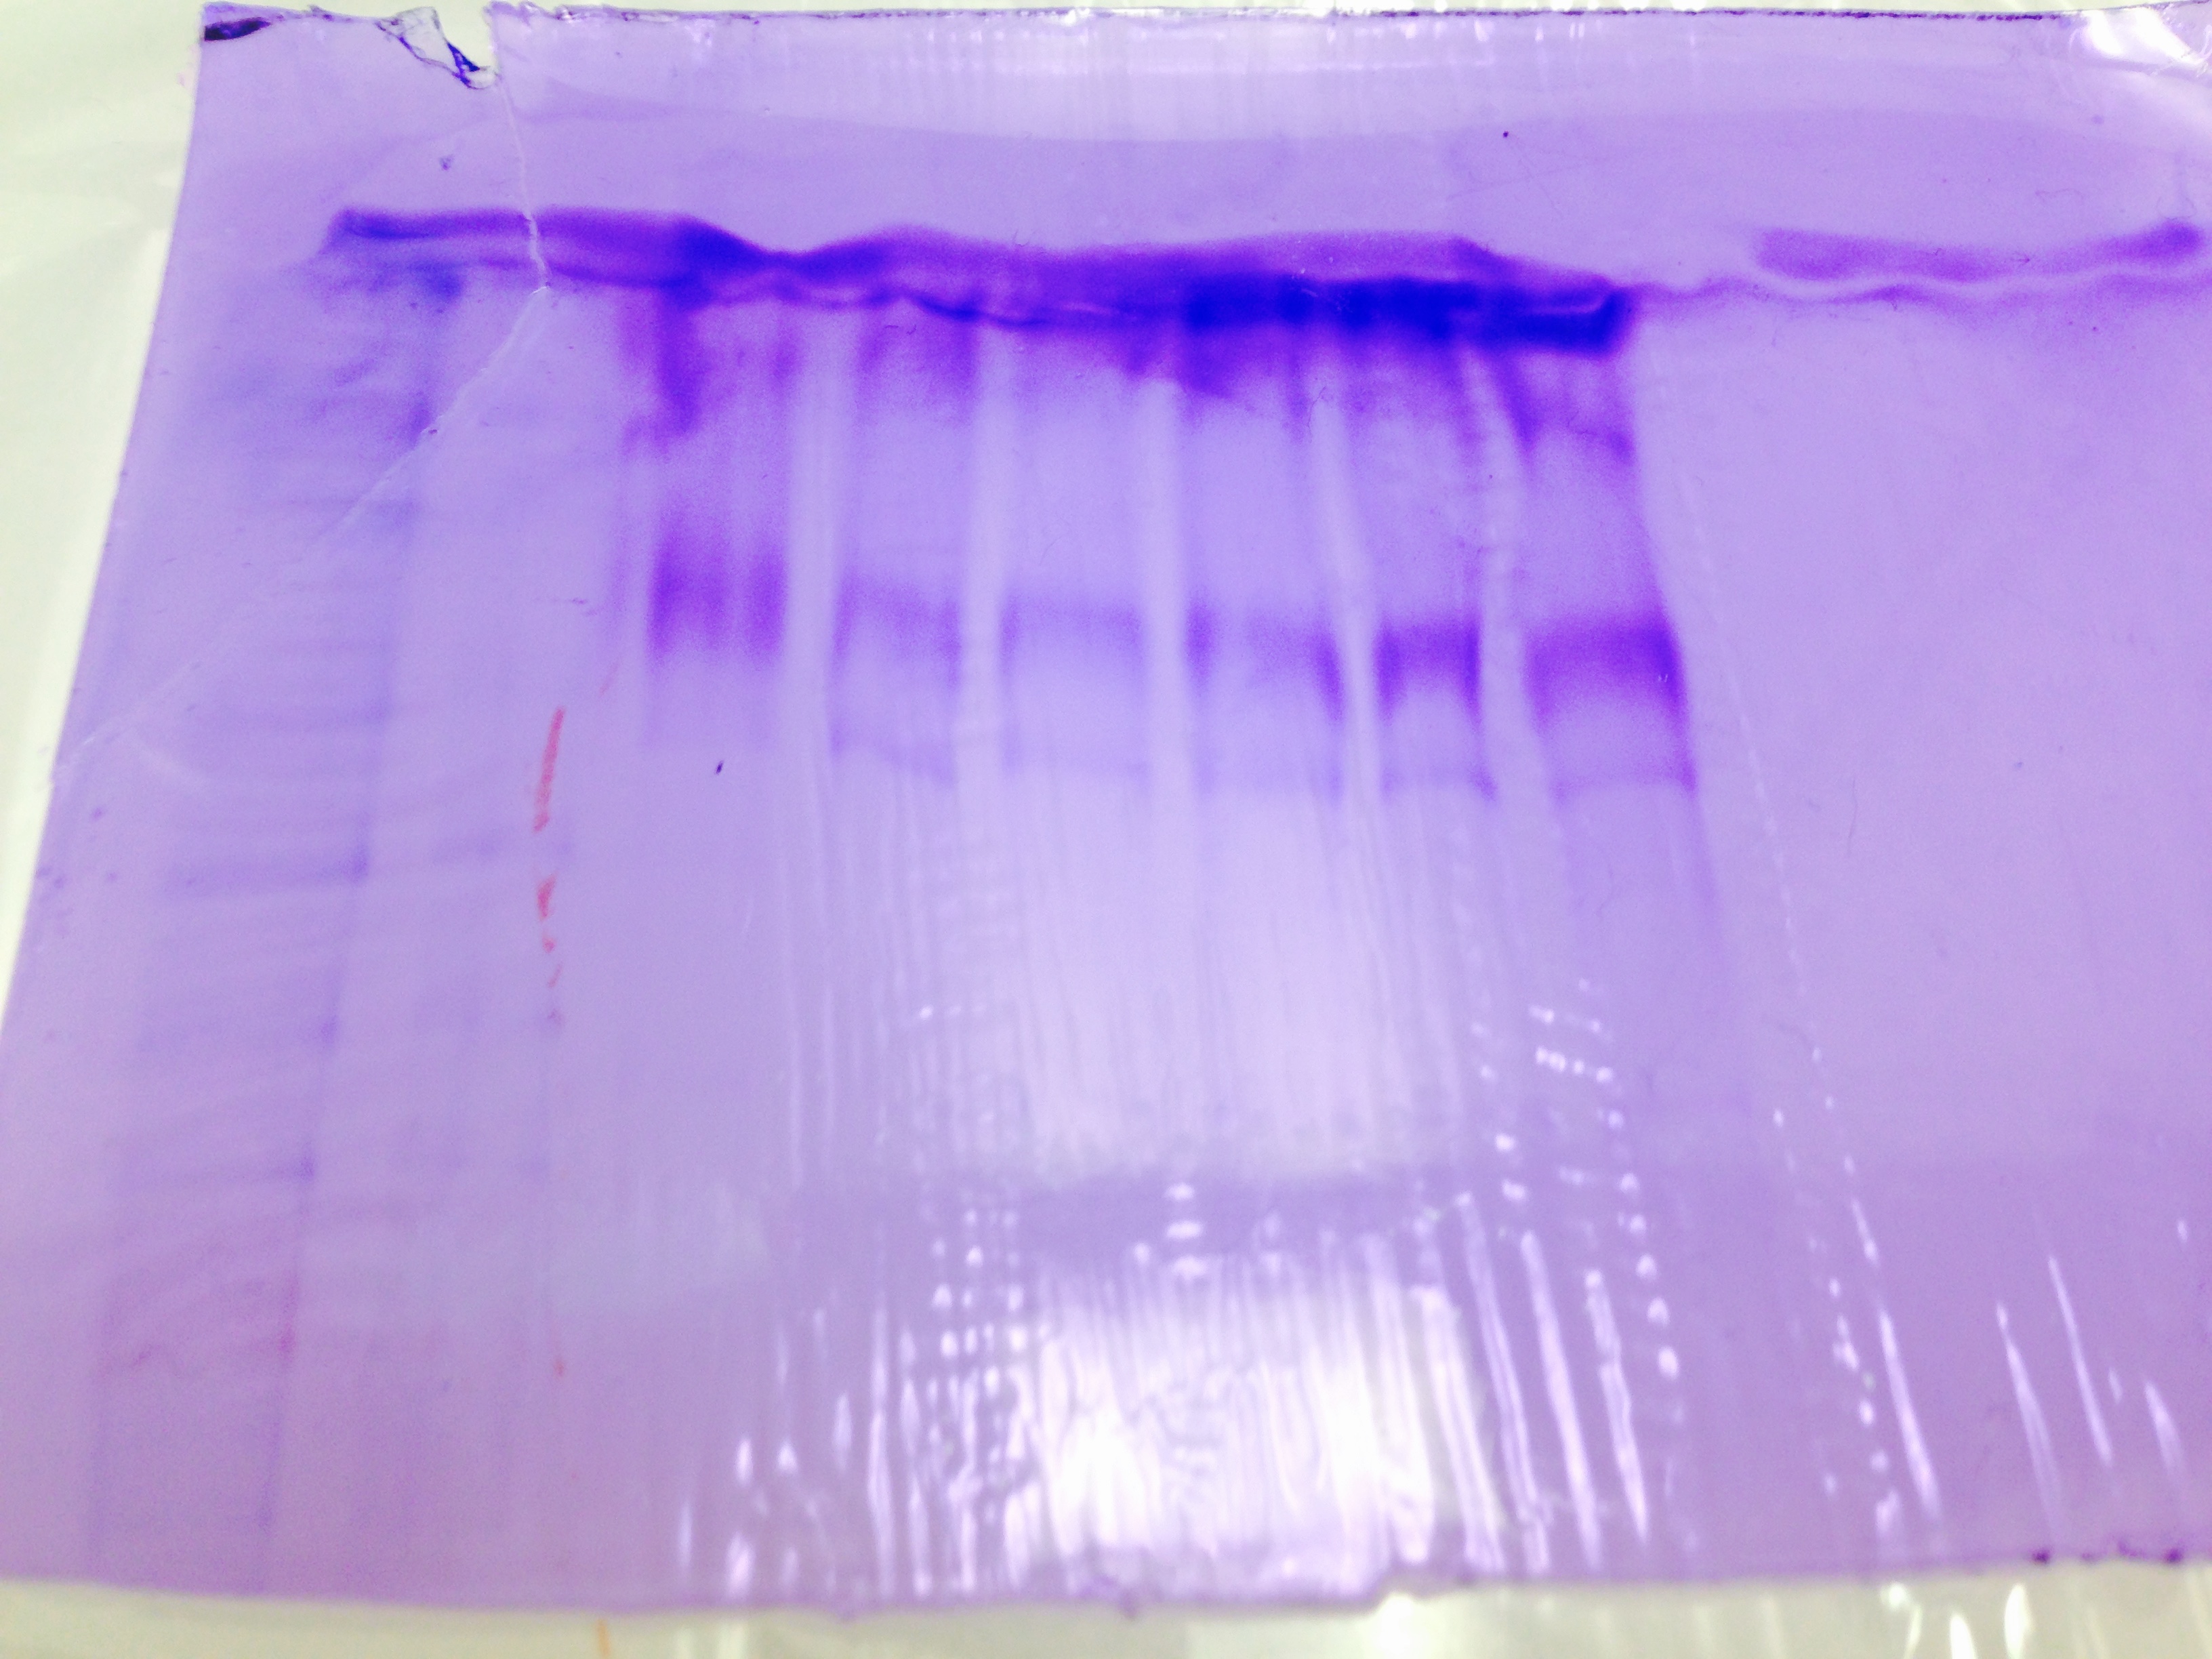
The Western Blot was unsuccessful.
The PCR indicated amplification of a product between 200-300 BP (Lane 2 from left).
Conclusions:
Results are what was expected in PCR Gel and SDS/PAGE Gel, however, the lack of product on the Western blot membrane was unexpected. Based on these results, the experiments started in Lab 1 and Lab 3 are completed and our independent project will begin, however we may wish to avoid doing protein analysis since our Western technique seems to be lacking.
The purpose of this lab was to familiarize ourselves with SDS/PAGE, Western blotting, and gel electrophoresis methods. SDS/PAGE is coupled with Western blotting to perform many types of protein analysis since it can allow protein products to be verified relatively quickly. PCR is coupled with gel electrophoresis to perform both DNA and RNA analysis since RT can be used to convert RNA into DNA. This is valuable in many fields including evolutionary biology.
The rushed pace of the end of the lab made it hard to understand exactly what was being done at each station so it became extremely difficult to keep everything straight in one's head. I would have liked more information on each step to be given during lab. Obviously, this may be unrealistic given our time constraints.
LAB 3:
10/14
Summary:
The purpose of this lab was to perform reverse transcription on the RNA from Lab 1 & 2 (performed on 9/30 and 10/7 respectively) in order to form more stable cDNA and then perform qPCR on the sample as well as to prepare a gel for electrophoresis. Additionally, part of the lab's purpose was to extract protein from a tissue sample
Materials and Methods:
Reverse Transcription:
The sample RNA was recovered and thawed. 5µL of the RNA solution was added to a PCR tube. A master mix (labelled MM1) was made using using .5µL oligo dT and 12.25µL of nanopure H2O per reaction including 2 negative controls. 12.75 of MM1 was added to the RNA in the PCR tube and the sample was incubated at 70C for 5 minutes. A second master mix was made (MM2) using 5µL of M-MLV 5x Reaction Buffer, 1.25µL of dNTPs, .5µL M-MLV RT, and .5µL of nanopure H2O per reaction including 2 negative controls. 7.25µL of MM2 was added to the RNA PCR tube. The sample was then incubated at 42C for 60 minutes and then 70C for 3 minutes (Deviation) sample was not spun down since all the sample was already pooled at the bottom of the PCR tube.
qPCR:
A third master mix was made (MM3) using 12.5µL SsoFast EvaGreen supermix, .5µL of the forward primer (Elongation factor), .5µL of the reverse primer (Elongation factor), and 10.5µL of nanopure H2O per reaction including 2 negative control reactions from the reverse transcription and 2 negative controls for qPCR. 24µL of MM3 was added to well A7 of the PCR plate along with 1µL of cDNA. The sample was then ran in a qPCR machine with the following profile:
95C for 10 minutes
95C for 15s
55C for 15s
72C for 15s and fluorescence measurement taken
Repeat from line 2 39 times
95C for 10s
Melt curve from 65C to 95C in .5C increments for 5s
Gel:
1g of agarose was mixed with (Deviation) 75mL of 1xTAE in a flask and then microwaved for 3 minutes and mixed. Solution was cooled slightly and 12µ of EtBr was added to the solution and mixed. The solution was then poured into a small gel tray and a gel comb was added. Gel was left to cool and then stored.
Protein Extraction:
500µL of CellLytic MT solution was added to 23mg of issue sample NB 29 in a snap cap tube. Sample was then manually grinded with a pestle and then inverted numerous times to homogenize the mixture. The sample was then spun in a refrigerated microfuge for 10 minutes at max speed. The supernatant was then extracted from the tube and placed in a different snap cap tube and labelled "Protein Oyster Gill PM 10/14"
Results:
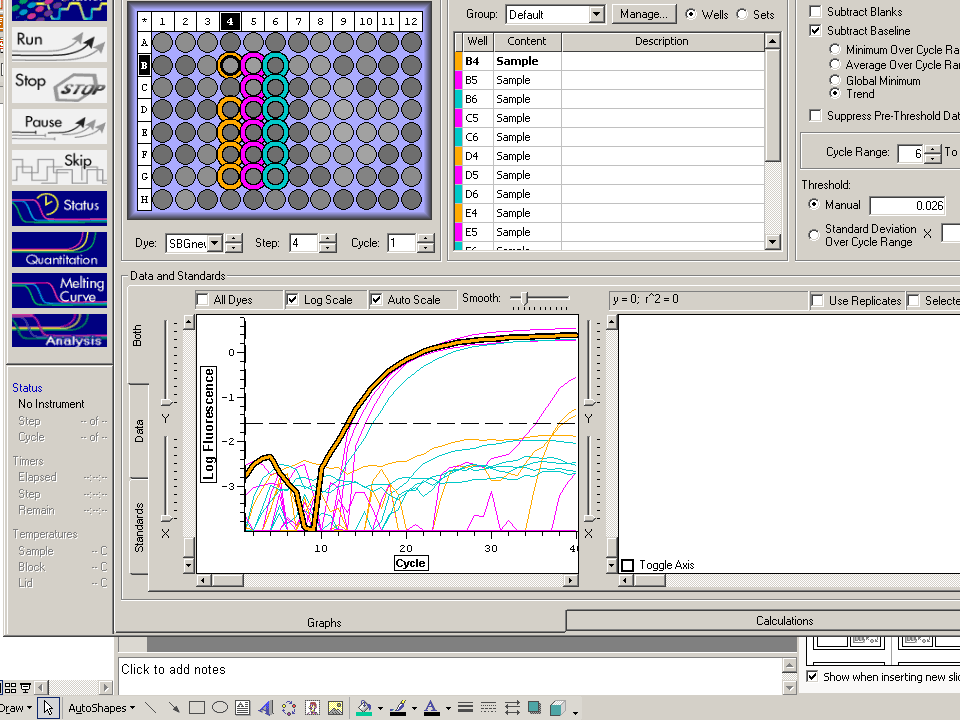
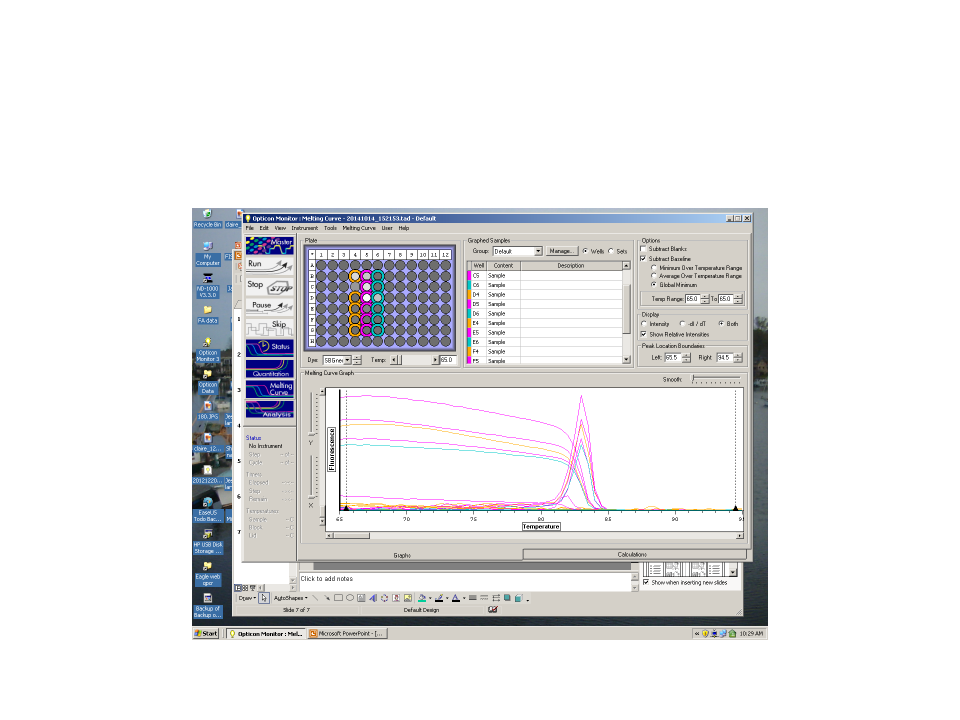
qPCR results indicate DNA product formed with efficiency ratio of 2.16 and threshold amplification reached in cycle 13. Melt curve indicates product melts at 83C which is consistent with other samples.
Conclusions:
The results are what was expected since elongation factor RNA is expected to be present due to its "housekeeping" nature. Based on these results, the amplified cDNA will be run on a gel to be verified for sequence length.
Protein extracted will also be quantified using a Bradford Assay.
The purpose of this lab was to familiarize ourselves with a typical reverse transcription and qPCR process as well as to understand protein extraction. RT and qPCR methods are used to quantify the amplification of DNA using RNA extracted from a sample. Protein extraction is vital in many microbiology fields; it can be used as a first step in isolating a certain protein in order to further study its structure, function etc.
One thing i was unclear about was why we incubated the RNA sample with MM1 since it didn't have RT in it to transcribe. Was this just to get the Sample at a temperature that activated RT when it was added? Was it to allow oligo dT to bind to the sample RNA?
I wish there was more information about the structure of RT and exactly how it finds RNA and converts it to DNA at a molecular and biochemical level.
LAB 2:
10/7
Summary:
The purpose of this lab was to perform the actual RNA extraction from the broken down tissue from Lab 1 performed on 9/30. The RNA was isolated from the solution using RNA extraction protocol and then the resulting RNA concentration was quantified using spectrophotometry and the Beer-Lambert Law.
Materials and Methods:
The tissue sample from Lab 1 was recovered from freezer storage and then (Deviation) thawed at room temperature (RT). After thawing, 200µL of chloroform was added to the sample and then the tube was vortexed for 30s on the maximum setting. The sample and chloroform mixture was then kept at RT for 5 minutes. After incubation, the sample was spun down in a refrigerated microfuge for 15 minutes at maximum speed. The tube was removed and the aqueous phase (top portion) was removed and transferred to another tube (labelled RNA Oyster Gill 10/7 PM) and the remaining interphase and organic phase was disposed. 500µL of isopropanol was added to the RNA, gently mixed by inverting the tube multiple times, and then incubated at RT for 10 minutes. The RNA sample was then spun in the refrigerated microfuge for 8 minutes. A pellet was formed at the bottom of the tube and the supernatant
was removed via pipette. 1mL of 75% ethanol (EtOH) was added to the pellet and the tube was vortexed to dislodge the pellet. The sample was then spun in the refrigerated microfuge at 7500g for 5 minutes. Supernatant was again removed via pipetting. The tube was then spun at max setting in an unrefrigerated microfuge for 15s to pool remaining EtOH and the excess EtOH was removed once again via pipetting. The tube was then left open in a fume hood to dry off any remaining EtOH for 5 minutes and then capped again. The pellet was then resuspended in 100µL of (Deviation) Nanopure H2O. Sample was only incubated at 55C for (Deviation) 1 minute since RNA was already completely resuspended. The RNA sample was then placed on ice and 2µL of the sample was used to perform spectrophotometry with and the remaining sample was stored in -80C refrigeration for future use.
Results:
The spectrophotometer measured an RNA concentration of 380.9ng/µL with a 260/280 ratio of 1.95 and a 260/230 ratio of 2.22.
Conclusions:
The 260/280 ratio indicates that RNA and not DNA was extracted due to its proximity to 2 and not 1.8 The 260/230 ratio indicates little contamination by organic compounds due to it being in the 2.0-2.2 expected range. These results suggest that the RNA extraction was successful and the concentration was indeed 380.9ng/µL. Based on these results, the next step is to use reverse transcriptase to make cDNA in order to perform PCR and measure the expression of a certain RNA sequence.
The purpose of this lab was to familiarize ourselves with standard RNA extraction techniques and protocol as well as to gain experience using the spectrophotometer to measure nucleic acid concentration. These procedures are used very commonly in labs to measure RNA expression in an organism which can be useful for seeing how an organism is reacting to a certain stimulus. These methods can be used to perform physiological, immunological, as well as ecological studies since protein synthesis is such a vital response to stimuli. Although the procedure itself was not unclear, the lab protocol left the question of how these organic solvents perform different roles based on chemical composition. I would like to have more information on the difference between chloroform, isopropanol, and ethanol relating to what exactly they are doing in each step. Eg: Why is isopropanol used for wash in one step but ethanol in the other? Can they be interchanged? Why or why not?
LAB 1:
9/30
Summary:
The purpose of this lab was to break down tissue from a specimen in order to perform experiments using the RNA extracted. A tissue sample was first taken from a sample oyster gill and then placed into a tube and then was treated with TRI Reagent, broken up with a pestle, and then treated again with TRI Reagent.
Materials and Methods:
42 mg of tissue was extracted from a live oyster gill and placed in a sample tube. 500µL of TRI Reagent was then added to the sample and broken up with a pestle and vortex. After the sample was broken up, an additional 500µL was added to the solution, then vortexed and stored for later use (labelled Pat Oyster Gill).
Results:
The tissue ended up staying in a semi solid state throughout the experiment and did not break up completely.
Conclusions:
These results are not what was expected, in that, I assumed that the combination of TRI Reagent, pestle, and vortex would be enough to fully break down the tissue, but it did not. Hopefully by next lab, the sample will be fully broken down, if not, the experiment will continue using only the RNA extracted from the tissue that was broken down and the undissolved tissue will be discarded. It could be that this occurred from getting a particularly fibrous part of the gill which does not react with the TRI Reagent and resists being mechanically broken down.
The purpose of this lab section was to familiarize ourselves with dealing with lab conditions as well as to learn the basics of RNA extraction. By using the TRI Reagent, we are able to break up cell membranes and just leave RNA in solution. This sort of experiment can be used any time a researcher wants to do RNA transcription or protein translation rate analysis. One thing I am unclear about is that from what I have learned up until this point, RNA is single-stranded (for the most part) and therefore very unstable which causes it to degrade easily. Does the TRI Reagent stabilize RNA and keep it in solution for an entire week before we touch our samples again or are we just hoping it resists degradation by then? I am also unclear with how the TRI Reagent discriminates between membrane/organelle tissue and not RNA at a molecular level. It would help to have a diagram of all the chemicals present and what they do on the website, even if it is not required to know in order to perform the lab itself. I believe that this would help students understand exactly what is going on (and why they are doing what they are doing) in the lab rather than just hoping that they are doing everything correctly.