-Did scatter plots to test for correlation between species richness and expression of each gene: no correlation (R^2 values<0.1)
-Did t-tests to test for significant differences within treatment groups: no differences between non-mechanically and mechanically stressed within the CO2 treatment groups
5/7/2010
To do (Next week):
-Correlation between microbial species richness and gene expression (scatter plots): need to find out why labels are different for microbial samples and gene samples
-More stats: test for significance within treatments (i.e. within high CO2, difference between stressed and non-stressed?)
-Finish poster by Wed at latest, plan to print Monday before symposium
-Read literature in prep for discussion section: Effects of CO2 on invert physiology (what experiments have been done?), function of 3 genes in oysters (then can speculate why the results turned out the way they did)
*Can mention trends in discussion as well, non-significant results don't need to be included in results section
4/29/2010
-Completed methods section
To do: calculate rpm for salad spinner X
include threshold values for genes (note that I set them manually in text) X
include volumes (garbage cans=40 gallons=181.8 L) X
quantity of algae fed to oysters (cells/mL x 5 mL/tank every other day) X
-Next week: results section
Plan: divide into 2 sections (effect of CO2, effect of mechanical stress)
Start on discussion, need to go through more recent papers about acidification (should be lots of them)
4/1/2010
Elongation factor qPCR looks normal. All samples showed amplification, and replicates have very similar Ct values. The melt curve has a much cleaner peak than the 18s primers. These EF results will be used as the normalizing gene.
qEF1 plate #2
qEF1 plate #2 melt curve
3/31/2010
Results of qPCR from 3/30:
qEF1 results
qEF1 melt curve
Conclusions: The strange patterns from the first elongation factor qPCR were probably a result of pipetting error (I used the multi-channel pipettor). All samples in this subset amplified, and melt curve analysis showed that there was a single product in each. Since these results look good, I will do a full plate with EF1 primers. To minimize pipetting error, I will not use the multi-channel.
EF1 qPCR #2: Full plate (all samples included)
Plate layout
3/30/2010
Ran sub-set of cDNA samples with elongation factor primers. This will hopefully determine if the problems with the last run were due to pipeting error. See below for explanation of samples used.
Plate layout and master mix recipe
3/18/10
Elongation factor qPCR results, 2 problems:
Several samples where one replicate did not amplify
CS 2
CS 4
AS 6
AS 7
Several samples that had 2 very different melt temps (approximately a 5-7 degree difference):
CNS 6
CNS 8
CNS+4
CS 1
CS+1
AS 3
AS 5
ANS 2
ANS 4
ANS+3
Will re-run a subset of samples, including all the samples that showed zero amplification in one replicate, one sample that had the largest melt temp difference between replicates (ANS 4, 7 degree difference), and a positive control (both replicates at same melt temp, ANS 8). Plate layout done, in binder, will do qPCR later (week of 3/29).
3/15/10
Re-measured concentrations of 4 RNA samples, 3 that showed low 18s expression levels and 1 that was much higher.
| 1/22/10 |
3/15/10 |
18s Expression Value |
|
| CS3 |
397.97 |
425.95 |
7.61e-8 |
| CS 6 |
201.57 |
210.30 |
1.43e-6 |
| CNS 3 |
125.79 |
127.96 |
2.66e-8 |
| CNS 6 |
209.47 |
213.91 |
1.35e-8 |
qPCR for C. gigas elongation factor (normalizing gene):
Plate layout and master mix
3/3/10
Graphs of fold increase in expression level over minimum for 3 stress response genes, for both low CO2 (ambient air) and high CO2 oysters.
Low CO2

High CO2

Expression patterns still look different than results from class. This seems to be a result of normalization to 18s. Considering trying a second normalizing gene. The trend fits the hypothesis that oysters exposed to high CO2 levels are less able to implement a strong response to a secondary stressor, however, there is quite a bit of error (particularly form MT low CO2 and HSP 70 high CO2).The significance of these trends will be tested using an ANOVA.
2/24/10
Preliminary graphs of expression values to compare to graphs from class (similar trends?) Found some pretty significant discrepancies between class data and new data (particularly with MT). Checked to see if the difference could be due to normalization gene, may have to use a different gene.
2 problems: didn't set threshold to above negative controls/low amp samples, need to use average efficiency of GENE in miner equation
Set threshold to 0.083
2/9-2/19/10
Data analysis for 3 stress response genes. Did not need to run extra replicates (data used are duplicates originally done in class).
Code for sorting treatments:
0=control (air and/or mechanically stressed)
1=experimental (CO2 and/or mechanically stressed)
-Took average of Ct values and average of efficiencies
-Expression value (Ro)= 1/(1+Avg Eff)^Ct
-Stress gene Ro/18S Ro (normalization)
-Determined minimum value (Ro/18S Ro)
-Calculated fold increase over minimum (normalized expression value/minimum expression value)
2/3/10
-Ran duplicate 18S plate
-Same master mix as 1/29
-+4 negative controls
-cDNA 55 melt 2 reads
Lots of samples didn't amplify, not the same samples as the first 18S run:
-Both replicates did not amplify above background: CNS 2, CS 1, CS+1 (CNS 2 didn't amplify in other plate either)
-One replicate did not amplify above background: AS 7 (F8), ANS 2 (D9)
-Very low amplification, but above negative controls: CS 2 (F3) and AS 5 (D7)
Must have been significant pipetting error, will repeat 18S one more time to check, then maybe use a different normalizing gene.
18S plate layout
18S results
18S melt curve
2/2/10
-Organized old data: plate layouts from 3 genes (from class) scanned, links now in notebook entries
-Exported data for 3 genes and 18S qPCR from 1/29, all excel sheets are in dropbox
-Will condense exported data into one workbook
-Wed: check 18S results (RNA concentrations...), then run duplicate plates for HSP, GPx, MT
Notes about data exported today (from first set of qPCR runs):
GPx- I manually adjusted the threshold to around 0.8 (above water level and samples that didn't amplify), need to throw out any samples with Ct values greater than 34
MT: Set threshold to 0.7, throw out samples with Ct greater than 36
HSP 70: Set threshold to 0.8
Wait to see results of duplicate plate, then set Ct to value that works for both
1/29/10
18S ribosomal (normalizing gene)
C. gigas 18S primers
Master Mix (x100)
2x Immunomix: 12.5uL x 100=1.25 mL
Syto-13 Dye: 1.0uL x 100= 100 uL
Upstream Primer: 0.5uL x 100= 50 uL
Downstream Primer: 0.5uL x 100= 50 uL
Ultra Pure Water: 9.5uL x 100= 950 uL
-24 uL master mix
-1.0 uL cDNA (duplicates)
-Opticon (SYBR cDNA 55 melt 2 reads)
Note: forgot to run negative controls, G11/12 and H11/12 are empty
Plate layout
Results: CNS 2 did not amplify. This is not one of samples from earlier (class) that didn't amplify, must be mistake in RT rxn? There is considerable variation in the rest of the samples. Could be due to primers, or normalization of RNA concentration was not accurate. Should discuss this before I use cDNA again (Checked, looks okay).
18S qPCR results
18S melt curve
1/27/10
cDNA
1. Stock primers diluted 1:5 with PCR water
2. Added DNased RNA and PCR water to wells (96 well plate): 0.138 ug of RNA per reaction, total volume of 17.75 uL
3. Added 0.343 uL diluted primers to each well
4. Incubate at 70C for 5 minutes, put on ice (RNA denaturation)
Master Mix (x 50 total reactions)
5 uL MMLV buffer
1.25 uL dNTPs
0.069 uL RT (equals 0.5 uL/ug RNA x 0.138 ug RNA)
5. 6.75 uL of master mix to each well, mixed
6. Incubated in Opticon at 42C for 1 hour, 95C for 3 min (RT rxn)
Left in Opticon overnight (4C).
Plate in 4C (labeled 1/29/10 RT C. gigas cDNA)
RT plate layout
1/22/10
Quantified new DNased samples:
Lowest concentration sample is ANS 5: 7.75 ng/uL
Will maximize volume of this sample to determine what concentration remaining samples will be standardized to:
17.75 uL x 7.75 ng/uL = 137.56 ng
Determine the volume of RNA required to get all samples to 137.56 ng, subtract those volumes from 17.75 to get volume of water for each reaction.
New concentrations of ANS 3, ANS 5, ANS 8, and ANS+2 (added to Excel sheet, below)
Nanodrop results for new DNased samples
Excel worksheet: RT reaction volumes`(updated with new concentrations)
Will have .138 ug RNA per reaction, protocol calls for 0.5 uL stock primers per 1 ug RNA:
0.138 ug RNA x 0.5 uL/ug = 0.0685 uL stock primers (too small to pipet)
Primers diluted 1:5, multiply primer volume by 5:
0.0685 uL x 5 (dilution factor) = 0.3425 uL per reaction
1/20/10
DNased RNA: Samples with low RNA concentration, I had to use a lot of RNA for the cDNA reactions.
ANS 3
ANS 5
ANS 8
ANS+1
ANS+2
Rigorous DNase treatment:
2.5 uL DNase buffer
1.0 uL TURBO DNase
20.5 uL RNA
Incubated at 37C in thermocycler for 30 min.
Additional 1 uL TURBO DNase added to each tube.
Incubated at 37C for 30 min.
Added 2.5 uL inactivation reagent, mixed
Incubated at RT for 2 min.
Spin at 10,000xg for 1.5 min
Supernatant removed and put in new 0.5 uL tube, stored at -80C (box: DNased RNA Gigas gill).
12/4/2009
Week 6: qPCR
Glutathione peroxidase plate layout
Results and conclusions from glutathione peroxidase qPCR
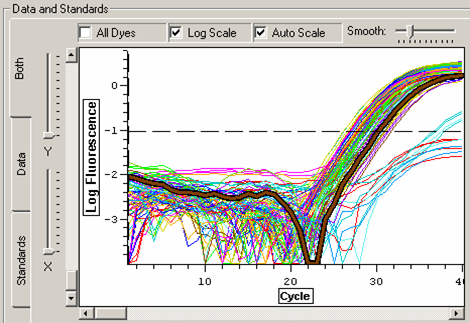
The threshold was again set to above the level of the water samples and the lowest amplified samples. For this run, all additional samples that did not amplify before cycle 36 will be disregarded for analysis. These include:
CS+3
ANS+2
CS+1
qPCR failed to amplify a product for all 3 genes in the CS+3 and CS+1 samples. I used the CS+3 sample to test my 18S primers, and a product was amplified but at a low level. This indicates that there was cDNA in the reaction, but since there was more amplification of the 18S product than any of the stress response genes, I predict that CS+1 and CS+3 were probably just not expressing those three genes (rather than the possibility of a technical error).
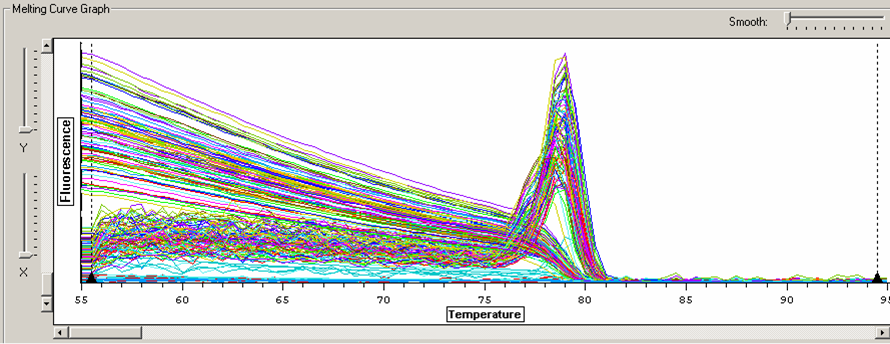
Melt curve for glutathione peroxidase qPCR.
12/3/2009
Week 6: qPCR
MT plate layout
Results and conclusions from metallothionein IV qPCR
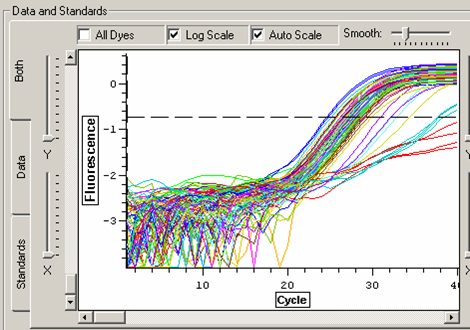
Threshold was set to above the level of the water samples. This still includes 4 cDNA samples (2 individuals) that did not appear to amplify:
CS+3
CS+1
Again, these will not be included for analysis. These are two of the same individuals that did not result in an amplified product with HSP 70 primers.
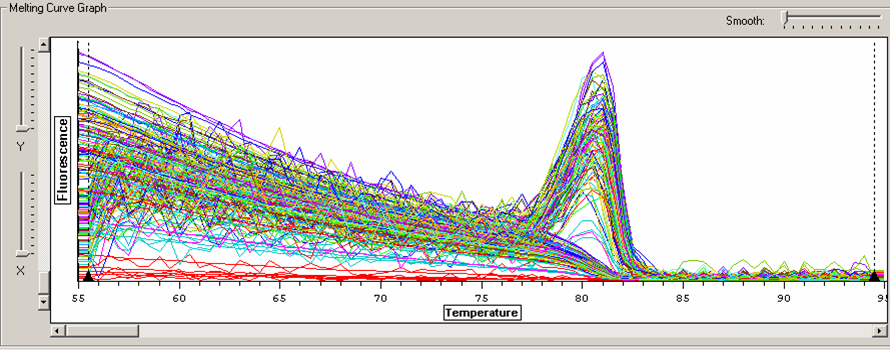
Melt curve for metallothionein IV plate.
12/2/2009
Week 6: qPCR
HSP 70 plate layout
Results and conclusions from heat shock protein 70 qPCR
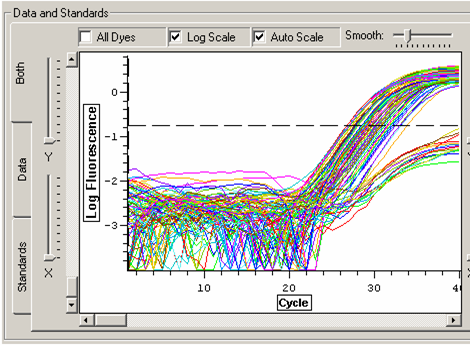
Threshold was set to above the water samples and samples that were not amplified. Out of 45 samples (individuals), 5 did not amplify. These will be disregarded for analysis. C(t) values and efficiencies were recorded.
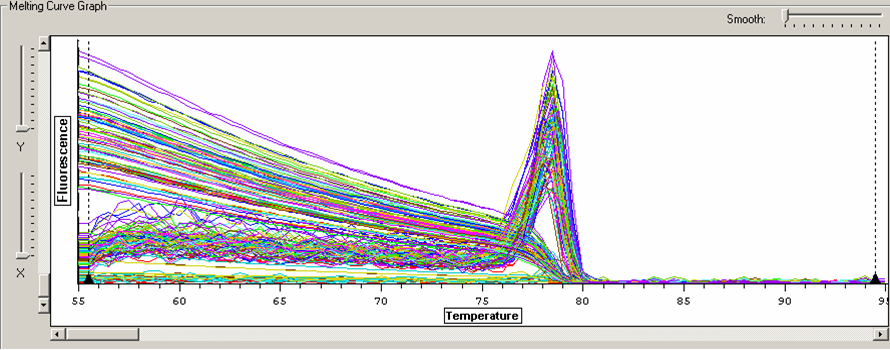
Melt curve for HSP 70 product.
Samples with no amplification:
ANS 3
ANS 5
CS+1
CS+3
ANS+2
Both duplicates for these samples had no amplified product (above the level of the negative controls). This could be due to an error in the protocol for a previous step (RNA isolation, reverse transcription, etc), or there happened to be no expression of the HSP 70 gene in these individuals. These samples will be thrown out during analysis for now.
12/1/2009
Week 6: qPCR
Results and conclusions for primer test done on 11/30/2009
All four primer sets look good. Negative controls were negative, and sample fluorescence was well above the threshold. Melt curves verified that one product was amplified by each primer set. Duplicates were close to each other, and a substantial variation was visible between control and experimental samples (In the case of HSP 70, for example, around a 4 C(t) difference). The rest of the samples will be run to check for differences of this nature. The most variation was seen for the 18S primers. The control and experimental samples should look the same for this gene, but there is variation between the duplicates as well. I conclude from this test that the 3 primer sets I designed work well, and I will use these stocks to run the rest of my samples. Also, I have verified that I do not have genomic carryover (DNase treatment was successful). It appears that both my CNS+3 and CNS+4 samples contain cDNA, I conclude that I must not have made a mistake like previously thought.
Figure 1. Melt curve for Heat Shock 70 primers and 2 representative control and experimental samples (ANS=air, CNS=carbon dioxide)
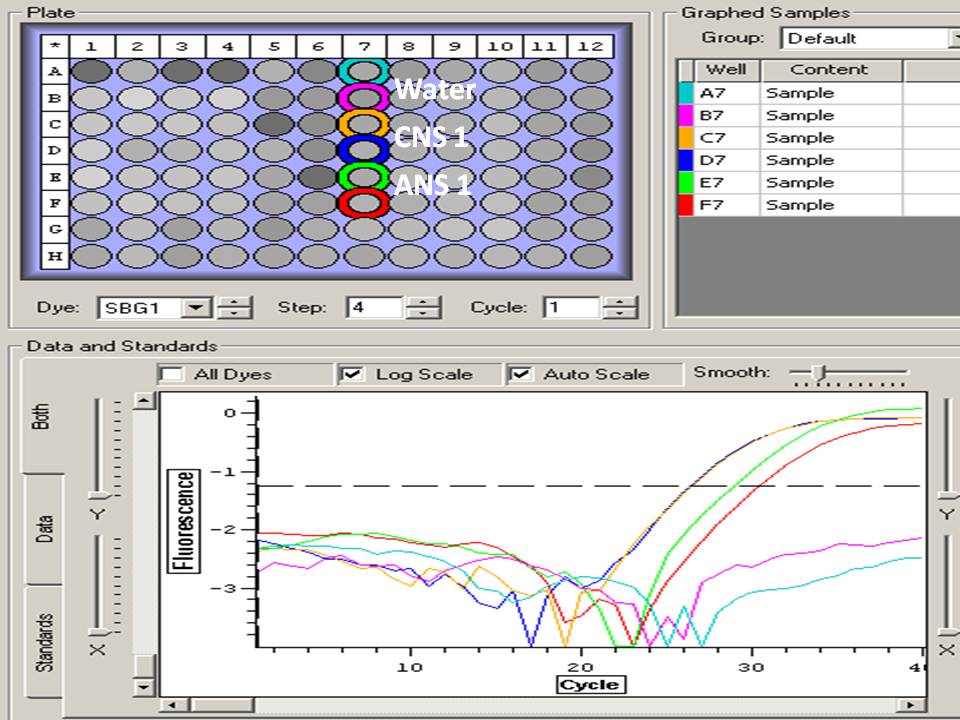
Figure 2. Melt curve for glutathione peroxidase primers.
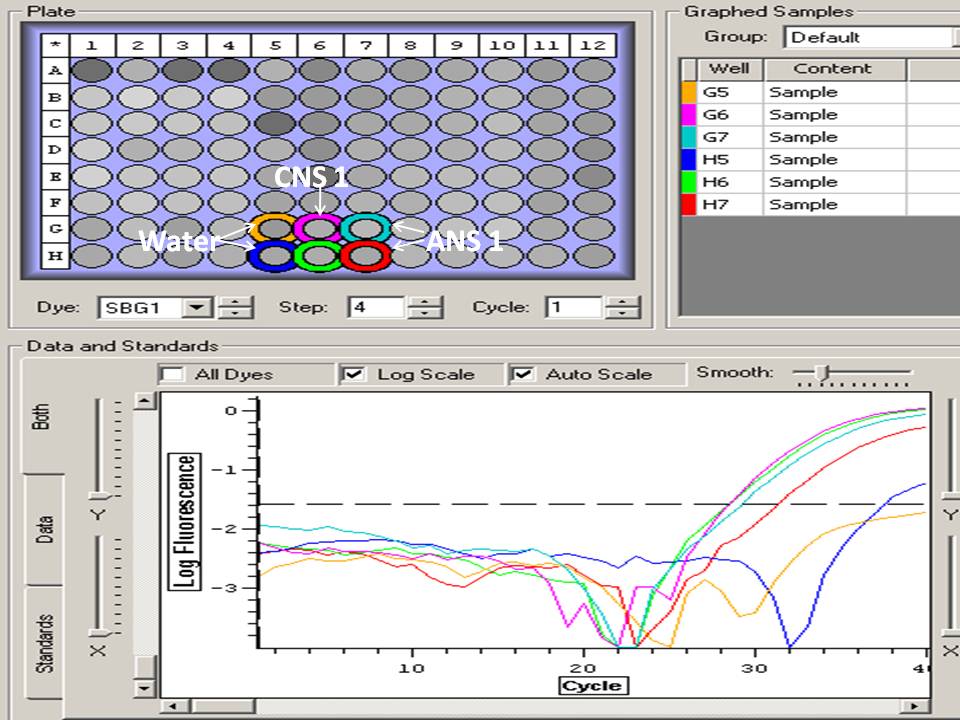
Figure 3. Melt curve for 18S ribosomal primers.
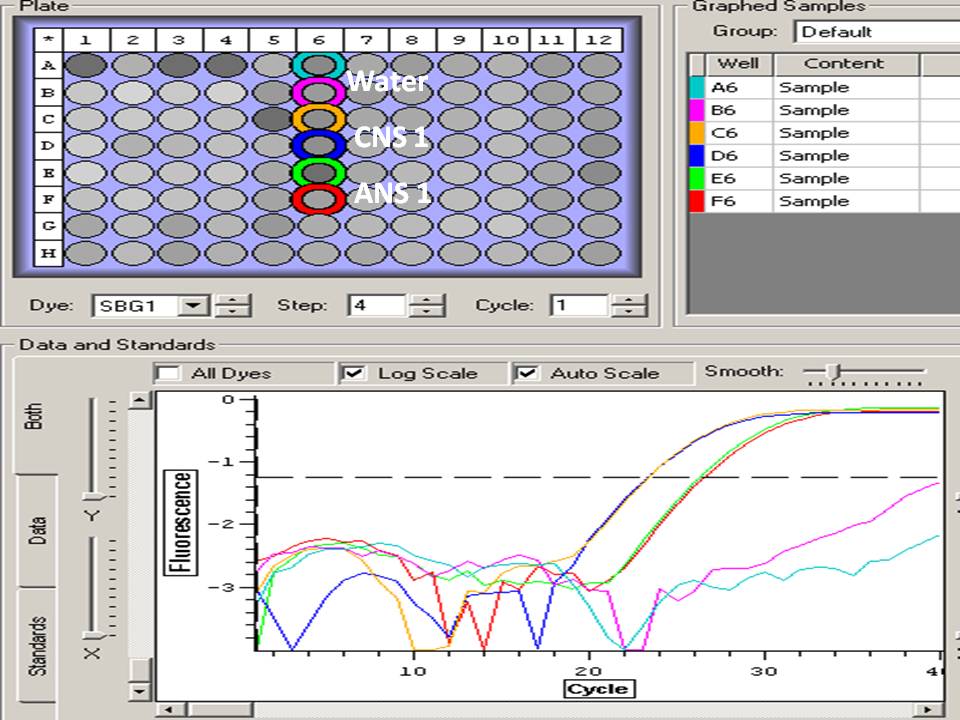
Figure 4. Melt curve for metallothionein IV primers.
Today
I will run a full plate with HSP 70 primers. All samples will be run in duplicate, with 4 negative controls. A master mix was made for 98 50 uL reactions.
Immomix- 2.45 mL
Syto 13- 196 uL
HSP Primer F- 49 uL
HSP Primer R- 49 uL
Water- 1.96 mL
See thermal profile on 11/3/2009.
Tomorrow
Run a full plate with metallothionein primers (at 6 pm), I will prep plate at 12.
11/30/2009
Week 6: qPCR
Today I will test my primers. I have 3 sets, and will include a normalizing gene (18S). Primers were resuspended in water to a concentration of 100 uM, and diluted to a 10 uM working stock. Primers will be stored at -20C. I am running three columns of samples. 2 negative controls were included for each primer set. I chose to run ANS1 and CNS 1 samples for this test (these represent a control and experimental sample). Duplicates will be run of these samples as well. I chose to test the 18S primers using my CNS+3 and CNS+4 samples because I think I might have made a mistake and mixed these up. It is possible that the CNS+4 sample does not have any cDNA.
Layout:
A5- HSP (-)
B5- HSP (-)
C5- HSP CNS 1
D5- HSP CNS 1
E5- HSP ANS1
F5- HSP ANS 1
G5- 18S (-)
H5- 18S(-)
A6- Metallothionein (-)
B6- Metallothionein (-)
C6- Metallothionein CNS1
D6- Metallothionein CNS1
E6- Metallothionein ANS1
F6- Metallothionein ANS 1
G6- 18S CNS+3
H6- 18S CNS+3
A7- Glutathione peroxidase (-)
B7- Glutathione peroxidase (-)
C7- Glutathione peroxidase CNS1
D7- Glutathione peroxidase CNS1
E7- Glutathione peroxidase ANS1
F7- Glutathione peroxidase ANS1
G7- 18S CNS+4
H7- 18S CNS+4
4 Master Mixes:
25 uL Immomix x 7 = 175 uL
2 uL 50 uM Syto-13 Dye x 7 = 14 uL
0.5 uL 10 uM upstream primer x 6 = 3.5 uL
0.5 uL 10 uM downstream primer x 6 = 3.5 uL
20 uL Ultra pure water x 6 = 140 uL
= 48 uL total per reaction
-Add 48 uL of master mix to each well. Add 2 uL of water or cDNA to wells.
-See thermal profile on 11/3/2009
Results on 11/30/2009 (above)
11/24/2009
Week 5 of project
Protocol:
1. Add RNA to wells (volume specified in table)
2. Add water to wells to bring total volume to 17.75 uL
3. Dilute primers (1:5), add 5 uL stock primers to 20 uL water (=0.1 ug/uL)
4. Add .375 uL of diluted primers to each well
5. Incubate samples at 70C for 5 minutes in thermocycler
6. Place samples on ice
RNA was put back in -80. Master mix was made for 50 reactions (I have 46).
Make master mix:
PER RXN / Total Volume
5 uL 5x Buffer (M-MLV RT Buffer) x 50 = 250 uL
1.25 uL 10mM dNTPs x 50 = 62.5 uL
0.5 uL M-MLV RT per ug of RNA
(.15 ug RNA/reaction x 0.5 = .075 uL) x 50 = 3.75 uL
7. Mix well.
8. Add 6.75uL of master mix to each reaction.
9. Mix well.
In Opticon:
10.Incubate @ 42C for 1hr.
12.Heat inactivate @ 95C for 3 min..
13.cDNA transfered to 0.5 mL tubes and stored @ -20C.
Note: It is possible that the reactions for CS+3 and CS+4 are messed up due to a pipetting error. The tube labeled CS+3 either contains CS+3 cDNA or CS+4 cDNA. The tube labeled CS+4 either contains no cDNA (no RNA added) or CS+4 cDNA. It does not really matter is CS+3 and CS+4 are switched, since they had exactly the same treatment. I will use these samples to test my primers to determine if cDNA was synthesized.
I thought that I had 8 ANS samples, and my nanodrop results include a value for ANS 8, but the tube appears to be missing. Hopefully it was just misplaced, or else the concentrations of my ANS+ samples may be mixed up. Will look for ANS 8 tube, and if I can't find it, I'll assume it was accidentally thrown away, and will assume that the concentrations for the 4 RNA samples quantified after ANS 8 are correct (See table below).
11/23/2009
Week 5 of project
Summary
I decided how I will normalize my RNA samples prior to reverse transcription.
Methods
My lowest concentration RNA sample was ANS+2 (8.49 ng/uL). For the reverse transcription reaction, I will maximize the volume of this sample (17.75 uL). The remaining RNA samples at higher concentrations will be diluted with water to a volume containing 150.7 ng of RNA, which is the amount present in the lowest concentration sample. The volume of each sample will be brought up to a total reaction volume of 17.75 uL. I will do the dilutions in a PCR plate. In summary, 17.75 uL of RNA sample and water will be in each well (with a mass of 150.7 ng RNA). See table above for actual volumes of RNA and water. To each well, .375 uL of primers will be added to bring the total volume to 18.125 uL. The primers will be diluted 1:5 with water, resulting in a concentration of 0.1 ug/uL:
.5 ug/uL (stock primers)/dilution factor of 5= 0.1 ug/uL
We need .0375 ug of primers per reaction:
.15 ug RNA per reaction x 0.5 uL primers per 1 ug RNA (based on protocol) = .0375 ug stock primer per reaction
So...
.0375 ug stock primers / 0.1 ug/uL diluted primers = 0.375 uL of diluted primers per reaction
This volume will make sure that the primer:RNA ratio is maintained. At this point, each well will contain 17.75 uL of RNA and water and 0.375 uL diluted primers (1:5). This results in a total volume of 18.125 uL. This is lower than the volume specified by the protocol, so an additional 6 uL of water will be added to the master mix:
18.25 uL (required volume) - 18.125 uL = .125 uL
.125 uL water per reaction = an additional 6 uL
Results
| Sample ID |
ng/ul |
vol. RNA to get to 150.7 ng/uL |
vol. water to bring to 17.75 uL |
| CNS 1 |
154.8 |
0.97 |
16.78 |
| CNS 2 |
55.65 |
2.71 |
15.04 |
| CNS 3 |
125.79 |
1.20 |
16.55 |
| CNS 4 |
204.1 |
0.74 |
17.01 |
| CNS 5 |
362.62 |
0.42 |
17.33 |
| CNS 6 |
209.47 |
0.72 |
17.03 |
| CNS 7 |
72.62 |
2.08 |
15.67 |
| CNS 8 |
66.63 |
2.26 |
15.49 |
| CNS+1 |
685.65 |
0.22 |
17.53 |
| CNS+2 |
192.71 |
0.78 |
16.97 |
| CNS+3 |
41.19 |
3.66 |
14.09 |
| CNS+4 |
203.71 |
0.74 |
17.01 |
| CS 1 |
268.1 |
0.56 |
17.19 |
| CS 2 |
193.31 |
0.78 |
16.97 |
| CS 3 |
397.97 |
0.38 |
17.37 |
| CS 4 |
113.74 |
1.32 |
16.43 |
| CS 5 |
91.77 |
1.64 |
16.11 |
| CS 6 |
201.57 |
0.75 |
17.00 |
| CS 7 |
337.45 |
0.45 |
17.30 |
| CS+1 |
297.39 |
0.51 |
17.24 |
| CS+2 |
201.77 |
0.75 |
17.00 |
| CS+3 |
103.44 |
1.46 |
16.29 |
| CS+4 |
400.89 |
0.38 |
17.37 |
| AS 1 |
108.53 |
1.39 |
16.36 |
| AS 2 |
135.29 |
1.11 |
16.64 |
| AS 3 |
560.15 |
0.27 |
17.48 |
| AS 4 |
180.06 |
0.84 |
16.91 |
| AS 5 |
161.59 |
0.93 |
16.82 |
| AS 6 |
55.4 |
2.72 |
15.03 |
| AS 7 |
253.32 |
0.59 |
17.16 |
| AS+1 |
396.26 |
0.38 |
17.37 |
| AS+2 |
193.57 |
0.78 |
16.97 |
| AS+3 |
216.24 |
0.70 |
17.05 |
| AS+4 |
388.81 |
0.39 |
17.36 |
| ANS 1 |
29.9 |
5.04 |
12.71 |
| ANS 2 |
83.28 |
1.81 |
15.94 |
| ANS 3 |
11.41 |
13.21 |
4.54 |
| ANS 4 |
206.65 |
0.73 |
17.02 |
| ANS 5 |
10.28 |
14.66 |
3.09 |
| ANS 6 |
189.59 |
0.79 |
16.96 |
| ANS 7 |
108.17 |
1.39 |
16.36 |
| ANS 8 |
12.8 |
11.77 |
5.98 |
| ANS+1 |
15.2 |
9.91 |
7.84 |
| ANS+2 |
8.49 |
17.75 |
0.00 |
| ANS+3 |
22.91 |
6.58 |
11.17 |
| ANS+4 |
28.99 |
5.20 |
12.55 |
Conclusions/Next Steps
Tomorrow I will dilute all samples in a PCR plate and reverse transcribe.
11/16/09
Week 4 of project: RNA isolation, DNase treatment, RNA concentration determination
Summary
On Monday (11/16) and Tuesday (11/17) I finished isolating RNA from my final two sets of gill tissue samples. On Tuesday (11/17) and Wednesday (11/18) I DNAsed my samples to remove genomic DNA carryover. On Thursday (11/19), I used that nanodrop to quantify the RNA in all 48 samples. Primers were also ordered.
Methods
RNA Isolation
See protocol described on 10/6/09 and 10/13/09. All isolated RNA samples were stored at -80C.
DNAse Treatment (TURBO DNA-free protocol)- Rigorous treatment
RNA samples were allowed to thaw on ice. 2.5 uL of DNase buffer, 1 uL of TURBO DNase, and 20.5 uL of RNA were combined in 0.5 mL tubes for a total volume of 24 uL. Tubes were incubated at 37C for 30 minutes. An additional 1 uL of TURBO DNase was added to each tube, and they were incubated again for 30 minutes at 37C. 2.5 uL of inactivation reagent was added, tubes were mixed, and incubated at RT for 2 minutes. Samples were spun at 10,000xg for 1.5 minutes. The supernatant was removed and placed in a new 0.5 mL tube, and stored at -80C.
RNA Quantification
RNA samples were quantified using Nanodrop technology. 2 uL of each sample was loaded onto the pedestal. The concentration (in ng/uL), A260, A260/280 ratio and A260/230 values were recorded (See table above).
Primer Design
Primers were designed using NCBI's service. All primers are based on C. gigas gene sequences.
Results
RNA Quantification
See results of RNA quantification above.
Primer Design
| Primer Name |
Gene Name |
Sequence |
#BP |
GC% |
Melting Temp |
Gene Accession Number |
Product Size |
| RT_cgigas_HSP70_F |
HSP 70 |
CGGCGACGCAGCCAAAAACC |
20 |
65 |
60.05 |
AF144646.1 |
291 |
| RT_cgigas_HSP70_R |
HSP 70 |
GCTGGGACTGTGACGACGGC |
20 |
70 |
60.04 |
AF144646.1 |
291 |
| RT_cgigas_glutperox_F |
glutathione peroxidase |
CCGGCTGACAATGCGACGGA |
20 |
65 |
59.77 |
EF692639.1 |
273 |
| RT_cgigas_glutperox_R |
glutathione peroxidase |
AAATCGGAGCACGGGGACGC |
20 |
65 |
59.77 |
EF692639.1 |
273 |
| RT_cgigas_ metallo_F |
metallothionein IV |
TGCTGCTGCGGAAAGGGGTG |
20 |
65 |
59.9 |
AM265551.1 |
108 |
| RT_cgigas_metallo_R |
metallothionein IV |
TACCGTTCAGTGCCCCGCCT |
20 |
65 |
59.9 |
AM265551.1 |
108 |
Conclusions
RNA isolation was successful. The concentrations of the RNA samples vary significantly (from approximately 8 ng/uL to 400 ng/uL). I believe this is due to the fact that the gill tissue samples taken for RNA isolation were not all the same size. The RNA concentrations will have to be normalized before reverse transcription. Before I begin diluting samples I will test to see if the lowest concentration samples (between 8 and 10 ng/uL) are detectable by qPCR. If these concentrations are too low (not amplified above the threshold), I will discard them and dilute to a more moderate concentration. Therefore, the next step I will take is to run a partial qPCR plate with a couple very low concentration samples, a couple moderate concentration samples, and a couple high concentration samples. This will help me determine which samples will be run (if not all), and what concentration to dilute to. I will also take this opportunity to test my primers (if they arrive in time). If I do not have my primers by Monday (11/23), I will use a general C. gigas primer that is available. This preliminary qPCR will also tell me if I have remaining genomic DNA carryover (unsuccessful DNase treatment). After I have determined how I will proceed to normalize my RNA samples, I will make cDNA by reverse transcription (Tuesday 11/24 or Wednesday 11/25). Since a rigorous DNase treatment was done, I will not run a regular PCR to check for genomic carryover, and just assume that the treatment was successful.
Next Steps (Summary)
Monday 11/23: Determine how samples will be normalized
Tuesday 11/24: Normalize RNA samples, reverse transcribe
Wednesday 11/25: qPCR to test primers (possibly...)
11/10/2009
Week 3 of research project: RNA Isolation
Summary
I isolated RNA from 12 out of my 48 samples.
Methods
See entries for 10/6/09 and 10/13/09. My only observation is that the RNA pellet from CS 4+ looks slightly purple. This is strange because all samples were taken from gill tissue.
Results
Isolated RNA was stored at -80C
Conclusions and Next Steps
I will continue isolating RNA next week (10/16-10/17). On 10/17 or 10/19 I will DNase my RNA samples, and determine their concentration using Nanodrop technology. My goal is to also make cDNA this week, in preparation for starting qPCR next week.
11/4/2009
Week 2 of research project: Experiment
Last week: Oysters have been acclimating to laboratory conditions. 24 oysters were placed in a tank with normal air bubbled in, 24 in a tank with pure carbon dioxide (pH=7.2).
This week: The original plan was to mechanically stress half of the oysters (5 minutes in salad spinner), then place them in smaller shoe box sized containers. The water in the shoe boxes was transferred from the large acclimation tanks, so the acidification/control conditions were maintained. 1 liter of water was placed in each container, this was enough to just barely cover the oysters. For each treatment, 8 oysters were placed in shoe boxes without mechanical stress (controls). 8 mechanically stressed oysters were placed in a second container. In the third container, 4 non-stressed oysters were exposed to 4 stressed oysters (stress response induction experiment). The goal was to let the oysters sit after the mechanical stress for 30 minutes before tissue samples were collected. However, it took a few minutes to get the supplies ready and actually start sampling. Therefore, the oysters actually sat in the shoe boxes for around 40 minutes after the mechanical stress. To control for this time effect, the second group (+CO2) was also allowed to sit for 40 minutes. After 40 minutes, all 48 oysters were shucked and small gill tissue samples were removed and placed in 500 uL of TriReagent. An additional sample was taken for microbial analysis (Horner-Devine lab). All samples were stored at -80C.
Next week (11/10):RNA extraction will be completed and RNA will be quantified using the nanodrop. I will design primers and order them for use the following week.
Week of 11/17: I will DNase my RNA samples and make cDNA. I will shoot for doing my first qPCR this week too (outside of class) to allow for extra time to analyze results. If i don't have time, I'll do qPCR next week.
Week of 11/24: qPCR
Week of 12/1: Analysis of PCR results, write paper, prepare presentation
Week of 12/7: Presentation
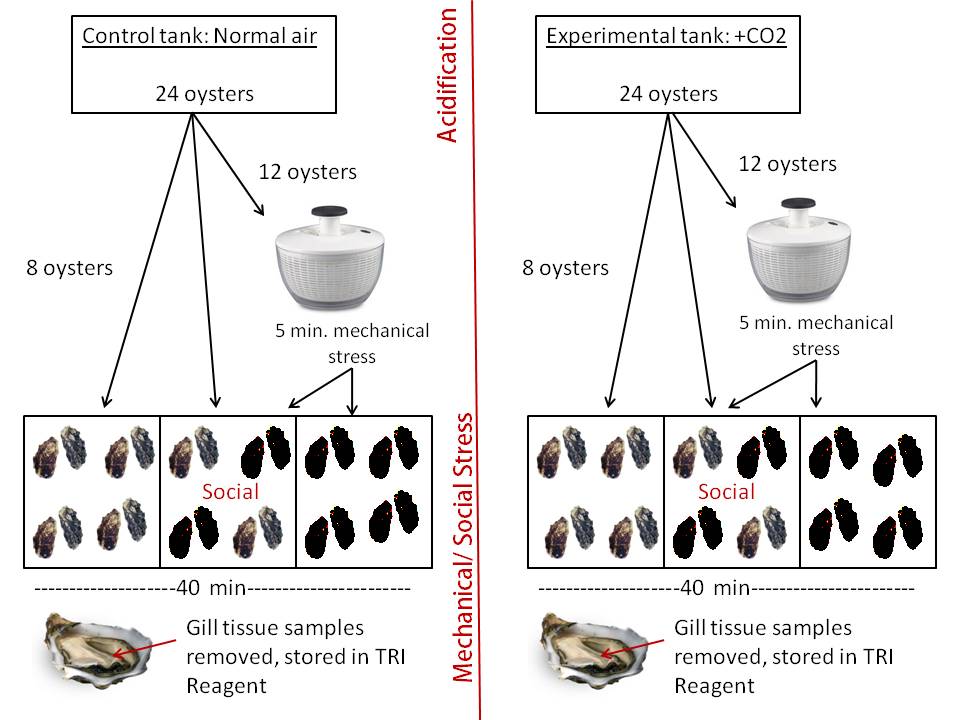
Labeling scheme: 48 tubes wil TriReagent and tissue samples
Control tank
ANS= air, not stressed
AS= air, stressed
ANS+= air, not stressed, social
AS+= air, stressed, social
Experimental tank
CNS= carbon dioxide, not stressed
CS= carbon dioxide, stressed
CNS+= carbon dioxide, not stressed, social
CS+= carbon dioxide, stressed, social
11/3/2009
Summary
I did quantitative polymerase chain reaction using the cDNA I made for heat shock protein 70 expression in barnacle tissue. I also ran my RNA sample to check for genomic DNA carryover.
Methods
Primers were diluted to a 100 uM stock solution, and a small amount was diluted further to a 10 uL working stock solution.
A master mix was prepared to allow for 7 reactions (2 controls, 2 RNA reactions, 2 cDNA reactions, 1 extra).
In each reaction (total 48 uL):
25 uL 2X Immomix
2 uL Syto-13 dye (50 uM)
0.5 uL upstream primer (10 uM)
0.5 uL downstream primer (10 uM)
20 uL Ultra Pure Water
48 uL of master mix was loaded into 6 wells of a white PCR plate. 2 uL of water was added to two, 2 uL of cDNA added to two, and 2 uL of the RNA that was used to make cDNA (to check for genomic carryover) added to the last two wells. The wells were capped and put in the Opticon machine. See figure 1 for qPCR cycling parameters,

Figure 1. Screen shot of Opticon qPCR cycling parameters. The thermal parameters are listed under "protocol list." The "protocol graph" is a schematic of the procedure, green eyes indicate the times when a measurement of fluorescence will be taken.
Results
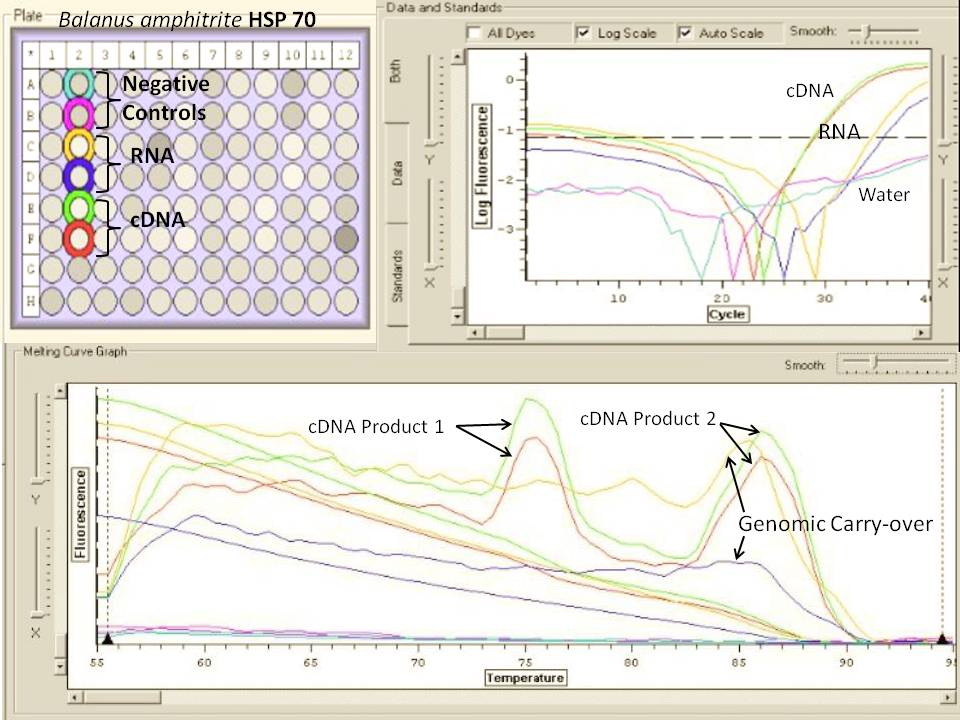
Figure 2. Real-Time PCR results for amplification of HSP 70 gene expressed in non-stressed barnacle tissue. 6 reactions were run, including 2 negative controls. Fluorescence measurements and melt-curve analysis results are color-coded according to the well designations listed above.
Table 1. Efficiency and C(t) values for qPCR reactions.
| Sample |
Efficiency |
C(t) |
|
| A2 |
Negative control |
N/A |
N/A |
| B2 |
Negative control |
N/A |
N/A |
| C2 |
RNA template |
89.95% |
35.4 |
| D2 |
RNA template |
75.68% |
36.66 |
| E2 |
cDNA template |
88.63% |
29.67 |
| F2 |
cDNA template |
84.94% |
29.9 |
My two negative controls showed no amplification above the background, indicating that the reagents used were not contaminated. My qPCR results indicate that HSP 70 was expressed in barnacle tissue, as indicated by its amplification of cDNA during PCR (Figure 2). The efficiency of these reactions was good (84-88%), indicating that the amount of double stranded PCR product came close to doubling every cycle (ideal would be 100% efficiency). The C(t) values for the cDNA reactions are also very close to each other (29.67 and 29.9), indicating that there was a nearly equal amount of cDNA in each starting reaction. The RNA samples used to make cDNA were also amplified, which indicates that genomic DNA carry-over occurred. This is not surprising, since the RNA was not treated with a DNase agent before cDNA was made. This will be done in the future. The melting curve in Figure 2 shows clear evidence that two products resulted from the PCR of my cDNA samples. The first product reached its melting point first, indicating that it is likely a smaller strand of DNA. I think that this is the result of amplification of the cDNA. The second product is likely longer as indicated by its higher melt temp. I think that this is the result of the amplification of genomic DNA carry-over. This assertion is supported by the fact that the melting curve peak of cDNA product 2 and the RNA reaction are at nearly the same temperature (they must be very similar). The different sizes of the PCR products suggests that the primers designed for HSP 70 included an intron, which was present in the genomic DNA, but spliced out in the mRNA. A comparison of the C(t) values for the RNA reactions and cDNA reactions suggests that there was more cDNA template in the reactions than genomic DNA (Table 1), but the extent of the carry-over was considerable.
Next steps
Next week I will continue work on my project, and extract RNA from the oyster gill tissue samples I collected this week.
10/28/2009
Week 1 of research project: Acclimation
Questions:
1. How does elevated carbon dioxide concentration affect the Pacific oyster's general stress response?
2. Can a stress response be induced in conspecifics through social interaction?
Oysters were collected from 3 locations: North Bay, Samish Bay, and Willapa Bay. Two tanks were set up in a temperature controlled room (15C). The control tank is aerated with normal air, the experimental tank is aerated with both normal air and pure carbon dioxide. The pH threshold of the carbon dioxide generator is 7.2 (normal seawater is in range 7.5-8.4).
Tank 1-Control:
8 North Bay
7 Samish Bay
10 Willapa Bay
Tank 2-Experimental:
8 North Bay
7 Samish Bay
10 Willapa Bay
=50 oysters total
The sizes of the oysters are quite variable. In particular, the oysters from Samish Bay are much smaller than those from Willapa or North. For this initial acclimation period, the oysters were separated by sampling location, but for the experiment they may be combined and chose randomly for treatments.
50 oysters will be acclimated to laboratory conditions for one week (until 11/4/09), and will be fed 5 mL of algae every two days.
Next week:
A subset of the oysters will be mechanically stressed. At one time point (probably 1 hour) post-stress, the oysters )both control and stressed) will be killed and gill tissue samples will be taken. This will allow me to compare gene expression (genes yet to be determined) between oysters in normal carbon dioxide conditions to those held for one week at elevated carbon dioxide concentration. The second question will be answered by transferring 4 control (non-mechanically stressed) oysters into a small container with 4 mechanically stressed individuals. Gill tissue samples will be taken and stress-related gene expression will be compared.
10/27/2009
Summary
We obtained our PCR products from last week (barnacle HSP 70 gene) and performed gel electrophoresis. A Western blot procedure was started using the protein extracted the first week of class and the antibody for HSP 70. The procedure was continued overnight, and completed the following day (10/28).
Procedures
Gel Electrophoresis of PCR Product
Agarose gels made last week were placed in the gel box and covered with 1x TAE buffer. The combs were removed and 7 uL of 100 bp ladder was loaded in the first lane. We each loaded 25 uL of our PCR products (2 negative controls and 2 samples). The gel ran at 100 V for 1 hour. The resulting bands were viewed on a UV light box and photographs were taken.
Western Blot
SDS PAGE was completed using the protocol described on 10/13/2009. Filter paper and the nitrocellulose membrane were soaked in Transfer Buffer for 15 minutes prior to the transfer. The protein gel was removed from the gel box. The blotting sandwich was assembled in a semi-dry blotting apparatus in the order:
Top
Cathode (-)
Filter paper
Gel
Nitrocellulose membrane
Filter paper
Anode (+)
Bottom
The current travels from the cathode down through the gel, transferring the negatively charged proteins onto the positively charged nitrocellulose membrane. The blot was transferred for 30 minutes at 20V. The membrane was removed from the sandwich and rinsed with buffer, all gel pieces were carefully removed from the membrane. The gel was stained with Coomassie Blue, so we will be able to compare the pictures of the total protein content of our samples (gel) with the result of the transfer (just HSP 70, if present). The membrane was blocked in 20 mL of solution (containing 14 mL of ultra filtered water, Blocker/Diluent A, and Blocker Diluent B, all contained in Western Breeze kit). The protocol called for the membrane to soak in only 10 mL of blocking solution, but I added more because it did not appear to sufficiently cover the membrane. This was incubated for 10 minutes on a rotary shaker (1 rev/sec). The blocking solution was removed, and the membrane was rinsed with water for 5 minutes twice. 10 mL of primary antibody solution (1:3000 dilution) was prepared using 10 mL of blocking solution (above) and 3.3 uL of the HSP 70 antibody. The membrane was incubated with the primary antibody overnight. The following day, the primary antibody solution was removed and the membrane was washed with Antibody Wash, which was repeated once. It was then incubated in 10 mL of secondary antibody solution for 30 minutes. The secondary antibody was decanted, and the membrane was rinsed twice with water. It was then incubated with 5 mL of Chromogenic solution. Purple bands appeared after only a couple minutes. Pictures were taken after the membrane was fully developed.
Results
Gel Electrophoresis of PCR Product
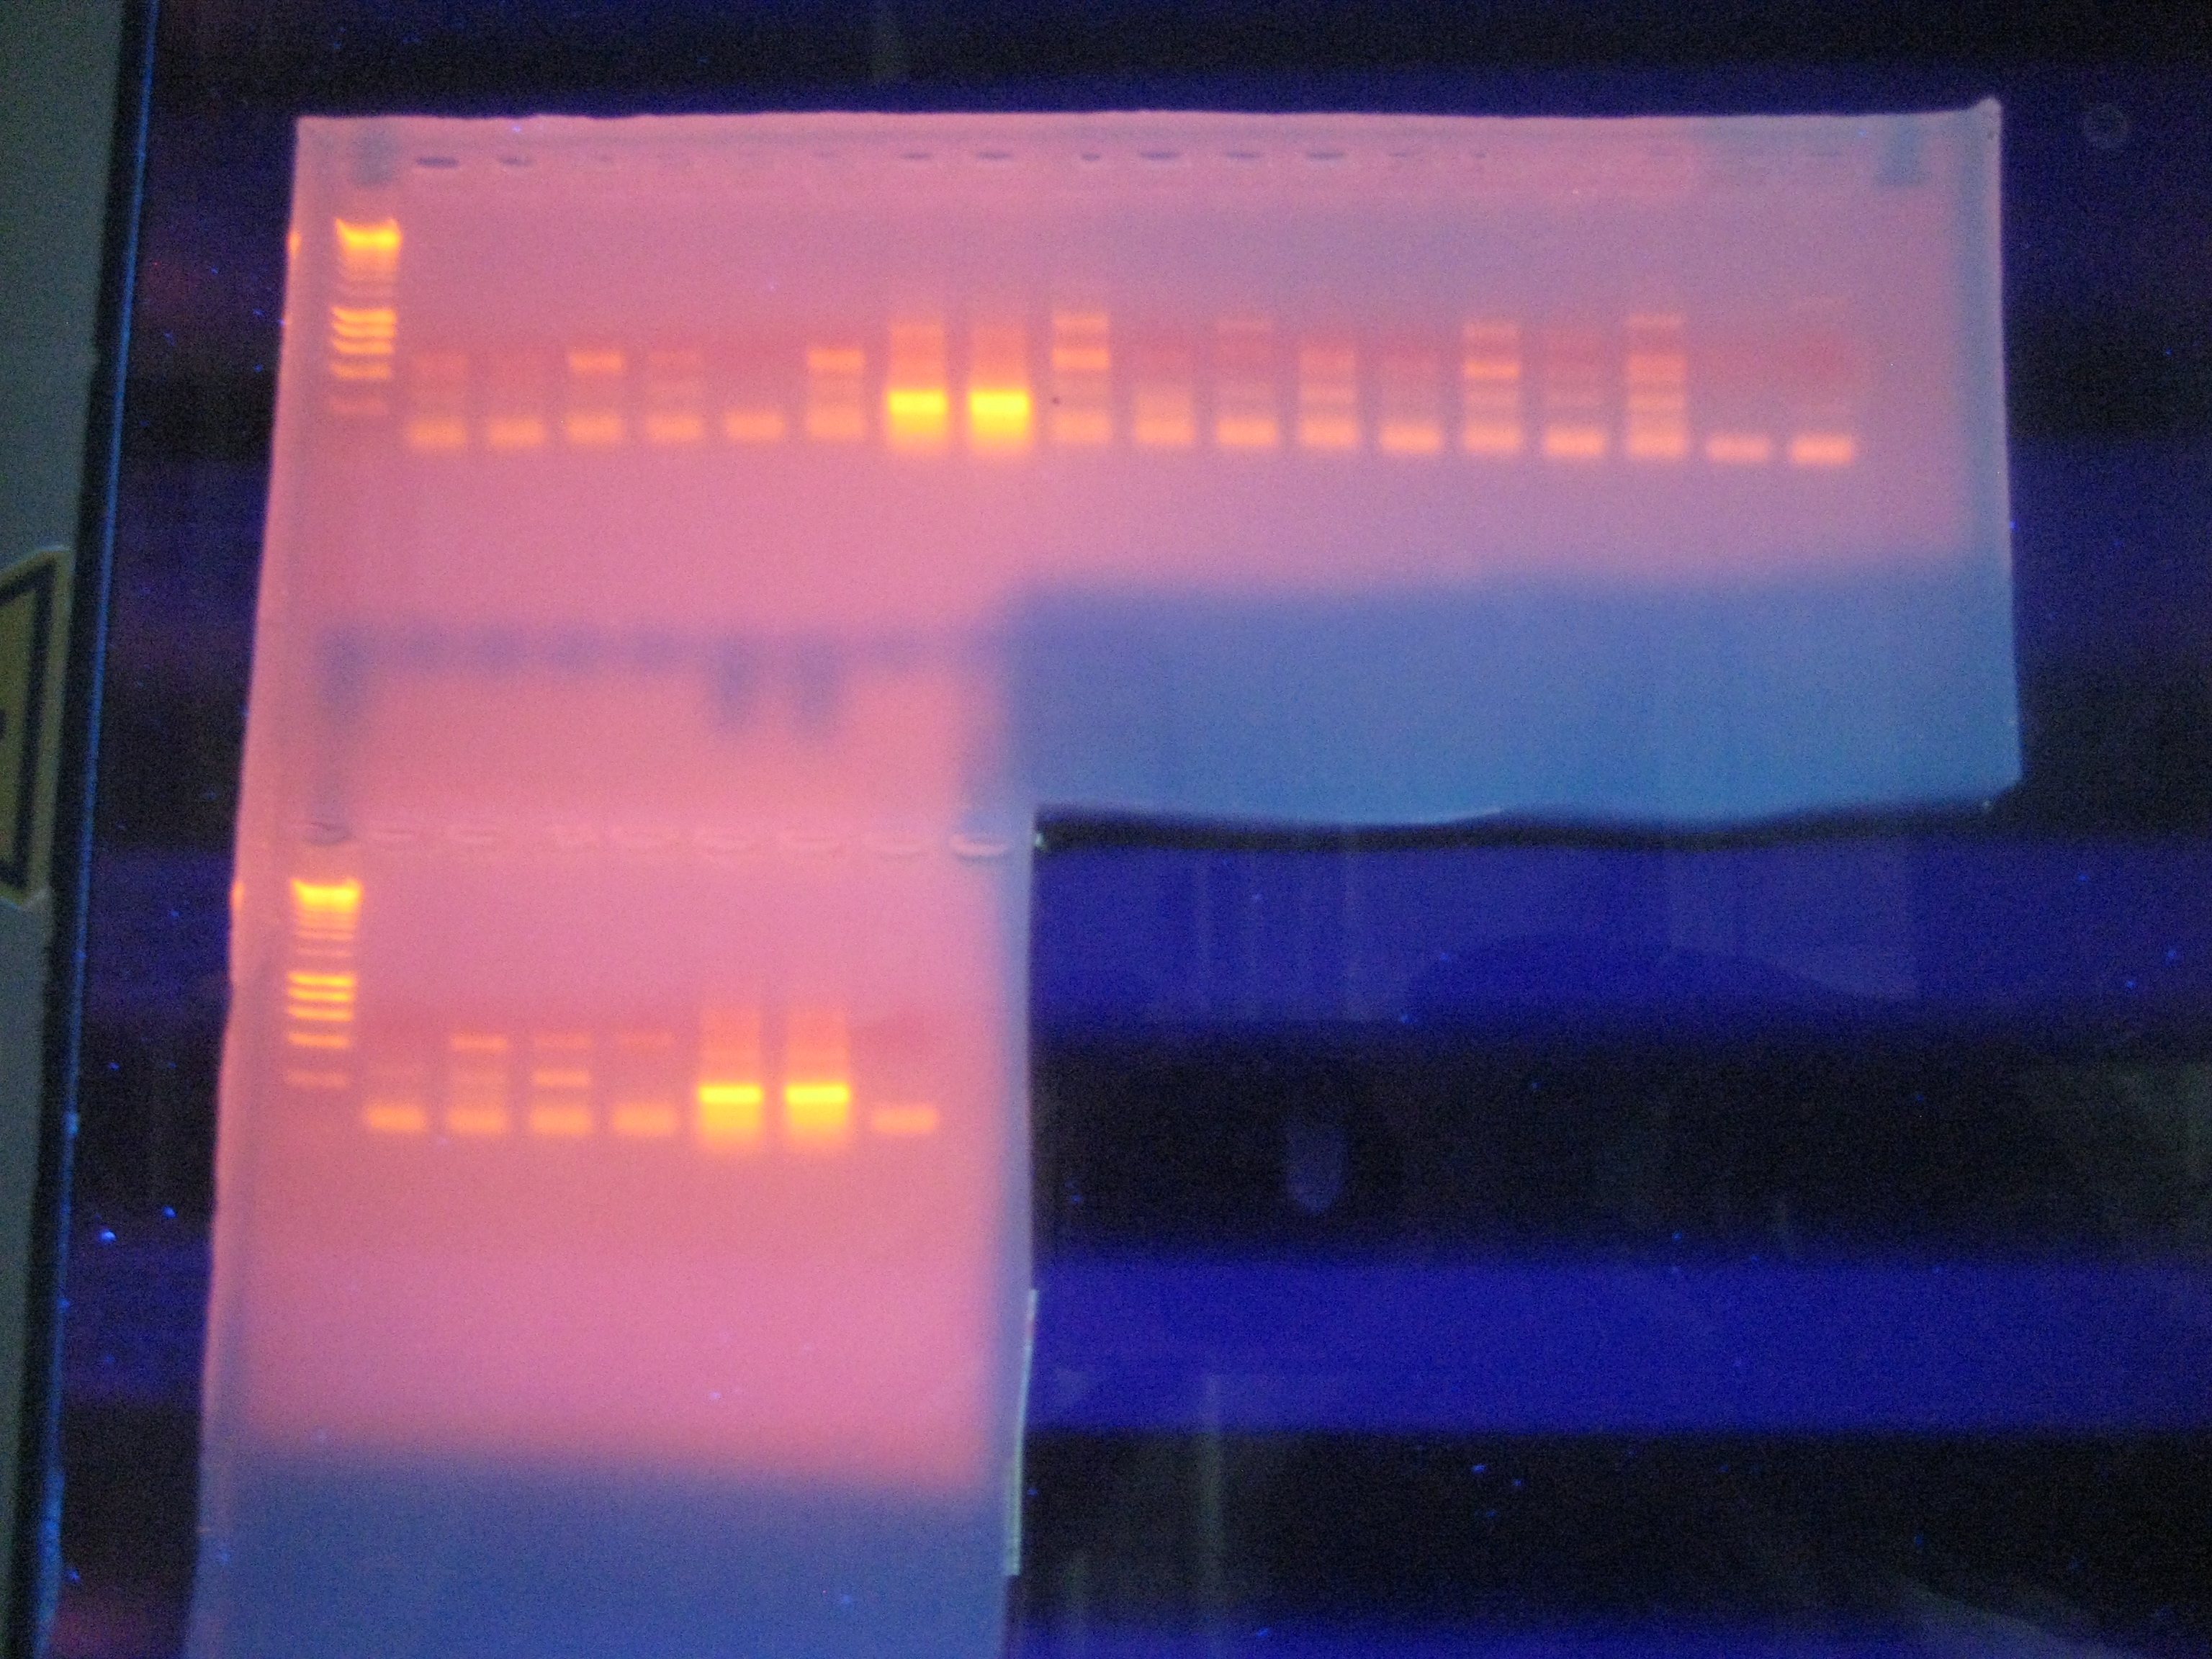
Figure 1. Result of PCR of heat shock protein 70 gene expressed in barnacle tissue.
Lanes:
Ladder
Negative control 1
Negative control 2
1. Non-heat stressed barnacle, HSP 70
2. Non-heat stressed barnacle, HSP 70
3. Heat stressed barnacle, HSP 70
4. Heat stressed barnacle, HSP 70
Negative control
Negative control
Second Row:
Ladder
5. Heat stressed barnacle, HSP 70
6. Heat stressed barnacle, HSP 70
Western Blot-HSP 70
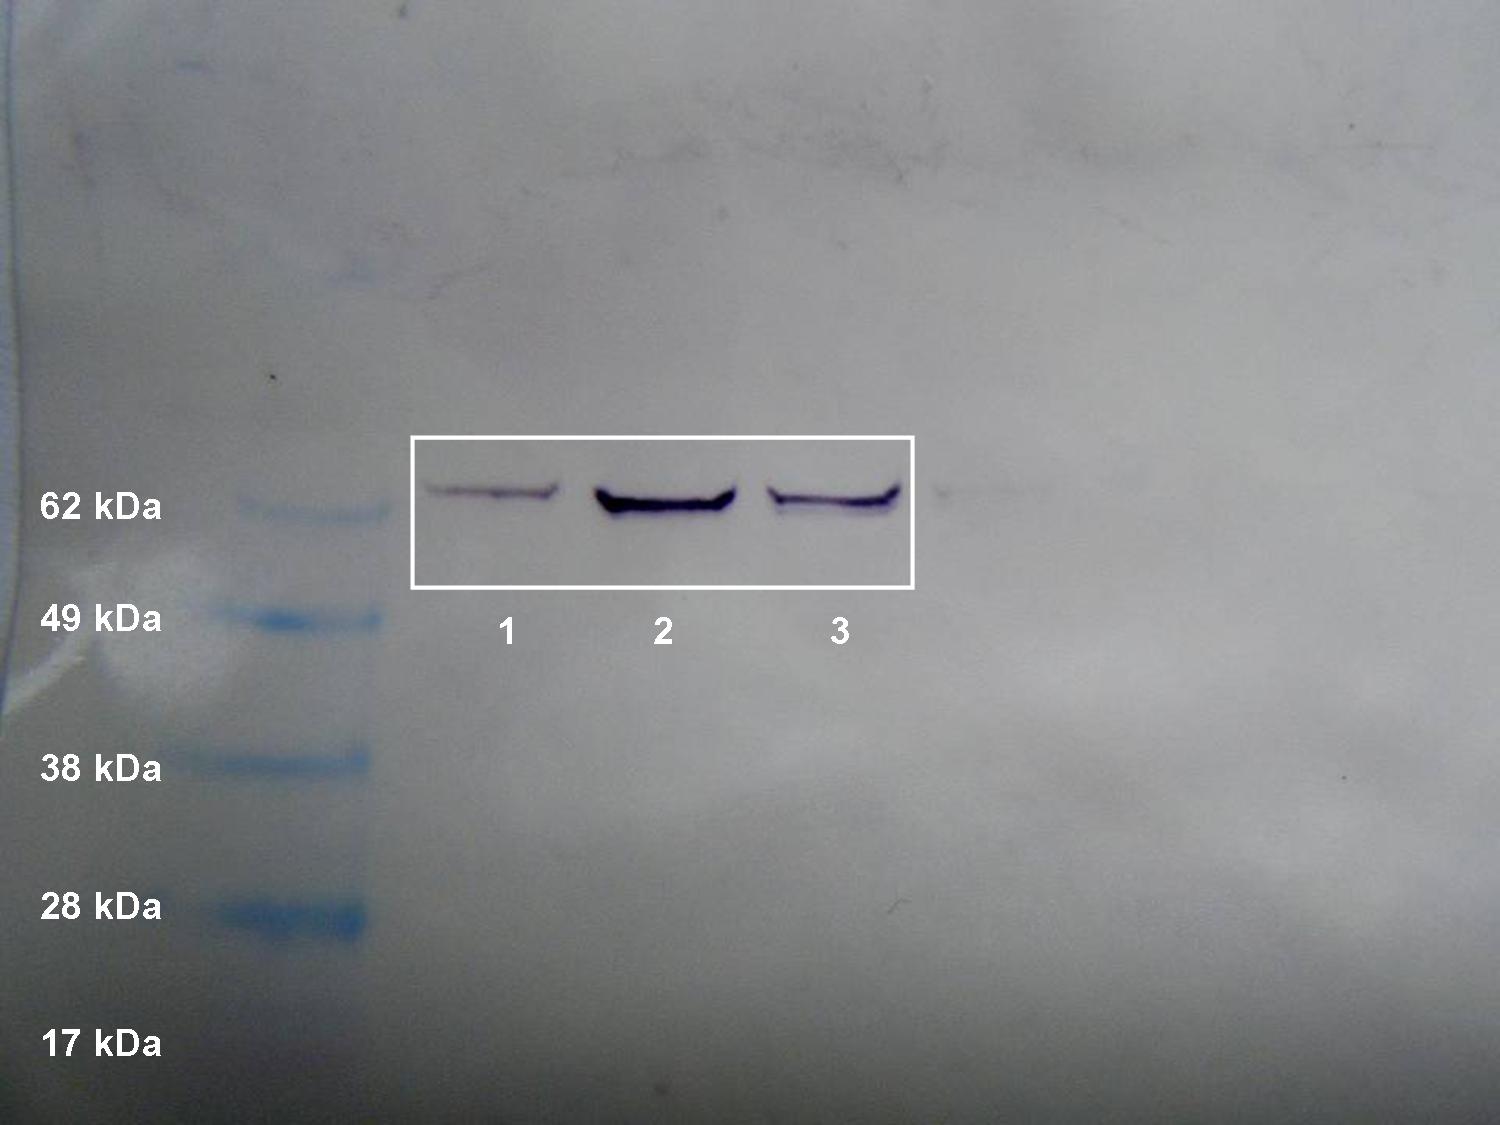
Figure 2. Western blot of heat shock protein 70.
Lanes:
Ladder
1. Heat stressed barnacle tissue sample (12 ug)
2. Heat stressed barnacle tissue sample (12 ug)
3. Non-heat stressed barnacle tissue sample (12 ug)
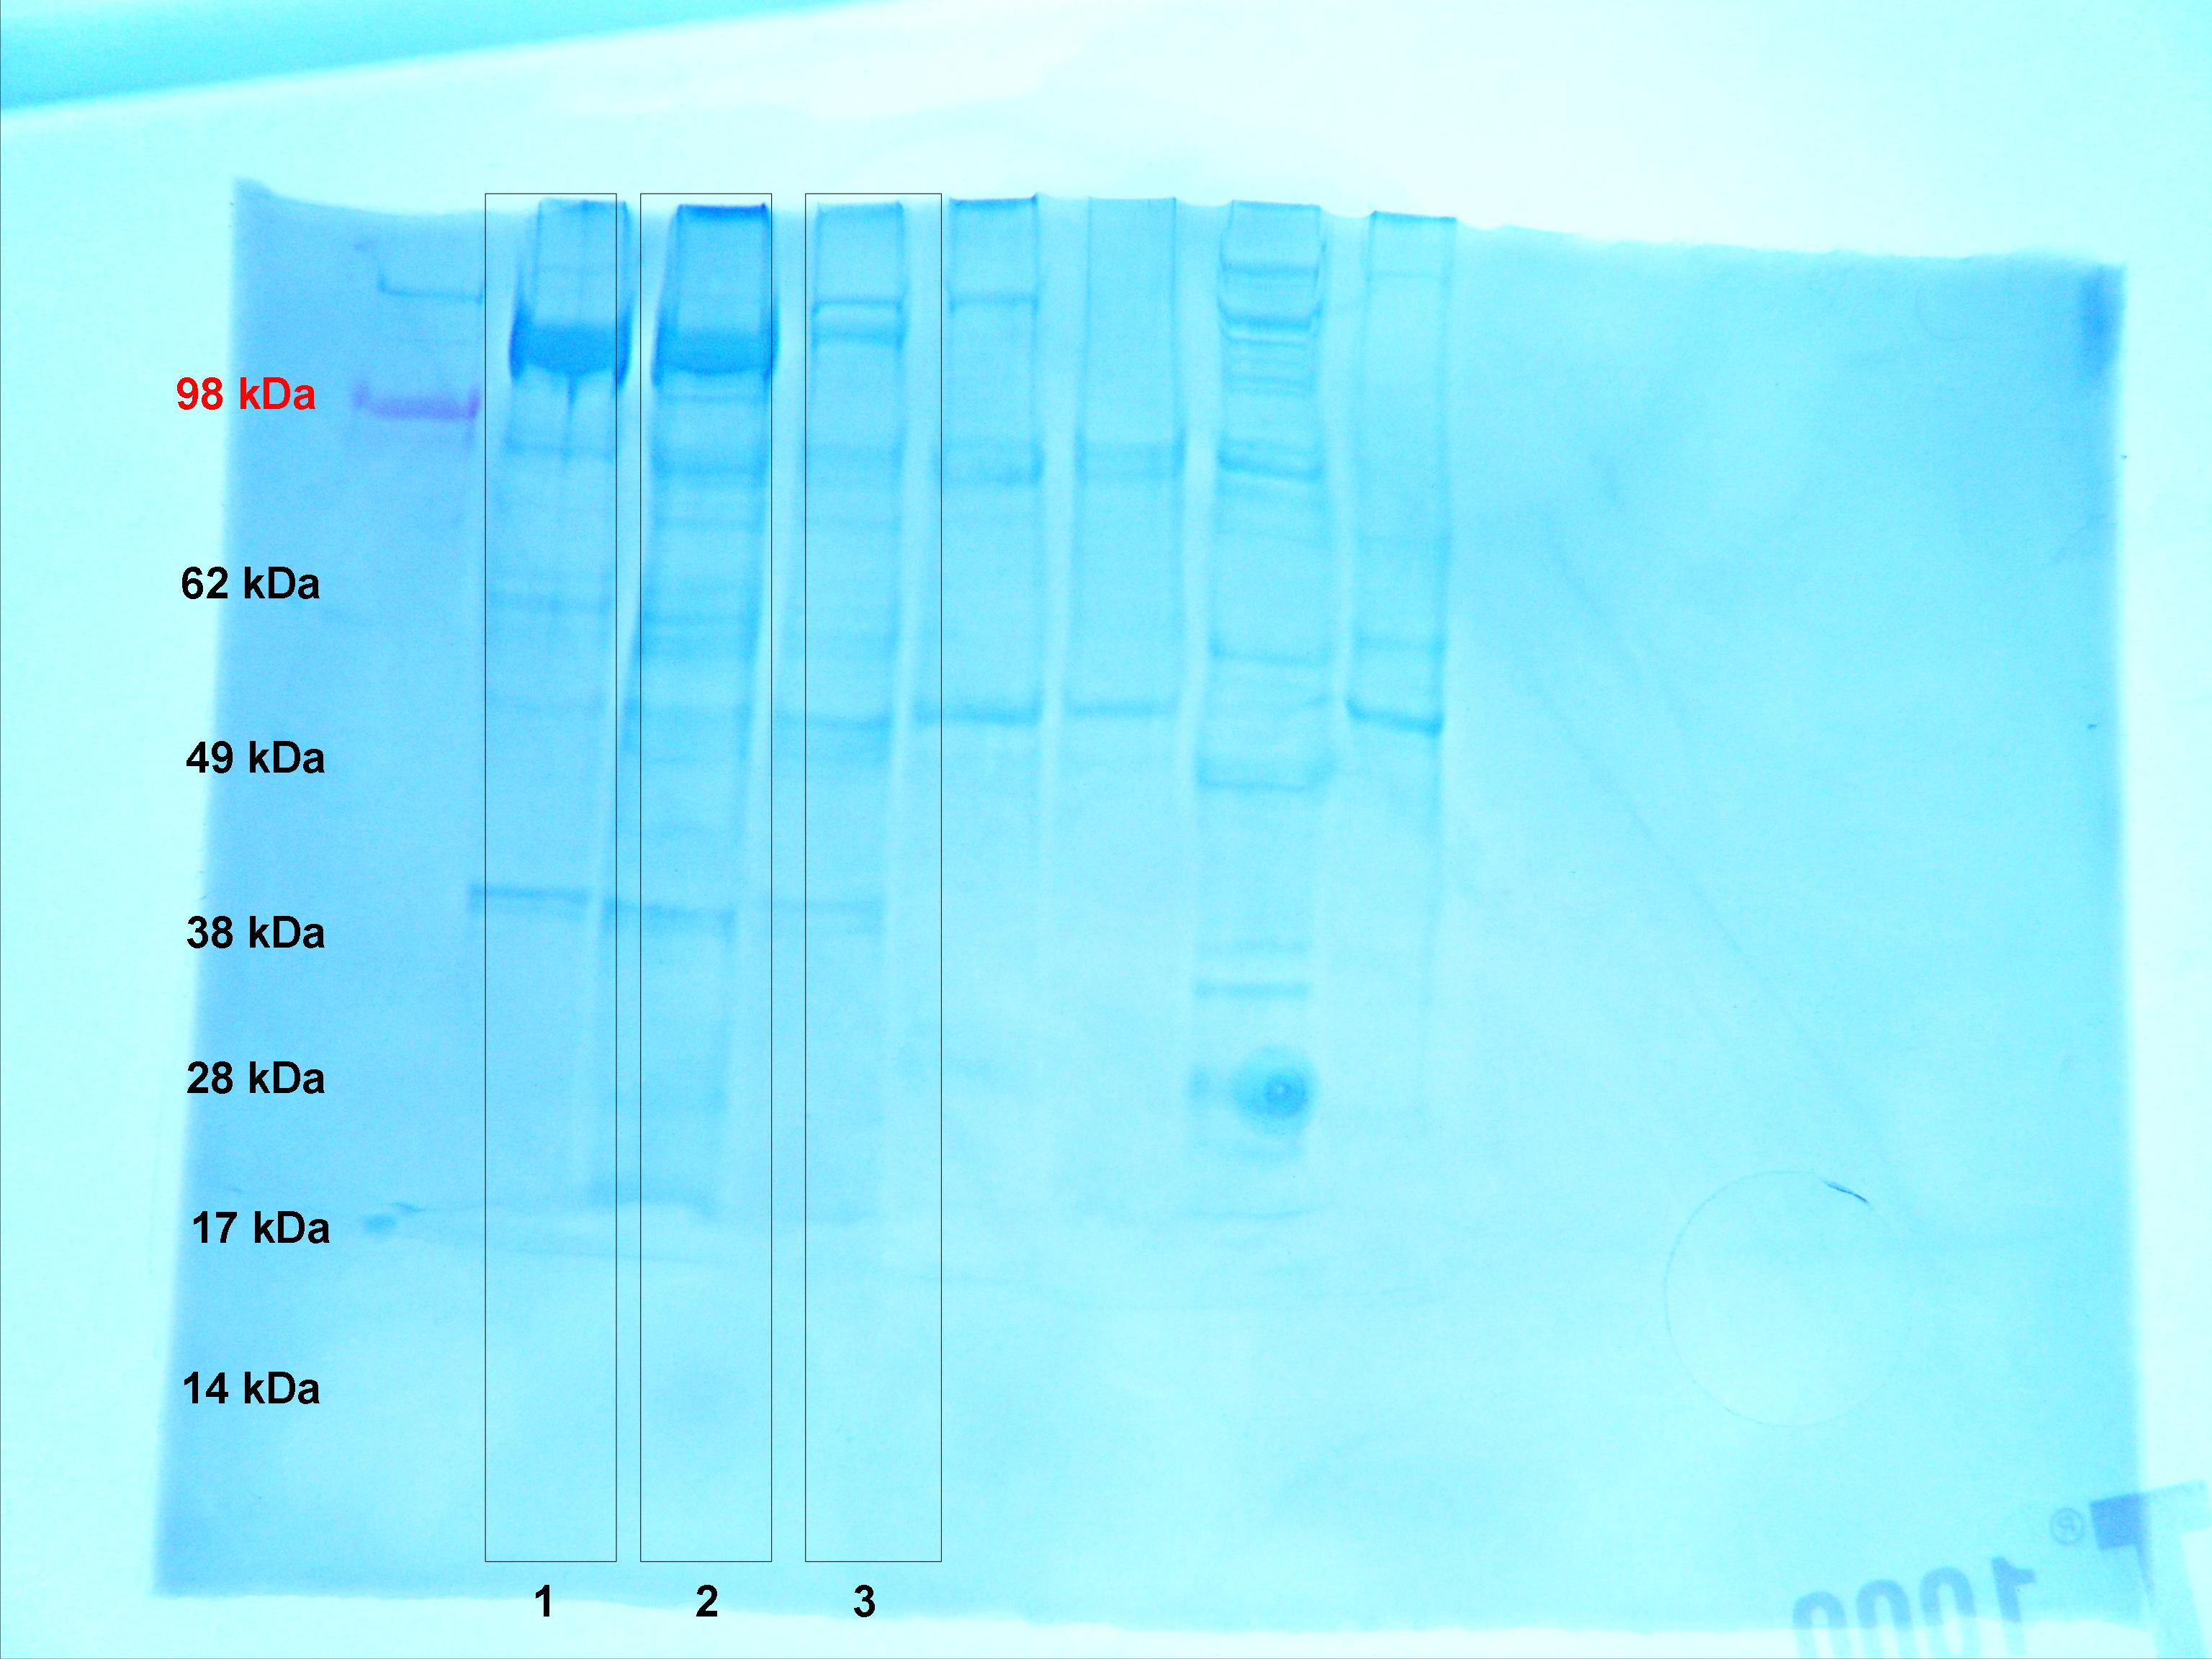
Figure 3. SDS PAGE gel used for Western blot transfer.
Lanes:
Ladder (SeeBlue)
1. Heat stressed barnacle (12 ug)
2. Heat stressed barnacle (12 ug)
3. Non-heat stressed barnacle (12 ug)
Conclusions
PCR for HSP 70 was successful. My negative controls were negative, indicating that no contamination was present. A single band was present for both of my samples, indicating that a PCR product was generated (Figure 1). The band is approximately 200 base pairs long, which is consistent with NCBI's predicted amplicon size, which is 216 base pairs. Since only one band is present, there is little or no genomic DNA present, and multiple PCR products were not formed (primers very specific to HSP 70 gene). The approximate weight of my PCR product was between 300 and 500 base pairs. When compared to the PCR result for the heat stressed barnacle (lanes 3 and 4), it appears that the products were very similar. I believe that the primers designed for the heat stressed barnacle were based off of a different barnacle species, so this could account for the slight difference in size. The intensity of the bands for the non heat stressed and heat stressed barnacles are very similar, indicating that an equal amount of HSP 70 was present in the tissues of these organisms prior to sampling. This is not surprising, since HSP 70 is involved in many stress responses besides thermal shock. It could have been active in the tissues of the non-heat stressed barnacle as a result of another environmental stress that was not accounted for. Lanes 5 and 6 show the PCR products for another heat stressed barnacle sample. The large number of bands could indicate that multiple PCR products were formed, possibly as a result of unspecific primers, or contamination by genomic DNA. Since very low weight bands are present, it is also likely that primer dimers formed.
The results of the Western blot transfer of HSP 70 in non-heat stressed barnacle tissue clearly indicate that HSP 70 was present. A distinct purple band between 62 kDa and 70 kDa was present for the heat stressed and non-heat stressed samples (Figure 2). This re-enforces the fact that HSP 70 was active in the tissues of both the heat stressed and non-heat stressed barnacles. An equal amount of protein was loaded onto the gel for each sample, but the intensity of the bands resulting from the transfer is not exactly the same. The heat stressed sample in lane 2 is much darker than the samples in lane 1 (heat stressed) and lane 3 (non-heat stressed). This is probably a result of experimental error. It is possible that more protein was present in lane 2 (due to a measurement error). The stained SDS PAGE gel that the HSP 70 bands were transferred from can be referred to in order to see if more protein was loaded. Lane 2 in figure 3 looks slightly darker than lanes 1 and 3, which indicates that it is possible that more protein was loaded from that sample.
Next Steps
We will perform quantitative PCR on the cDNA made from our tissue samples. The results from this week indicated that HSP 70 was expressed in the tissues of my barnacle sample, and qPCR will tell me how much mRNA was present. A fluorescent dye added to the PCR reaction can be detected by the qPCR machine, which provides us with a means to calculate how much double stranded DNA is being produced after every cycle.
my PCR product: 2252 bp
10/20/2009
Summary
RNA samples from last week were quantified using Nanodrop technology. The same RNA was used to make cDNA, and PCR was started at the end of the period. We made agarose gels for electrophoresis next week (11/3/2009).
Procedures
RNA Quantification
The Nanodrop maching was blanked using 0.1%DEPC-H2O. 2 uL of RNA was pipetted onto the machine, and A260 absorbance was read. The values for A260 absorbance, RNA concentration (ng/uL), A260/280 ratio and A260/230 ratio were recorded.
Reverse Transcription
5 uL of RNA was transferred to a PCR tube, and incubated at 75C for 5 minutes in the thermocycler. The master mix was added directly to this tube.
Master Mix:
4 uL 5x AMV RT Buffer
8 uL dNTPs (10 mM total)
1 uL AMV RTranscriptase
1 uL Oligo dT Primer
1 uL RNase free water
=15 uL
The total reaction volume was 20 uL (5 uL RNA, 15 uL master mix). The PCR tube was vortexed, spot spun, and incubated at RT for 10 min. It was then incubated at 37C for 1 hour, and subsequently heat inactivated at 95C for 3 minutes (all in thermocycler). This resulted in cDNA.
PCR
The forward primer for the balanus HSP 70 gene came in a 32.0 nMole sample. This was diluted to a 100 uM stock, which was further reduced to a 10 uM working stock (used for PCR). The remaining 100 uM stock was stored at -20C (Along with extra cDNA). 33.2 nMoles of reverse primer were diluted to the same stock concentrations. See 10/6/09 entry for primer sequences. The master mix was prepared during the 1 hour cDNA incubation period.
Master Mix:
125 uL GoTaq Green Master Mix (1X): contains Taq DNA polymerase, dNTPs, MgCl2, buffers, 2 dyes for electrophoresis
2.5 uL Forward Primer (Balanus HSP70)
2.5 uL Reverse Primer
100 uL water
=240 uL total (48 uL per reaction)
48 uL of master mix was added to 5 PCR tubes.
Tube 1: Negative control, 2 uL water
Tube 2: Negative control, 2 uL water
Tube 3: 2 uL cDNA
Tube 4: 2 uL cDNA
All reactions were a total of 50 uL.
*Tubes labelled RT 1,2,3 and 4
The reactions were loaded into the thermocycler.
Thermal profile:
95C for 10 min
40 cycles
-95C for 30 sec
-55C for 30 sec
-72C for 90 sec
72C for 3 min
4C forever
Agarose Gel Preparation
2 grams of agarose was mixed with 150 mL 1X TAE in a 1L flask. The flask was microwaved for 3 minutes, allowed to cool, and combined with 12 uL ethidium bromide. The solution was mixed and poured into gel tray with a gel comb. The gel was placed in the fridge for use next week.
*Note: our agarose and buffer mixture boiled over in the microwave, we added more buffer and a little more agarose and re-microwaved for less than a minute. The solution appeared to be the correct volume.
Results
RNA Quantification
A260: 17.261
RNA concentration (ng/uL): 690.4
A260/280: 1.97
A260/230: 1.98
These were the only results for the day.
Conclusions
I had a very high RNA concentration (690.4 ng/uL). The A260/280 ratio indicates that my sample is clean (it is between 1.0 and 2.0). The A260/230 value also indicates that the RNA was clean (1.98). This means that significant amounts of phenol, ethanol, or salt were not carried over throughout the protocol. cDNA was made and PCR was started using the barnacle primers for HSP 70 that I designed earlier. The PCR product will be used for gel electrophoresis next week (10/27/09). This will allow me to visualize the HSP 70 gene, and hopefully compare results with the group that had the thermally stressed barnacle sample. qPCR will also be done with the same cDNA to quantify the amount of gene expression in the barnacle tissue, which should be related to the level of stress the organism was under at the time of sampling.
10/13/2009
Summary
We continued the RNA extraction from last week (homogenized samples in TRI Reagent were in -80 for one week). We planned to quantify our RNA samples, but ran out of time (will be done next week, 10/21/09, using the Nanodrop). The extracted protein from the previous week was visualized using SDS PAGE (see figures below).
Procedures
RNA Extraction (continued)
Samples were allowed to thaw and incubate at RT. 200 uL of chloroform was added, and the tube was vortexed until the solution became milky (looked foggy and pink). The sample was centrifuged for 15 minutes, after which, the aqueous layer (top layer, containing the RNA), was removed and kept in a new tube. 500 uL of Isopropanol was added, and the tube was inverted until the solution became uniform (after several inversions, the isopropanol did not look viscous). The tube was centrfuged again, and a small white pellet was visible at the bottom of the tube. The supernatant was removed carefully without dislodging the pellet, and 1 mL of 75% ethanol was added. The tube was vortexed until the pellet came free from the bottom of the tube, and centrifuged for 5 minutes.All ethanol was removed from the sample, and the pellet was allowed to air dry for 5 minutes. The pellet was resuspended in 100 uL of 0.1%DEPC-H2O. The RNA was solubilized by incubating the sample at 55 degrees.
The fully extracted RNA was put into the -80 degree freezer.
SDS PAGE
The extracted protein sample was thawed and combined with 2X Reducing Sample Buffer (15 uL sample, 15 uL buffer). The sample was boiled for 5 minutes, and immediately centrifuged for 1 minute. The entire 30 uL sample was loaded into the gel, and ran at 150 V for 25 minutes. The gel was stained using Coomassie stain, for approximately 4 minuted. The stain was removed, and acetic acid was added to de-stain overnight. 2 gels were ran, see figures 1 and 2 below.
Results
| kDa . . 118 98 62 49 38 28 17 14 |
 |
Lanes:
1- SeeBlue ladder, 10 uL
2- Herring heart, 26 ug
3- Salmon brain, 10 ug
4- Clam foot, 33 ug
5- Sea Scallop, 242 ug (not correct)
6- Barnacle (non-heat stressed, my sample), 17 ug
7- Gigas, 5 ug
8- Oyster gill, 18 ug
| kDa . 118 98 . 62 49 38 . 28 17 14 |
 |
Lanes:
1- Ladder, 10 uL
2- Vt + oyster, 3.2 ug
3- Barnacle (heat stressed), 23 ug
4- Blank
5- 9 ug
6- Barnacle (heat stressed), 77 ug
7- Salmon brain, 9.5 ug
8- Herring brain, 16 ug
9- 9.6 ug
Conclusions
My protein sample (Figure 1, lane 6) was from a non-stressed barnacle. There are 2 distinct bands at 49 and 38 kDa. Besides the two dark bands, the lane is very light. It is interesting to note that the darkest lane (lane 3), is from a sample containing 7 ug less protein than my sample (17 ug). The dark sample is from salmon brain. Perhaps higher organisms have more protein activity in their tissue, compared to a simple, primitive barnacle. But lower total protein concentration was added to the well, so perhaps the difference is in the process of preparing the sample for SDS PAGE (adding slightly more buffer/stain, etc.) Another interesting comparison is between my sample and lane 6 of figure 2, which is from a thermally stressed barnacle. The stressed barnacle sample produced many more, darker bands. The entire gel 1 (figure 2) looks darker however, so it is possible that the gel was stained longer, or destained for a shorter amount of time.
We did not get a chance to quantify the RNA extracted from our tissues. This will be done next week (10/20/09). Instead of using the spectrophotometer method,we will be using the nanodrop (necessary to measure absorbance at 260 nm).
10/6/2009
Summary
Today I began an RNA extraction on barnacle tissue. The homogenized sample (in TRI Reagent) was stored at -80, and the extraction will be continued Tuesday the 13th. I extracted protein from a complementary barnacle tissue sample, which was completed and quantified.
Procedures
Day 1 of RNA Extraction
Barnacle tissue (non-heat stressed), between 50-100 mg
1. 500 ul of TriReagent added, tissue homogenized
2. 500 ul additional TriReagent
3. Vortexed 15 s
Sample (total 1 ml) stored at -80
Protein Extraction
Complementary tissue from barnacle, 25 mg
1. Tissue homogenized in 500 ul of CellLytic
2. Centrifuged at max speed for 10 min
3. Supernatant transfered to new tube (super contains extracted protein)
Protein Quantification (Bradford)
15 ul of protein extract was diluted with 15 ul of DI water (Sample)
30 ul of DI water serves as blank
Both sample and blank were combined with 1.5 ml of Bradford reagent and incubated for 10 min. at RT
*The tube containing the sample is clearly blue, while the black is gray. This is to be expected.
Spectrophotometer was set to 595nm, blank set (A=0)
1 ml sample transferred to cuvette
measurement 1: A=.584
measurement 2 (after mixing): A=.556
average absorbance: A=.570
Protein concentration (ug/ml) calculated with standard curve provided:
y=1011.9x
x= .570
y=576.783 ug/ml
Multiply by 2 to account for dilution (necessary for protein concentration to fall in range of standard curve)
y=576.783 x 2= 1153.6 ug/ml of protein
Protein sample stored at 20C
Primer Design**
I chose to look at the gene for heat shock protein 70. My tissue is from a barnacle that was not thermally stressed, and Sonia and Sarah have tissue from a thermally stressed animal, so we will both look at the expression of HSP 70 to compare our results. I designed primers for the Balanus amphitrite HSP 70, but I do not know if this is the exact species of barnacle that my tissue is from. Heat shock proteins are highly conserved, so I am confident that these primers should work for my sample. The primer sequences were obtained on the NCBI website.
Primer, Forward: GAGCGGCTGATCGGAGACGC
Primer, Reverse: GATCTCCTCCGGCGCGAACG
Tm: 59.98
PCR product size: 216 bp
Conclusions
The value of 1153.6 ug/ml of protein falls within the range designated by the standard curve, so I conclude that the extraction was successful. The next step is SDS PAGE (Polyacrylamide gel electrophoresis). On 10/13/09 the RNA extraction will be continued, and the RNA sample will be quantified. || ||