Lab 7 con't:
Finished RNA extractions on samples. All placed in -80*C freezer in Roberts lab.
11/18/2014
Lab 7 con't:
Oysters were removed from cold tank. Katie and Russel shucked and excised tissue sample. Olga and Sophie homogenized tissue and placed in tri-reagent. Pat and myself labeled tubes and filled tubes completely with tri-reagent. Sophie and myself continued and finished the RNA extraction on the control, virginica, and mechanical -> heat samples then plated the 24 samples for qPCR. The qPCR was run to test for carryover DNA, which was not present. Samples were placed in the Robert's lab -80*C freezer
11/17/2014
Lab 7: Oysters on a plate shaker
Russel and Pat prepared the 40 oysters for the experiment. I came in after their heat shock, placed the heat -> mechanical oysters on the plate shaker for 10 minutes and bagged the rest of the oysters. They all eventually were placed in the cold room tank for resting.
11/11/2014
No lab.
11/3/2014
Lab 6: Primer Reconstitution, dilution, and test pcr
We received primers this week and began the lab by reconstituting them from dried form.
Primers were reconstituted with nanopure water to a 1:10 concentration(ex. SB_Cg_SOD_F was reconstituted with 343 uL of nanopure water).
This created our concentrated stock.
To create a working stock, we diluted the concentrated stock a further 1 log fold. Final working stock concentration was 1:100 that of the starting dried stock.
Testing Primers
We chose to test our C. gigas primers with the previously extracted C. gigas cDNA from Lab 2, on 10/7/2014. C. virginica primers were tested with previously
extracted cDNA from oil exposed oysters.
We followed the same protocol from Lab 3 on 10/14/2014 for the PCR Master Mix. It is as follows.
qPCR Mix:
- 12.5 uL SsoFast EvaGreen Supermix
- 0.5 uL 10x Upstream Primer for Elongation Protein
- 0.5 uL 10x Downstream Primer for Elongation Protein
- 10.5 uL Nuclease Free Water
The results are as follows.
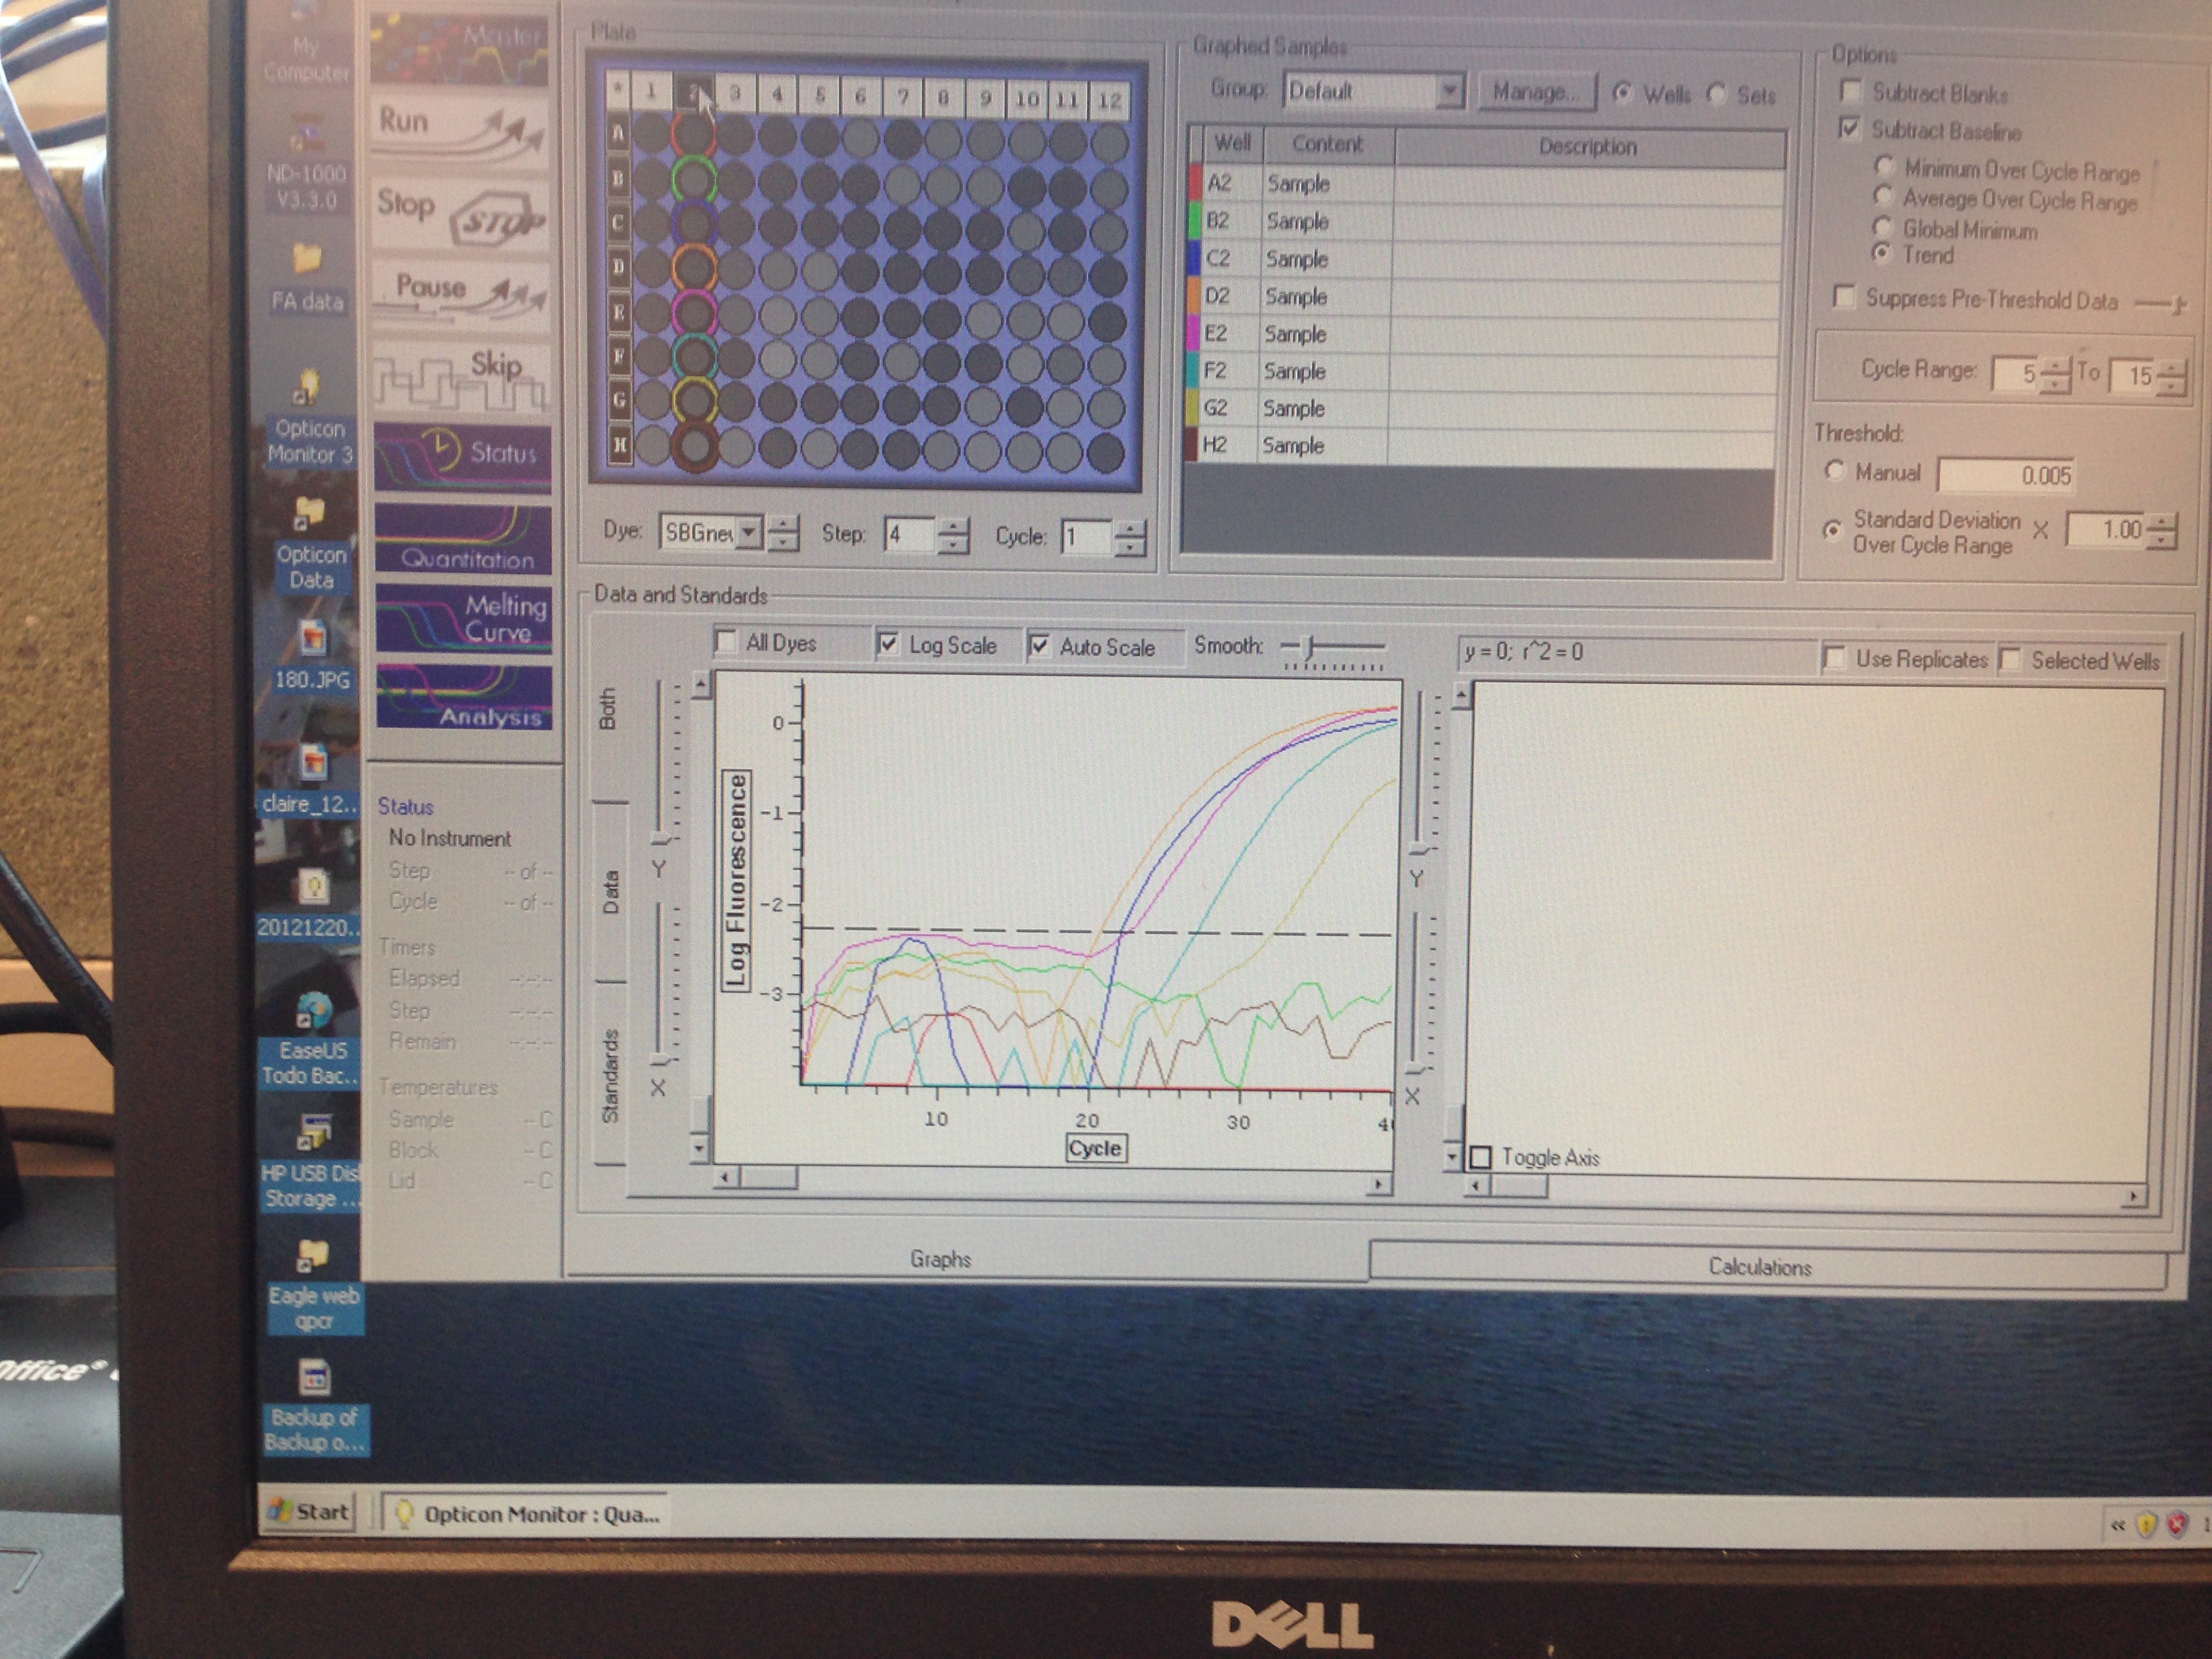
- Superoxide Dismutase quantification curve (C. gigas)
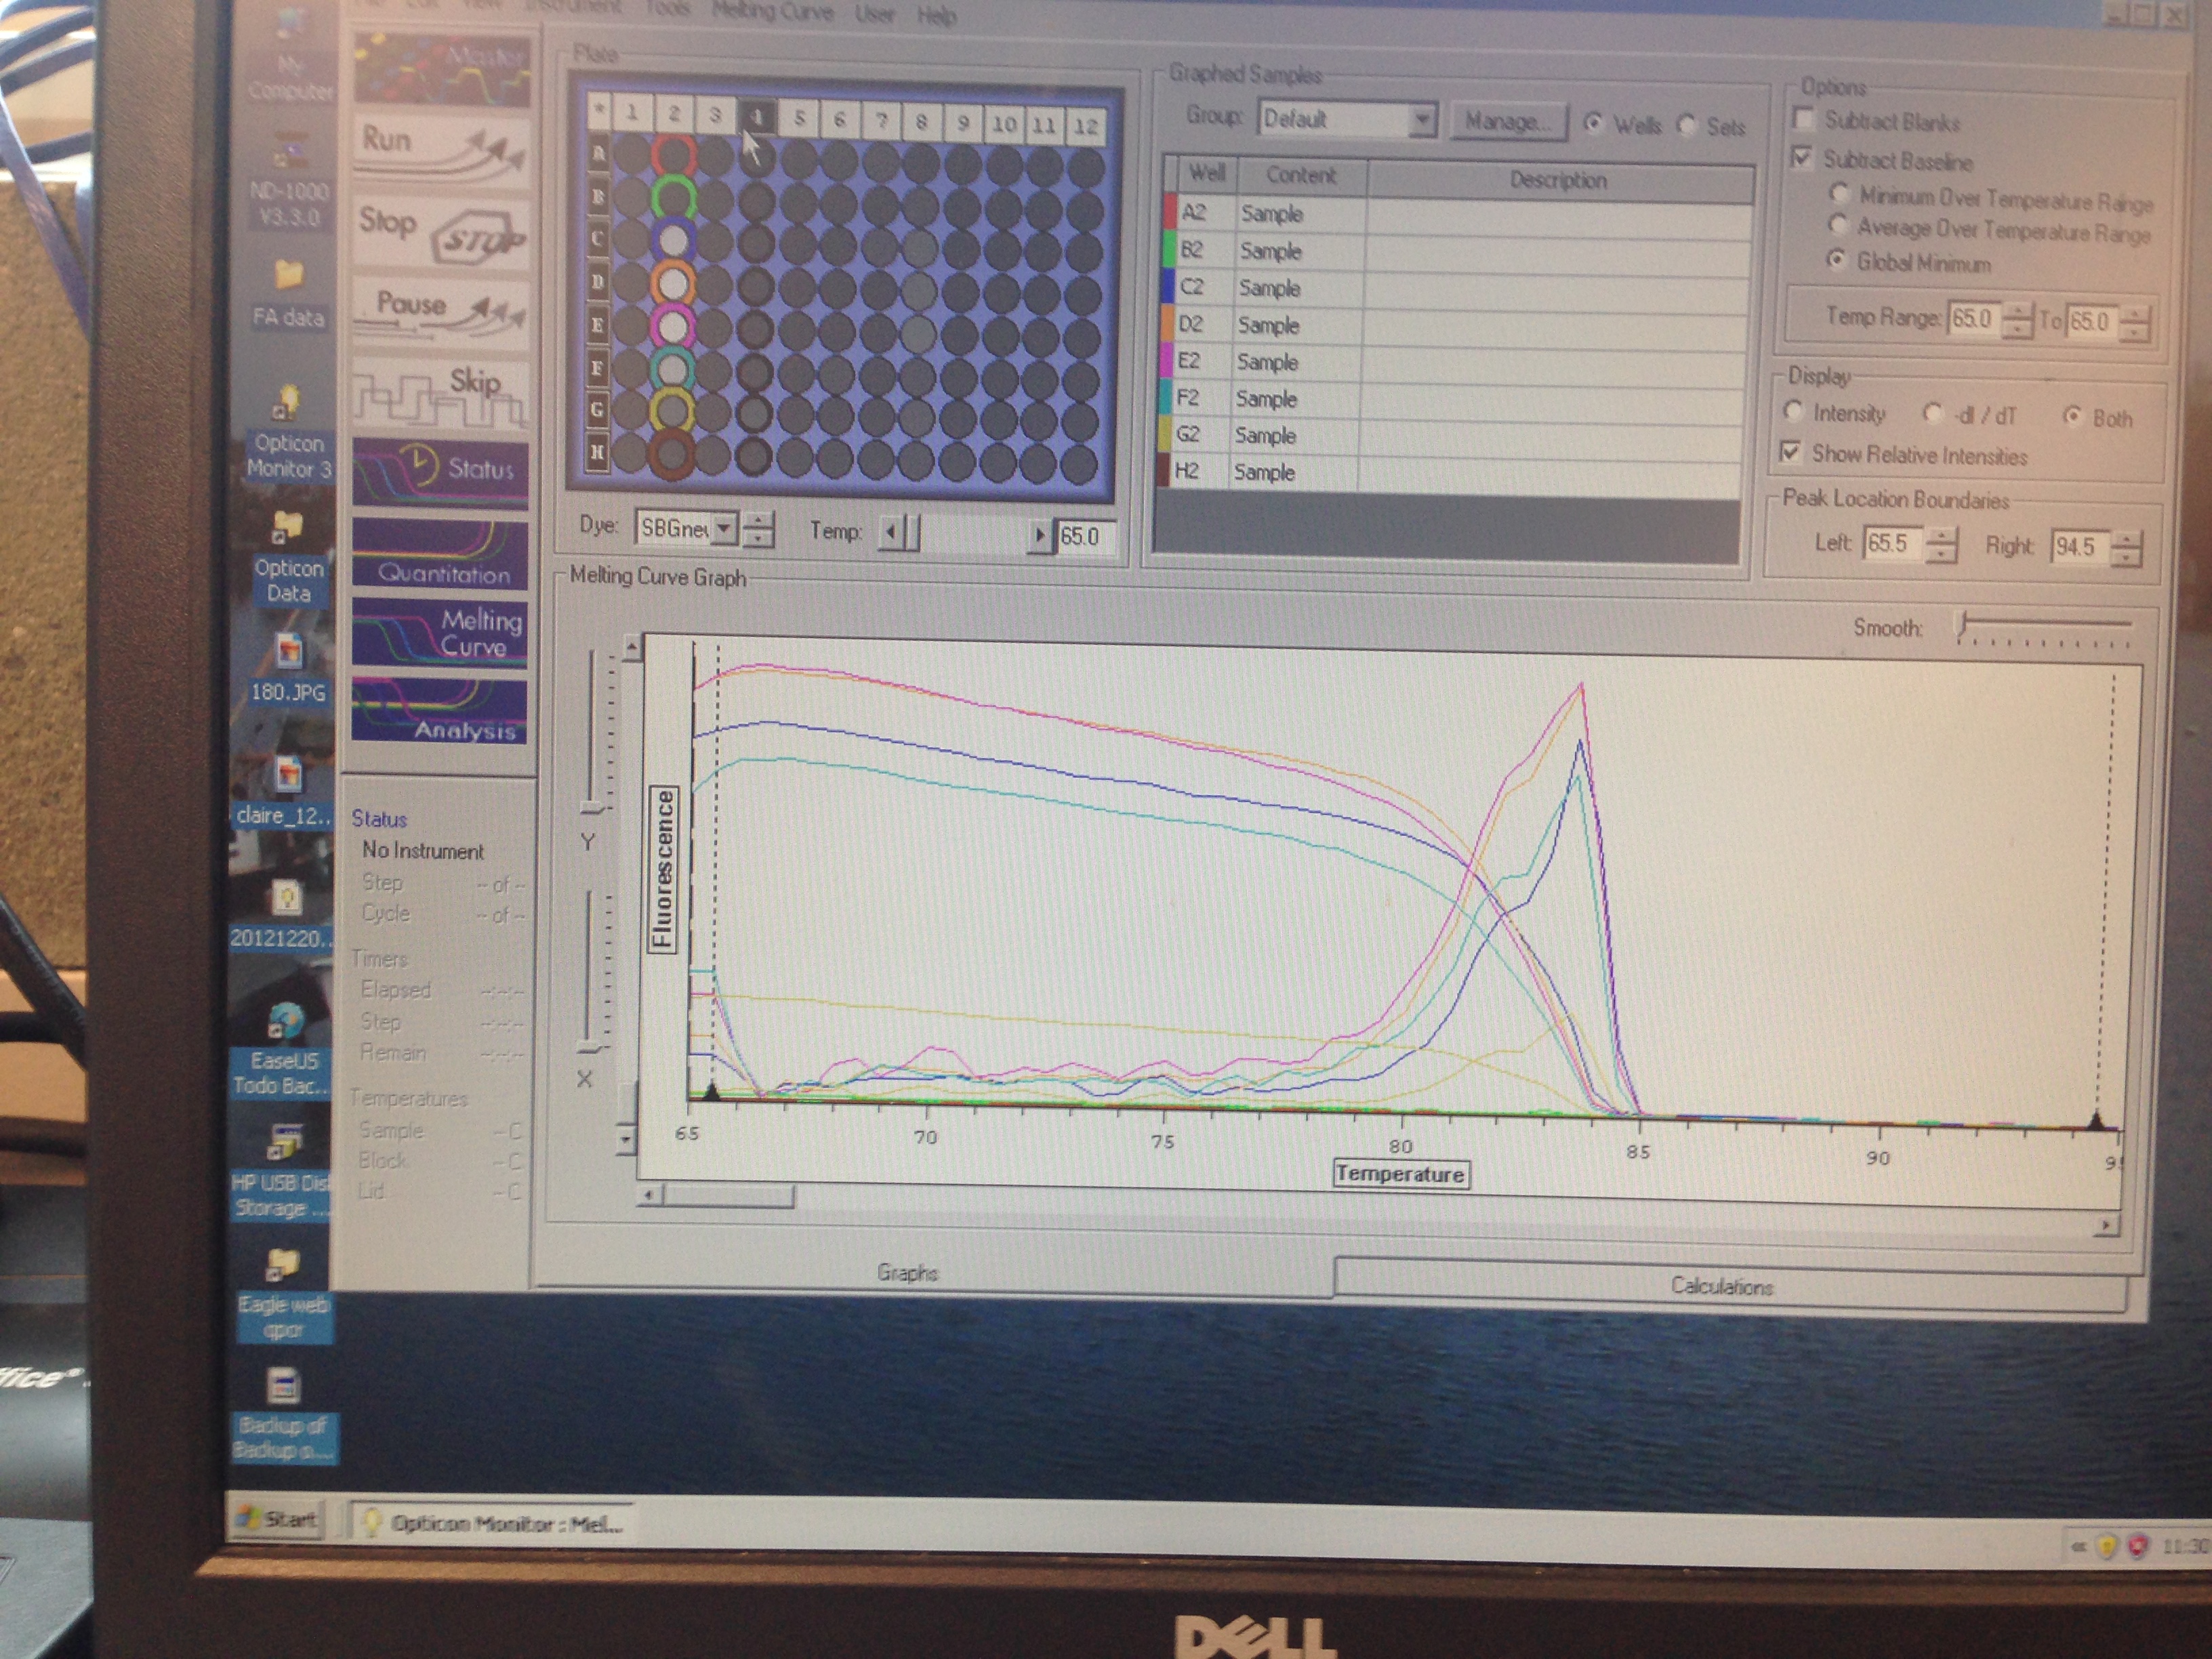
- Superoxide Dismutase Melt curve (C. gigas)
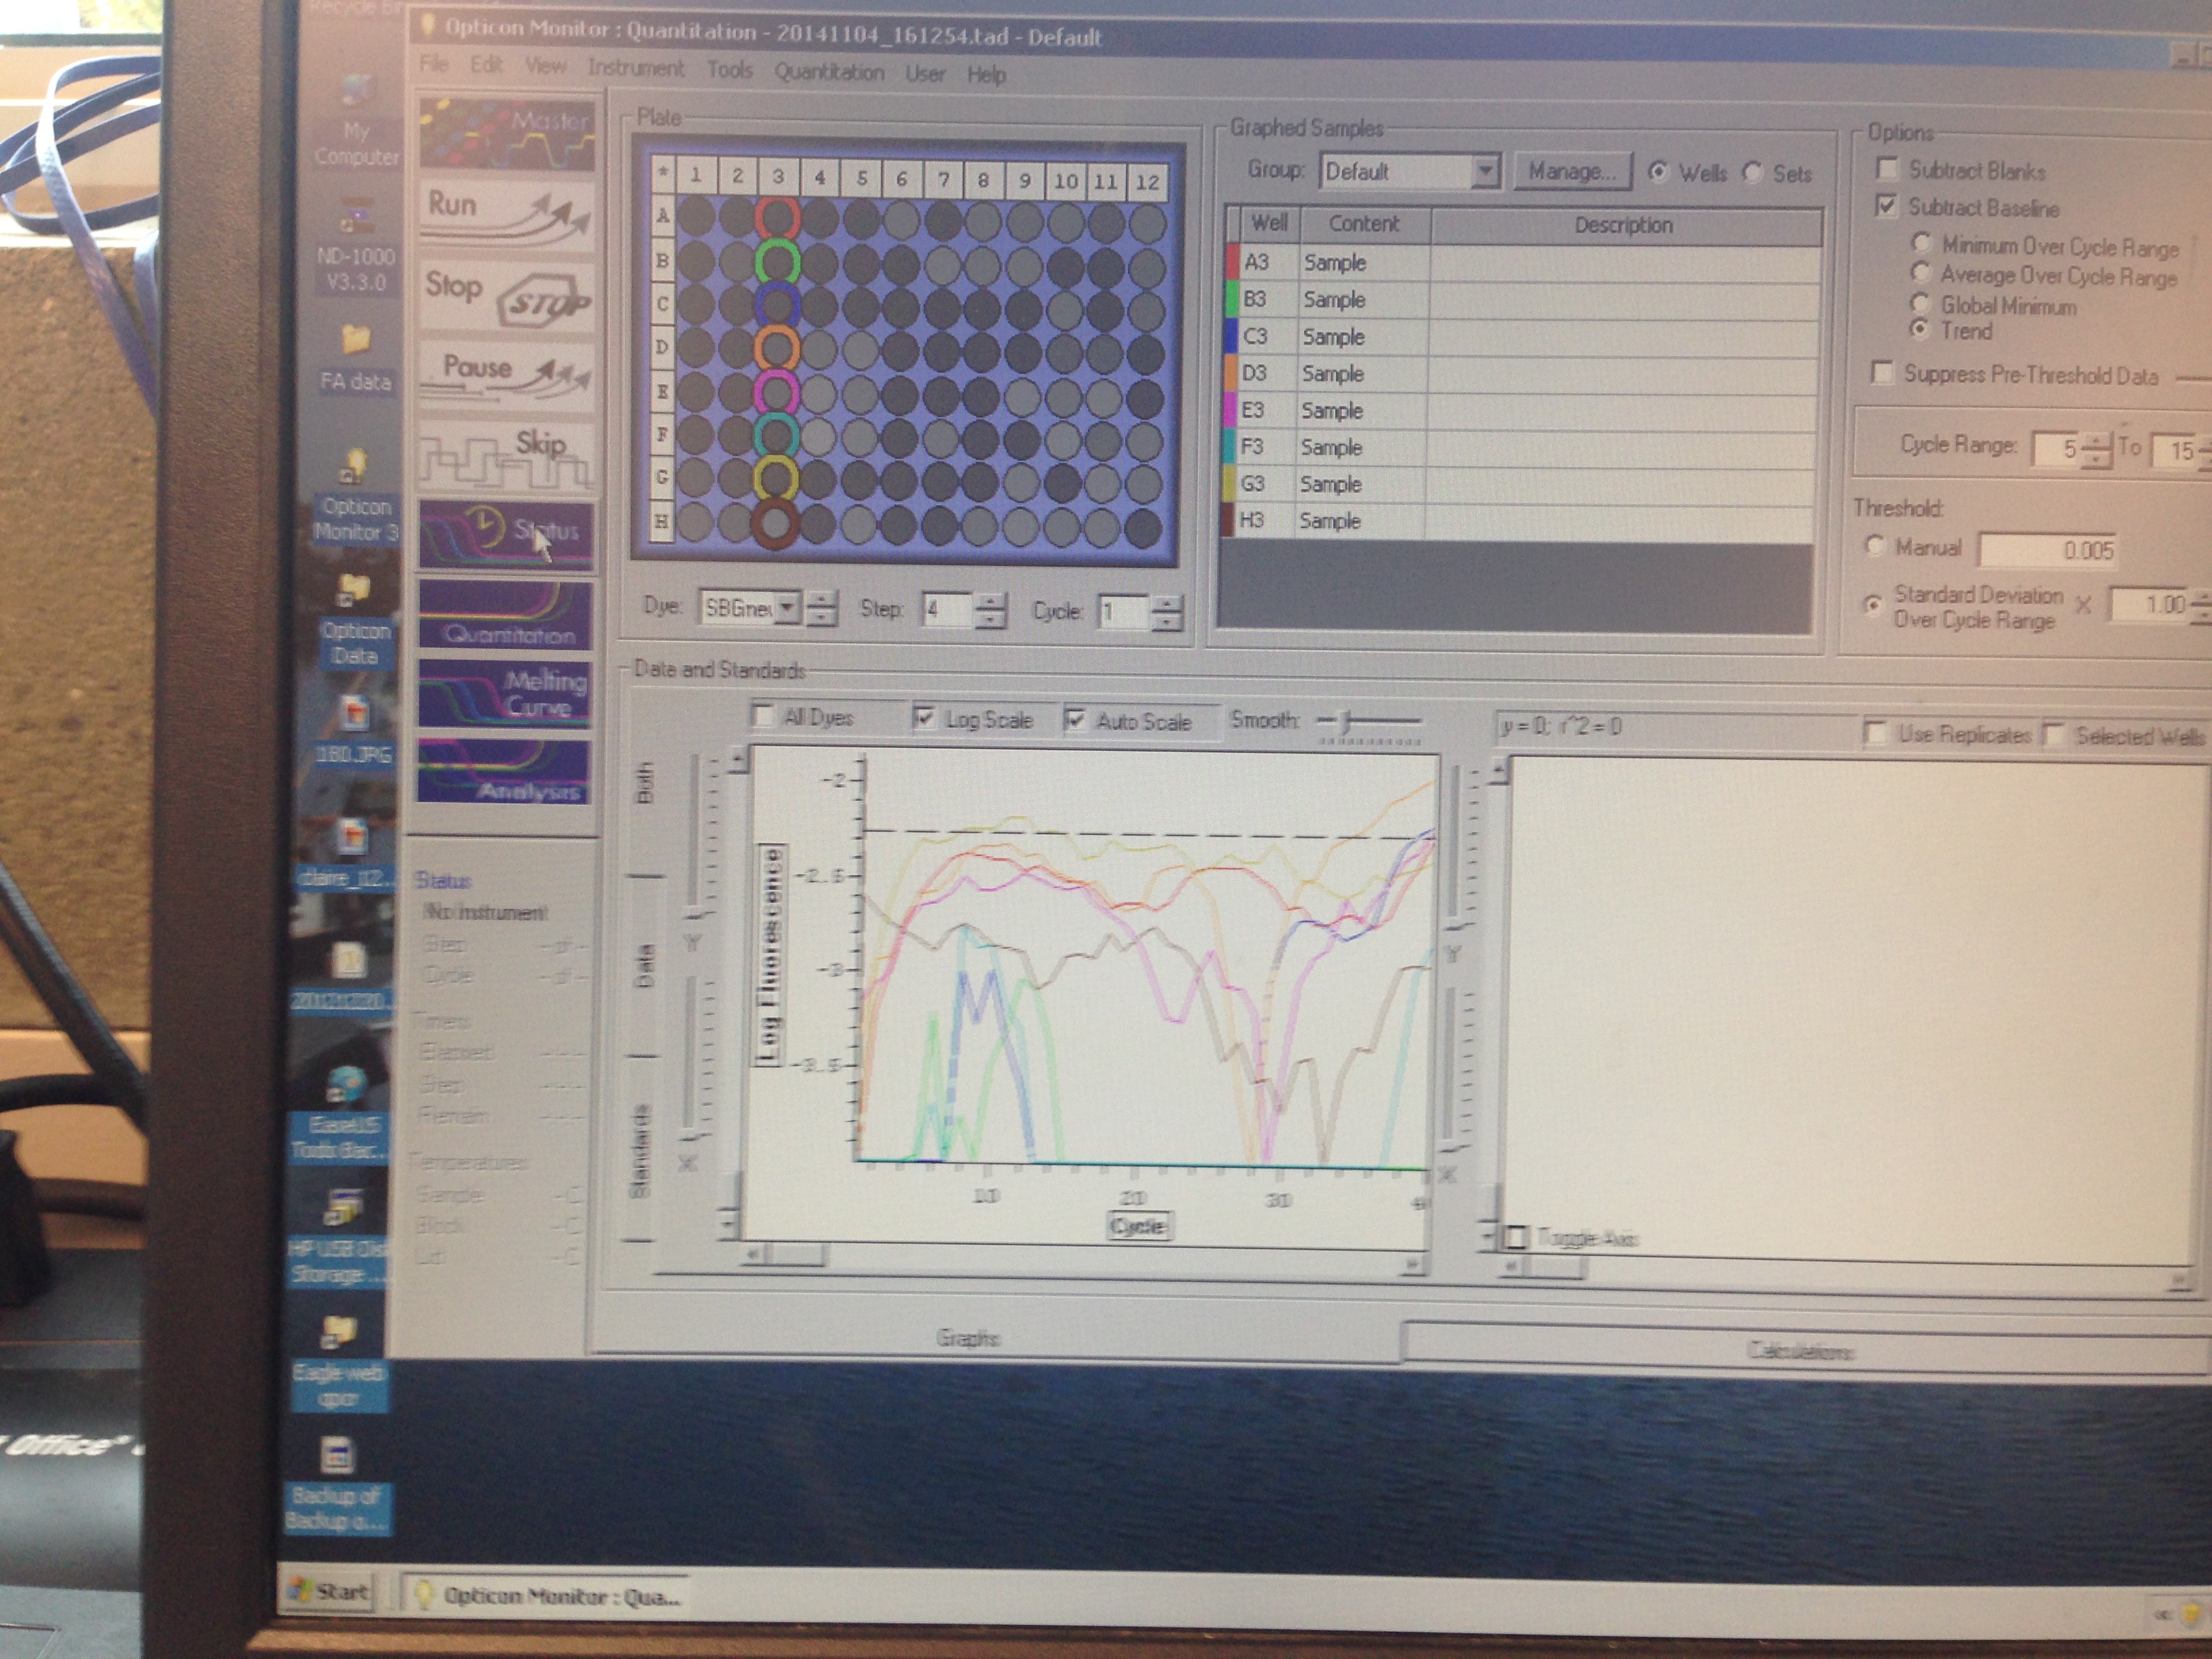
- Metallothionein quantification curve (C. virginica)
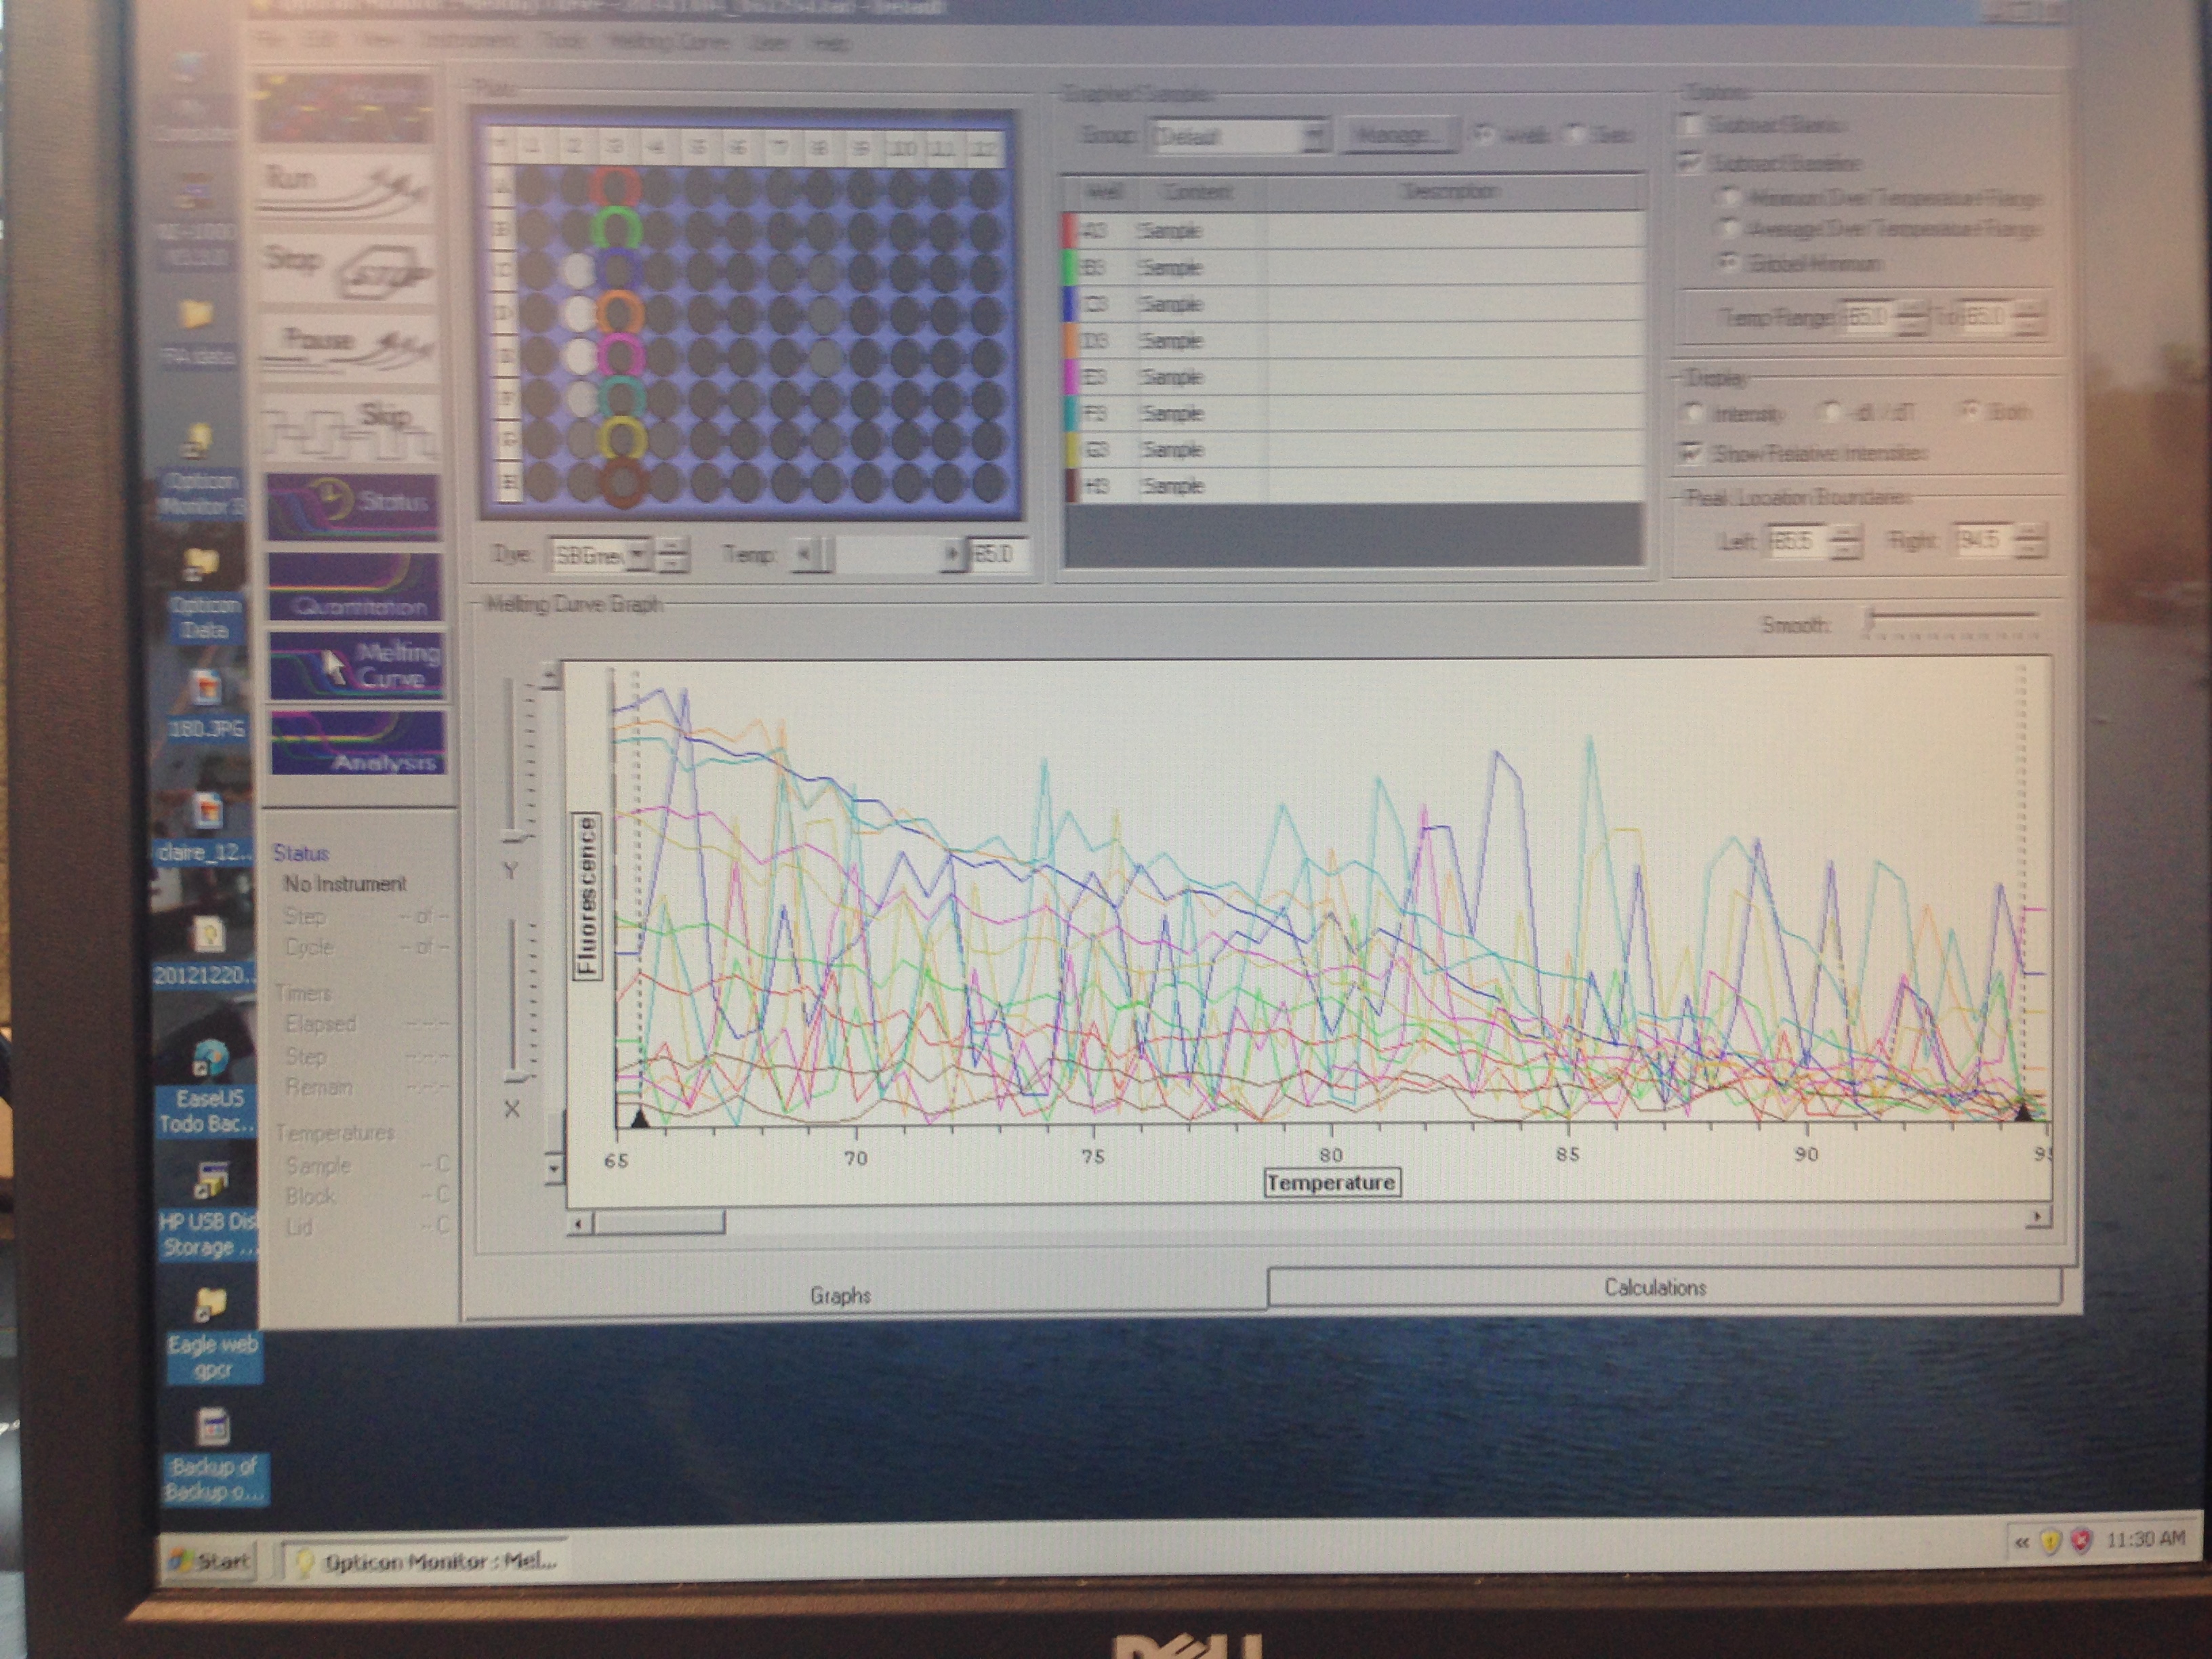
- Metallothionein melt curve(C. virginica)
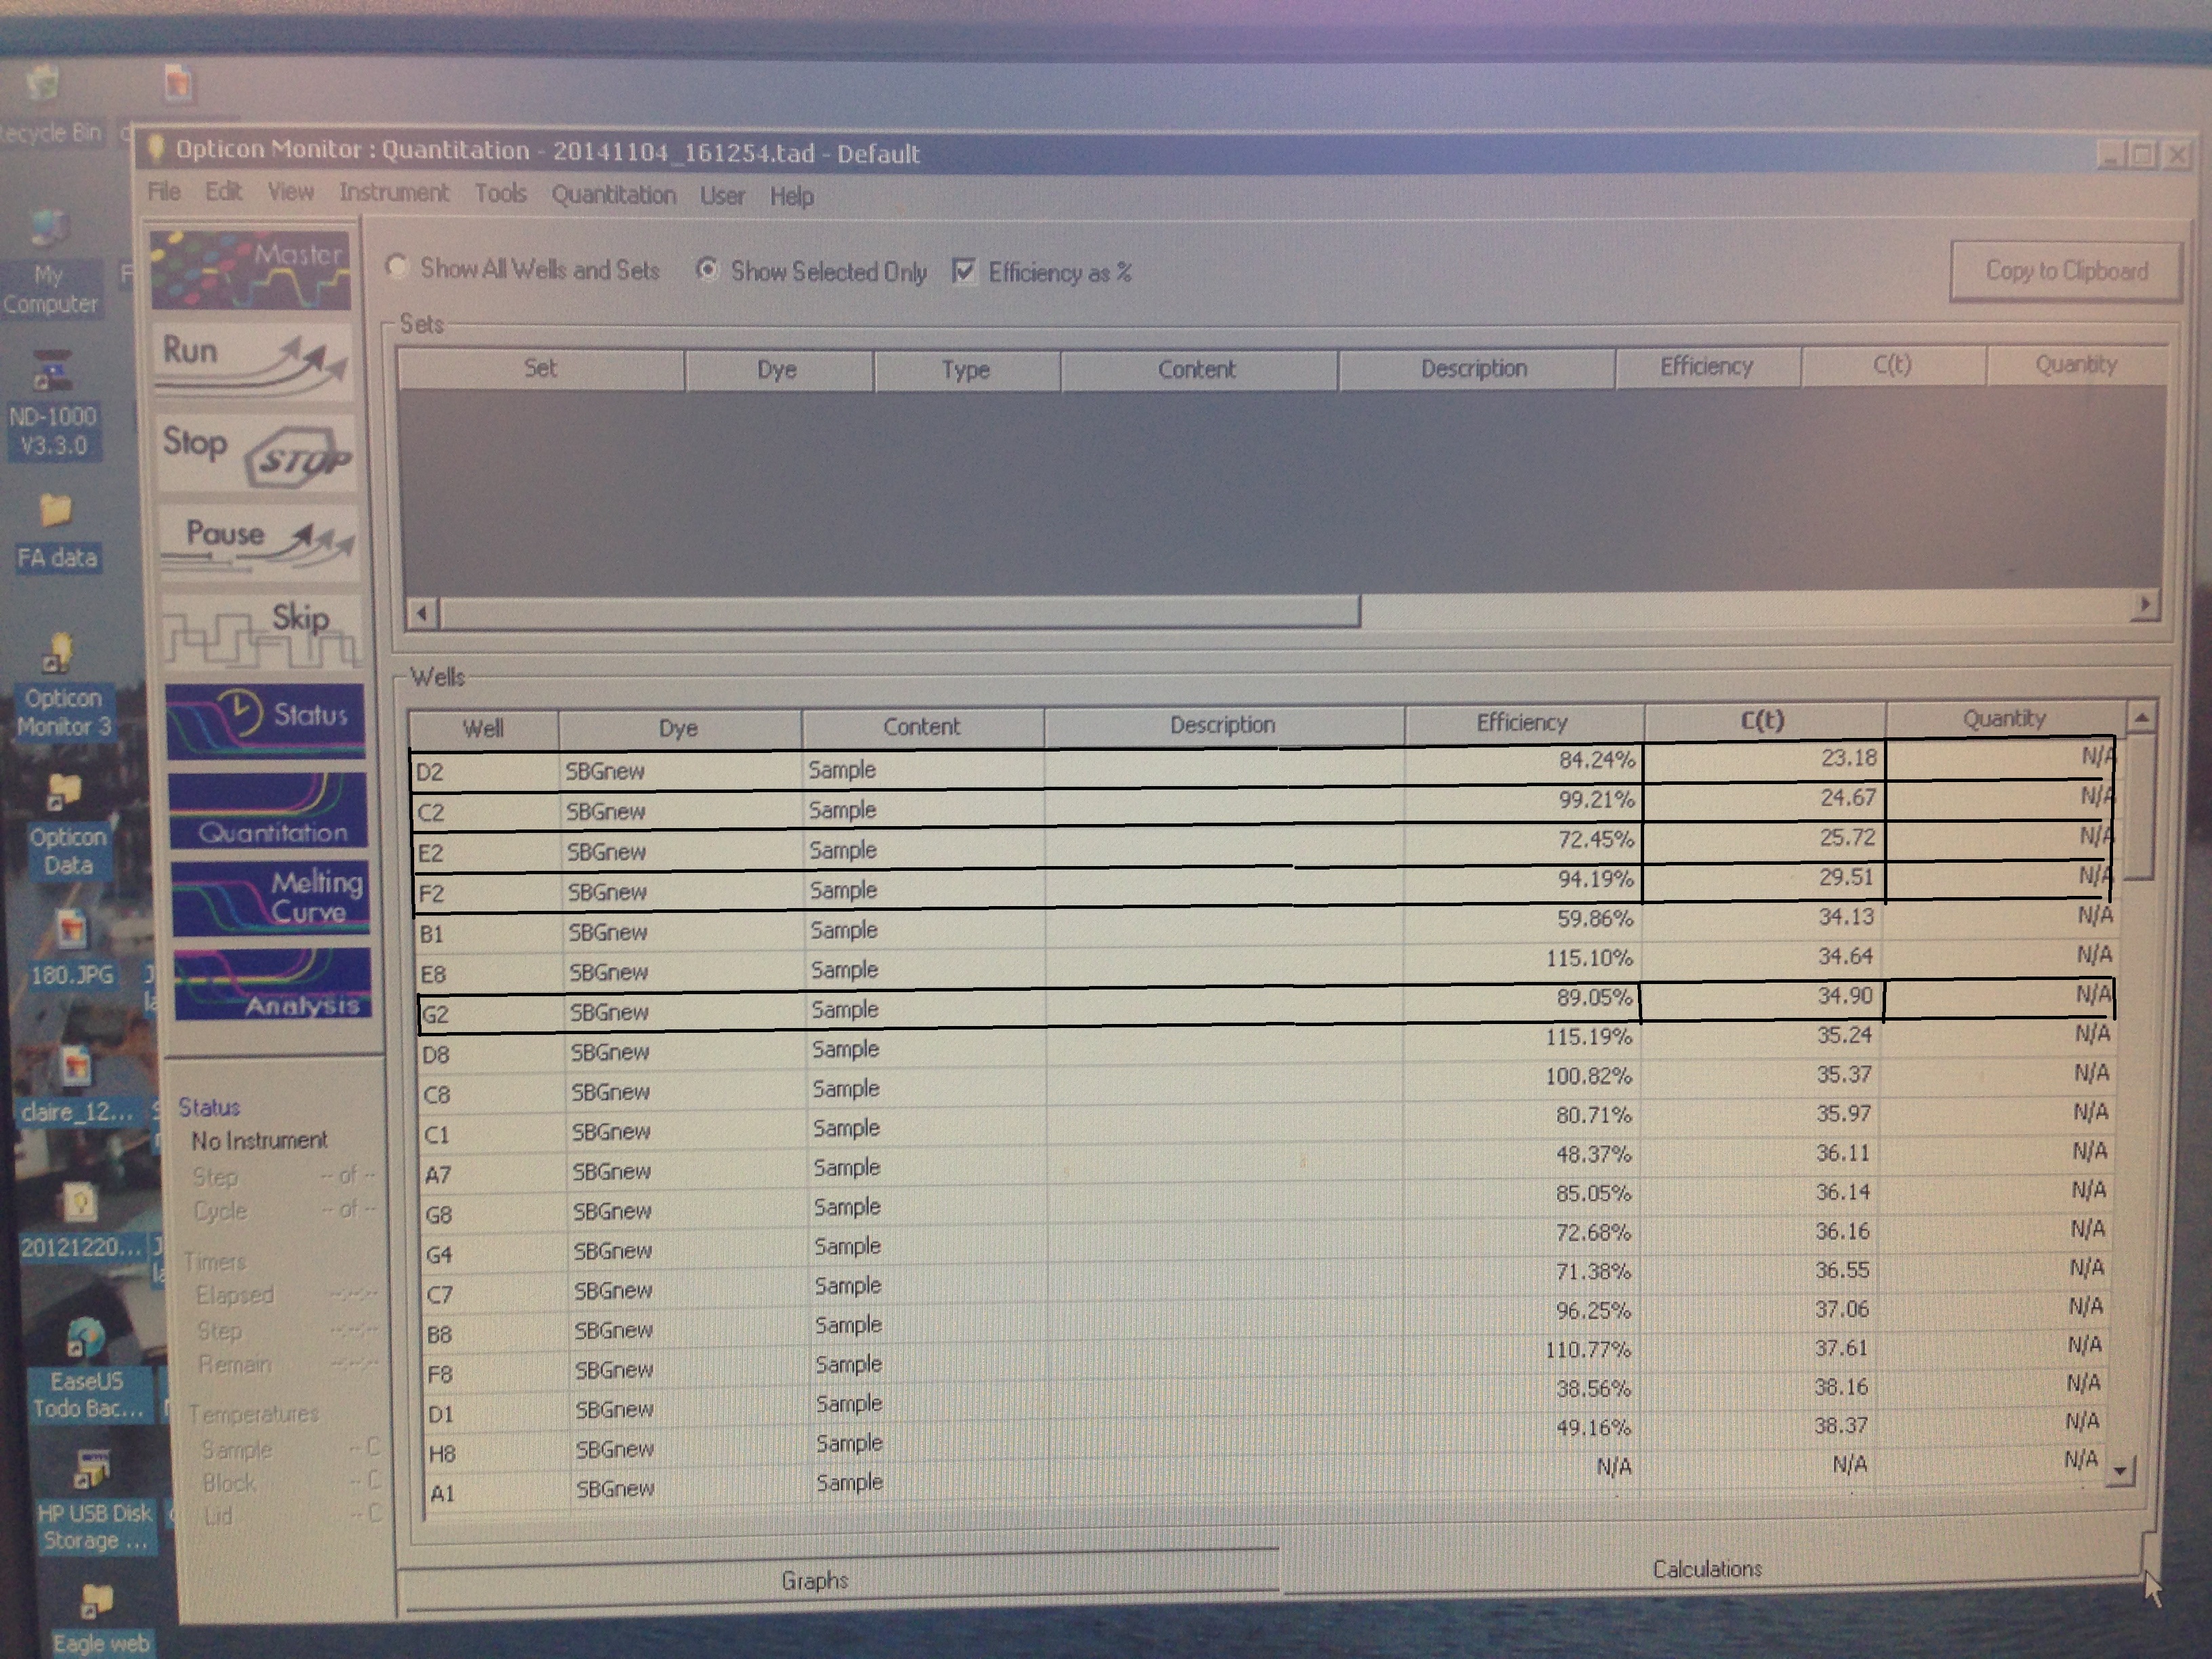
- C(t) numbers. Relevant ones bolded.
Observation/Thoughts:
C(t) numbers for the Superoxide Dismutase primer looks acceptable. The melt curve is questionable as it looks as though there could be two products being replicated by the primers. This may require a second test run to see if it continues.
The Metallothionein primer failed to amplify any product. There are two potential reasons for this. First, the primer could be a poor primer for the target DNA and fail to replicate anything. Secondly, and in my opinion more likely, possibility is that the tissue didn't have any of targeted protein being expressed so there was nothing to amplify. Further assays will be required to see which is the case.
Reflections:
Choosing primers is not an exact science. There is some trial and error, both with the NCBI primer design tool, and with the tissue sample chosen. Multiple test runs with multiple animals seem required to say anything for sure regarding the efficacy of any set of primers.
10/28/2014
Lab 5: Planning Experiment, Primer Design, and BLASTing.
After some class discussion we've decided to conduct an experiment on the Pacific Oyster (Crassostrea gigas). We will look at multiple genetic stress markers, including HSP70, CYP450, and Superoxide Dismutase. Our stresses will be two-fold, a heat shock as well as a mechanical stress, likely a spin in a centrifuge. After deciding what we would do, we began prep work by choosing primers.
Primers were chosen via the NCBI Primer Design tool. First, we opened the NCBI Nucleotide page.
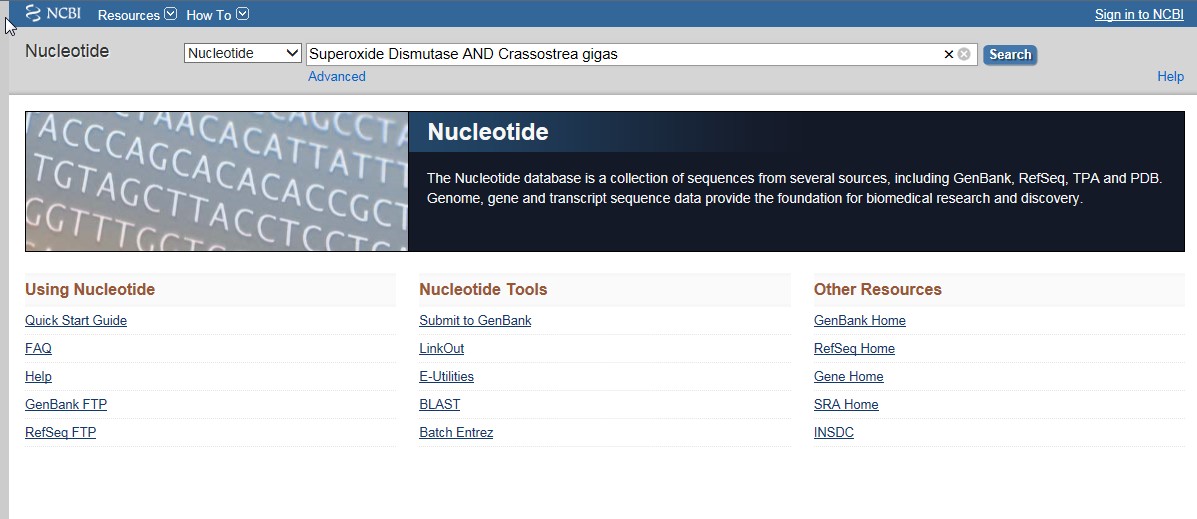
I chose the extracellular hemocyte Superoxide Dismutase gene, as it was the most complete gene.

I Used the Pick Primer command, and the nr database and then allowed the design tool to create primers.
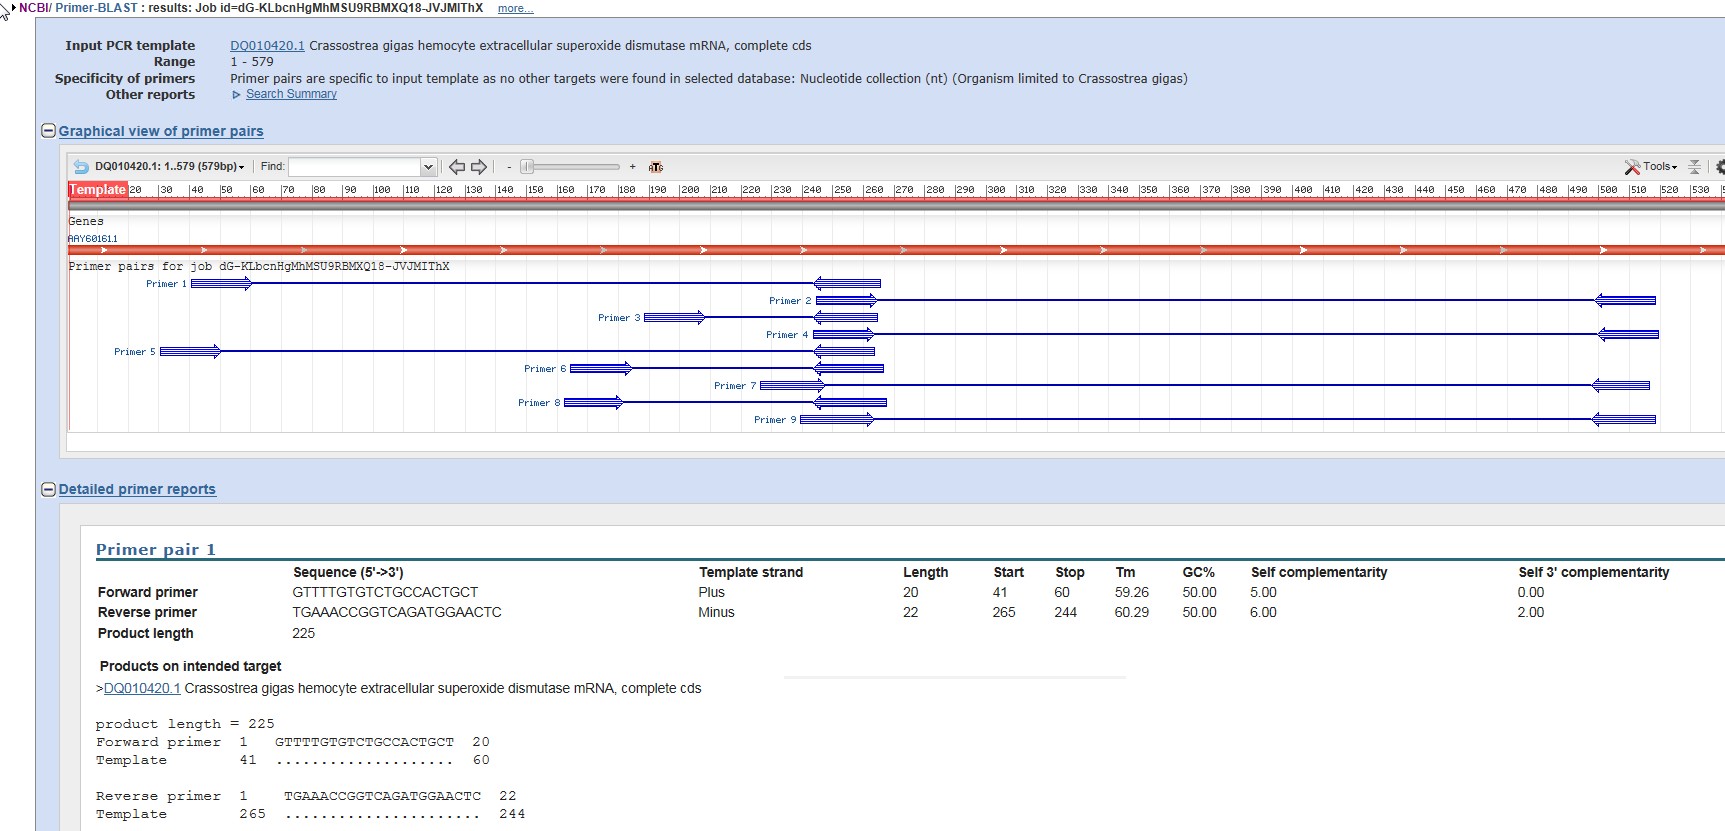
I chose these primers from the design tool.
I also ran a BLAST, just for curiosity's sake.
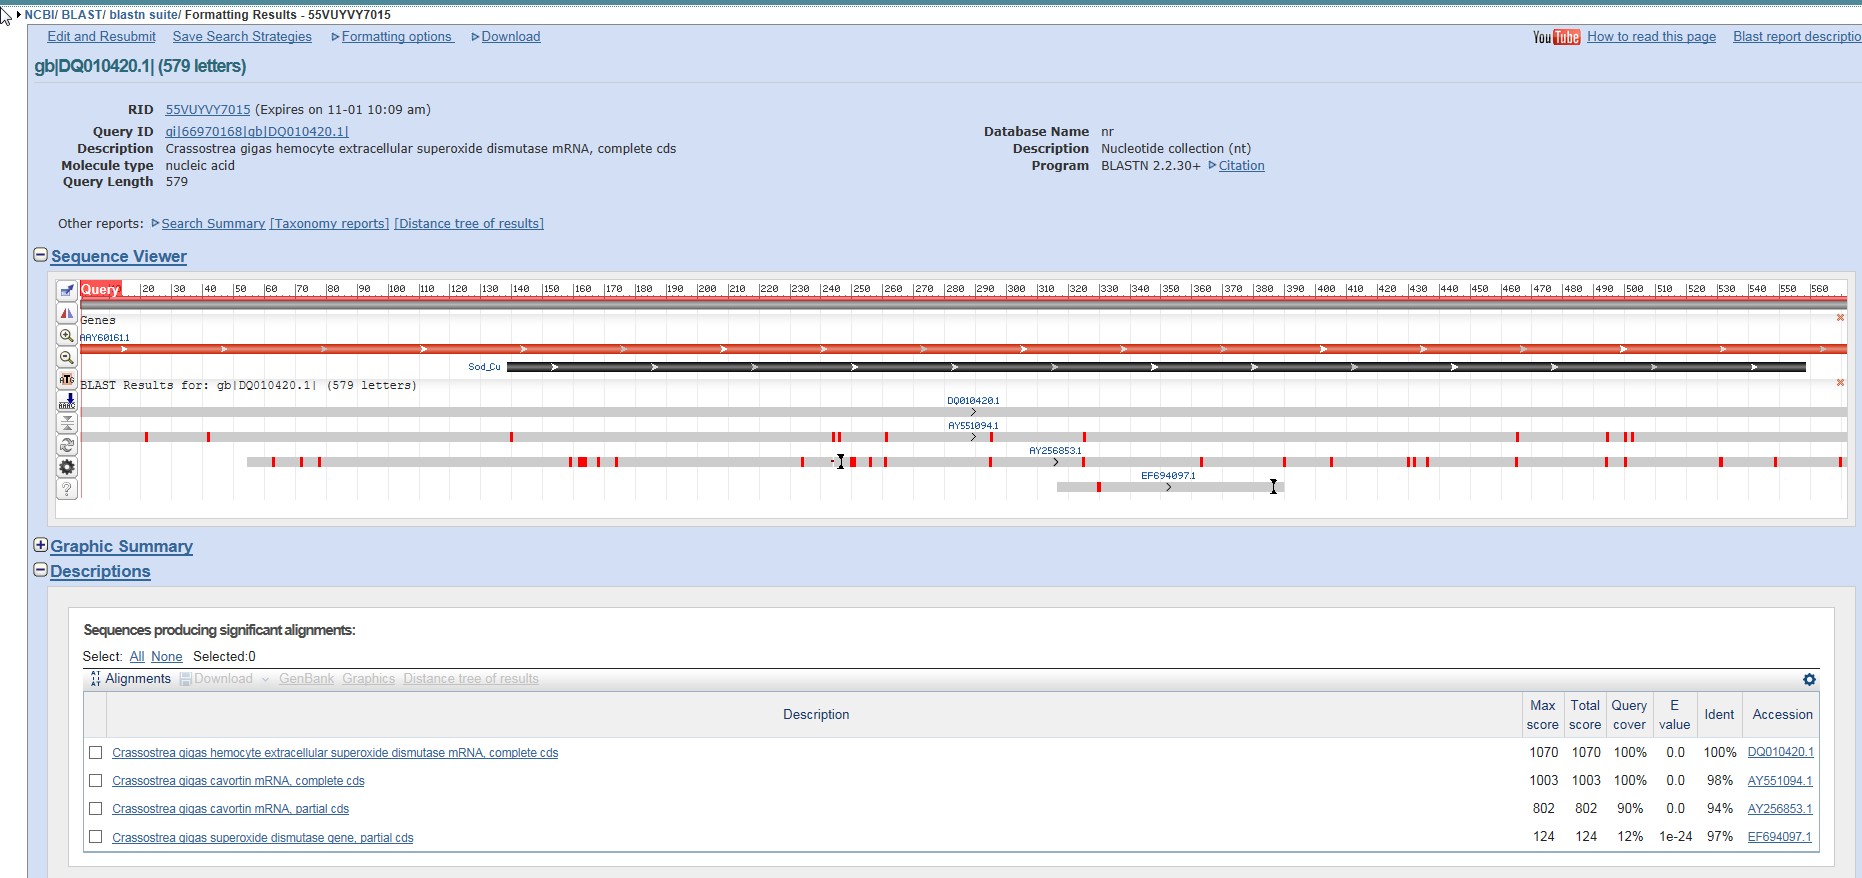
Another set of Superoxide Dismutase genes came up, but curiously enough, something called Cavortin did as well. Could potentially be another name for Superoxide Dismutase, further inquiry will be needed.
Fish441Proposal.docx
10/21/2014
Lab 4: SDS-PAGE/Western Blot, cPCR of qPCR products
Summary:
Using the protein sample from NB21 we will run first an SDS Polyacrylamide Gel Electrophoresis followed by a Western Blot on the resulting gel from SDS-PAGE targeting HSP70. We will also run a cPCR of the products of our previous qPCR reaction.
Materials:
Reagents:
SDS-PAGE
- 2x SDS Reducing Sample Buffer
- Gel Running Buffer
Western Blot
-Nanopure Water
- Primary Antibody Solution
- Secondary Antibody Solution
- Antibody Wash
- Chromogenic Substrate
- Tris-Glycine Buffer
- Blocking Solution
- Coomassie Brilliant Blue
- Acetic Acid Wash
cPCR
- 500 bp ladder solution
Consumables:
SDS-PAGE
- Pipette Tips
- 1.5 mL Screwtop Tubes
- Protein Ladder Marker
- SDS-PAGE Gel
Western Blot
- Nitrocellulose Membrane
- Filter Paper
Tools:
SDS-PAGE
- Micropipettes
- Protein Gel Box
- Power Supply
- Platform Rocker
- Light Box
- Heating Block
- Glass Container
Western Blot
- Semi-dry Transfer Station
- Gel Staining Tray
cPCR
- Gel Box
Methods:
SDS-PAGE
(Done by Dr. Roberts)
Starting with boiling water, add 15 uL of protein sample to a 1.5 mL screwcap tube as well as 15 uL of 2x sample reducing buffer. Flick sample to mix and boil for 5 minutes. Assemble gel and gel box. Centrifuge for 1 min. to pool liquid and pipette onto gel using gel loading tip. Assemble gel box with loaded gel. Plug box into power supply, set to 150V, and run for 45 minutes.
(Done by class)
Remove and carefully disassemble gel box and remove gel, notching edge to assist in determining orientation later.
Western Blot
(Protocol adapted from https://tools.lifetechnologies.com/content/sfs/manuals/westernbreezechromo_man.pdf)
Soak filter paper in Tris-Glycene buffer well, and then squeege with a falcon tube to remove any bubbles in the filter sandwich. Wipe up any excess liquid. Assemble full sandwich on Anode plate for transfer station, order goes: Anode, Filter Paper, Membrane, SDS-PAGE Gel, Filter Paper, Cathode. Connect to power supply and run for 30 minutes at 20V to transfer protein to membrane. Break sandwich apart and place gel and membrane in two different gel staining trays. Place both trays on platform rocker and turn on.
Membrane
Rinse membrane with 20 mL of nanopure water for 5 minutes then decant. Incubate for 1 hour with 10 mL of primary antibody solution. After incubation, decant and then rinse 3 times with 20 mL of antibody wash for 5 minutes each time. Decant in between washes. Incubate with 10 mL of secondary antibody solution for 1 hour. Rinse following same procedure as previously with 20 mL of antibody with 5 minute incubation. Apply chromogenic substrate and wait for purple band to show up, can take between 5 and 60 minutes.
Gel
Rinse gel with nanopure water with 5 minute incubation and then decant. Add Coomassie Brilliant Blue, enough to cover, and incubate for 5 minutes. Wash with acetic acid 3 times with 5 minute incubation and decanting after each incubation. After rinsing, purple bands should appear in the gel indicating protein.
cPCR
Gel was made previously. Pipette 7 uL of ladder solution into leftmost lane. Pipette 20 uL qPCR sample into following lanes. Assemble box, plug in to power supply, and run gel at 100V for 1 hour. Remove gel, visualize on UV transilluminator.
Results:
No meaningful results from Western Blot.
Gel Staining-
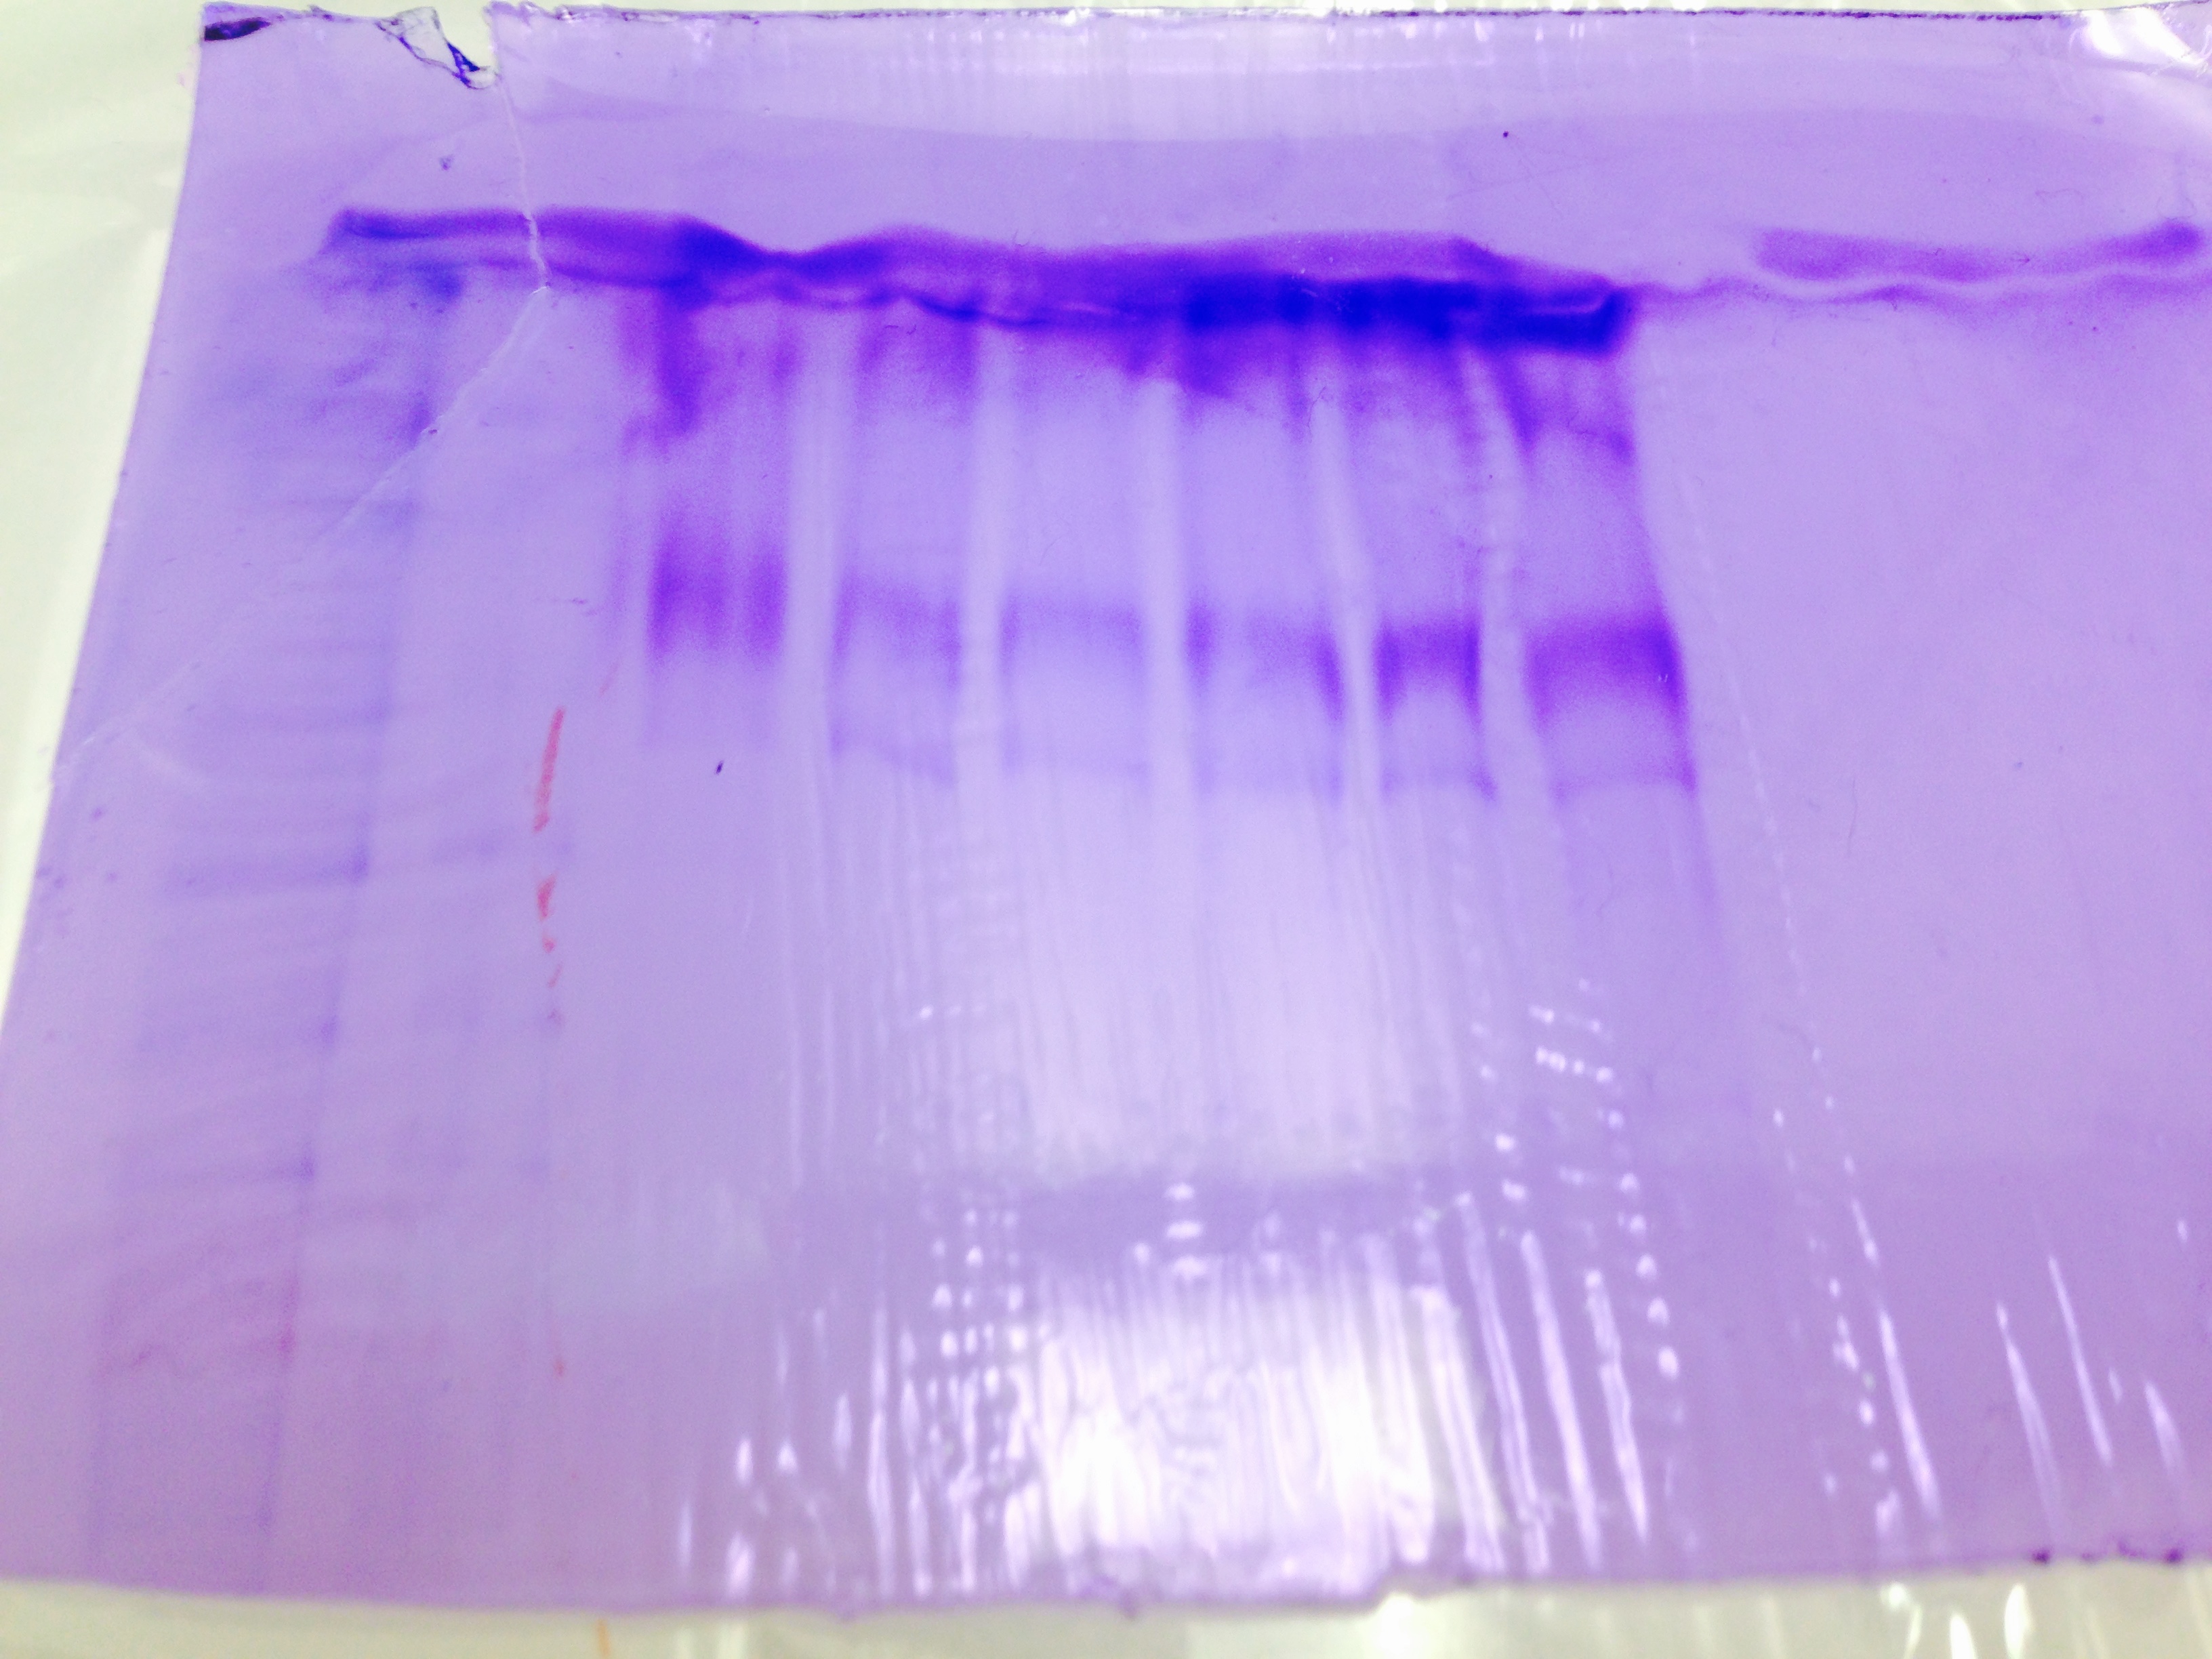
Gel stain results are difficult to determine any meaning. They all look however to be roughly the same molecular size.
cPCR results show a strong band between 200 and 300 base pairs.
Deviations:
Primary and Secondary antibody incubation steps were both cut short, around 35-40 minutes in length. cPCR gel was ran for 1 hour and 20 minutes.
Conclusions:
The western blot was inconclusive, with no definitive banding showing up. Unsure of why this was, unless antibody incubations are time critical steps. Dying of SDS-PAGE gel shows a band, but the ladder is difficult to interpret. cPCR results show a band at a believable molecular weight for the target Elongation Factor.
Reflections:
Western Blotting takes a long amount of time. I could see how it would be a useful lab assay, given the existence of an antibody pair for your target protein. It also allows you to get other stuff done during the waiting steps. More information on the protocol and how time sensitive each step actually is would be useful for perhaps some optimization for more frequent use. Example, if the primary antibody really only needs half an hour of incubation as opposed to the full hour, that's a fairly decent time savings over multiple blots. cPCR works like it always does, the results always look super cool to show to other people. Would like to know more about the process of cutting out the band and sequencing it, how it works etc.
10/14/2014
Lab 3: Reverse Transcription, qPCR, Protein Isolation, and Agarose Gel mix/pour
Summary:
This lab has multiple goals. First, using Reverse Transcriptase to reverse transcribe the previously isolated RNA into cDNA then run a qPCR on cDNA. During downtime we will isolate protein in a provided tissue sample, and mix an agarose gel for future cPCR.
Sample Information:
For protein Extraction I used sample NB21, which weighed 0.024g
Materials:
Reagents:
Master Mix 1 for For 5 uL of RNA:
- 12.5 uL Nuclease Free Water
- 0.5 uL Oglionucleotides
Master Mix 2:
- 5 uL M-MLV 5X Reaction Buffer
- 1.25 uL DNTPs
- 0.5 M-MLV Reverse Transcriptase
- 0.5 uL Nuclease Free Water
qPCR Mix:
- 12.5 uL SsoFast EvaGreen Supermix
- 0.5 uL 10x Upstream Primer for Elongation Protein
- 0.5 uL 10x Downstream Primer for Elongation Protein
- 10.5 uL Nuclease Free Water
Agarose Gel:
- 1g Agarose powder
- 75 mL low TE buffer
- 6 uL Ethidium Bromide
Protein Extraction:
- 500 uL CellLytic MT solution
Containers/Consumables:
- 1.5 mL micro-centrifuge tubes
- pipette tips (1-1000 uL sizes)
- 96 Wellplate for qPCR (White)
- Clear Wellplate Cap Strips
- 0.5 mL clear PCR tubes
- Kimwipes
- Disposable Pestle
Tools:
- pipettes (1-1000 uL)
- refrigerated centrifuge
- desktop centrifuge
- tube racks
- ice bucket w/ ice
- thermal cylcer
- Opticon thermal cycler
- Gel comb and tray
Methods:
RNA Extraction/cDNA amplification:
After thawing and mixing previously isolated RNA, mix Master Mix 1 in a new 0.5 mL PCR tube, then add 5 uL of isolated RNA. Incubate this for 5 minutes at 70*C thermal cycler. After incubation, add reagents for second Master Mix and incubate at 42*C in the thermal cycler for 60 minutes. After 60 minute incubation heat inactivate the transcriptase by increasing heat to 70*C for 3 minutes. Note: These numbers are for a single reaction, if you have more than one reaction, increase appropriately.
qPCR Analysis for Elongation Protein:
While cDNA is amplifying. Mix qPCR master mix and pipette into well in 96 well plate. As before, the amounts are for a single reaction, scale up as appropriate for number of reactions. Cover loosely with cap strip until cDNA is finished. When cDNA is available, add 1 uL to the well. Snap cap strip over wells. Wipe cap strip with Kimwipe to clean and ensure properly closed. Load in Opticon machine, select proper thermal profile. Hit go and wait.
Protein Extraction:
Select a protein sample. Add 500 uL CellLytic MT solution. Homogenize with disposable pestle. Centrifuge in refrigerated centrifuge at maximum speed for 10 minutes. Store in lab freezer for future use.
Agarose Gel Mixing and Pouring:
1 gram of agarose powder was weighed out in a weigh boat on a top loading scale. 75 mL of 1x low TE buffer was added to powder in an Erlenmeyer flask and then microwaved for 3 minutes stopping to stir every minute. 6 uL of ethidium bromide was added to the mixture and then it was poured into a 12 lane gel tray, with the comb already placed in one side. Tray was allowed to cool and then covered and placed in a refrigerator for later use.
Results:
C(t) results:

Curve Results:

Melt Curve results:

The Melt curve shows that there was just a single product in the sample. The C(t) curve shows that it came up around 15.99 cycles. Since we had no standard curve loaded there is nothing to compare this to, so we can't quantify how much Elongation protein there was available.
The protein extraction was not quantified, so there are no results to show until further analysis is performed.
Conclusion:
We achieved measurable elongation factor in the qPCR test, which was to be expected. Since we did not have a standard curve loaded, there is nothing to compare it to for quantification. The melt curve shows that there was a single result, which leads one to assume that there was little to no contamination of the cDNA tested for.
Protein extraction went as to be expected with little fanfare. Agarose Gel making was similar.
10/7/2014
Lab 2: RNA Extraction and Isolation
Summary:
Using the previously excised sample oyster gill tissue we isolated RNA using the protocol for Tri-Reagent. We then quantified the RNA isolated via a Nanodrop spectrophotometer.
Materials:
- Previously excised gill sample, stored in tri-reagent
- Chloroform
- Isopropanol
- Ethanol
- Nanopur Water
- Refrigerated Centrifuge
- Desktop Centrifuge
- Vortexer
- Pipetters, P1000 and P10 size, along with tips
- Heat Block, set to 55* C
- Nanodrop spectrophotometer
Deviation:
The protocol called for 0.1% DEPC-H2O. Nanopur filtered water was used instead. 200 uL additional Tri-Reagent was added to the initial sample. Initial centrifuge time was cut to 8 minutes from the 15 prescribed.
Methods:
RNA Extraction:
The sample was removed from the -80*C freezer and allowed to thaw. 200 uL of chloroform was added to the mixture then vortexed vigorously and centrifuged in the refrigerated centrifuge. The aqueous phase of the resultant mixture was removed via pipette and placed in a newly labeled (Initials, Date, and “Gill RNA” on side) micro-centrifuge tube and the rest of the sample was disposed of in the biohazard bin.
500 uL of isopropanol was added to the new aqueous phase tube as an initial wash and inverted to mix properly. Tube was incubated at room temperature and then spun in the refrigerated centrifuge until pelleting of RNA and salts occurred. Supernatant was removed via pipette. 1 mL of 75% ethanol was added to tube as a second wash, vortexed to break up pellet, and then centrifuged once more.
After centrifugation, the supernatant was removed and the tube placed in the fume hood to allow excess ethanol to evaporate. After the evaporation step, 100 uL of Nanopur water was added to the pellet and then the suspension was agitated with repeated pipetting to homogenize the pellet. The micro-centrifuge tube was then placed in a 55*C heat block.
RNA Quantification:
After incubation, a Nanodrop spectrophotometer was calibrated using a 2 uL sample of deionized water to establish a baseline. A 2 uL sample of isolated RNA was then analyzed for RNA concentration and purity.
Results:
A concentration of 266.5 ng/L of RNA was recorded from the Nanodrop.
The ratio of 260nm/280nm absorbance spectra was 1.98
The ratio of 260nm/230nm absorbance spectra was 2.39
Conclusion:
I felt the results were acceptable, though the concentration of RNA seemed on the low side relative to other members of the lab. That could be related to the smaller sample size I used.
The isolated RNA will next be reverse transcribed to complimentary DNA and then, after a target gene is decided upon and primers developed, will be ran through a PCR assay to determine presence of target gene.
Reflections:
First and foremost, don’t assume the thing that looks like a waste container in the fume hood is actually a waste container. It could actually be your chloroform.
The only measurement really taken in the lab, aside from volume measurements via pipette was taken via the Nanodrop, this was to measure both quantity of the RNA isolated, and a rough estimate of quality by measuring indirectly the excess ethanol and salts left over after processing.
This process is sort of a gateway process to most other RNA based assays as you need to start with some RNA to analyze.
9/29/2014:
Summary:
Remove a sample of tissue from an oyster and using tri-reagent begin the process of isolating RNA
Materials:
- An Oyster
- Scalpel
- Scissors
- 1.5 mL micro centrifuge tbe
- Tri-Reagent
- Disposable Pestle
- Scale
Methods:
1. Began by dissecting a 0.028g sample of gill from an Oyster.
2. Placed tissue sample into a 1.5mL micro centrifuge tube
3. Added 500uL of Tri-reagent to micro centrifuge tube
4. Using a disposable sterile pestle we homogenized the tissue sample
5. Added a second 500uL of Tri-reagent to micro centrifuge tube.
6. Labeled tube with Name, Date, Sample Type, and Class and placed in box for later placement in -80* freezer
Observations:
The tissue was difficult to homogenize completely in the tube. I decided that breaking up into very small pieces would suffice.
Conclusion:
We began the process of RNA isolation by immersing a live tissue sample in Tri-reagent. We then homogenized the tissue to increase available surface area for the reagent to react. The Tri-reagent acts in three ways. One, it has a strong protein denaturing component which serves to do two things, first it dissolves the coat around the DNA and second it dissolves RNAses which would degrade the RNA . Second, it has a phenol which isolates cellular proteins as well as helps keep the DNA insoluble in solution. Third, it has an acidic pH which further keeps DNA insoluble.
The tissue sample and Tri-reagent is stored in a -80* Freezer because the isolated RNA is very fragile and has to be protected from degradation before it can be reverse transcribed into cDNA.