Summary: Crassostrea gigas were stressed and tissue samples were collected. RNA was extracted from the Crassostrea gigas and the Crassostrea virginica samples.
Materials:
- Gloves
- Lab coats
- Goggles
- Pipettes & tips
- 1.5mL microcentrifuge tubes
- A whole lotta oysters
- Roto-shaker
- Microfuge
- Nano Pure water
- TriReagent
- Chloroform
- Isopropanol
- Oyster shucking supplies
Methods:
24 hours prior to the lab, 8 C. gigas were exposed to a heat treatment (2 hours in a 30C bath), 8 were exposed to a mechanical stress (30min on a roto-shaker), 8 were exposed to heat then mechanical stress, and 8 were exposed to the mechanical stress then heat. A control group of 8 C. gigas did not receive any treatments.
On 11/18, all 40 oysters were shucked. Tissue samples were collected from the gills, placed in labeled tubes with 500uL TriReagent, and mashed to bits. 500uL more TriReagent was added, followed by 200uL of chloroform. The tubes were spun in the microfuge for 25min to separate the guck from the aqueous RNA. The aqueous phase of each tube was removed and placed in a new tube with 500uL isopropanol, and the tubes were spun again. Next, the liquid was removed from each tube, leaving a small pellet that was allowed to dry before 100uL Nano Pure water was added.
Results:
40 C. gigas bravely gave their lives in the name of science and their RNA was acquired.
Conclusions:
The purpose of this lab was to extract RNA for use in the rest of the project. In the next lab, the RNA samples will undergo reverse transcription, and we will decide which primers we will use.
Lab 6 - 11/4/2014
Summary:
Primers were tested using stored cDNA templates, and further plans for the research project were discussed.
Materials:
- Pipettes and tips
- Gloves
- Lab coat
- 1.5mL microfuge tubes
- 0.5mL PCR tubes
- PCR plate
- cDNA from Crassostrea gigas and Crassostrea virginica
- Primers
- SsoFast supermix
- NanoPure water
Methods:
After identifying and sorting the primers, NanoPure water was added to each tube in volumes equal to about ten times those of the primers, then the tubes were vortex. 10uL of each mixture was added to a new microfuge tube along with 90uL of NanoPure water. For each set of primers, a master mix of 100uL SsoFast supermix, 84uL NanoPure water, 4uL of the upstream primer, and 4uL of the downstream primer was prepared. Each master mix was added to 8 PCR tubes in quantities of 24uL per tube. At the time, the cDNA templates were diluted to 1/10, 1/100, 1/1000, and 1/10,000 of their original concentrations.
Now, ideally, 1uL of each concentration of cDNA would be added to six of the PCR tubes containing the primers for the corresponding species, but I'm a scrub so I added the 1/10,000 dilution of Crassostrea gigas cDNA to all 12 of my experimental tubes. This is what I put into rows 7 and 8 on the PCR plate.
Results:
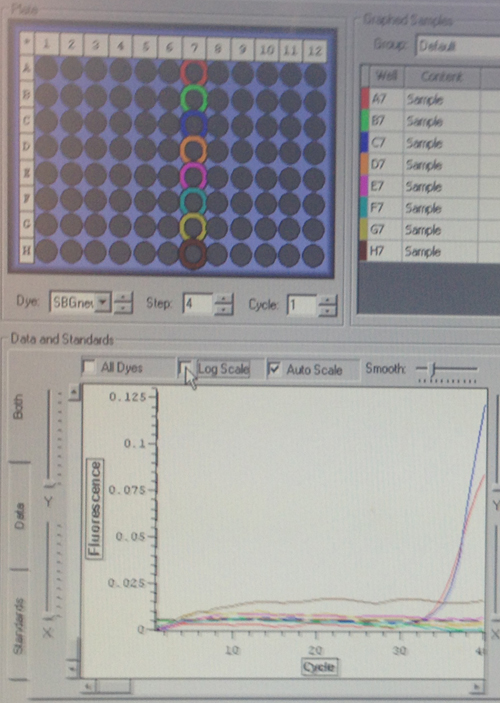
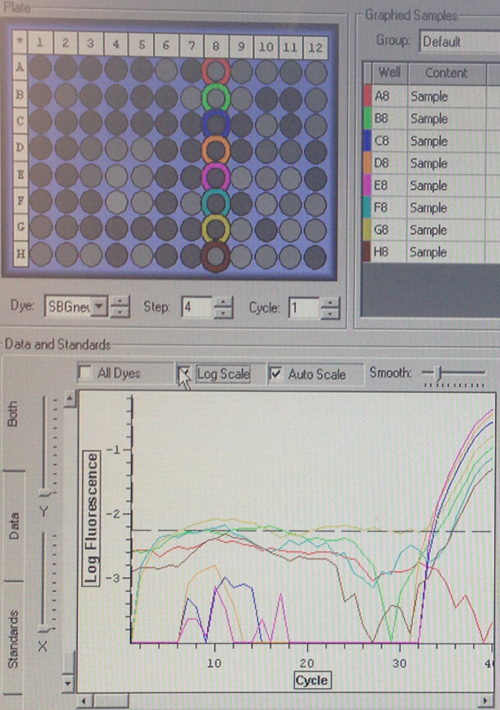
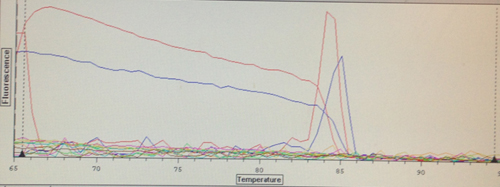
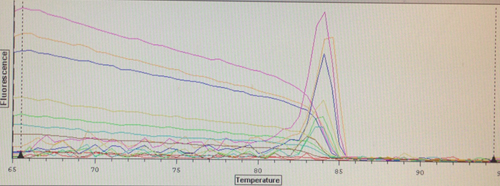
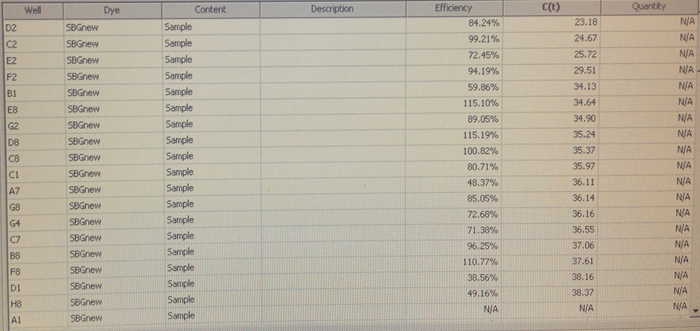
Quantification (top) and melting (bottom) curves for HSP 70B for C.gigas (left) and HIF 1a for C.virginica with cDNA from C.gigas (right)
 |
 |
 |
 |
Conclusion:
Despite the divergences from the protocol, both of my primers appear to have worked to some extent. The HSP 70b only resulted in amplification in two wells, but they also produced melting curves. Although it was used on DNA from the wrong species, the HIF 1a appears more successful. However, the control wells also appear to have had amplification, so either something went terribly wrong or I had added the cDNA to all of the wells without realizing it. The melting curves suggest the latter, but the former is still very much a possibility. Their C(t) values are relatively high compared to the wells containing the other primers, but not unreasonable.
Research Proposal:
The study will be conducted on specimens of the oyster species Crassostrea gigas and Crassostrea virginica. The C. virginica specimens were collected from a site that had been exposed to crude oil. For each species, we will have one control group and three test groups, each consisting of 10 animals. The test groups will receive treatments as follows:
- Heat stress (35C water bath)
- Mechanical stress (5min in centrifuge)
- Mechanical stress followed by heat stress
Tissue samples will then be collected and the RNA will be isolated for analysis. Samples from each C. gigas will be tested for superoxide dismutase, HIF-1a, HSP70B, glutathione S-transferases, and cytochrome P450. Samples from each C. virginica will be tested for metallothionein, HIF-1a, and HSP70.
Timetable:
| Week of November 4 |
Treatments are carried out and samples are collected |
| Week of November 11 |
RNA is extracted from samples |
| November 18 |
Reverse transcription and qPCR |
| November 25 |
PCR gel is run |
| December 2 |
Analysis and discussion of results |
Lab 4 - 10/21/2014
Summary:
An electrophoresis gel was run and a western blot was performed to analyze the PCR and protein products from the previous labs.
Materials:
- Pipettes and tips
- Lab coat
- Goggles
- Gloves
- Platform rocker
- Power supply
- Trays for staining gels
Gel Electrophoresis:
- Agarose gel
- Gel box
- 1x TAE buffer
- PCR samples
- Ladder
- UV transilluminator
- SDS-PAGE gels
- Heating block and water bath
- Tube floatie for water bath
- Protein gel box
- Protein ladder
- 2x SDS reducing sample buffer
- Gel running buffer
- Microcentrifuge
- Nanopure water
- Blocking solution
- Primary Antibody Solution
- Antibody wash
- Secondary Antibody Solution
- Chromogenic substrate
- SDS-PAGE gel
- Tris-Glycine transfer buffer
- Filter paper
- Nitrocellulose membrane
- Semi-dry transfer station
Methods:
Gel Electrophoresis:
The previously made agarose gel was placed in the gel box. The box was filled with TAE buffer until the gel was submerged. 20uL of each PCR sample was loaded into the wells, and 7uL of the ladder was loaded into the leftmost well. The gel was then run for one hour at 100V, and visualized on the UV transilluminator.
SDS-PAGE:
15uL of the protein sample and 15uL of 2x Reducing Sample Buffer were added to a new 1.5mL tube and centrifuged for 10 seconds. The tubes were then boiled for 5min and centrifuged for 1min. Each sample was loaded into a well of the gel, and the box and gel were assembled. The box's electrodes were plugged into the power supply at 150V for 35min. The gel was then removed and trimmed for the Western Blotting procedure.
Western Blot:
The filter paper, gel, and membrane were set in Tris-Glycine transfer buffer for 15min. They were then assembled in the semi-dry blotting apparatus with the cathode and anode to form a blotting sandwich, where it was transferred at 20V for 30min.
The gel was rinsed with transfer buffer. The membrane was washed in 20mL Nanopure water for 5min and decanted twice. Next, the membrane was placed in 10mL Primary Antibody Solution on the platform rocker for 1 hour, then decanted. The membrane was then washed in 20mL of Antibody Wash for 5min and decanted 3 times. It was washed in 10mL Secondary Antibody Solution for 30min and decanted. Again, the membrane was washed in Antibody Wash 3 times. Then the membrane was rinsed twice in 20mL water for 2min each time, and then it was allowed to incubate in 5mL Chromogenic Substrate until bands appeared. After up to 60min, the membrane was rinsed in 20mL of water for 2min twice, and dried.
Results:
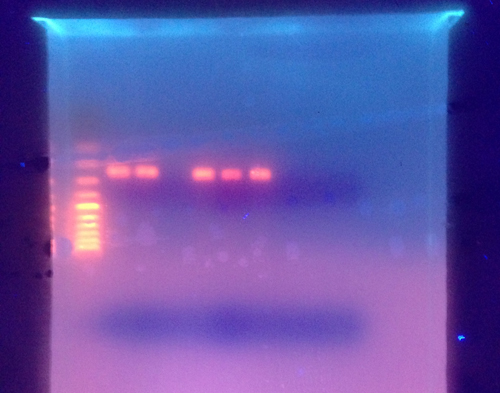
The cPCR gel showed amplified products around 200-300 base pairs.
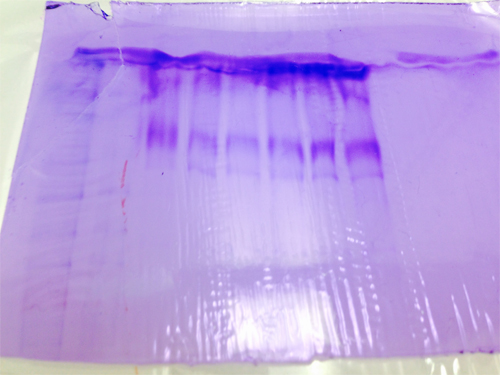
The protein gel showed the presence of separated proteins, but its true meaning remains shrouded in mystery.
The Western Blot provided some faint artistic splotches.
Conclusions:
The PCR gel was successful, but we were unable to interpret the protein gel and the Western Blot yielded no results. Based on this, it might be safest to use genes in the upcoming project. While we were able to extract and visualize genes in the past 4 labs, and we are now familiar with the procedure, using proteins in the project puts us at risk of repeating the inconclusive results we achieved in this lab.
Lab 3 - 10/14/2014
Summary:
Reverse transcription was used to create DNA from the RNA samples, and a PCR program was started. Also, an agarose gel was made and another tissue sample was prepared for protein isolation.
Materials:
- Lab coat
- Gloves
- Goggles
- 0.5mL PCR tubes
- 1.5mL microfuge tubes
- M-MLV reverse transcriptase
- M-MLV x5 reaction buffer
- Oglio dT
- dNTP
- Nano Pure water
- 2x Immomix Master Mix
- SYTO-13 Dye
- DNA primers
- Agarose
- Ethidium bromide
- 1x TAE
- CelLyticMT Cell Lysis Reagent
- Gel rigs
- PCR plate
- Microwave
- Micropipettes and tips
- Disposable pestle
- Microcentrifuge
- Thermalcycler
- Ice bucket
Methods:
Reverse Transcription
5uL of RNA from the previous labs was added to a 0.5mL tube labeled "SK". 12.75uL of a master mix containing 4uL oligo dT and 98uL of Nano Pure water were added to the tube, which was then incubated in the thermalcycler at 70C for 5min.
7.25uL of another master mix containing 40uL M-MLV 5x reaction buffer, 1.25uL dNTPs, 0.5uL M-MLV RT, and 0.5uL Nano Pure water were added to the incubated solution, then incubated in the thermalcycler at 42C for 60min.
PCR
A master mix consisting of SsoFast EvaGreen Supermix, primers, and Nano Pure water was added to a PCR plate. 1uL of cDNA sample from reverse transcription was added to each well. The plate was loaded into the qPCR machine for incubation and to detect the qPCR process.
Agarose Gel Preparation
2g of agarose and 75mL 1x TAE were mixed and microwaved for 2.5min at a time until no precipitate remained. The solution was allowed to cool before 12uL ethidium bromide was mixed in. The solution was poured into a gel tray and a gel comb was inserted.
Protein Extraction
A 0.059g sample of oyster tissue from a tube labeled "NB 28" was added to a new tube, along with 500uL CelLyticMT. The tissue was broken up using a pestle and the emulsion was spun in the microfuge for 10min. The supernatant was then transferred to a tube labeled "OYSTER 10/14/14 SK PROTEIN".
Results:
The qPCR data from my cDNA sample is in well C5
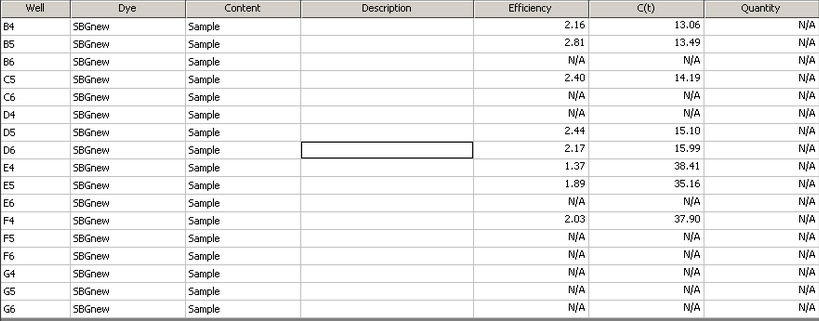 |
| Table showing efficiency and C(t) from each individual well |
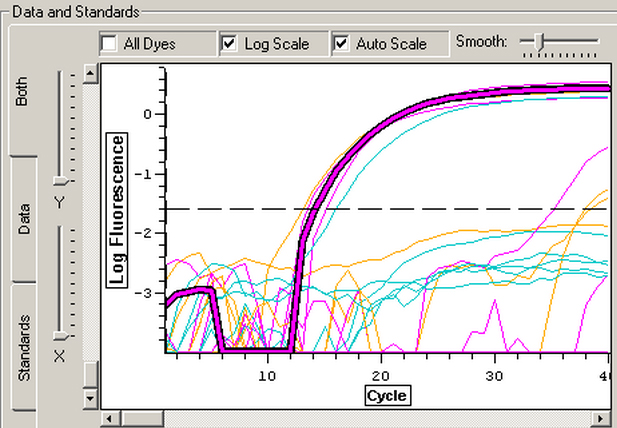 |
| Graph of log fluorescence with each cycle. Data from well C5 is highlighted. |
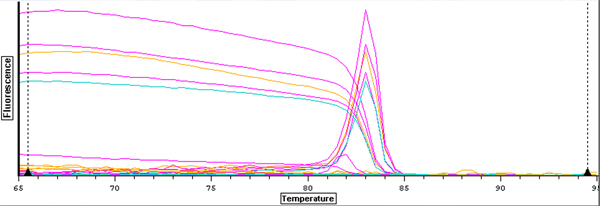 |
| Curve graph showing melt curves |
Conclusions:
The melt curve graph indicates that the samples contained only DNA, and the curve for well C5 appears to be about the same as those for the other samples. The C(t) value of 14.19 is also right in the middle of the other results, which I did not expect because the A260/230 ratio of my RNA showed that it contained many contaminants. The contaminants were reflected more in the efficiency measurement of 2.40.
The agarose gel will be used in a later lab to test the success of the PCR program, and the extracted protein samples will be quantified using a spectrophotometer.
Like the previous labs, the purpose of this lab was to become familiar with extraction and quantification procedures, which are widely used in a variety of biological studies.
Lab 2 - 10/7/2014
Summary
The procedure for isolating the RNA from Lab 1 was completed, and the isolated RNA was quantified.
Materials
- Lab coat
- Gloves
- Safety glasses
- Micropipettes and tips
- 1.5mL microcentrifuge tubes
- Chloroform
- Isopropanol
- 75% ethanol
- Nano Pure water
- Vortex
- Microfuge
- Nanodrop spectrophotometer
- Heating block
- Ice bucket
- Tissue sample from previous lab
Methods
RNA Isolation:
After allowing the tissue sample to incubate at room temperature for a few minutes, 200uL of chloroform were added. The tube was then vortexed until it appeared cloudy and spun in the refrigerated microfuge for 15min. When the tube was removed, the aqueous phase was placed in a new tube, also labeled OysterSK. 500uL of isopropanol was added, and the tube was spun in the microfuge again for 8min. The liquid supernatant portion of the tube was then removed, leaving a pellet of salts and RNA. 1mL of 75% EtOH were added and the tube was vortexed to mix it. The tube was spun for 5min. The EtOH supernatant was removed and the remaining pellet was allowed to dry. Then 100uL of Nano Pure water were added and the tube was incubated in the heating block at 55C for 5min.
RNA Quantification:
The Nanodrop Spectrophotometer was zeroed by placing 2uL of Nano Pure water on the pedestal and selecting "Blank" on the computer. Then 2uL of the RNA sample was placed on the pedestal and measured for RNA purity and concentration.
Results
A260/280 ratio = 1.95
A260/230 ratio = .77
ng/uL = 177.8
Conclusions:
My RNA concentration (177.8ng/uL) was low compared to the other samples, but this may be due to the size of my tissue sample (0.05g). The A260/280 ratio was within the acceptable range (around 1.8-2.0), but the A260/230 ratio was much lower than the ideal range.
I am not completely sure about what my results mean in terms of how they will affect later parts of the process. While I understand that the A260/230 ratio indicates that my RNA contains more impurities than it should, would results like this be a reason to redo the extraction in a real lab scenario?
In the next lab, the RNA will be reverse-transcribed to create DNA that will be amplified. The procedure used in this lab and the previous lab are commonly used to isolate RNA collected from research subjects.
Lab 1 - 9/29/14
FISH 441
Summary:
TriReagent was used to isolate RNA from oyster gill tissue.
Materials:
- Micropipettes
- TriReagent
- Oyster tissue
- Pestle
- Safety gloves
- Safety goggles
- 1.5mL microcentrifuge tube
Methods:
A 0.05g piece of tissue from an oyster gill was placed in a microcentrifuge tube labeled "OysterSK". Using a micropipette, 0.5mL of TriReagent were added to the tube. The tissue sample was then partially broken up inside the tube with a pestle before another 0.5mL of TriReagent were added.
Results:
The lysing process of the oyster tissue was started.
Conclusions:
Since only the TriReagent was added to the tissue sample during this lab, chloroform will be used next time to continue separating the RNA from the other components of the solution. The RNA will also be extracted and quantified after it is isolated to determine its purity and concentration. This and similar processes can be used to measure RNA, DNA, and protein activity from a tissue sample, which can indicate stress or genetic changes in an organism. The purpose of this lab was to become familiar with the micropipettes, the lab, and the process for isolating and extracting RNA.