November 29th, 2011
Reflection:
1. Detail at least 2 reasons why your results turned out the way they did. This should be easy to do if your results are "unexpected", but even expected results can have multiple explanations. Really think about this, the answer "because I messed up in lab" (or any variation thereof) is not acceptable.
1) The restriction enzymes used in this lab may have cut in single nucleotide polymorphisms, which are abundant in oysters and would result in non-selective amplification.
2) I could have gotten all of the samples contaminated, which would result in similar amplification and band results in the gel.
2. What are two obstacles that you encountered during your lab work and experimental design? Did these obstacles affect your results? Why?
1) I couldn't find primers on NCBI that included a methylated site with CCGG for the amp-gigasin 2 gene, but Emma helped me design primers on another program so I was able to continue with PCR and the rest of my experiment.
2) I didn't see a pellet form during DNA extraction for most of my samples, but NanoDrop measurements of the DNA concentrations proved that DNA was sufficiently there so it did not affect my results.
3. Explain at least one aspect of your research and its results that have a greater impact outside of your own personal learning experience. What would you tell a non-scientist who challenged the importance of your research?
My research is important because it can teach future students about properly designing primers, or teach future scientists lessons about the amp-gigasin 2 gene and designing primers for amplification. I would tell the non-scientist that challenged the importance of this research that we can all make mistakes or discover unexpected results, and they may be more valuable than predicted results in solving how exactly anthropogenic environmental change affects oysters (important aquaculture organisms!).
4. What part of your research and analysis has completely stumped you? Is there anything you can do to find the answer or will it always remain a mystery?
The fact that all of the wells in the electrophoresis gel show the same bands. Theoretically, HpaII is not able to cut methylated CpG sites and should show a strong band near the top of the wells in methylated genes. I can perform qPCR to figure out if the problem is the restriction enzymes cutting at single nucleotide polymorphisms or if I had contamination in each of the samples. -
5. In about 3 sentences each, summarize 2 papers that you are going to cite in your own paper that give insight into the results that you found.
1) Ocean acidification can not only have detrimental effects on oyster calcification but on their metabolism as well. In addition to ocean acidification, the experiment also increases exposure temperature. Ocean acidification will weaken and narrow their thermal tolerance range.
2) Calcification rates decline linearly with decreasing pH. This experiment was performed taking saturation solubility products for calcite and aragonite in order to measure calcification rates. Their future endeavors include discovering potential adaptions to help oysters better survive increasing carbon dioxide levels in sea water.
-
November 22nd, 2011
Summary:
To work on individual projects. Mine is to investigate DNA methylation on the amp-gigasin 2 gene using restriction enzymes, PCR, and gel electrophoresis.
Methods:
Restriction Enzymes Digestion
- Use the NanoDrop spectrophotometer to determine DNA concentrations in ng/µL
- Calculate µL needed to equal 1µg DNA, then add Nanopure H2O to equal 44µL for HpaII digests, 44.5µL for MspI digests, and 50µL for negative controls.
- For HpaII digests, add 5µL of #1 buffer and 1µL of enzyme, for MspI digests, add 5µL of #4 buffer and 0.5µL of enzyme
- Incubate both digests and controls at 37°C overnight, heat stop 20min at 65°C for HpaII and 80°C for MspI
PCR, Gel Electrophoresis
- Procedures can be found in 10/25/11 and 11/1/11 entries.
Results
Observations
- Heating block for heat stopping takes a long time to heat from 65 to 80 degrees
Deviations
- Used 2x GoTaq master mix again
- Used 1.5g of agarose instead of 2g, 100mL of TAE buffer
Calculations
- Digest DNA amounts
| Ploidy |
Weight (g) |
μL equal to 1μg |
μL Water to add |
||
| hpa |
msp |
control |
|||
| 3n |
47 |
101 |
0 |
0 |
0 |
| 3n |
25 |
5.52 |
38.48 |
38.98 |
44.48 |
| 3n |
30 |
14.84 |
29.16 |
29.66 |
35.16 |
| 3n |
35 |
5.63 |
38.37 |
38.87 |
44.37 |
| 3n |
37 |
8.55 |
35.45 |
35.95 |
41.45 |
| 2n |
45 |
6.29 |
37.71 |
38.21 |
43.71 |
| 2n |
55 |
9.35 |
34.65 |
35.15 |
40.65 |
| 2n |
47 |
6.46 |
37.54 |
38.04 |
43.54 |
| 2n |
53 |
11.47 |
32.53 |
33.03 |
38.53 |
| 2n |
48 |
8.61 |
35.39 |
35.89 |
41.39 |
Electrophoresis
Samples in well layout is detailed in chart below
| Diploid |
||||||||||||||||
| well 1 |
MspI |
Control |
HpaII |
well 20 |
||||||||||||
| Ladder |
53 |
45 |
55 |
48 |
47 |
48 |
53 |
45 |
55 |
47 |
48 |
53 |
55 |
45 |
47 |
Ladder |
| Triploid |
||||||||||||||||
| well 21 |
MspI |
Control |
HpaII |
well 30 |
||||||||||||
| Ladder |
35 |
47 |
37 |
30 |
25 |
47 |
37 |
35 |
25 |
30 |
37 |
35 |
30 |
25 |
47 |
Ladder |
Conclusions
What I expected was there to be more DNA methylation in triploids than diploids, which translates to longer separation of fragments in the lower row vs. top row in the gel in the Msp columns. HpaII does not cut methylated CpGs, so there should be a concentration of DNA in the Hpa columns, which is not seen in the gel. Perhaps a qPCR run of both enzymes can solve the mystery of all columns showing the same band patterns (except the DNA ladder).
Reflection
The purpose of this lab was to further investigate our research proposal. I performed PCR and gel electrophoresis in order to measure and compare DNA methylation of the amp-gigasin 2 gene between triploid and diploid oysters, which can be used for conservation studies and agriculture sustainability in the face of ocean acidification. There is nothing unclear about the given procedures.
November 15th, 2011
Summary:
To measure methylation using cytosine methylation dot blots, and using qPCR to measure gene expression.
Methods:
DNA Dilutions
- Dilution DNA to 50ng/µL in a 40µL total volume.
- Prepare dilutions:
| Dilution |
TARGET amount |
ul of H20 |
ul of 20X SSC |
ul of 50ng/ul DNA sample |
| 1 |
800 ng |
124 |
60 |
16 |
| 2 |
400 ng |
132 |
60 |
8 |
| 3 |
200 ng |
136 |
60 |
4 |
| 4 |
100 ng |
138 |
60 |
2 |
| 5 |
50 ng |
139 |
60 |
1 |
- Cut nylon membrane to fit 72 wells of manifold, cover nylon membrane in 6X SSC for 10min. Put manifold with the membrane lying on top of the filter paper.
- Denature DNA in boiling water for 10min, then transfer to ice. Turn on vacuum, add 500µL of 6X SSC to each well, let SSC to flow through.
- Adjust vacuum speed so the SSC to filter through takes a few min. Spin down DNA for 5 min.
- Add all of the DNA to each well, not touching membrane, recording DNA names and locations. Allow samples to flow through.
- Soak filter paper cut to size in denaturation buffer, then remove manifold and transfer membrane (dot side up) to filter paper soaked in denaturation buffer.
- Wait 5min, place membranes on dry filter paper and dry. Wrap dried blot in plastic wrap and place DNA-side-down on UV transluminator for 2min at 120kJ.
Chromogenic Immunodetection
- Prepare 20mL of Blocking Solution: Ultra filtered Water 14mL, Blocker/Diluent (Part A) 4mL, Blocker/Diluent (Part B) 2mL
- Place membrane in 10mL of Blocking Solution in a covered, plastic dish, incubate 30min on a rotary shaker @ 1 revolution/sec.
- Decant Blocking Solution, rinse membrane 5min with 20mL H2O, then decant. (2x)
- Prepare 10mL of Primary Antibody Solution (1:5000 dilution): Blocking Solution 10mL, 5-MeC antibody 2µL
- Incubate membrane 1hr with 10mL Primary Antibody Solution.
- Decant primary antibody and wash the membrane 5min with 20mL of 1X TBS-T, decant. (3x)
- Incubate membrane 30min in 10mL secondary antibody solution, decant.
- Wash membrane 5min with 20mL TBS-T, decant (3x)
- Rinse membrane 2min with 20mL H2O, decant. (2x)
- Incubate membrane (1-60min) in 5mL Chromogenic Substrate until color develops
- Rinse membrane 2min with 20mL H2O, decant. (2x)
- Dry membrane of clean piece of filter paper
qPCR
- Thaw cDNA samples.
- Prepare master mix, 25μL reaction volume:
| Component |
Volume |
Final Conc. |
| Master Mix, 2X (Immomix) |
12.5µL |
1x |
| Syto-13 dye (50uM) |
1µL |
2µM |
| upstream primer, 10μM |
1.25μl |
2.5μM |
| downstream primer, 10μM |
1.25μl |
2.5μM |
| Ultra Pure Water |
7uL |
NA |
- Place strips on ice, load plate, use the following conditions:
1. 95°C for 10 minutes
2. 95°C for 15s
3. 55 °C for 15 s
4. 72°C for 30 s (+ plate read)
5. Return to step 2 39 more times
6. 95°C for 10s
7. Melt curve from 65°C to 95°C, at 0.5°C for 5s (+plate read)
Measurements
Nanodrop DNA measurements
| Ploidy |
Weight(g) |
260/280 |
260/230 |
ng/μL |
| Triploid |
47 |
2.24 |
0.03 |
10.1 |
| Triploid |
25 |
1.85 |
0.33 |
181.0 |
| Triploid |
30 |
1.98 |
0.21 |
67.4 |
| Triploid |
35 |
1.86 |
0.42 |
177.6 |
| Triploid |
37 |
1.87 |
0.29 |
116.9 |
| Diploid |
45 |
1.71 |
0.30 |
158.9 |
| Diploid |
55 |
1.85 |
0.19 |
107.0 |
| Diploid |
47 |
1.71 |
0.29 |
154.9 |
| Diploid |
53 |
1.79 |
0.16 |
87.2 |
| Diploid |
48 |
1.98 |
0.21 |
116.1 |
Observations
- First trial of 6X SSC flow through was too fast, use slower settings.
Deviations
- Crosslinker used instead of UV transilluminator
Calculations
DNA dot blot dilutions:
- Diploid 48; 116.1ng/μL. CV = C2V2, V = C2V2/C, V = (40μL*50ng/μL)/(116.1ng/μL) = 17.2μL DNA, 40μL total - 17.2μL DNA = 22.8μL H2O for initial dilution
Conclusions
Did not have time to finish within a 3hr lab period. Everything else in the procedure performed went well. I will strive to be more efficient in executing actions in the future.
Reflection
The purpose of this lab was to perform dot blotting and qPCR. The procedures were performed to examine methylation as well as gene expression, in hopes of gaining a better understanding of how organisms respond to stressors in their environment (such as our acidic water oysters). The instructions were very clear.
November 8th, 2011
Summary:
To perform DNA extraction on ocean acidification sample oysters using DNAzol.
Materials & Methods:
DNA extraction
- Homogenize tissue in 0.5mL of DNazol in 1.5mL microcentrifuge tube (MCT). Add additional 0.5mL DNAzol and mix.
- Incubate 5min @ room temperature (RT). Spin sample 10min @ 10,000g RT
- Transfer supernatant to a new, labeled tube, add 0.5mL 100% ethanol (EtOH) to sample. Invert tube 5-8x to mix, incubate 1min @ RT
- Remove cloudy precipitate DNA and pipet into new tube, incubate 1min @ RT, remove excess liquid.
- Pipette 1mL 75% EtOH into DNA tube, invert 6 times, incubate 1min @ RT. Remove ethanol. (2X)
- Add 300µL 0.1% DEPC H2O to DNA. Pipette to mix and dissolve. Insert in NanoDrop machine to quantify.
Measurements
(weight in mg)
| Diploid |
Triploid |
| 47 |
37 |
| 45 |
30 |
| 48 |
47 |
| 55 |
25 |
| 53 |
25 |
Results:
Observations
- During "remove cloudy precipitate", DNA did not remain a precipitate
Deviations
- Did not add additional 0.5mL DNAzol after first addition. Added 2.4µL ProK and incubated 1hr @ RT
- Added centrifuge step before removing cloudy precipitate DNA: centrifuge 5min @ 5,000g
Calculations:
- N/A
Conclusions:
Extraction was difficult. After centrifuging sample 5min @ 5,000g, very little trace of DNA pellets were present in tubes. I expected there to be pellets, but I suspect it could be that DNAzol and ProK did not have enough time to properly extract DNA. I will strive to do a better job in reducing contamination and improving DNA extractions.Reflection:
The purpose of the lab was to learn how to extract DNA. The procedures were used to examine gene expression at the DNA level, or prepare for qPCR, which may be used to study gene methylation in specimens in response to a change in their environment. The instructions were not vague, but it would have been better to explain more about ProK.November 1st, 2011
Summary:
To run PCR through gel electrophoresis, extract RNA and perform SDS-PAGE and Western blots.Materials and Methods:
Agarose gel- Add 2g agarose and 150mL 1x TAE into a 1L flask, microwave ~3 min.
- Cool to RT, add 12uL 1.5% ethidium bromide (EtBr), mix well and pour into gel tray.
- Add gel combs, wait for gel to set, wrap in plastic wrap, place gel in fridge.
Electrophoresis
- Remove combs from wells, place gel in gel box, submerge with 1x TAE buffer
- Load 7uL 100bp ladder in 1st well, 25uL PCR samples in the other wells
- Run gel at ~ 100V for ~ 1hr, view gel on a UV transilluminator
SDS-PAGE
- Boil water on hot plate.
- Add 15uL protein stock to 15uL 2X Reducing Sample Buffer in 1.5mL screw cap tube (SCT), return protein stock to -20C freezer
- Mix sample, centrifuge 10s, boil 5min
- Load into well. Run 45min @ 150V. Trim wells at top of gel, notch a corner for orientation.
Western Blot
- Soak filter paper, membrane and gel in Tris-Glycine Transfer Buffer 15min
- Put the following blotting sandwich in blotting apparatus in order: anode, filter, membrane, gel, filter, cathode.
- Transfer blot for 30min @ 20V, remove and rise gel with transfer buffer
- Wash membrane twice, 20 mL H2O ea, 5min ea. Place membrane in box, add 10mL blocking solution
- Incubate overnight on rotary shaker @ 1 rev/s
- Decant liquid, rise membrane 5min with 20mL H2O, decant (2x)
- Incubate membrane in Primary Antibody Solution (PAS), decant. Rinse with 20mL Antibody Wash (AW), decant. (3x)
- Incubate membrane 30min in 10 mL of Secondary Antibody Solution (SAS), decant
- Wash membrane for 5min with 20 mL of AW, decant. (3x)
- Rinse membrane 2min with 20mL H2O, decant. (2x)
- Incubate membrane in 5mL of Chromogenic Substrate (CS) until a purple band appears.
- Dry membrane on clean piece of filter paper in air
Results:
Measurements- 0.04g sample "protein, 2n wet mantle, YYL"
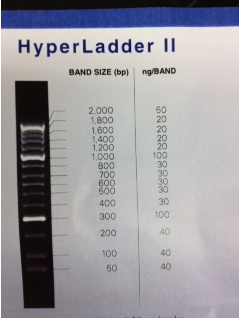

Above left: DNA ladder used. Above middle: PCR gel under UV illumination. Shows contamination in wells with negative controls, primer dimers, and multiple products in some wells. Above right: Western blot. Nothing present = no HSP70 expression.
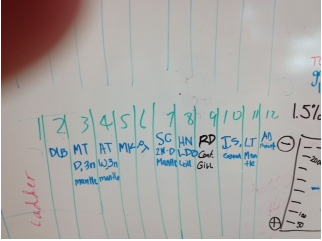 Left: layout of SDS page samples.
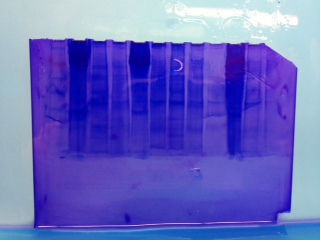
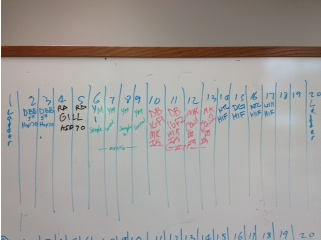 Left: layout of PCR samples. Above right: SDS-page results. Dark bands = high protein concentration.
Observations
- Electrophoresis: strong band and faint band in both samples. Bands in controls
- SDS-PAGE is running really fast after 15min.
Deviations:
- Our TA already prepared the agarose gel
- Only used 5uL of the DNA ladder for PCR
- Ended SDS-PAGE after running for 25min
Calculations:
- N/A
Conclusions:
Both our negative controls in the gel electrophoresis showed a band, which means contamination. Our samples had a dim band, which means formation of primer-dimers. I did not expect to see bands in the negative controls since the negative controls were not supposed to have DNA. We will strive to reduce contamination, to be able trust the future results of our sample PCR.Reflection:
The purpose of the lab was to learn how to run PCR products through gel electrophoresis, protein products through SDS-PAGE and Western blots. The procedures were used to visualize products separated by size, which may be used to study gene and protein expression in specimens in response to a change in their environment. The instructions were very clear.October 25th, 2011
- Summary
- To dissect tissue and perform a PCR on cDNA with primers and Promega's GoTaq mix.
- To dissect tissue and perform a PCR on cDNA with primers and Promega's GoTaq mix.
- Materials and Methods
- Dissection
- See 10/18/11 instructions
- End-point PCR
- Label a 1.5mL microcentrifuge tube "MM" (master mix) for each PCR reaction (rxn) and follow the recipe below:
- Dissection
| Reagent |
1.reaction |
x.reactions |
| 5x GoTaq Green buffer |
10 µL |
|
| 10mM dNTP mix |
1 µL |
|
| 10 µM forward primer |
1 µL |
|
| 10 µM reverse primer |
1 µL |
|
| GoTaq polymerase |
0.25 µL |
|
| nuclease-free water |
36.75 |
- Aliquot 48µL of the MM in to each 0.5 mL PCR tubes, labeled with initials and sample. Add 2µL of the sample and pipet to mix. Spin tubes and load into thermocycler according to the below instructions: follow the recipe below:
| Step |
Temperature |
Time |
Cycles |
| Denaturation |
95C |
5 min |
1 |
| Denaturation |
95C |
30 sec |
40 |
| Annealing |
55C |
30 sec |
|
| Extension |
72C |
90 sec |
|
| Final extension |
72C |
3 min |
1 |
| Hold |
4C |
∞ |
1 |
- Samples:
- cDNA stock: labeled "YM, 10/18"
- 5x triploid wet oyster samples: "YYL, 3n, wet, mantle"
- 5x triploid dry oyster samples: "YYL, 3n, dry, mantle"
- Results
- Observations
- It was very difficult to shuck the oysters
- Deviations:
- Used 2x GoTaq buffer instead of 5x
- Did not add dNTPs and polymerases into master mix
- Observations
- Conclusions
- No measurements were taken. Now that we are acquainted with the methods of PCR, we will be able to observe gene expression through amplification of our project samples and determine how environmental stressors affect the amplification.
- Reflection
- The purpose of the lab was to continue performing PCR on the cDNA stock produced 10/18/11 as well as extract samples for our group projects. The PCR procedures were used to measure gene expression, which may be used to study gene regulation in specimens in response to a change in their environment. What was unclear about the deviations was why dNTPs and polymerase were not added?
- The purpose of the lab was to continue performing PCR on the cDNA stock produced 10/18/11 as well as extract samples for our group projects. The PCR procedures were used to measure gene expression, which may be used to study gene regulation in specimens in response to a change in their environment. What was unclear about the deviations was why dNTPs and polymerase were not added?
October 18th, 2011
- Summary
- To learn about and perform reverse transcribing RNA to cDNA using oligo dT and M-MLV reverse transcriptase, dissecting animals using the sterile technique, and designing and ordering primers.
- To learn about and perform reverse transcribing RNA to cDNA using oligo dT and M-MLV reverse transcriptase, dissecting animals using the sterile technique, and designing and ordering primers.
- Materials and Methods
- Reverse transcriptase
- label a 0.5mL tube "cDNA", and add 5µL of well-mixed stock RNA, 1µL of oligo dT, and 4µL of nuclease-free water (NFW). Incubate at 70°C for 5min and put on ice
- centrifuge briefly and add 5µL M-MLV 5X Reaction Buffer, 5µL dNTPs, 1µL M-MLV RT, and 4µL NFW. Incubate at 42°C for 1 hour (hr) then at 70°C for 3min. Spin on desk centrifuge and store at -20°C
- Dissection
- shuck oyster at hinge using a shucker and follow cutting through adductor muscle. Open oyster and take care to keep body whole. Sterilize forceps with bleach and ethanol, and remove desired tissue to place into labeled tube.
- dispose of unwanted tissue in designated locations and re-sterilize all materials.
- Primer design
- use NCBI primer and Primer 3 programs to design primers about 18-30 bases in length, has <2°C melting temperature difference, avoiding primer dimers, primer hairpins, high G/C repeats but has a G/C clamp at the 3' end.
- Sample
- "YM, 10/18/11, cDNA" in 0.5mL tube
- "YM, 10/18/11, cDNA" in 0.5mL tube
- Reverse transcriptase
- Results
- Measurements
- N/A
- Observations
- solution in 0.5mL tube was clear after every addition in the methods
- Deviations:
- vortexed and spun the tube before incubating at both 70C and 42C.
- did not perform the "dissection" section of the methods
- Calculations:
- N/A
- Measurements
- Conclusions
- We have not measured any results yet.
- Reflection
- The purpose of the lab was to learn how to reverse transcribe RNA. The procedures were used to create cDNA from RNA, which may be used to study (through PCR) gene expression in specimens in response to a change in their environment. There is nothing unclear about the procedure, as it was very concise.
October 11th, 2011
- Summary
- The process of extracting RNA isolated by TRI-reagent from Crassostrea gigas (C. gigas) tissue is continued, and the resulting stock RNA sample is quantified using a Nanodrop spectrophotometer.
- The process of extracting RNA isolated by TRI-reagent from Crassostrea gigas (C. gigas) tissue is continued, and the resulting stock RNA sample is quantified using a Nanodrop spectrophotometer.
- Materials and Methods
- RNA Extraction
- Turn a heating block to 55°C and incubate the homogenized tissue sample at RT for 5min. Add 200µL chloroform, vortex for 30s, then incubate at RT for 5min.
- Centrifuge at 0°C for 15min, and transfer the top aqueous layer to a new micro centrifuge tube labeled "RNA". Add 500µL isopropanol to the RNA tube, invert until solution is homogenous, and incubate at RT for 10min.
- Centrifuge at 0°C for 8min and remove supernatant, leaving the white pellet. Add 1mL 75% ethanol (EtOH) and vortex to dislodge pellet. Centrifuge at 7500g for 5min and remove supernatant. Centrifuge 15s and remove remaining EtOH.
- Uncap tube and dry the pellet at RT for <5min, add 100µL of 0.1% Diethylpyrocarbonate treated water (DEPC-H2O) and pipet until pellet dissolves. Incubate at 55°C for 5min, flick to mix and put on ice.
- RNA Quantification
- Use 2µL of 0.1%DEPC-H20 on the Nanodrop pedestal, lower arm and set as blank. Pipet 2µL of RNA sample onto the pedestal, lower arm and press "measure". Record the concentration, A260/280 ratio, and A260/230 ratio, and wipe Nanodrop arm using a KimWipe. Store "RNA" tube at -80°C.
- Sample:
- C. gigas gonad tissue: labeled "YL, 10/4, gonad tissue" 0.031g
- C. gigas gonad RNA: labeled "YM, 10/11, RNA"
- RNA Extraction
- Results
- Measurements
- A260/280 ratio: 1.96
- A260/230 ratio: 1.83
- RNA concentration: 882.8 ng/µL
- Observations
- After the addition of chloroform and vortexing for 30s, the milky emulsion was a light pink colour.
- After the addition of isopropanol and inverting, the solution appears uniform, and almost clear (but still slightly translucent)
- Deviations:
- Some aqueous phase was left to prevent accidental transfer of the middle interphase layer below the top aqueous layer.
- Did not vortex after addition of 1mL of ethanol
- Calculations:
- Performed by the Nanodrop spectrophotometer using the Beer-Lambert law to calculate RNA concentration
- Measurements
- Conclusions
- A typical A260/280 ratio should be ~1.8-2.0 and an A260/230 ratio ~1.5-2.0, both of which our measured values agree with. This means that our RNA was pure, since the measured values fall between the range of "pure" samples. Now that we are acquainted with the methods of quantifying RNA, we will be able to quantify our project samples after determining environmental stressors and measuring its affects on RNA concentration.
- Reflection
- The purpose of the lab was to learn how to extract and quantify RNA from specimen tissue using the Nanodrop spectrophotometer. The procedures were used to measure RNA concentration, which may be used to study gene regulation in specimens in response to a change in their environment. There is nothing unclear about the procedure, as it was very detailed.
October 4th, 2011
- Summary
- RNA was isolated from Crassostrea gigas (C. gigas) gonad tissue using TRI-reagent. Protein was isolated from C. gigas mantle tissue using CellLytic MT, and the protein concentration was determined using the Bradford protein assay and a spectrophotometer.
- RNA was isolated from Crassostrea gigas (C. gigas) gonad tissue using TRI-reagent. Protein was isolated from C. gigas mantle tissue using CellLytic MT, and the protein concentration was determined using the Bradford protein assay and a spectrophotometer.
- Materials and Methods
- RNA Isolation
- Lyse gonad tissue in 1.5milliliter (mL) snap-cap tube with 500microliter (uL) of TRI-reagent, and homogenize with disposable pestle. Add 500uL additional TRI-reagent, vortex for 15 seconds (s), and store at -80ºC.
- Protein extraction
- Record weight of sample, lyse mantle tissue in 1.5mL snap-cap tube with 500uL of CellLytic MT, and homogenize with disposable pestle. Close cap and invert until mixed. Centrifuge at maximum speed for 10 minutes (min), and store supernatant on ice. At what temp was the centrifuge? -
emmats
- Record weight of sample, lyse mantle tissue in 1.5mL snap-cap tube with 500uL of CellLytic MT, and homogenize with disposable pestle. Close cap and invert until mixed. Centrifuge at maximum speed for 10 minutes (min), and store supernatant on ice. At what temp was the centrifuge? -
- Protein concentration
- Transfer 15uL of the supernatant into a 2mL tube labeled "protein, BA" (for Bradford Assay) and dilute it with 15uL de-ionized H2O (a 1:2 dilution). Add 30uL of H2O into another 2mL tube labeled "blank. Then add 1.5mL of BA reagent to both tubes, invert until mixed, and incubate at room temperature (RT) for 10 min.
- Pipet 1000uL of the blank solution to a disposable cuvette. Wipe the non-rough side of the cuvette with a Kim wipe and measure the absorbance at 595 nanometers (nm). Transfer 1000uL of protein BA solution into a new cuvette and read the absorbance twice at 595 nm. Average the readings, and calculate using the y= 1013.9x equation and x= averaged absorbance to find the protein concentration.
- Multiply the y by 2 to count for the 1:2 dilution, record the value. Store the protein supernatant from "protein extraction" in -20ºC.
- Samples
- C. gigas gonad tissue: labeled "YL, 10/4, gonad tissue" 0.031g
- C. gigas mantle tissue: labeled "YL, 10/4, mantle tissue". 0.008g
- Observations
- Both the gonad and mantle tissues were difficult to completely homogenize using the disposable pestle.
- Everything else in the procedure went according to plan.
- Deviations
- Instead of using a 2mL screw-cap tube, we used a regular snap-cap tube for the "protein concentration" procedure.
- Calculations
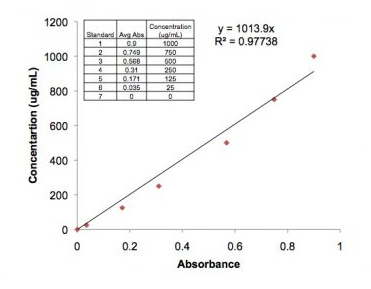
- Concentration was found using the y= 1013.9x equation above, and x= 0.479, our absorbance value, and was multiplied by 2 to correct for the 1:2 dilution used in the methods. y= 1013.9(0.479)*2= 971.3162 ug/mL
- RNA Isolation
- Results
- Blank absorbance: 0
- C. gigas mantle tissue protein absorbances: 478 nm, 480 nm, average= 479 nm absorbances are not measured in nm and these seem like very large numbers for absorbances (should be <1). The "nm" refers to the wavelength at which you measure the absorbance. -
emmats
- C. gigas mantle tissue protein concentration: 971.3162 ug/mL
- Conclusion
- I didn't really expect any particular results, and the absorbance falling somewhere along the curve assures that we followed the procedure correctly. We will use these newfound skills to research protein concentration in specimens to determine their response to their environments.
- Reflection
- The purpose of this lab was to learn how to extract RNA and proteins from specimen tissue. The procedures performed was used to measure protein concentration, which may be used to study gene regulation in specimens in response to a change in their environment. There is nothing unclear about the procedure, and everything was explained very clearly on the lab website.