UWT-Becker Lab10/29/15Finish pK digestionMethods
Finishing pK digestion
- Vials were finger vortexed at 9:15am and continued to heat at 56 degrees until the temperature was raised at 11:25am.
- Checking the thermometer and adjusting temperature, the temperature was finally raised to 95 degrees on the thermometer at 11:45am.
- These will heat for an hour at the raised temperature and then cool.
- Took vials off of heat block and set aside to cool briefly.
- Took out multiple other vials to aliquot TC digestions and labeled accordingly (10 vials per TC digestion of Manila clam Pacific geoduck Pacific oyster and Olympia oyster).
- Pipetted out 8 microliters from stock digest of each species and dispensed into respective vial swapping out pipette tips after each aliquot.
- Was going to do the same with the plankton reps and ethanol reps but decided to wait since the digestions were already sitting out for a while. Packed up to take to Seattle tomorrow.
UWT- Becker LabMcCarthaStart DNA isolation for manila clam spiked plankton samples 10-28-15Created by Michelle McCarthaGoal:Start DNA isolation in prep for qPCR on Friday.Methods:
- Pulled out pK solution Brenda made recently and placed in ice bath for slow melting.
- Checked that all samples left out overnight were completely dried out- which they were- and capped lids.
- Since adding more pk solution may help with any interference with qPCR and may assist in spreading out the data, increased amount of pK solution added to each vial from 700µL to 1000µL.
- Pipetted 1000µL of pK solution into each vial and inverted until sample was suspended in solution.
- Repeated for all samples using new pipette tip for each sample.
- Took samples to heat block which is set at 58C (reading 56C on thermometer) and placed into wells. Placed weight on top to keep lids closed and left for overnight digestion.
Becker Lab-UWTMcCartha, SmithhislerSpiking plankton and ethanol samples with manila clam larvae for 3 biological reps, as well as preparing template controls of 25 larvae of all four species10/27/15MethodsSpiking plankton and ethanol samples
- Centrifuged 50mL vials for 1 minute at 1300rpm
- I then pipetted 1mL from bottom of the tube and added it to the correspondingly labeled 2mL vial
- I centrifuged the tubes again and then pipetted another 900uL from the bottom and added it to the 2mL vial
- Using new pipette tips every time!
- I visually checked for remaining larvae in the 50mL tubes by adding the contents to a petri dish and rinsing the tube with ethanol.
- I cleaned the petri dish with the 5 step rinse process in between each sample
- Upon making sure there were no remaining larvae in the 50mL tubes, I centrifuged all of the 2mL vials at 2000rpm for 30 seconds.
- I pipetted off as much supernatant as possible without harming the pellet. This was difficult with all of the plankton, so I centrifuged the 2mL vials again and repeated taking off any supernatant.
Spiking template control samples
- I then spiked TC 2mL vials with 25 larvae
- Vials were labeled accordingly:
-Pg: 3-6-15 Geoduck EtOH 50mL vial
-Oly: Hood Canal 160 Oly larvae EtOH 7/16/4
All 2mL vials were then uncapped and left in the hood to dry overnight.
UWT-Becker LabSmithhislerTesting different densities of sugar in the sugar gradient method10/24/15, 10/26/15 (counting cont.)Created by: SmithhislerSpiking plankton samples
- I analyzed two, 50mL sample of plankton from Thea Foss (10/08/15) to make sure there were no bivalve larvae.
- I then spiked the samples with 40 Pacific Oyster (18-day old) (03/06/15) larvae using a pipette and rafter slide.
- I centrifuged the 50mL vials for 2 minutes at 1300rpm.
- The supernatant was pipetted off in each vial using a 5000uL pipette in intervals of 5mL at a time and expelled into a petri dish. The tip of the pipette was held by the top and ejected, then the interior and exterior rinsed with 95% ethanol that was added to the petri dish. The supernatant was checked for larvae microscopically.
- Then, for the pellet of each plankton sample (and density), I then swirled the sample up and poured it at an angle gently into the vial with 20mL of syrup so the sample rested on top. I then used the ethanol squirt bottle to rinse as much as possible from the sample to the syrup. This was easiest holding the vial upside down and squirting to the bottom (which is now at the top) and letting the sample flow down and out of the vial.
- I then centrifuged the sample for 2 minutes at 1300rpm.
Analyzing Sugar Gradient 1.05g/cm3 Density Syrup Trial (syrup prepared 10/09 by BS)
- I began to analyze the sample by pipetting off the phase 1 from the vial and checking for bivalve larvae under the microscope in a counting plate that was rinsed with Micro90 and water and dried with a paper towel. I then rinsed the sample with 95% ethanol into another vial labeled with phase 1,2 and the density of 1.05g/cm3.
- I found 0 larvae in Phase 1.
- I then pipetted out phase 2, checking for larvae. When phase 2 had decreased in volume, I gently added 95% ethanol to the top of the solution to resuspend any remaining phase 2 contents and pipetted them out. However, it was difficult to not pipette up any syrup, and some of the very top of phase 3 was pipetted. I had to use water to then rinse the pipette tip into the counting dish.
- I found 7 larvae in phase 2.
- I then pipetted out only the pellet from the bottom of the tube, leaving phase 3. I attempted to gather all of the materials that had collected at the bottom, but I will check phase 3 in a linear fashion as done previously to make sure I did not miss any larvae when pipetting the pellet.
- I found 33 larvae.
- I then checked phase 3, beginning with the top down, and performing a rinse of the vial with water.
- There were no larvae in phase 3.
Analyzing Sugar Gradient 1.1g/cm3 Density Syrup Trial (syrup prepared 10/09 by BS)1.1g/cm3
- I began by pipetting off of phase 1 and analyzing for larvae.
- There were no larvae present in phase 1 (the supernatant).
- I then pipetted out phase 2 as much as possible, attempting to avoid grabbing sugar from the top of phase 3. This is very difficult! I added ethanol to the top of the phase 3 surface by running it down the sides of the tube to gather any phase 2 remains. I pipetted out as much as possible, again trying to avoid the sugar, but getting some in the pipette.
- To rinse the pipette tip, I had to use water to get off any sugar residue. This creates an issue with the EtOH and water interaction in the counting dish. However, the current is not too strong that larvae do not settle, so they may still be counted. It is important to realize that the sample from phase 2 is no longer preserved in 95% ethanol because of the rinse with water.
- I found 5 larvae in the phase 2.
- There were many gastropods in this phase.
- I then used a 5mL pipette to gather the pellet and add it to the counting dish. This leaves uncertainty because the pellet is pipetted using visual judgement (as in, there is some pellet debris on the very bottom as well as on the sides of the bottom “V” of the tube”). I attempted to gather as much as possible that I could see, but decided it would be best to pipette out as if I were taking the pellet once more because there was still particles that I could see at/near the bottom (distinguished from the particles ‘floating’ at the top and middle of phase 3). After ejection, the pipette tip for this step has to be rinsed with a generous amount of water. The syrup also changes the view of the polarized lens a little as well. After examining, I added both counts to a vial labeled “pellet”.
- If we ‘miss’ larvae when gathering the pellet, will we want to sort through all of the sugar when performing real samples?
- The first count of the pellet I found 21 larvae.
- The second count of the ‘pellet’, I found 5 larvae.
- I then counted phase 3 in 5mL increments, working from the top down to try to find any remaining linear pattern in larvae distribution throughout the sugar.
- I found only 1 larvae in the last 5mL of phase 3.
- This totals to only 32 larvae (a loss of 8).
- To attempt to understand the loss, I rinsed the sides of the original density vial with water and shook it horizontally. I then added this to a petri dish. There were no larvae.
- Another comment is that I may have mistaken Pacific oly’s for snails.
Results of Sugar Gradient Method
 The gradient method with a sugarcane syrup density of 1.05g/cm3, after centrifugation for 2 minutes at 1300rpm.
 The gradient method with a sugarcane syrup density of 1.1g/cm3, after centrifugation for 2 minutes at 1300rpm. This photo somewhat shows the pellet distribution in the bottom ‘V’ of the vial. There appears to be particles distributed on the sides of the tube in that location, as well as the flat pellet at the very bottom.
Future Steps for Sugar Gradient MethodNote: Michelle pointed out that I accidentally used larvae that were previously preserved in DMSO and are now in EtOH. This means the density may be off for the larvae used in these trials. I will attempt a ‘clean’ trial for fast sorting and to see how the larvae move throughout the sugar without interference of plankton.
- Re-try 1.1 density?
- More centrifugation (longer time)? -clearer results, more compact pellet
- Different sized larvae for a mixed sample, maybe try first with just ethanol?
- —> faster sorting
- Less sugar? —>look into papers for information on this
- papers show volumes of 20-25mL
SAFS- Roberts LabMcCartha
qPCR Oly primers with Megan's standards 10-23-15Created by Michelle McCartha
Goals: Perform qPCR using standards from Megan's DNA isolations of Olympia larvae.
Methods:Preparing primers and probe
- Adding (volume µL) Low TE to each primer and probe using the nmole concentration *10 as follows:
- FWD- 35.2*10=352µL Low TE
- REV-26.5*10=265µL Low TE
- PROBE-13.7*10=137 Low TE
- Added volumes of Low TE respectively as listed above to the vials and finger vortexed until well mixed, then centrifuged down.
C1V1=C2V2
(100µM)(x)=(10µM)(100µL)x=10µL of each primer or probe
100µL aliquot-10µL primer=90µL of nuclease free water
- Added water then 10µL of respective primers and probe, pipetted up and down, fingur vortexed till well mixed, then centrifuged down.
- There are 4 standards with three reps from what Megan gave us.
- Standards are with 5,10,25 and 50 larvae isolated using pK solution as we have been doing in the past.
- With NTC and Template control (using DNA from adult tissue isolated with DNAzol) we will have a total of 20 reactions. We do not have enough samples to run "technical" reps from each "biological" rep.
- Made master mix by first adding IQ powermix, then FWD/REV primers then probe using the volumes calculated below (changed % error from 10% to 15%):
| Master Mix Solutions |
Standard volume (μL) |
Multiply By |
new volume |
|
add pipette error |
Final volume to add (μL) |
| Master mix |
25 |
20 |
500 |
75 |
575 |
575 |
| FWD Primer |
1.5 |
20 |
30 |
4.5 |
34.5 |
34.5 |
| Rev Primer |
1.5 |
20 |
30 |
4.5 |
34.5 |
34.5 |
| Probe |
1 |
20 |
20 |
3 |
23 |
23 |
Preparing PCR plate
- Pipetted volumes into plate using the following diagram for plate set up.
| 1 |
2 |
3 |
4 |
- || A || NTC || 5*e1 || 5*e2 || 5*e3 ||
- || B || NTC || 10*e1 || 10*e2 || 10*e3 ||
- || C || NTC || 25*e1 || 25*e2 || 25*e3 ||
- || D || NTC || 50*e1 || 50*e2 || 50*e3 ||
- || E || NTC || || || ||
- || F || NTC || || || ||
- || G || TC || || || ||
- || H || TC || || || ||
- Will use 4μL template and 17μL water for all wells except from NTC wells which will have 29μL master mix and 21μL water since it won't have the 4 μL template added to it.
- Centrifuged down plate for 1 min at 2000RPM.
- Wiped down lids with kim wipe.
- Took to machine and ran same program as before.
- Checked the protocol that was in and all is set for the same method:
- Incubate 95C for 2 minutes 30 seconds
- Incubate 95C for 30 seconds
- Incubate 60C for 50 seconds
- Plate read
- Go to step 2, 39 more times
- Reaction volume was still set at 50μL.
- Hit run.
- Saved Tad file as 20151023_105717
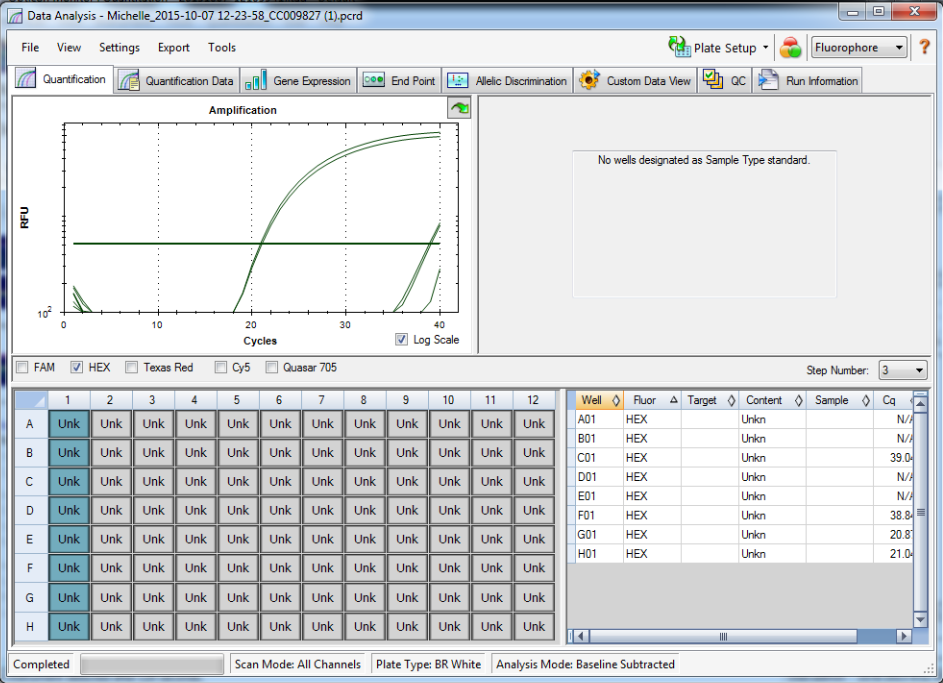
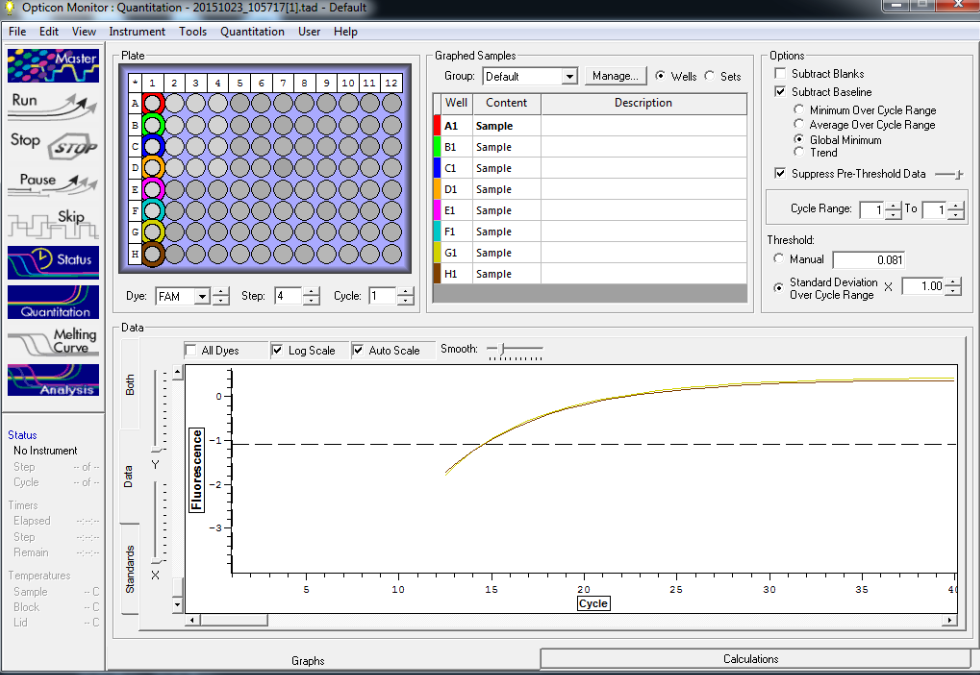
Results below of all reactions NTC and TC reactions in column 1, standard reps 1,2,3 in columns 2,3, and 4 respectively with row A B, C, and D are linked respectively with standards 5, 10, 25 and 50
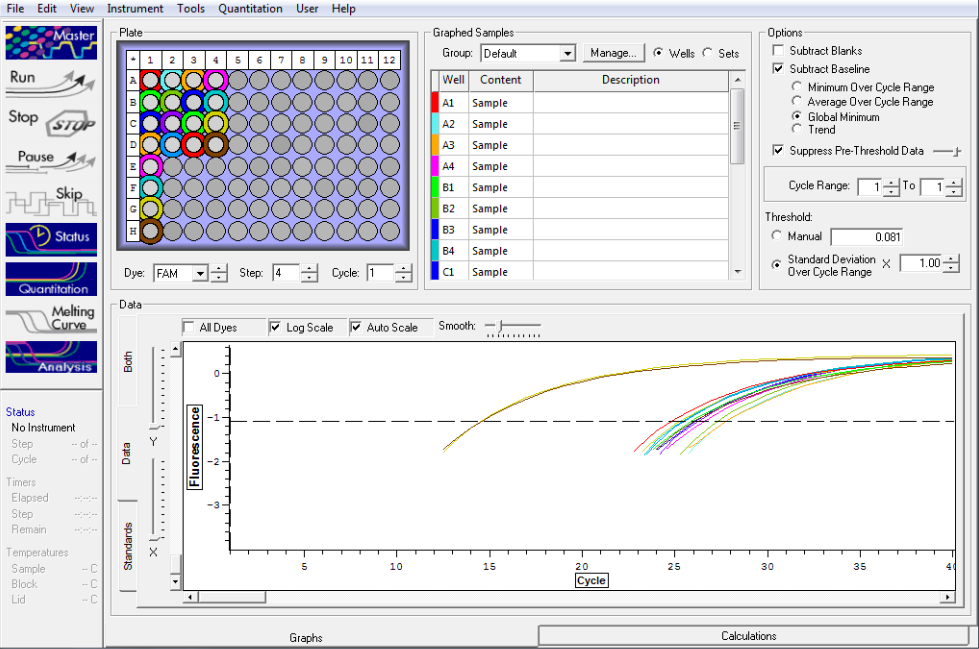 Standard rep 1 below. Step wise pattern present that corresponds with the standards created.
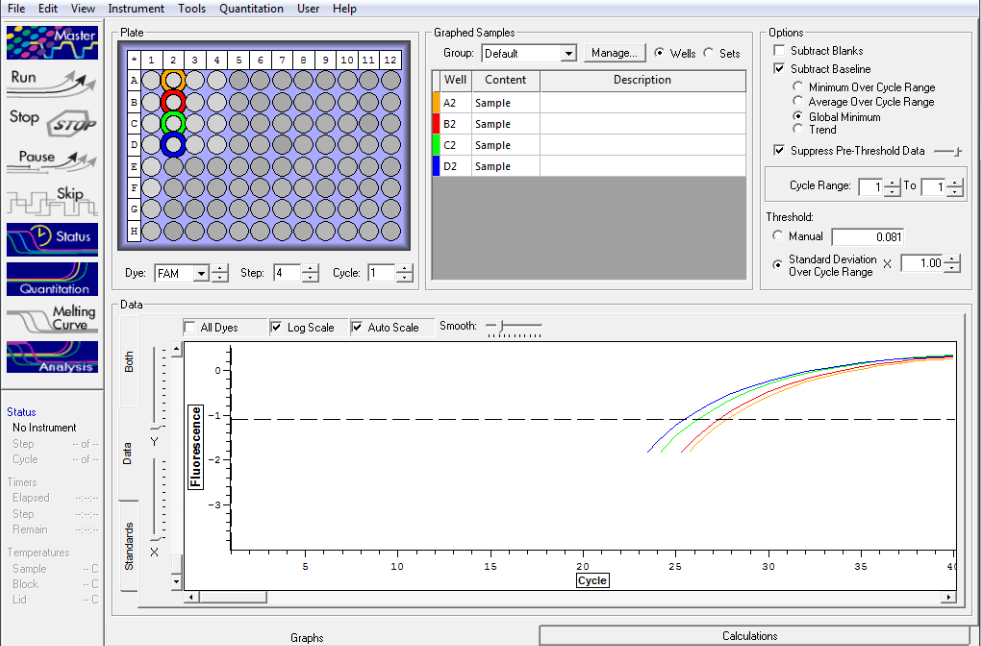
Standard rep 2 below. Step wise pattern present that corresponds with the standards created.
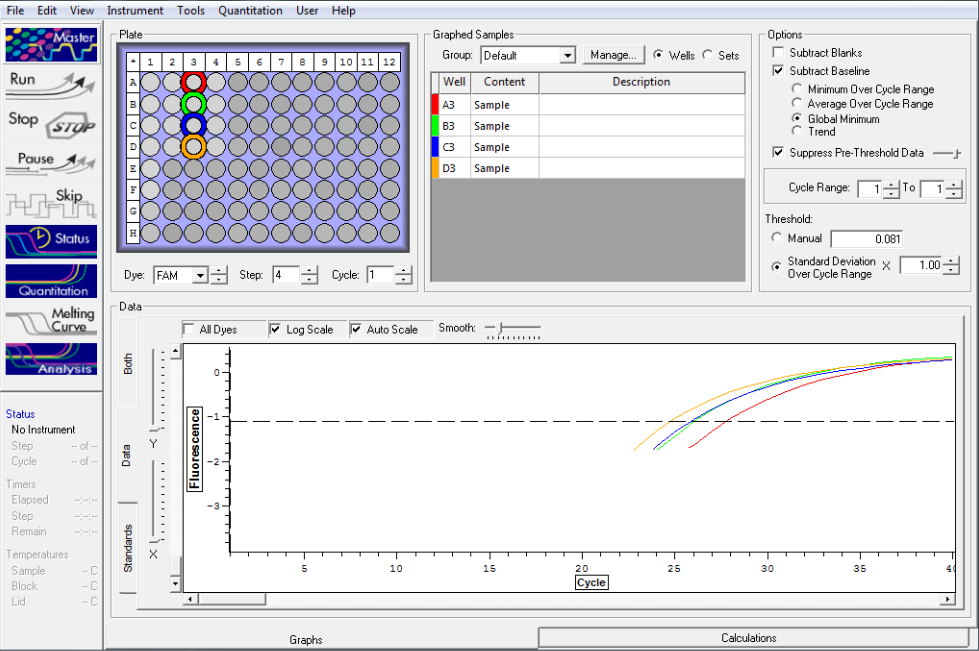
Standard rep three below. Seem to be pretty close here but show stepwise pattern.
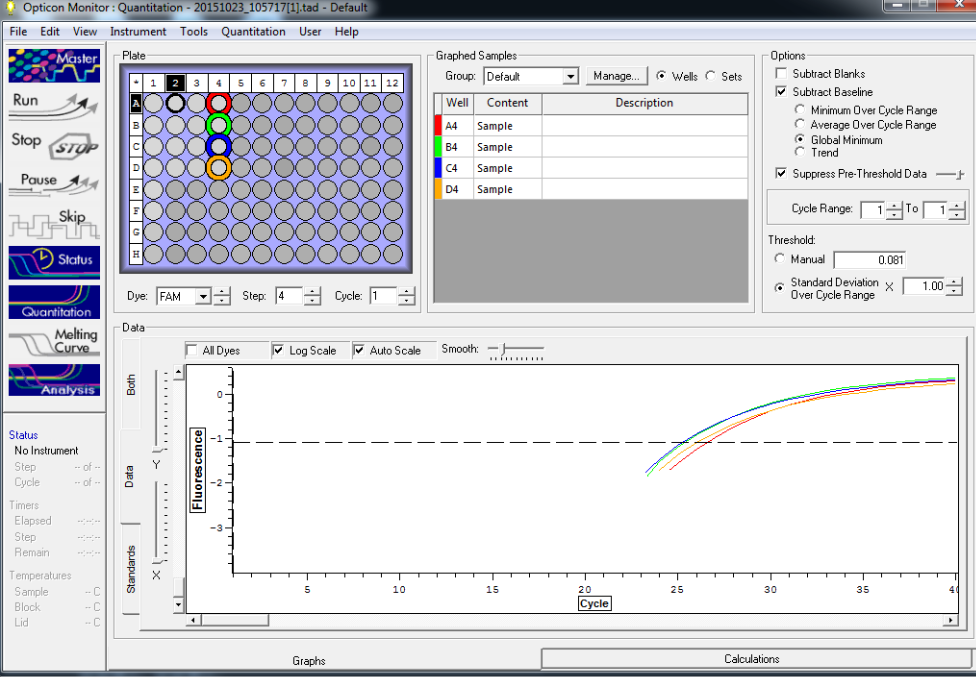
NTC and TC reactions shown below and there is no amplification showing in the NTC wells.
UWS-Roberts LabMcCartha, Smithhisler
qPCR run on SET 2 geoduck spiked plankton samples10/15/15Created by: Smithhisler
GoalsPerform qPCR on second set of plankton samples from Fidalgo Bay 2013 spiked with 1,5,10,25,and 50 16-day old geoduck larvae to check variance and methods.
MethodsPreparing aliquots of 10µM concentration primers and probe C1V1=C2V2
(100µM)(x)=(10µM)(100µL)x=10µL of each primer or probe
100µL aliquot-10µL primer=90µL of nuclease free water
- Brenda began by adding 90µL nuclease free water (MM, 10/2/15) to 3 clean, labeled micro centrifuge tubes (1 tube labeled for forward, 1 tube labeled for reverse)
- Then added 10µL of primer or probe to the correspondingly labeled tube (only 1 primer per tube, either forward or reverse) and mixed using pipette
- Solutions were then finger vortexed and inverted to mix then spun down using micro centrifuge spot spinner for 2 seconds
Preparing Master MixMichelle recommended the pipette error should be changed from 10% to 20% in calculations because of previous times where master mix ran out.
| Master Mix Solutions |
Standard volume (μL) |
Multiply By |
new volume |
|
Final volume to add (μL) |
| Master mix |
25 |
44 |
1100 |
220 |
1320 |
| FWD Primer |
1.5 |
44 |
66 |
13.2 |
79.2 |
| Rev Primer |
1.5 |
44 |
66 |
13.2 |
79.2 |
| Probe |
1 |
44 |
44 |
8.8 |
52.8 |
- First add power mix by splitting into a 1000uL pipette and a 320uL pipette.
- We did not run out of master mix, indicating 20% pipette error is enough
- If needing to conserve materials, a pipette error of 15% may be appropriate
- We did not run out of master mix, indicating 20% pipette error is enough
- Then Brenda added the fwd primer, then rev primer, then probe and mixed with pipette upon addition.
- Brenda gently finger vortexed the solution.
Preparing Spiked Samples
- Spiked samples after digestion with modified pK solution were centrifuged at 2000rpm for 15 seconds to draw down components.
- Brenda then pipetted out the supernatant from each vial and added to a correspondingly labeled 2mL vial.
- This was about 750uL for each sample.
Plate outline
| 1 |
2 |
3 |
4 |
5 |
6 |
7 |
8 |
9 |
10 |
11 |
12 |
|
| A |
NTC |
1PgRAW |
1PgRAW |
2PgRAW |
2PgRAW |
3PgRAW |
3PgRAW |
|||||
| B |
NTC |
1Pg1 |
1Pg1 |
2Pg1 |
2Pg5 |
3Pg1 |
3Pg1 |
|||||
| C |
NTC |
1Pg5 |
1Pg5 |
2Pg5 |
2Pg1 |
3Pg5 |
3Pg5 |
|||||
| D |
NTC |
1Pg10 |
1Pg10 |
2Pg10 |
2Pg10 |
3Pg10 |
3Pg10 |
|||||
| E |
NTC |
1Pg25 |
1Pg25 |
2Pg25 |
2Pg25 |
3Pg25 |
3Pg25 |
|||||
| F |
NTC |
1Pg50 |
1Pg50 |
2Pg50 |
2Pg50 |
3Pg50 |
3Pg50 |
|||||
| G |
TC |
|||||||||||
| H |
TC |
|||||||||||
- For each well, we began by adding 29uL of MasterMix.
- For NTC, water was then added next at a volume of 21uL.
- For wells with DNA or RAW:
- We added 4uL of template after the power mix (16-day old geoduck digested with modified pK method) and mixed with pipette
- Then 17uL of water was added and the solution was mixed with pipette.
- Column 1 was pipetted first
- Columns of the same biological rep were pipetted at the same time (ex: columns 2 and 3)(still changing tips every time)
- 7H has 4uL 3Pg50 template
- *Note: column 5 rows B and C were switched during pipetting
- Row B template was from the sample was spiked with 5 larvae
- Row C template was from the sample was spiked with 1 larvae
Brenda made sure all caps were tightly on the plate.The plate was then centrifuged at 2000rpm for 1 minute at 4C.
qPCR Cycle Parameters
- Incubate 95C for 2 minutes 30 seconds
- Incubate 95C for 30 seconds
- Incubate 60C for 50 seconds
- Plate read
- Go to step 2, 39 more times
TC=Template control of (18) 16-day old geoduck larvae supplied by Taylor Shellfish from March 2015NTC=No template controlRaw=Only plankton, not spiked w/larvaeOther samples as Tow rep #: Species:# of larvae spiked in sample-These samples contained either 0 (raw), 1, 5, 10, 25, or 50 Pg larvae digested in 700uL of modified pK solutionNote: these are different plankton samples than the qPCR run on 10/7/15Methodology for these samples differed than the samples ran on 10/7/15-there were three biological reps of plankton (split into 6 tubes)-these samples were spiked with larvae in a 50mL tube before being transferred into 2mL tubes (see note from 10/13/15 for clarification)
Results
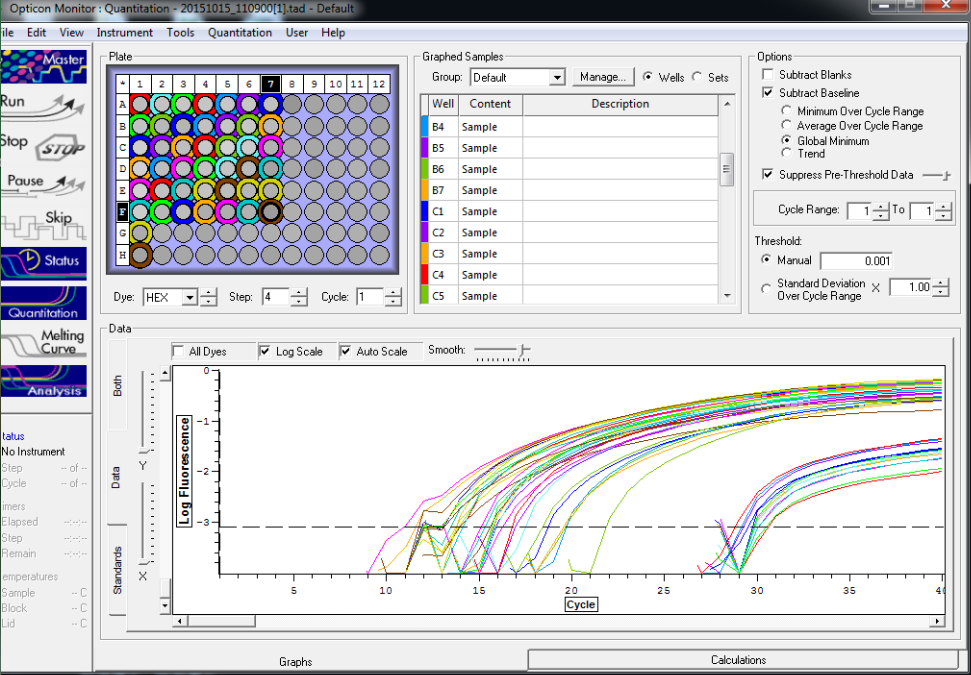
All reps and samples (above).
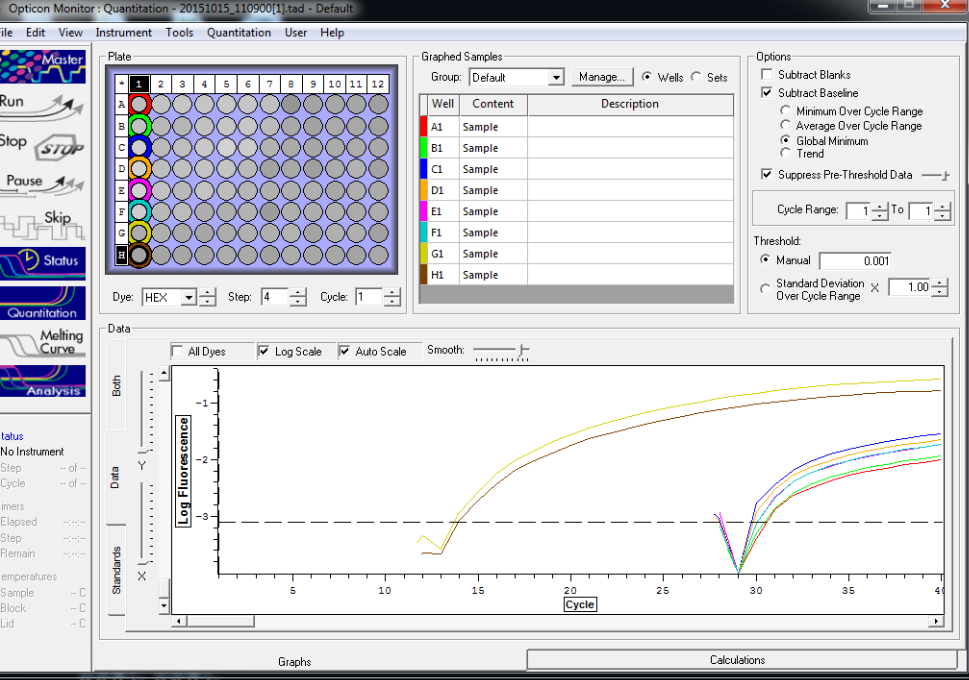
All TC and NTC reactions (above). Why we are seeing the NTC still amplifying I am not sure.
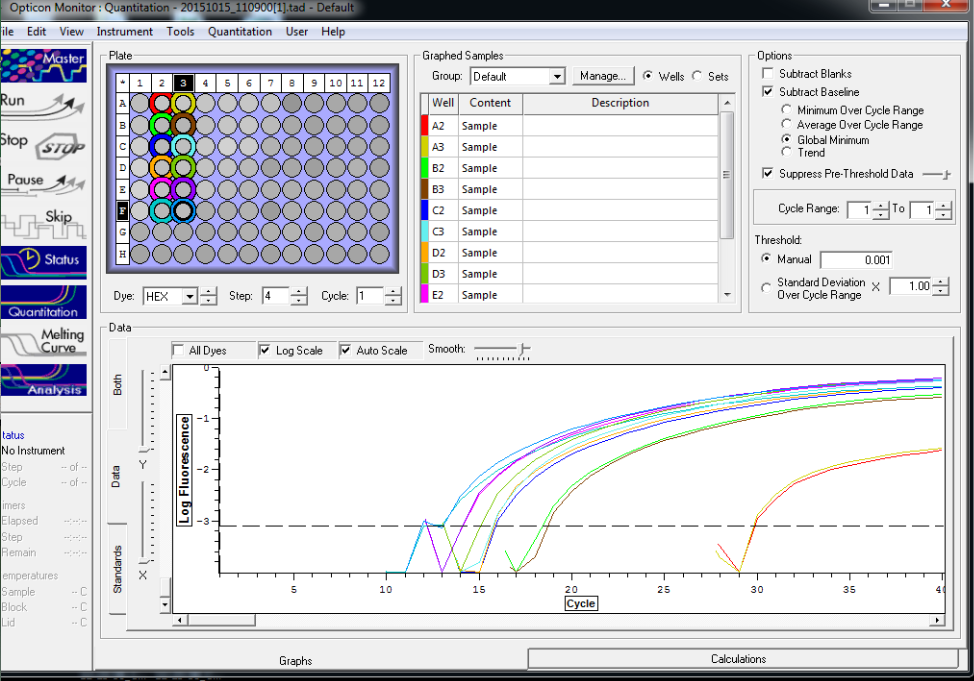
Reactions for first biological rep with two technical reps (above).
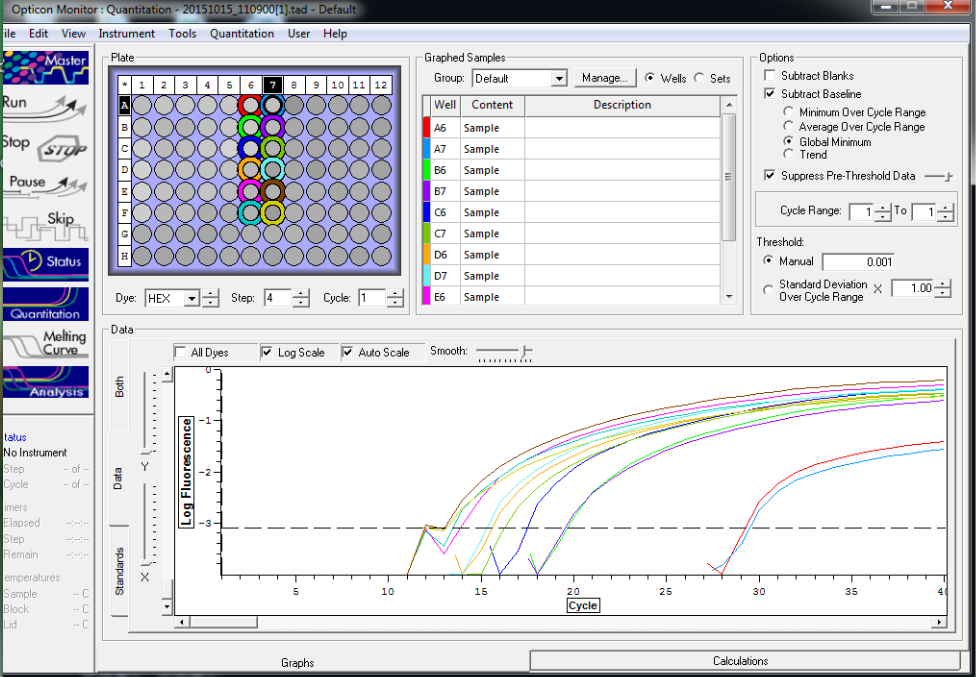
Reactions for third biological rep with two technical reps (above).
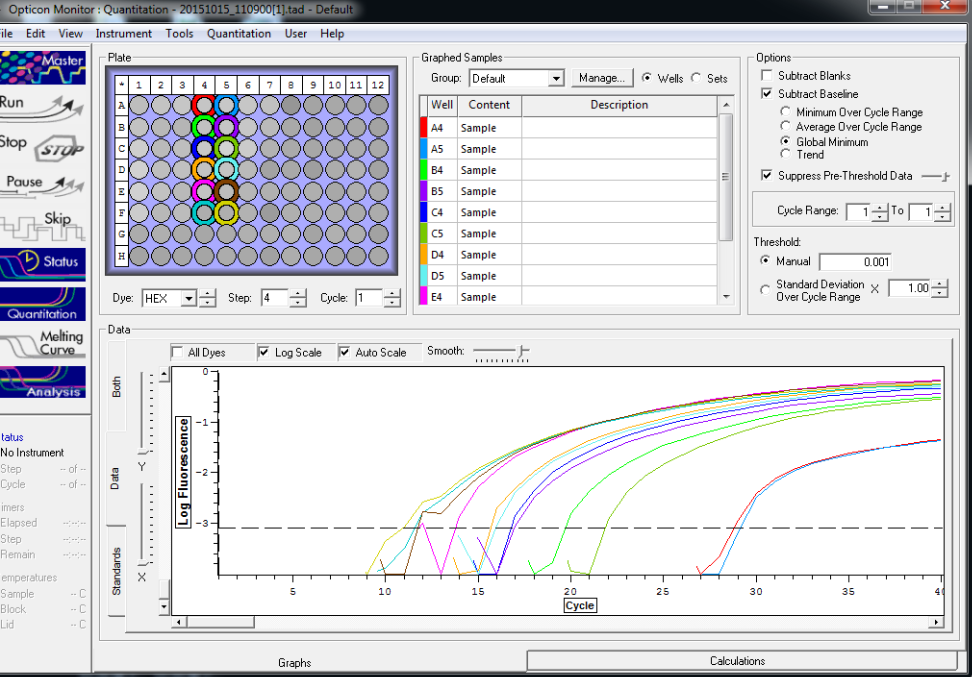
Reactions for second biological rep with two technical reps (above).
UWT-Becker LabSmithhisler
Testing different densities of sugar in the sugar gradient method10/24/15, 10/26/15 (counting cont.)Created by: Smithhisler
Spiking plankton samples
- I analyzed two, 50mL sample of plankton from Thea Foss (10/08/15) to make sure there were no bivalve larvae.
- I then spiked the samples with 40 Pacific Oyster (18-day old) (03/06/15) larvae using a pipette and rafter slide.
- I centrifuged the 50mL vials for 2 minutes at 1300rpm.
- The supernatant was pipetted off in each vial using a 5000uL pipette in intervals of 5mL at a time and expelled into a petri dish. The tip of the pipette was held by the top and ejected, then the interior and exterior rinsed with 95% ethanol that was added to the petri dish. The supernatant was checked for larvae microscopically.
- Then, for the pellet of each plankton sample (and density), I then swirled the sample up and poured it at an angle gently into the vial with 20mL of syrup so the sample rested on top. I then used the ethanol squirt bottle to rinse as much as possible from the sample to the syrup. This was easiest holding the vial upside down and squirting to the bottom (which is now at the top) and letting the sample flow down and out of the vial.
- I then centrifuged the sample for 2 minutes at 1300rpm.
Analyzing Sugar Gradient 1.05g/cm3 Density Syrup Trial (syrup prepared 10/09 by BS)
- I began to analyze the sample by pipetting off the phase 1 from the vial and checking for bivalve larvae under the microscope in a counting plate that was rinsed with Micro90 and water and dried with a paper towel. I then rinsed the sample with 95% ethanol into another vial labeled with phase 1,2 and the density of 1.05g/cm3.
- I found 0 larvae in Phase 1.
- I then pipetted out phase 2, checking for larvae. When phase 2 had decreased in volume, I gently added 95% ethanol to the top of the solution to resuspend any remaining phase 2 contents and pipetted them out. However, it was difficult to not pipette up any syrup, and some of the very top of phase 3 was pipetted. I had to use water to then rinse the pipette tip into the counting dish.
- I found 7 larvae in phase 2.
- I then pipetted out only the pellet from the bottom of the tube, leaving phase 3. I attempted to gather all of the materials that had collected at the bottom, but I will check phase 3 in a linear fashion as done previously to make sure I did not miss any larvae when pipetting the pellet.
- I found 33 larvae.
- I then checked phase 3, beginning with the top down, and performing a rinse of the vial with water.
- There were no larvae in phase 3.
Analyzing Sugar Gradient 1.1g/cm3 Density Syrup Trial (syrup prepared 10/09 by BS)1.1g/cm3
- I began by pipetting off of phase 1 and analyzing for larvae.
- There were no larvae present in phase 1 (the supernatant).
- I then pipetted out phase 2 as much as possible, attempting to avoid grabbing sugar from the top of phase 3. This is very difficult! I added ethanol to the top of the phase 3 surface by running it down the sides of the tube to gather any phase 2 remains. I pipetted out as much as possible, again trying to avoid the sugar, but getting some in the pipette.
- To rinse the pipette tip, I had to use water to get off any sugar residue. This creates an issue with the EtOH and water interaction in the counting dish. However, the current is not too strong that larvae do not settle, so they may still be counted. It is important to realize that the sample from phase 2 is no longer preserved in 95% ethanol because of the rinse with water.
- I found 5 larvae in the phase 2.
- There were many gastropods in this phase.
- I then used a 5mL pipette to gather the pellet and add it to the counting dish. This leaves uncertainty because the pellet is pipetted using visual judgement (as in, there is some pellet debris on the very bottom as well as on the sides of the bottom “V” of the tube”). I attempted to gather as much as possible that I could see, but decided it would be best to pipette out as if I were taking the pellet once more because there was still particles that I could see at/near the bottom (distinguished from the particles ‘floating’ at the top and middle of phase 3). After ejection, the pipette tip for this step has to be rinsed with a generous amount of water. The syrup also changes the view of the polarized lens a little as well. After examining, I added both counts to a vial labeled “pellet”.
- If we ‘miss’ larvae when gathering the pellet, will we want to sort through all of the sugar when performing real samples?
- The first count of the pellet I found 21 larvae.
- The second count of the ‘pellet’, I found 5 larvae.
- I then counted phase 3 in 5mL increments, working from the top down to try to find any remaining linear pattern in larvae distribution throughout the sugar.
- I found only 1 larvae in the last 5mL of phase 3.
- This totals to only 32 larvae (a loss of 8).
- To attempt to understand the loss, I rinsed the sides of the original density vial with water and shook it horizontally. I then added this to a petri dish. There were no larvae.
- Another comment is that I may have mistaken Pacific oly’s for snails.
Future Steps for Sugar Gradient Method
- Re-try 1.1 density?
- More centrifugation (longer time)? -clearer results, more compact pellet
- Different sized larvae for a mixed sample, maybe try first with just ethanol?
- —> faster sorting
- Less sugar? —>look into papers for information on this
UWT-Becker LabMcCartha, Smithhisler
PCR w/Cg old and current primers and larvae and adult DNA10/20/15Created by: Smithhisler
GoalsRun PCR and gel electrophoresis on Cg DNA from larvae and adult using old and current primers.
MethodsPreparing Mastermix
- We will perform 12 total reactions today
- 1 ladder
- 1 NTC
- 1 reaction of 2μL Pk adult DNA with 4μL of loading dye and the rest water to create a total volume of 25μL
- 3 reactions of 2μL Pk digested larvae DNA with 4μL of loading dye and the rest water to create a total volume of 25μL
- 3 reactions of current primers with undyed DNA
- 3 reactions of old primers w/undyed DNA
- This translates to 3 reactions using old primers and 3 reactions using new/current primers
- Old primers:
- Cg_CCGS4F
- 5’-TATTCGTTGGAGACTTTATAAC...-3'
- 25 bases
- Manufactured 08-Apr-2015
- Aliquot prepared 04-30-15
- Cg_CCGS4R
- 5’-AAGGCTTAGAATTGCAAGGTCT...-3'
- 25 bases
- Manufactured 08-Apr-2015
- Aliquot prepared 04-30-15
- Cg_CCGS4F
- New/current primers:
- CG/G/ANG16S_F
- 5’-GGGCGCCTAGAAAGCAAGT-3'
- Manufactured 23-Aug-2015
- Aliquot prepared 10-02-15
- CG/G/ANG/16S_R
- 5’-ATCGGGTCAAATCCGGAAAG-3'
- Manufactured 23-Aug-2015
- Aliquot prepared 10-02-15
- CG/G/ANG16S_F
- Old primers:
| Mastermix calculations for each set of primers |
|||||
| Materials for Mastermix (μL) |
Standard volume (μL) |
Multiplied by (rx) |
New volume (μL) |
Pipette error 10% |
Total volume (μL) |
| Mastermix |
12.5 |
3 |
37.5 |
3.75 |
41.25 |
| Forward primer |
0.5 |
3 |
1.5 |
0.15 |
1.65 |
| Reverse primer |
0.5 |
3 |
1.5 |
0.15 |
1.65 |
| Water |
9.5 |
3 |
28.5 |
2.85 |
31.35 |
- Prepared mastermix by adding mastermix, then fwd primer, then rev primer, then water last, mixing with pipette upon each addition.
- Mastermix: GoTaq Hot Start Green Mastermix 2X
- Tubes labeled as ‘Old MM’ and “New MM'
Preparing DNA samples
- To prepare reactions of DNA with loading dye, each reaction will need 2μL of DNA and 4μL of dye. In the calculations to prepare dye and DNA solutions, I added a 10% pipetting error. This solution will then be topped off with water for each reaction to equal 25μL (adding 19μL of water).
| Sample |
Standard amount (μL) |
Reactions |
New volume (μL) |
Pipette error (10%) |
Error volume (μL) |
Total volume (μL) |
| Larvae DNA |
2 |
3 |
6 |
0.1 |
0.6 |
6.6 |
| Larvae loading dye |
4 |
3 |
12 |
0.1 |
1.2 |
13.2 |
| Adult DNA |
2 |
1 |
2 |
0.1 |
0.2 |
2.2 |
| Adult loading dye |
4 |
1 |
4 |
0.1 |
0.4 |
4.4 |
- For the 3 reactions of DNA from Cg larvae, I began by pipetting 13.2μL of 6X Orange DNA loading dye to a new, labeled 2mL tube. I then added 6.6μL of (20) 18-day old Pacific oyster DNA digested with modified pK solution (Tube 4) to the tube and mixed with pipette.
- For the one reaction of DNA from adult Pacific oyster, I pipetted 4.4μL of Orange DNA loading dye into a new 2mL tube. I then added 2.2μL of Cg adult DNA digested with DNAzol from 05/12/15 and mixed with pipette.
Preparing 8-tube PCR strip
| 8-tube strip set-up |
||||||||
| Strip 1 |
||||||||
| Tube |
1 |
2 |
3 |
4 |
5 |
6 |
7 |
8 |
| Name |
OLU1 |
OLU2 |
OLU3 |
|||||
| Description |
Old primers, undyed larvae 2 |
Old primers, undyed larvae 2 |
Old primers, undyed larvae 3 |
Empty |
Empty |
Empty |
Empty |
Empty |
| 23uL old mastermix |
||||||||
| 2uL larvae DNA |
||||||||
| Strip 2 |
||||||||
| Tube |
||||||||
| Name |
NTC |
AD1 |
LD1 |
LD2 |
LD3 |
CLU1 |
CLU2 |
CLU3 |
| Description |
No template control, 23uL master mix + 2uL water |
6uL dyed adult DNA |
6uL dyed larvae DNA |
6uL dyed larvae DNA |
6uL dyed larvae DNA |
23uL new mastermix |
23uL new mastermix |
23uL new mastermix |
| 19uL water |
19uL water |
19uL water |
19uL water |
2uL larvae DNA |
2uL larvae DNA |
2uL larvae DNA |
||
PCR cycleChose PCR reaction for the Pg_4-24-15 program under ‘Bonnie' as listed below:
Step 1) 95.0°C-10 minutes
Step 2) 95.0°C-20 secondsStep 3) 65°C-20 seconds
Step 4) 72°C-30 seconds
Step 5) Repeat steps 2-4 39 more times (40 times total)
Step 6) 72°C-2 minutes
Step 7) Hold at 4°C foreverCycle began at 1:09pm, will finish at 2:48pm.
Preparing Gel Electrophoresis
- Michelle prepared a 1.2% agarose solution and poured into gel mold to cool and form.
- Michelle carefully placed the agarose gel into the gel box and poured 1X TAE buffer until buffer filled both sides of the gel box and covered the gel.
- Brenda pipetted 10uL of each reaction into its corresponding well as outlined below
| Well |
1 |
2 |
3 |
4 |
5 |
6 |
7 |
8 |
9 |
10 |
11 |
12 |
| Sample |
Ladder |
NTC |
OLU1 |
OLU2 |
OLU3 |
CLU1 |
CLU2 |
CLU3 |
AD1 |
LD1 |
LD2 |
LD3 |
Results
 Well order: Ladder, NTC (current primer mastermix), Old primers w/un-dyed larvae DNA (Reps 1, 2, and 3), Current primers with un-dyed larvae DNA (Reps 1,2,3), well 9 is dyed adult DNA and water, then wells 10, 11, and 12 are the reps of dyed larvae DNA and water.
-Although faint, there is amplification for larval DNA combined with both the old and current primers (wells 3-8). It appears that overall there may be slightly increased amplification with the new primers in comparison to the old primers.-The DNA and dye did not amplify for larvae nor adult DNA samples.
Future StepsThe results of this PCR reaction show that the primers for Cg do allow amplification of larval DNA. Combining this information with the inconsistency of qPCR results so far with Cg, it is thought that the probe may be causing issues. However, it is thought to be important for DNA to be re-isolated (Megan mentioned the reoccurring thawing/freezing cycles may be damaging to reaction components). This will be the next step for Pacific oyster, geoduck, and Olys.
UWT- Becker LabMcCarthaStart DNA isolation using modified pK solution 10-14-15Created by Michelle McCarthaGoal:To start cooking spiked plankton samples that were prepared 10-13-15 for overnight digestion.Methods:
- Vials have been sitting in the fumehood for overnight drying since 10-13-15.
- Took 15ml vial of pK solution that was prepared on 10-12-15 by BS out of the freezer and set out to thaw.
- Used hand friction occasionally to assist in thawing solution.
- Once the solution was completely thawed, inverted to mix well and then pipetted out 0.7ml of solution and dispensed into each sample vial closing lid afterward.
- When all samples had been given solution suspended pellet by inversion and finger vortexing.
- Placed samples on heat block set to 61C which reads 56C on thermometer.
- Let sit overnight.
- Brenda will finger vortex and check temperature throughout the day.
UWT-Becker LabMcCartha, SmithhislerMake pK solution10/13/15Created by: SmithhislerGoalsMake 80mL of modified pK solutionSpike more plankton samples with geoduck larvaeAnalyze sugar gradient performed by BS on 10/09MethodsMaking modified Pk digestion solution from Wright et al. 2009-Brenda
- We had a 100mM Tris base solution already prepared by MM 08/04, but the SOP calls for 10mM concentration.
- C1xV1=C2xV2
- 100mMxV1=10mMx80mL
- V1=8mL of 100mM Tris base
- To dilute, I rinsed a 10mL graduated cylinder with nanopure water. I then poured 8mL of the 100mM Tris base into the graduated cylinder. I rinsed a 50mL Erlenmeyer flask with nanopure water. I added about 15mL of nanopure water to the flask. I then poured the measured 8mL of Tris base solution from the graduated cylinder into the flask. I rinsed the graduated cylinder twice with nanopure water and added the rinse solution to the flask.
- To calculate the amount of KCl required to make 50mM solution in 80mL final volume, I used the molar mass to determine grams of KCl to add.
- Molar mass (g/mol) x Desired molarity (mol/L) x Final volume (L)= mass (g)
- 74.5513g/mol x 0.05M x 0.08L=0.298g of KCl
- I measured 0.298g of KCl in a weigh boat (actual mass: 0.299g). Then, I added the KCl to the Erlenmeyer flask with Tris base and water by pinching and folding the weight boat, and scooping and tapping the the KCl into the flask using the scupula. To get any further residual salt, I gently and lightly rinsed the weight boat with nanopure water and allowed it to run into the flask, making sure to keep in mind that the pK solution still needed additional material added to it. The solution in the flask was swirled to dissolve the KCl.
- To determine the amount of Tween-20 to add to the solution, I used the desired final concentration of 0.5% Tween 20 and the final volume of 80mL
- 0.5%/1000=0.0005
- 0.0005 x 80mL=0.04mLx1000µL=40µL
- I slowly pipetted up 40µL of Tween 20 in a 100µL pipette, trying to avoid bubbles in the pipette tip. The 40µL was then added to the Erlenmeyer flask, carefully and gently mixing with the pipette in different locations in the pK solution to mix thoroughly but still trying to avoid bubbles.
- I then added 4mL of Proteinase K using four 1mL vials of Proteinase K and a 1000µL pipette. For each 1mL, I changed pipette tips and checked for residual Proteinase K for keeping. Each of the pK vials was kept with residual pK.
- 4mL of 20mg/1mL=80mg/mL into final volume of 80mL to obtain 80mg/80mL and a 1mg/1mL final concentration
- I poured the solution into the 100mL graduated cylinder and rinsed out the flask with nanopure water, adding the contents of the rinse to the graduated cylinder. I then poured the solution in the graduated cylinder back into the flask for mixing. I carefully poured the solution in the flask back into the graduated cylinder. I rinsed the Erlenmeyer flask twice with nanopure water, adding the contents to the graduated cylinder. I then added nanopure water to the graduated cylinder up to the 80mL mark.
- I distributed the 80mL solution into (6) labeled and clean 15mL vials and placed in the freezer and returned KCl and Tween 20 to the chemistry prep room.
- Note: I incorrectly labeled all of the tubes with yesterday’s’ date of 10/12/15.
Spiking plankton sets with geoduck-Michelle
- Need to spike another round of plankton sets (three biological reps) so that we can test variance and methods.
- This time we are spiking the plankton samples prior to dispensing into 2ml tubes and drying out as we will do with live samples.
- Pulled Fidalgo Bay plankton form 2013. This plankton was preserved in 95% ethanol and is from a round of pump samples but was labeled incorrectly so they were not able to use it. This sample does have bivalve larvae in it but since the level of DNA will be across the board for all spiked treatments we should be able to set the threshold to account for it.
- Treatments will be the same as last time with 3 homogenous plankton samples cut between 6 50ml tubes and then spiked with 1,5,10,25 and 50 larvae with an additional “raw” sample as a “zero”.
- Labeled vials with Set 2 and the species abbreviation/number biological rep/ then treatments so that Pg2.25 will read as geoduck biological “plankton” rep 2 spiked with 25 larvae.
- Pipetted 12ml plankton after mixing by inversion into a the first biological rep treatment “raw” and mixed by inversion again.
- Pipetted 2ml of plankton from 12ml homogenous sample in “raw” tube and dispensed into remaining 5 tubes so that each treatment had 2ml plankton in it.
- Repeated for the rest of the treatments.
- Decided that there was a lot of plankton in the samples so pipetted out 1ml of each sample and pipetted in tubes labeled with the corresponding biological rep and treatment number as the original tube. These additional tubes will be saved for future spike testing of larvae.
- For the tubes that will be spiked today set aside and took out geoduck stock collected from Taylor in March. These are 16-day old geoduck larvae.
- Cleaned microscope area and cleaned microscope slide with bleach and triple rinse with di water from tap and a forth rinse with ultra pure water then dried. Using pipette (new tip for each time taking out larvae) pipetted out geoduck larvae and dispensed onto slide. Counted # of larvae needed for treatment while pipetting up and dispensed into treatment tube. Did this for all spiked samples.
- Once the samples were spiked took centrifuge and (using new tip per sample) pipetted 1ml at a time from the bottom up, plankton sample and placed in 2ml tube with same label.
- Once pipetted sample spun down and added more plankton to tube. This repeated until the plankton sample was pipetted completely out of the 50ml tube and placed into 2ml tube. Remaining liquid in 50ml tubes will be checked for larvae left behind.
- Brenda checked the original 50mL vials to make sure all larvae were transferred. She did this by pouring the ethanol contents of the vial into a counting plate. She then rinsed the sides of the tube and added the contents to the plate. She then performed an inverted rinse to obtain anything stuck on the very bottom of the tube or that did not run off with previous ethanol.
- She did not find any larvae, indicating success of the transfer of sample.
- Brenda then centrifuged each 2mL tube and pipetted off the ethanol supernatant without disturbing the pellet. After this was done for each tube, she uncapped the tubes and sat them in the fume hood to dry overnight.
Analyzing Sugar Gradient 1.15g/cm3 Density Syrup Trial from 10/09 by BS-Brenda
- The vial that was previously centrifuged had been set out for 4 days. It appeared that phase 2 had combined with the top of phase 3. It also appeared that most of the particles suspended in the sugar had settled. If results are promising for bivalve larvae separation, additional centrifugation may lead to full sample component separation. When MM and BS performed sugar gradient trials previously, the vial was centrifuged once at 1300rpm for 2 minutes. MM separated the phases into different vials after centrifugation.
- I began to analyze the sample by pipetting off the phase 1 and phase 2 from the vial and checking for bivalve larvae under the microscope in a counting plate that was rinsed with Micro90 and water and dried with a paper towel. I then rinsed the sample with 95% ethanol into another vial labeled with phase 1,2 and the density of 1.15g/cm3 .
- Had to rinse pipette and dilute contents in dish with nanopure water because Phase 2 had ran into the sugar content. This means the phase 1 and 2 plankton is no longer preserved in 95% ethanol.
- I found 6 very small larvae in Phase 1 and 2.
- Mostly micro algae and holoplankton.
- I then examined the upper portion until 5mL above the pellet of phase 3 (syrup) by pipetting out 4mL of syrup at a time, moving from the top to the pellet, and adding it to a counting dish. I had to rinse the pipette tip with water and add water to the plate which diluted the syrup and made it easier to be able to visualize the sample.
- There was 1 larvae in the top 4mL (at the 14-18mL 'mark')
- There was 1 larvae in the syrup between the 10-14mL marks
- There was 1 larvae between about 7-10mL
- There were 3 larger larvae between 3-7mL ‘marks’, but these are not believed to be the species spiked with
- For the final ~4mL (some of phase 3 and the pellet) of the sample I pipetted out 1mL at a time.
- The final 4mL of the sample had 31 larvae
Results of Sugar Gradient MethodThere were 9 larvae that were in Phase 1, 2, and the top 14mL of phase 3. Most (31) of the larvae were in the bottom 4mL of the syrup, however we need to discern exactly the accuracy of this method for isolation in the pellet.There was not a net loss of larvae. This is great news. However, since there were more bivalve larvae than 40 (3 larger ones) that were excluded based on size (the spiked geoduck were small), there is a chance for error in this result. When testing future gradient densities, it is worth making sure there are no larvae to begin with in the plankton sample.
Future Steps for Sugar Gradient Method
- I will perform this method with a lower density syrup of 1.10g/cm3 to see if we can lower the number of the larvae in phases 1 and 2 and the upper section of phase 3 (one quarter of the spiked larvae). This method, upon analyzing results of the other densities, may need to be re-tested because the final counts were not specifically the pellet and the pellet/phase 3 were mixed together.
- The steps for testing the sugar gradient in the future are...
- Pipette each phase into a new tube.
- First pipette all of the ethanol, then pipette the film into a new tube.
- Then, try pipetting around 1mL from the very bottom of the vial to gather all of the pellet and transfer to a new tube.
- Then each of the phases can be counted individually to determine the accuracy of the method.
- Pipette each phase into a new tube.
UWT- Becker LabMcCartha
Creating primers and probe for Pacific oyster 10-10-15Created by: Michelle McCartha
Goal:
- Find sequence for Pacific oysters in Puget Sound in NCBI
- From sequences found pick out primers and probe through IDT
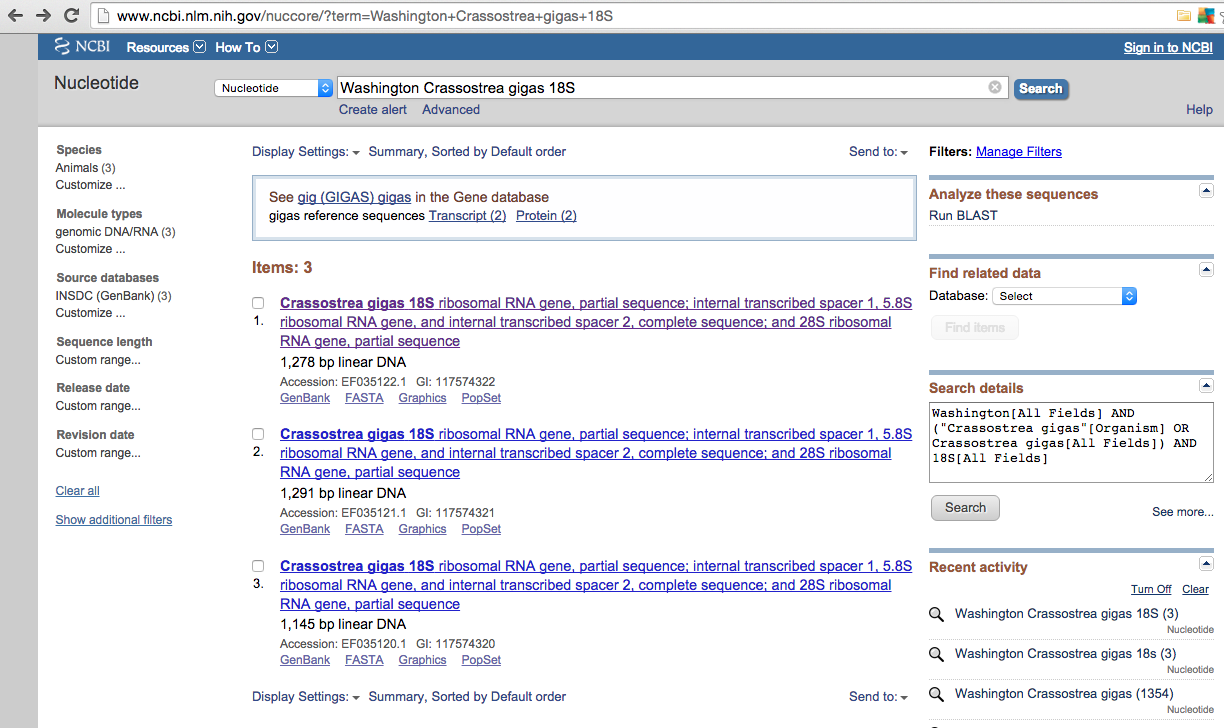
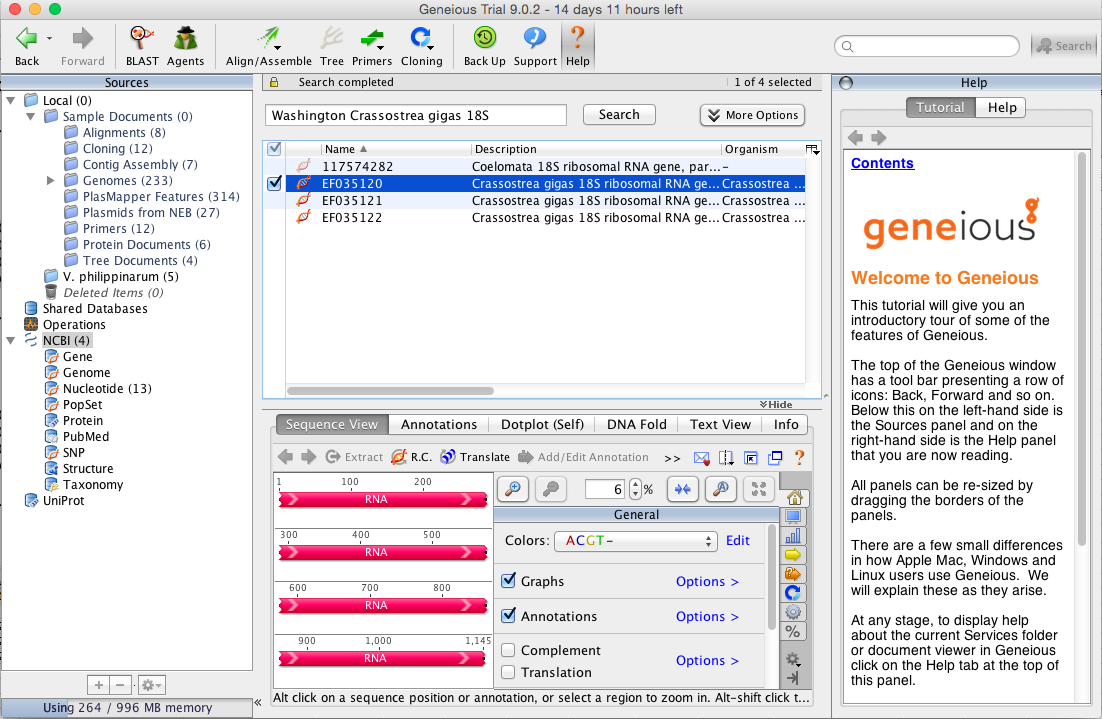
Methods:Starting at NCBI website typed into database search: Washington Crassostrea gigas 18SResults came back with similar matches to that of manila clam (image below).Assuming that what I compiled for the manila clam was correct, I will treat these results in the same fashion by aligning them in the Geneious program and extracting sequences to retrieve primer and probes from in IDT.
 Opened Geneious, clicked NCBI under operations in sources taskbar, typed in Washington Crassostrea gigas 18S in search bar and clicked search.Came up with same three sequences (Image below) as well as another option which links to a document- Ignoring the forth option and highlighted the three sequences that match findings in NCBI.
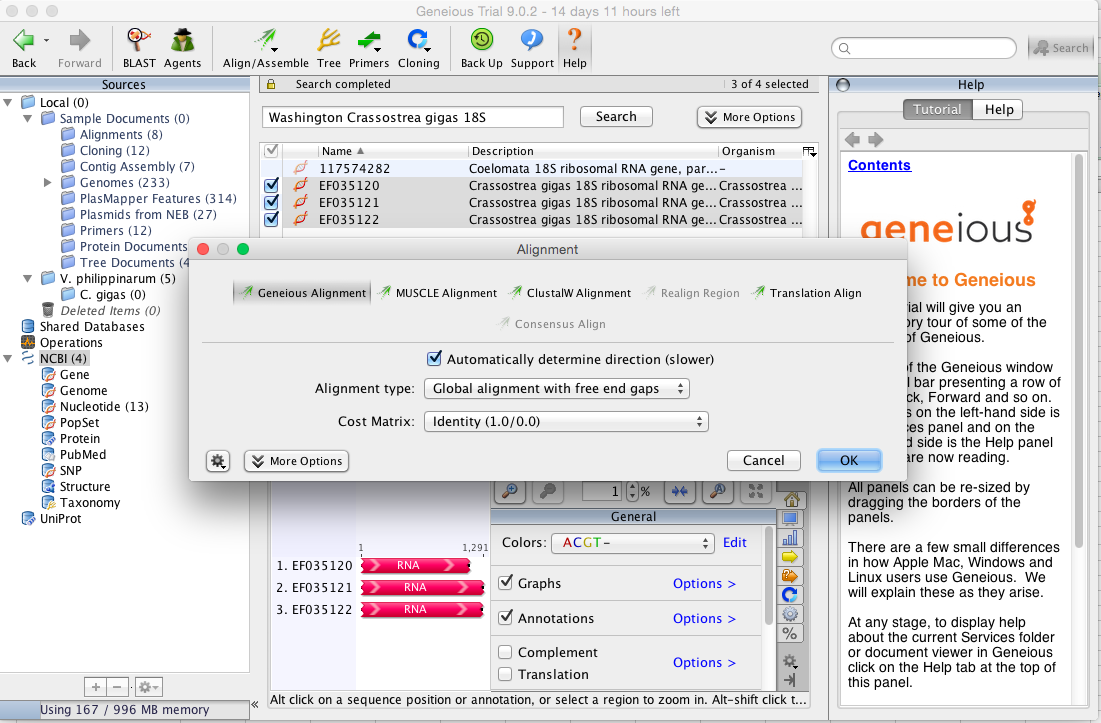
Highlighted the three sequences and hit Align/Assemble dropdown and clicked Multiple Align, selected new folder and typed in C. gigas for New Folder Name. Clicked OK twice to save file in folder and continue with alignment. Came up with alignment options (image below) and kept as same options that I ran with the manila clam as shown in the following image.
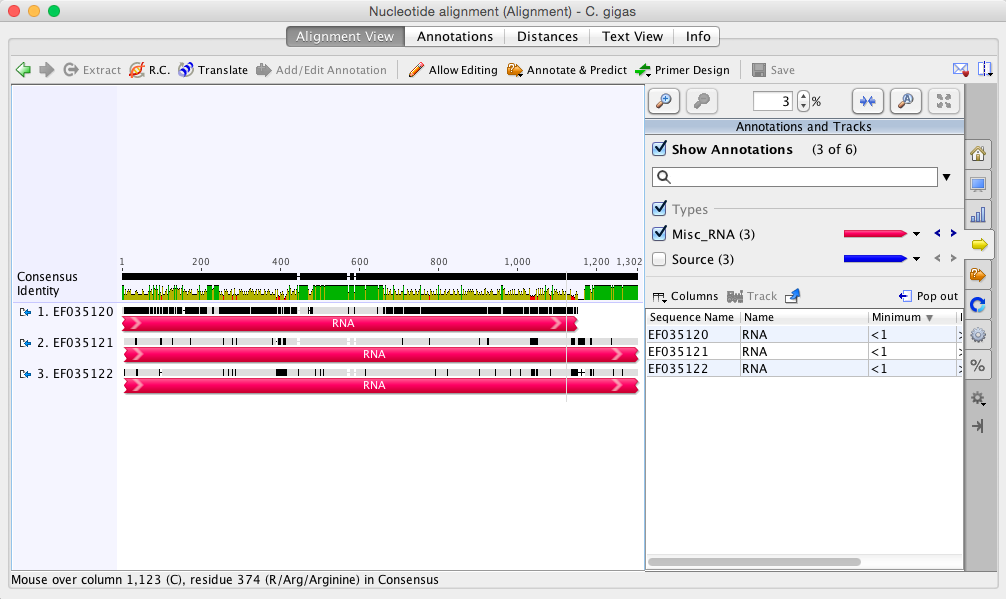
Clicked OK and waited for program to do it's magic. Results came back and the sequence alignment was a lot more choppy looking than the manila clam was. Below is a broad view and then I'll single out the longest fragment that is conserved in all three sequences.
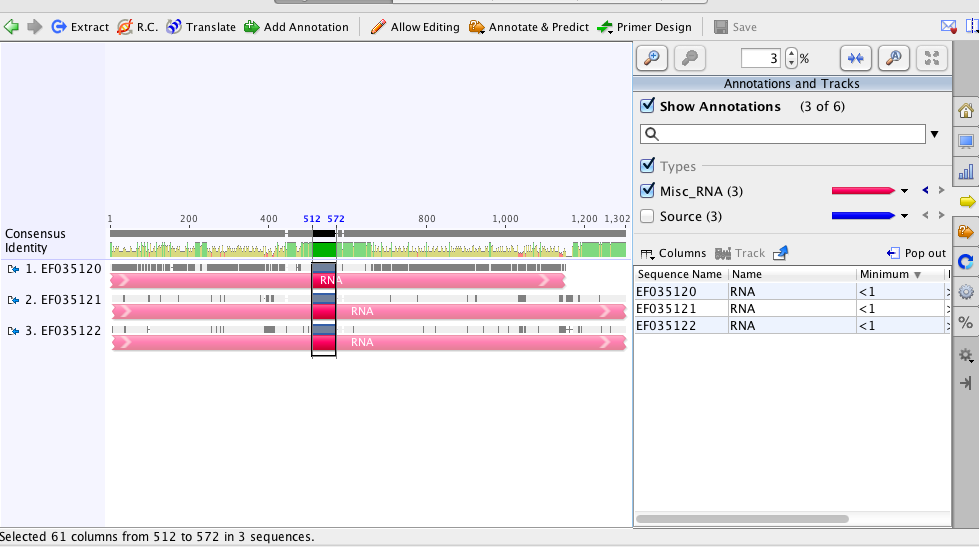
 The longest fragment (image below) is 60bp in length which may be too small to run with in IDT for primers and probe.
UWT- Becker LabMcCartha
Continuation of finding sequences for Manila clam 10-9-15Created by: Michelle McCartha
Goals:
- Contact Sam and ask advise on aligning sequences from NCBI for manila clam.
- Proceed as advised or as am doing manually to align sequences.
- Generate primers and probe in IDT and send to Steven for approval.
Methods:
- Contacted Sam and told him it was taking FOREVER to align the sequences and asked if there was a better way to set it up.
- He suggested a program called Geneious which has a 14 day free trial.
- I downloaded the program and signed up for the trial.
- In Geneious, you can search the GenBank on NCBI which is super cool, so typed in Washington Venerupis (Ruditapes) philippinarum as I had done in NCBI to locate the sequences Steven pulled.
- Came up with the same sequences but verified the Accession number just in case.
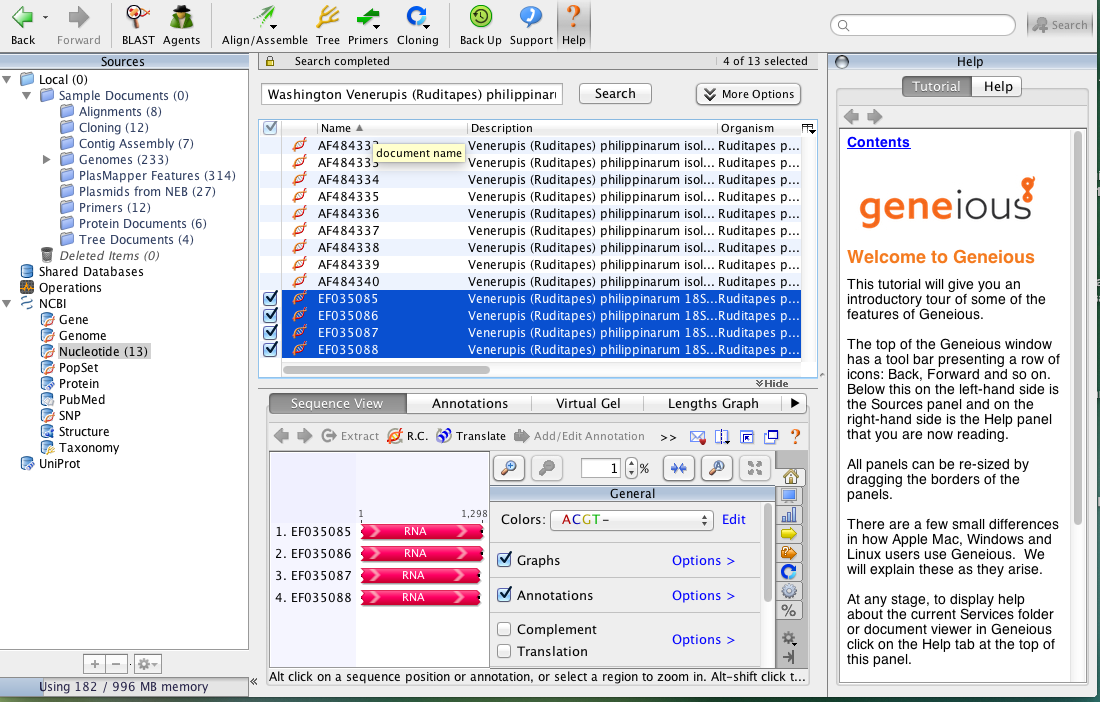
Highlighted as shown above and clicked on Align/Assemble drop down.
- Clicked on Multiple align (did this only because it looks like the best option since I have multiple sequences).
- Came up with location options and created new folder named V. philippinarum.
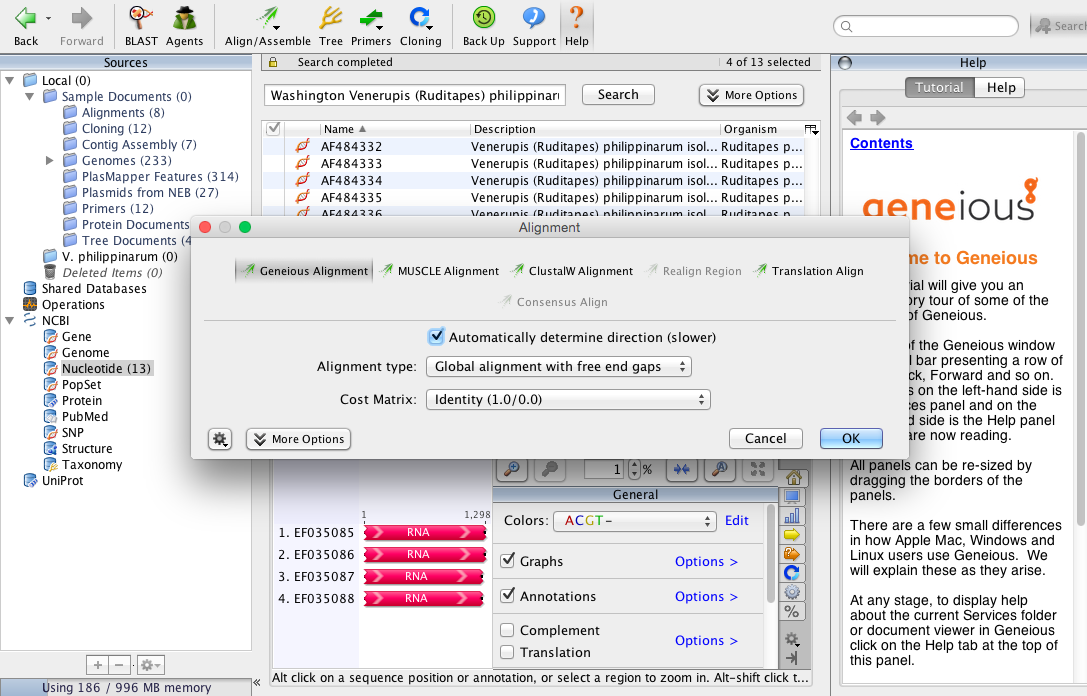
- Came up with alignment options and clicked on... well it came up with a lot of options to choose from so went with the ones shown in image below.
- Clicked ok and came up with these results.
Two largest sections in green are good possible sequences that match up with an abundance of bps to choose primers and probe from in IDT (other sequences seemed too small (like ~50bp and less). Those sequences are as follows:
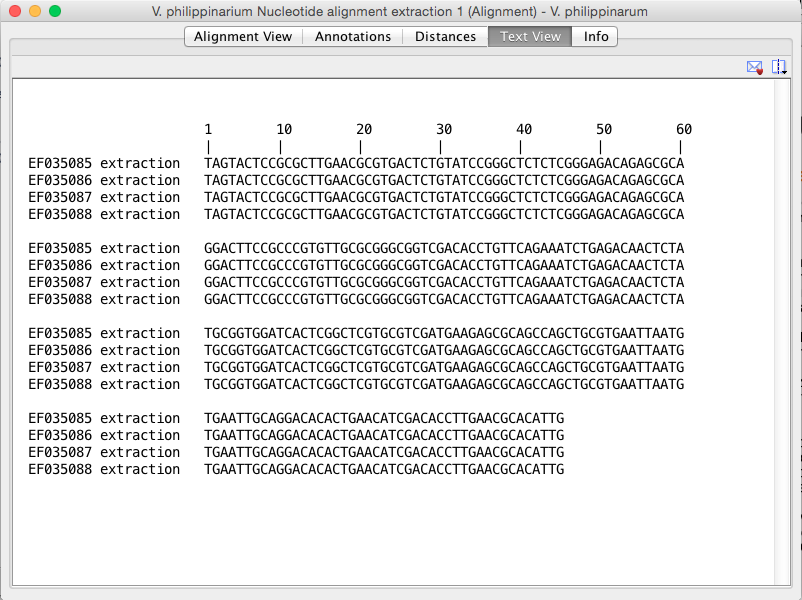
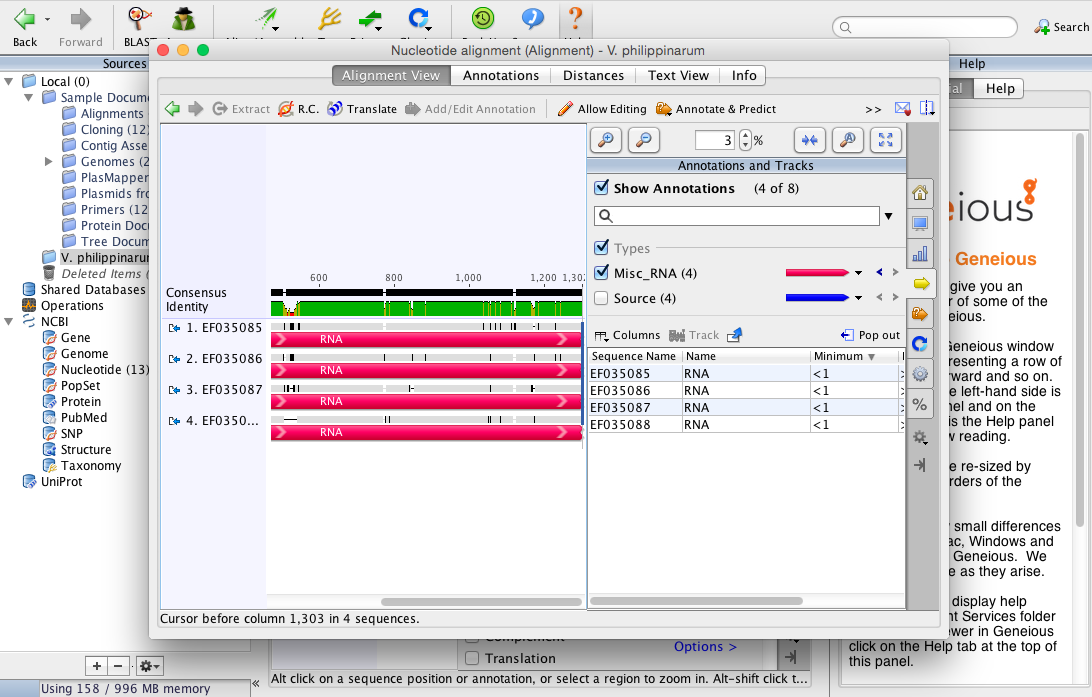 Sequence 1 information:[550--> <--774][TAGTA--> <--ATTG]Total length 224 bp
TAGTACTCCGCGCTTGAACGCGTGACTCTGTATCCGGGCTCTCTCGGGAG
ACAGAGCGCAGGACTTCCGCCCGTGTTGCGCGGGCGGTCGACACCTGTTC
AGAAATCTGAGACAACTCTATGCGGTGGATCACTCGGCTCGTGCGTCGAT
GAAGAGCGCAGCCAGCTGCGTGAATTAATGTGAATTGCAGGACACACTGA
ACATCGACACCTTGAACGCACATTG
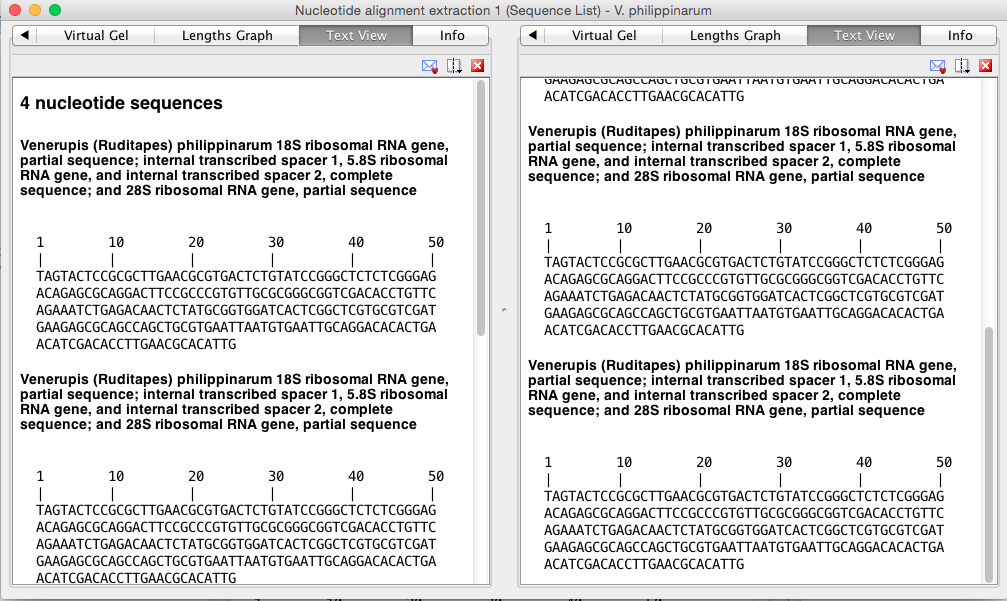
Image (below) of first sequence that could be used for getting primers and probe from.This one has the most bp and so may have better options for developing assay.
Text view
Sequence 2 information:
[885--> <--1038]
[CGTC--> <--CGA]
Total length 156 bp
Image (below) of SECOND alignment that could be used for getting primers and probe from. This one has the least bp but still may be enough to develop our assay for manila clam.
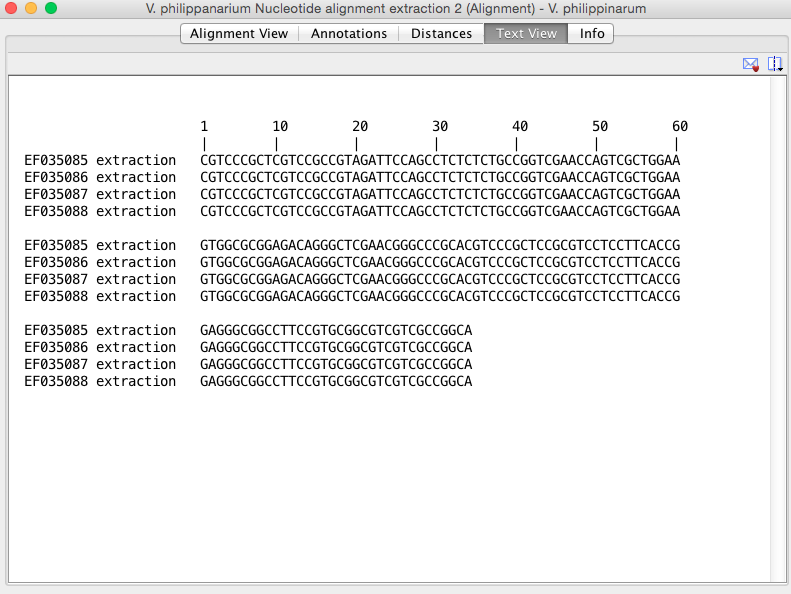
Text view
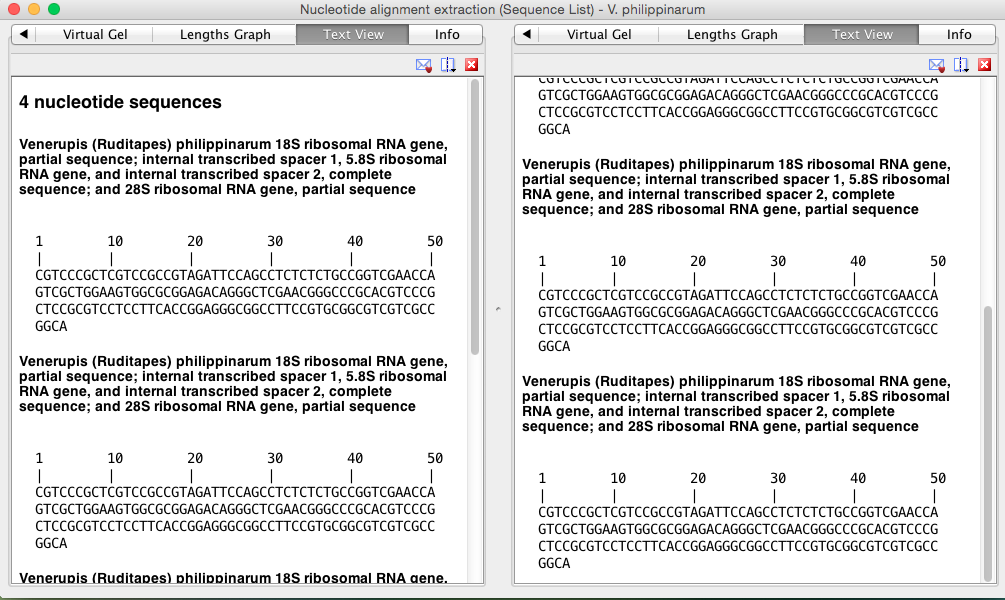
Now that I have two potential options for getting the primers and probes from I will take the sequences into IDT to see what it generates and send those options to Steven and Sam.
Generating Primers and ProbeStarting with the first DNA sequence:Using IDTs PrimerQuest design tool I copied the first (longer) sequence into IDT fasta field and hit two primers and probe option.
Starting with the first DNA sequence:Full Seq: code
TAGTACTCCGCGCTTGAACGCGTGACTCTGTATCCGGGCTCTCTCGGGAG
ACAGAGCGCAGGACTTCCGCCCGTGTTGCGCGGGCGGTCGACACCTGTTC
AGAAATCTGAGACAACTCTATGCGGTGGATCACTCGGCTCGTGCGTCGAT
GAAGAGCGCAGCCAGCTGCGTGAATTAATGTGAATTGCAGGACACACTGA
ACATCGACACCTTGAACGCACATTG
[[code]]
<span style="font-family: Monaco,Courier,monospace;">Targeted five sets of primers and probes as listed below:</span>
Parameter Set 1 : RT-qPCR (Primers with Probe)
Sequence Name: Sequence 1
Amplicon Length: 90
| Start |
Stop |
Length |
Tm |
GC% |
|
|---|---|---|---|---|---|
| Forward CAACTCTATGCGGTGGATCA (Sense) |
113 |
133 |
20 |
62 |
50 |
| Probe ACATTAATTCACGCAGCTGGCTGC (AntiSense) |
158 |
182 |
24 |
68 |
50 |
| Reverse GTTCAGTGTGTCCTGCAATTC (AntiSense) |
182 |
203 |
21 |
62 |
47.6 |
Parameter Set 2: RT-qPCR (Primers with Probe)
Sequence Name: Sequence 1
Amplicon Length: 117
| Start |
Stop |
Length |
Tm |
GC% |
|
|---|---|---|---|---|---|
| Forward TGAACGCGTGACTCTGTATC (Sense) |
15 |
35 |
20 |
62 |
50 |
| Probe AGATTTCTGAACAGGTGTCGACCGC (AntiSense) |
84 |
109 |
25 |
68 |
52 |
| Reverse GATCCACCGCATAGAGTTGT (AntiSense) |
112 |
132 |
20 |
62 |
50 |
Parameter Set 3: RT-qPCR (Primers with Probe)
Sequence Name: Sequence 1
Amplicon Length: 126
| Start |
Stop |
Length |
Tm |
GC% |
|
|---|---|---|---|---|---|
| Forward GGTCGACACCTGTTCAGAAAT (Sense) |
86 |
107 |
21 |
62 |
47.6 |
| Probe AACTCTATGCGGTGGATCACTCGG (Sense) |
114 |
138 |
24 |
67 |
54 |
| Reverse GGTGTCGATGTTCAGTGTGT (AntiSense) |
192 |
212 |
20 |
62 |
50 |
Parameter Set 4: RT-qPCR (Primers with Probe)
Sequence Name: Sequence 1
Amplicon Length: 124
| Start |
Stop |
Length |
Tm |
GC% |
|
|---|---|---|---|---|---|
| Forward AGTACTCCGCGCTTGAAC (Sense) |
2 |
20 |
18 |
62 |
55.6 |
| Probe TGACTCTGTATCCGGGCTCTCTCG (Sense) |
23 |
47 |
24 |
68 |
58 |
| Reverse CCGCATAGAGTTGTCTCAGATT (AntiSense) |
104 |
126 |
22 |
62 |
45.5 |
Parameter Set 5: RT-qPCR (Primers with Probe)
Sequence Name: Sequence 1
Amplicon Length: 139
| Start |
Stop |
Length |
Tm |
GC% |
|
|---|---|---|---|---|---|
| Forward CTCTGTATCCGGGCTCTCT (Sense) |
26 |
45 |
19 |
62 |
57.9 |
| Probe AGATTTCTGAACAGGTGTCGACCGC (AntiSense) |
84 |
109 |
25 |
68 |
52 |
| Reverse TGGCTGCGCTCTTCATC (AntiSense) |
148 |
165 |
17 |
62 |
58.8 |
The second sequence
Full seq:code
CGTCCCGCTCGTCCGCCGTAGATTCCAGCCTCTCTCTGCCGGTCGAACCA
GTCGCTGGAAGTGGCGCGGAGACAGGGCTCGAACGGGCCCGCACGTCCCG
CTCCGCGTCCTCCTTCACCGGAGGGCGGCCTTCCGTGCGGCGTCGTCGCC
GGCA
</span>
* <span style="color: #383838; font-family: gotham,helvetica,arial,sans-serif; font-size: 14px;">Next I input the second sequence into IDT and hit 2 primers and probe. Results came back with two primer/probe sets as follows:</span>
----
Parameter Set 1: RT-qPCR (Primers with Probe)
Sequence Name: Sequence 1
Amplicon Length: 108

||~   ||~ Start ||~ Stop ||~ Length ||~ Tm ||~ GC% ||
|| Forward
CGTAGATTCCAGCCTCTCTCT (Sense) || 17 || 38 || 21 || 62 || 52.4 ||
|| Probe
ACTTCCAGCGACTGGTTCGACC (AntiSense) || 41 || 63 || 22 || 68 || 59 ||
|| Reverse
CCTCCGGTGAAGGAGGA (AntiSense) || 108 || 125 || 17 || 62 || 64.7 ||
----
Parameter Set 2: RT-qPCR (Primers with Probe)
Sequence Name: Sequence 1
Amplicon Length: 78

||~   ||~ Start ||~ Stop ||~ Length ||~ Tm ||~ GC% ||
|| Forward
TCGTCCGCCGTAGATTCC (Sense) || 9 || 27 || 18 || 63 || 61.1 ||
|| Probe
ACTTCCAGCGACTGGTTCGACC (AntiSense) || 41 || 63 || 22 || 68 || 59 ||
|| Reverse
CCGTTCGAGCCCTGTCT (AntiSense) || 70 || 87 || 17 || 63 || 64.7 ||
----
**Future steps:**
* These results will be sent to Sam and Steven to see if there is one that they think will work best to order. When we do order them, we will use HEX dye.
* I also have to start working on new pacific oyster primers and probe.
</span>
<span style="display: block; font-family: Helvetica,Arial,'Droid Sans',sans-serif; font-size: 14px;">
</span><span style="display: block; font-family: Helvetica,Arial,'Droid Sans',sans-serif; font-size: 14px;">
----
</span><span style="display: block; font-family: Helvetica,Arial,'Droid Sans',sans-serif; font-size: 14px;">
</span>
<span style="color: #383838; display: block; font-family: gotham,helvetica,arial,sans-serif; font-size: 14px;">UWT-Becker Lab</span><span style="color: #383838; display: block; font-family: gotham,helvetica,arial,sans-serif; font-size: 14px;">McCartha, Smithhisler</span>
<span style="color: #383838; display: block; font-family: gotham,helvetica,arial,sans-serif; font-size: 14px;">Testing multiple densities of cane sugar in the sugar gradient method for larvae isolation</span><span style="color: #383838; display: block; font-family: gotham,helvetica,arial,sans-serif; font-size: 14px;">10/09/15</span><span style="color: #383838; display: block; font-family: gotham,helvetica,arial,sans-serif; font-size: 14px;">Created by: Smithhisler</span>
<span style="color: #383838; display: block; font-family: gotham,helvetica,arial,sans-serif; font-size: 14px;">**Goals**</span><span style="color: #383838; display: block; font-family: gotham,helvetica,arial,sans-serif; font-size: 14px;">Test the sugar gradient method on spiked plankton samples with sugar at 3 density intervals. The densities recommended by Bonnie to be tested are 1.15g/cm3, 1.1g/cm3, and 1.05g/cm3. These values are all less dense than the sugar tested by MM on 09/23 that had a density 1.2g/cm3. It was decided that a lower density may help prevent bivalve larvae from getting stuck in the sugar as seen on 09/23 and counted 09/24 by MM.</span>
<span style="color: #383838; display: block; font-family: gotham,helvetica,arial,sans-serif; font-size: 14px;">**Methods**</span><span style="color: #383838; display: block; font-family: gotham,helvetica,arial,sans-serif; font-size: 14px;">//Calculations for multiple densities of cane sugar//</span><span style="color: #383838; display: block; font-family: gotham,helvetica,arial,sans-serif; font-size: 14px;"> C1V1=C2V2</span>
* <span style="color: #383838; font-family: gotham,helvetica,arial,sans-serif; font-size: 14px;">Using Lye’s Golden Syrup: Density=1.430g/cm<span style="font-size: 14px;">3</span></span>
* <span style="color: #383838; font-family: gotham,helvetica,arial,sans-serif; font-size: 14px;">(1.430g/cm3)(V1)=(1.15g/cm3)(50mL)
** V1=**40.21mL** of stock sugar for **1.15****g/cm****3** density
</span>
* <span style="color: #383838; font-family: gotham,helvetica,arial,sans-serif; font-size: 14px;">(1.430g/cm3)(V1)=(1.1g/cm3)(50mL)
** V1=**38.46mL** of stock sugar for **1.1****g/cm****3** density
</span>
* <span style="color: #383838; font-family: gotham,helvetica,arial,sans-serif; font-size: 14px;">(1.430g/cm3)(V1)=(1.05g/cm3)(50mL)
** V1=**36.71mL** of stock sugar for **1.05****g/cm****3** density
</span>
<span style="color: #383838; display: block; font-family: gotham,helvetica,arial,sans-serif; font-size: 14px;">//Preparing cane syrup with multiple densities//</span>
* <span style="color: #383838; font-family: gotham,helvetica,arial,sans-serif; font-size: 14px;"><span style="font-size: medium;">Lye’s Golden Syrup was poured into (3) 50mL labeled vials based on calculated requirements of stock syrup for each density.</span>
** <span style="font-size: medium;">This was difficult to judge because of bubbling in the syrup upon pouring and the minimal measure marks of the 50mL vials.</span>
</span>
* <span style="color: #383838; font-family: gotham,helvetica,arial,sans-serif; font-size: 14px;">Ultra pure water was added to each vial to bring the total volume to 50mL.</span>
* <span style="color: #383838; font-family: gotham,helvetica,arial,sans-serif; font-size: 14px;">The solution was stirred to homogenize using a glass stir rod. After stirring, the rod was held to allow the sugar solution to drip off, and some of the sugar was able to be scraped off of the rod onto the interior side of the vial.
** The stir rod was rinsed with nanopure water before addition to the first vial and wiped clean with a Kimwipe in between vials.
</span>
<span style="color: #383838; display: block; font-family: gotham,helvetica,arial,sans-serif; font-size: 14px;">?: With some of the larval tissue separated from the shells, it brings up the question of what features of bivalve larvae hold their density? If we are performing the sugar gradient method and the tissues of bivalve larvae end up suspended with the phytoplankton and does not get run with qPCR, will we essentially be losing sample?</span>
* <span style="color: #383838; font-family: gotham,helvetica,arial,sans-serif; font-size: 14px;">The vials were inverted twice before 20mL of each was poured into new 50mL vials to be used for testing the method. This leaves ~30mL for future use of each density. </span>

<span style="color: #383838; display: block; font-family: gotham,helvetica,arial,sans-serif; font-size: 14px;">//Spiking plankton samples//</span>
* <span style="color: #383838; font-family: gotham,helvetica,arial,sans-serif; font-size: 14px;">Michelle analyzed a mixed 50mL sample of plankton from Fidalgo Bay and Thea Foss to make sure there were no bivalve larvae. </span>
* <span style="color: #383838; font-family: gotham,helvetica,arial,sans-serif; font-size: 14px;">I then spiked the sample with 40 geoduck larvae using a pipette.</span>
* <span style="color: #383838; font-family: gotham,helvetica,arial,sans-serif; font-size: 14px;">I centrifuged the 50mL vial for 2 minutes at 1300rpm. It appeared there was still quite a bit of plankton floating in ethanol, so the vial was centrifuged at 1300rpm for another 3 minutes. Some of the plankton had settled but there was still some that was suspended.</span>
* <span style="color: #383838; font-family: gotham,helvetica,arial,sans-serif; font-size: 14px;">The supernatant was pipetted off using a 5000uL pipette in intervals of 5mL at a time and expelled into a petri dish. The tip of the pipette was held by the top and ejected, then the interior and exterior rinsed with 95% ethanol that was added to the petri dish. The supernatant was checked for larvae microscopically. The supernatant was taken off until the sample volume was 10mL in the vial.</span>
* <span style="color: #383838; font-family: gotham,helvetica,arial,sans-serif; font-size: 14px;"> I then swirled the sample up and poured it at an angle gently into the vial with 20mL of the 1.15g/cm3 density syrup so the sample rested on top. I then used the ethanol squirt bottle to rinse as much as possible from the sample to the syrup. This was easiest holding the vial upside down and squirting to the bottom (which is now at the top) and letting the sample flow down and out of the vial. </span>
* <span style="color: #383838; font-family: gotham,helvetica,arial,sans-serif; font-size: 14px;">I then centrifuged the sample for 2 minutes at 1300rpm. </span>
<span style="color: #383838;"><span style="font-family: gotham,helvetica,arial,sans-serif;"><span style="font-size: 14px; line-height: 0px; overflow: hidden;">[[image:BS_gradient test.jpg]]</span>
</span></span>
<span style="color: #383838; display: block; font-family: gotham,helvetica,arial,sans-serif; font-size: 14px;">**Results**</span><span style="color: #383838; display: block; font-family: gotham,helvetica,arial,sans-serif; font-size: 14px;">There are distinct phases similar to the run on 09/23 by MM with a 1.2g/cm3 density. However, there appears to be a lot of particles in the sugar. This could be more plankton though, in addition to the thicker white later in the middle of what we expect to be phytoplankton. The supernatant is 95% ethanol. We hope the larvae are in the very bottom.</span>
<span style="color: #383838; display: block; font-family: gotham,helvetica,arial,sans-serif; font-size: 14px;">**Future Steps**</span><span style="color: #383838; display: block; font-family: gotham,helvetica,arial,sans-serif; font-size: 14px;">Will analyze the different phases to see if this density is a good density for separation or if the density should again be altered and tested.</span>
<span style="display: block; font-family: Helvetica,Arial,'Droid Sans',sans-serif; font-size: 14px;">
----
</span><span style="display: block; font-family: Helvetica,Arial,'Droid Sans',sans-serif; font-size: 14px;"><span style="color: #383838; display: block; font-family: gotham,helvetica,arial,sans-serif; font-size: 14px;">UWT-Becker Lab</span><span style="color: #383838; display: block; font-family: gotham,helvetica,arial,sans-serif; font-size: 14px;">McCartha</span>

<span style="color: #383838; display: block; font-family: gotham,helvetica,arial,sans-serif; font-size: 14px;">Generating Manila clam primers and probe continued 10-8-15</span><span style="color: #383838; display: block; font-family: gotham,helvetica,arial,sans-serif; font-size: 14px;">Created By Michelle McCartha</span>

<span style="color: #383838; display: block; font-family: gotham,helvetica,arial,sans-serif; font-size: 14px;">Goals </span><span style="color: #383838; display: block; font-family: gotham,helvetica,arial,sans-serif; font-size: 14px;">To locate sequences for Manila clam so we can generate primers and probe for them.</span><span style="color: #383838; display: block; font-family: gotham,helvetica,arial,sans-serif; font-size: 14px;">Send primers and probes that are generated through IDT to Steven for review.</span>

<span style="color: #383838; display: block; font-family: gotham,helvetica,arial,sans-serif; font-size: 14px;">Methods:</span><span style="color: #383838; display: block; font-family: gotham,helvetica,arial,sans-serif; font-size: 14px;">Contacted Steven to let him know that we are still working on ffinding sequences and that we were able to find multiple ones but they were all associated with China, Italy, Korea, Japan and Quebec.</span><span style="color: #383838; display: block; font-family: gotham,helvetica,arial,sans-serif; font-size: 14px;">Steven set back four sequences that we could use but said "Challenge might be ITS is variable, might be good to align and find conserved areas.." </span><span style="color: #383838; display: block; font-family: gotham,helvetica,arial,sans-serif; font-size: 14px;">ITS refers to Internal Transcribed Spacer. </span><span style="color: #383838; display: block; font-family: gotham,helvetica,arial,sans-serif; font-size: 14px;">Went to NCBI and tried typing in Washington Venerupis philippinarum and came up with: </span><span style="color: #383838; display: block; font-family: gotham,helvetica,arial,sans-serif; font-size: 14px;">
[[image:https://www.evernote.com/shard/s16/share/1205f-s16/res/13d29418-8962-4a8e-a0b8-a198db4fbdc0/Screen%20Shot%202015-10-08%20at%201.05.36%20PM.png]]
[[image:https://www.evernote.com/shard/s16/share/1205f-s16/res/0a47328d-2a8b-411f-867d-6eb5fe59885f/Screen%20Shot%202015-10-08%20at%201.05.58%20PM.png]]</span><span style="color: #383838; display: block; font-family: gotham,helvetica,arial,sans-serif; font-size: 14px;">Sets located toward the bottom (10-13) are the same ones that Steven sent me. </span><span style="color: #383838; display: block; font-family: gotham,helvetica,arial,sans-serif; font-size: 14px;">Went through each accession number and retrieved FASTA Fasta files for them all. </span><span style="color: #383838; display: block; font-family: gotham,helvetica,arial,sans-serif; font-size: 14px;">**10:**</span><span style="color: #383838; display: block; font-family: gotham,helvetica,arial,sans-serif; font-size: 14px;">
>gi|117574288|gb|EF035088.1| Venerupis (Ruditapes) philippinarum 18S ribosomal RNA gene, partial sequence; internal transcribed spacer 1, 5.8S ribosomal RNA gene, and internal transcribed spacer 2, complete sequence; and 28S ribosomal RNA gene, partial sequence
GTAGGTGAACCTGCGGATGGATCATTACCATGAAATGATAGACTGCCGGCAGATCCCGCCCTGGCCAGTC
TCTAAACTAATCTTGAACGCACCACGCACGCCCAGTCGACGCGTGCCTAATAAAACGTCGACCCAGCAGC
ACCCGGGTCTACGGGCTGCCCCGGCGGCGGATTGGCCACCGCTGCCGGACTGCGGCCACCACTTCGGGCT
GCTGCTGGAAAAAGTCGGGAGCCGTCCGCCAGAGGTGATTCCCACCCAGGACAGTGGCTCTCGCAGCGCC
GTGGGGTGCCRGCGGTCGAGGACCCTCGAATCGCTCCCTTTGGCCGGGGAGCGAGGAACGGTCCCGGACC
TAGTTCGCTTGCCGATGCTGCTCGCGAACGACGCCGGCCGCAAGGCGATCTCCCCCTGCCGGGAAGAGCG
CCCCTCTTTCCCGTCTCTTCGGAGACGGGATTGCGCCCTCCTCAAAGCGTACACCAACGTTTTTGCGGGC
GTCGCGGAGGAAAACAACCTAGTAGTTAGTACTCCGCGCTTGAACGCGTGACTCTGTATCCGGGCTCTCT
CGGGAGACAGAGCGCAGGACTTCCGCCCGTGTTGCGCGGGCGGTCGACACCTGTTCAGAAATCTGAGACA
ACTCTATGCGGTGGATCACTCGGCTCGTGCGTCGATGAAGAGCGCAGCCAGCTGCGTGAATTAATGTGAA
TTGCAGGACACACTGAACATCGACACCTTGAACGCACATTGCAGCTCTGGCTCACCGCCAGAGCCACGCC
TGTCCGAGGGTCGGCGAACAAGTCATCGGCTCTCACTGTTCACTACAGTGAGGGGCGAGTTGGCGCGTCG
CGCGGGCTTTCGTCCCGCTCGTCCGCCGTAGATTCCAGCCTCTCTCTGCCGGTCGAACCAGTCGCTGGAA
GTGGCGCGGAGACAGGGCTCGAACGGGCCCGCACGTCCCGCTCCGCGTCCTCCTTCACCGGAGGGCGGCC
TTCCGTGCGGCGTCGTCGCCGGCAAAAGCGAGAGAGRGCGGCGAAGGACGGGTCTAGCCAGCCCGGCCCC
GAGCCGAAACCGGAGACGCGGGGAGACGGGCCGACTGACGACGACGACTCCAGCGATGGGGTCCGAGTCC
GATGACGCCGCCTCAACCCCCGCACCACCTCCAAAAAATTCATCCGACCTCGGATCAGACGGGACTACCC
GCTGAATTTAAGCATATCAGTAAGCGGAGGAAAAGAAACTAACCAGGATTCCCTCAGTAACGGCGAGTGA
AGCGG
11:
[[code]]
<span style="font-family: Monaco,Courier,monospace;">>gi|117574287|gb|EF035087.1| Venerupis (Ruditapes) philippinarum 18S ribosomal RNA gene, partial sequence; internal transcribed spacer 1, 5.8S ribosomal RNA gene, and internal transcribed spacer 2, complete sequence; and 28S ribosomal RNA gene, partial sequence
GTAGGTGAACCTGCGGATGGATCATTACCAAAATGATAGACTGCCGGCAGATCCCGCCCTGGCCAGTCTC
TAAACTAATCTTGAACGCACCACGCACGCCCAGTCGACGCGTGCCATAAAAAAGGTCGACCCAGCACCCG
GTCTACGGGCTGCCCCGGCGGCGGATTGGCCACCGCTGCCGGACTGCGGCCACCATTTCGGGCTGCTGGA
AAAAGTCGGGAGCCGTCCGCCAGAGGTGATTCCCACCCAGGACAGTGGCTCTCGCAGCGCCGTGGGGTGC
CGGCGGTCGAGGACCCTCGAATCGCTCCCTTTGGCCGGGGAGCGAGGAACGGTCCCGGACCTAGTTCGCT
TGCCGATGCTGCTCGCGAACGACGCCGGCCGCAAGGCGATCTTCCCCCTGCCGGGAAAAGCGCCCCTCTT
TCCCGTCTCTTCGGAGACGGGATTGCGCCCTCCTCAAAGCGTACACCAACGTTTTTGCGGGCGTCGCGGA
GGAAAACAACGGGGGGAGAGGAGACTCTTCCCCTAGTGGTTAGTACTCCGCGCTTGAACGCGTGACTCTG
TATCCGGGCTCTCTCGGGAGACAGAGCGCAGGACTTCCGCCCGTGTTGCGCGGGCGGTCGACACCTGTTC
AGAAATCTGAGACAACTCTATGCGGTGGATCACTCGGCTCGTGCGTCGATGAAGAGCGCAGCCAGCTGCG
TGAATTAATGTGAATTGCAGGACACACTGAACATCGACACCTTGAACGCACATTGCGGCTCTGGCTCACT
GCCAGAGCCACGCCTGTCCGAGGGTCGGCGAACAAGTCATCGGCTCTCACTATTCGTGAGGGGCGAGTTG
GCGCGTCGCGCGGGCTTTCGTCCCGCTCGTCCGCCGTAGATTCCAGCCTCTCTCTGCCGGTCGAACCAGT
CGCTGGAAGTGGCGCGGAGACAGGGCTCGAACGGGCCCGCACGTCCCGCTCCGCGTCCTCCTTCACCGGA
GGGCGGCCTTCCGTGCGGCGTCGTCGCCGGCAAAAGCGAGAGAGAGCGGCGAAGGACGGGTCTAGCCAGC
CCGGCCCCCAGCCGAAACCGGAGACGCGGGGAGACGGGCCGACTGACGACGACGACTCCAGCGATGGGGT
CCGAGTCCGATGACGCCTCAACCCCGCACCACCTCCAAAAAATTCATCCGACCTCGGATCAGACGGGACT
ACCCGCTGAATTTAAGCATATCAGTAAGCGGAGGAAAAGAAACTAACCAGGATTCCCTCAGTAACGGCGA
GTGAAGCGG</span>
<span style="font-family: Monaco,Courier,monospace;"> </span>
<span style="font-family: Monaco,Courier,monospace;">**12:**</span>
<span style="font-family: Monaco,Courier,monospace;">>gi|117574286|gb|EF035086.1| Venerupis (Ruditapes) philippinarum 18S ribosomal RNA gene, partial sequence; internal transcribed spacer 1, 5.8S ribosomal RNA gene, and internal transcribed spacer 2, complete sequence; and 28S ribosomal RNA gene, partial sequence
GTAGGTGAACCTGCGGATGGATCATTACCATGAAATGATAGACTGCCGGCAGATCCCGCCCTGGCCAGTC
TCTAAACTAATCTTGAACGCACCACGCACGCCCCAGTCGACGCGTGCCTAATAAAACGTCGACCCAGCAG
CACCCGGGTCTACGGGCTGCCCCGGCGGCGGATTGGCCACCGCTGCCGGACTGCGGCCACCACTTCGGGC
TGCTGCTGGAAAAAGTCGGGAGCCGTCCGCCAGAGGTGATTCCCACCCAGGACAGTGGCTCTCGCAGCGC
CGTGGGGTGCCGGCGGTCGAGGACCCTCGAATCGCTCCCTTTGGCCGGGGAGCGAGGAACGGTCCCGGAC
CTAGTTCGCTTGCCGATGCTGCTCGCGAACGACGCCGGCCGCAAGGCGATCTTCCCCCTGCCGGGAAAAG
CGCCCCTCTTTCCCGTCTCTTCGGAGACGGGATTGCGCCCTCCTCAAAGCGTACACCAACGTTTTTGCGG
GCGTCGCGGAGGAAAGCAACGGGGGCAGAGAGAGGAGACTCTTCCTTCCCCTAGTAGTTAGTACTCCGCG
CTTGAACGCGTGACTCTGTATCCGGGCTCTCTCGGGAGACAGAGCGCAGGACTTCCGCCCGTGTTGCGCG
GGCGGTCGACACCTGTTCAGAAATCTGAGACAACTCTATGCGGTGGATCACTCGGCTCGTGCGTCGATGA
AGAGCGCAGCCAGCTGCGTGAATTAATGTGAATTGCAGGACACACTGAACATCGACACCTTGAACGCACA
TTGGCGGCTCTGGCTCACTGCCAGAGCCACGCCTGTCCGAGGGTCGGCGAACAAGTCATCGGCTCTCACT
GTTCACTACGGTGAGGGGCGAGTTGGCGCGTCGCGCGGGCTTACGTCCCGCTCGTCCGCCGTAGATTCCA
GCCTCTCTCTGCCGGTCGAACCAGTCGCTGGAAGTGGCGCGGAGACAGGGCTCGAACGGGCCCGCACGTC
CCGCTCCGCGTCCTCCTTCACCGGAGGGCGGCCTTCCGTGCGGCGTCGTCGCCGGCAAAAGCGAGAGAGA
GCGGCCAAGGACGGGTCTAGCCAGCCCGGCCCCCAGCCGAAACCGGAGACGCGGGGAGACGGGCCGACTG
ACGACGACGACTCCAGCGATGGGGTCCGAGTCCGATGACGCCGCCTCAACCCCCGCACCACCTCCAAAAA
ATTCATCCGACCTCGGATCAGACGGGACTACCCGCWGAATTTAAGCAKATCAGTAAGCGGAGGAAAAGAA
ACTAACCAGGATTCCCTCAGTAACGGCGAGTGAAGCGG


**13:**</span>
<span style="font-family: Monaco,Courier,monospace;">>gi|117574285|gb|EF035085.1| Venerupis (Ruditapes) philippinarum 18S ribosomal RNA gene, partial sequence; internal transcribed spacer 1, 5.8S ribosomal RNA gene, and internal transcribed spacer 2, complete sequence; and 28S ribosomal RNA gene, partial sequence
GTAGGTGAACCTGCGGATGGATCATTACCATGAAATGATAGACTGCCGGCAGATCCCGCCTTGGCCAGTC
TCTAAACTAATCTTGAACGCACCACGCACGCCCAGTCGACGCGTGCCWWAWAAAASGTCGACCCAGTAGC
ACCCGGGTCTACGGGCTGCCCCGGCGGCGGATTGGCCACCGCTGCCGGACTGCGGCCACCAYTTCGGGGC
TGCTGGAAAAAGTCGGGAGCCGTCCGCCAGAGGTGATTCCCACCCAGGACAGTGGCTCTCGCAGCGCCGT
GGGGTGCCGGCGGTCGAGGACCCTMGAATCGCTCCCTTTGGCCGGGGAGCGAGGAACGGTCCCGGACCTA
GTTCGCTTGCCGATGCTGCTCGCGAACGACGCCGGCCGCAAGGCGATCTTCCCCCTGCCGGGAAAAGCGC
CCCTCTTTCCCGTCTCTTCGGAGACGGGATTGCGCCCTCCTCAAAGCGTACACCAACGTTTTTGCGGGCG
TCGCGGAGGAAAACAACCGGGGGCAGAGAGAGGAGACTCTTCCTTCCCCTAGTRGYTAGTACTCCGCGCT
TGAACGCGTGACTCTGTATCCGGGCTCTCTCGGGAGACAGAGCGCAGGACTTCCGCCCGTGTTGCGCGGG
CGGTCGACACCTGTTCAGAAATCTGAGACAACTCTATGCGGTGGATCACTCGGCTCGTGCGTCGATGAAG
AGCGCAGCCAGCTGCGTGAATTAATGTGAATTGCAGGACACACTGAACATCGACACCTTGAACGCACATT
GCGGCTCTGGCTCACTGCCAGAGCCACGCCTGTCCGAGGGTCGGCGAACAAGTCATCGGCTCTCACTGTT
CACTACAGTGAGGGGCGAGTTGGCGCGTCGCGCGGGCTTTCGTCCCGCTCGTCCGCCGTAGATTCCAGCC
TCTCTCTGCCGGTCGAACCAGTCGCTGGAAGTGGCGCGGAGACAGGGCTCGAACGGGCCCGCACGTCCCG
CTCCGCGTCCTCCTTCACCGGAGGGCGGCCTTCCGTGCGGCGTCGTCGCCGGCARAAGCGAGAGAGAGCG
GCCAAGGACGGGTCTRGCCAGCCCGGCCCCSAGCCGAAACCGGAGACGCGGGGAGACAGGCCGACTGACG
ACGACGACGACTCCAGCGATGGGGTCCGAGTCCGATGACGCCGCCTCAACCCCGCACCAYCTCCAAAAAA
TTCATCCGACCTCGGATCAGACGGGACTACCCGCYGAATTTAAGCATATCAGTAAGCGGAGGAAAAGAAA
CTAACCAGGATTCCCTCAGTAACGGCGAGTGAAGCGG</span>
<span style="font-family: Monaco,Courier,monospace;">

Need to come up with a way of pulling the sequences together and find a sequence of at around 150bp to work with in order to get sequences from.

Copied and pasted all sequences into excel.
Copied the first line of each sequence and pasted to into the first 4 rows so they line up together.
Copied the second part of the sequence and pasted into the next four rows following a spacer row.
Realized that I would need to probably place all characters into their own cell but this can easily be done by using the text to column feature in excel. However this requires at least a space between each character that I can't seem to do any other way aside from manually which takes FOREVER!!!!!!@!!!!
Tried coping all sequences into Word and add spacers but failed.
Proceeded to do it manually, however then I realized that even with them being set up line by line from NCBI to my excel file, there is no way in knowing where they will line up as it may not (they will not) match up line for line.
I will contact Sam and Steven and ask them if there is a better way or a program to align sequences and find conserved areas to run in IDT to get primers and probe.</span>
UWT-Becker LabMcCartha, Smithhisler
Counting Fidalgo Bay R1 pump samples10/08/15Created by: Smithhisler
GoalsFinish counting the Fidalgo Bay samples with the environmental factors of Dark, Grass, and Deep (2) to determine the estimated maximum number of bivalve larvae in samples.
Methods
- I cleaned the microscope bench with 10% bleach and wiped dry with paper towels. I then performed two rinses of the microscope working area with nanopure water and dried using paper towels.
- I rinsed the 5-step rinsing tubs with DI water. One of the rinsing tubs had residual mussel pieces. This tub was rinsed, cleaned with Micro90 soap, rinsed with 10% bleach, once again rinsed with Micro90 soap, and then rinsed with DI water. I filled the 10% bleach tub with 50mL of household bleach and added ~450mL of water. The 3 rinsing tubs were filled to around the 500mL mark with DI water.
- I rinsed the two square counting plates with the 5-step rinsing procedure (10% bleach, 3 rinses of DI water in successive tubs, and a final rinse of nanopure water before drying with Kimwipes).
- I began by counting the sample Fidalgo Bay West-Dark-Grass-Deep.
- I began by pipetting 1mL of sample from the original vial to the cleaned counting plate. I then ejected the pipette tip while holding near the top. I rinsed the pipette tip exterior and interior with 95% ethanol, catching the runoff in the counting plate. I visually checked to make sure there were no particles remaining in the pipette tip. I tapped the end of the pipette tip to the interior wall of the plate to vacuum any residual ethanol in the tip.
- After counting the larvae in the plate, I would uncap the new, labeled V-tipped 50mL vial and held it in the styrofoam holder. I poured the contents of the plate into the vial, holding the plate so the sample ran off of one corner. I then rinsed down the plate with ethanol, and rinsed the back/bottom side of the plate where the ethanol ran. I then tapped the plate to the top interior side of the vial for the ethanol to adsorb.
- This sample had phytoplankton that tended to clump together.
- There were lots of snails. One was caught in the phytoplankton, indicating that density may still be an issue for sugar gradient method in the future for shelled creatures.
- One of the bivalve larvae would move in a somersault fashion when the plate was moved. This also indicates concern for density gradient procedures as the larvae in the Fidalgo Bay samples so far appear very small.
- Transferred sample was centrifuged at 2500rpm for 45 seconds to draw down components. The ethanol supernatant was pipetted out into the counting dish and examined for larvae. If no larvae were found, contents were discarded.
- Once I reached the bottom of the sample, I rinsed down the interior sides of the original vial with ethanol and capped the vial. I held the vial horizontally and swished the ethanol from the top of the vial to the bottom back and forth. I pipetted out the the ethanol after letting it settle for 10 seconds. I performed this procedure once more.
- There were 5 total bivalve larvae in this sample.
- I cleaned the counting plates with the 5-step rinsing process.
- The next sample I counted was Fidalgo Bay-Dark-Grass-Deep.
- This sample had a larvae in a variety of sizes and shapes.
- This sample had 80 total larvae.
Results for R1 maximums
| Location |
Site |
Day/Night |
Grass/Bare |
High/Low |
Total Larvae |
| Case Inlet |
North |
Night |
Grass |
Low |
117* |
| Case Inlet |
Rocky |
Night |
Grass |
Low |
113 |
| Case Inlet |
South |
Night |
Grass |
Low |
123 |
| Willapa Bay |
East |
Night |
Grass |
Low/Deep |
73 |
| Willapa Bay |
North |
Night |
Grass |
Low/Deep |
63 |
| Willapa Bay |
South |
Night |
Grass |
Low/Deep |
37 |
| Port Gamble |
East |
Night |
Grass |
Deep |
13 |
| Port Gamble |
South East |
Night |
Grass |
Deep |
31 |
| Port Gamble |
West |
Night |
Grass |
Deep |
22 |
| Fidalgo Bay |
East |
Night |
Grass |
Deep |
54 |
| Fidalgo Bay |
Mid |
Night |
Grass |
Deep |
80 |
| Fidalgo Bay |
West |
Night |
Grass |
Deep |
5 |
Future StepsI will count the samples from other locations R1 expected to have a minimum amount of larvae (Day-Bare-Deep) according to the Case Inlet pump counting.
SAFS- Roberts LabMcCartha
qPCR run on different machines in duplicate using geoduck larvae spiked plankton sample 10-7-15Created by Michelle McCartha
Goals:Run curve using spiked samples to test variance.Run same samples and master mix on a different machine.
Methods:Preparing primers and probeNeed to make new 100μL primers and probe at 10μMr from 100μM stock solutions.Standard C1V1=C2V2 can be applied by the following:
- 100μMx=100μL*10μM=10μL of primer stock to 90μL of molecular water. These volumes were used for both FWD and REV geoduck primers and probe.
- Added water then stock solutions to create all working stocks then finger vortexed and inverted to mix then spun down using microcentrifuge for 2 seconds.
Used the following volumes to prepare the master mix using newly prepared geoduck primers and probe.
| Master Mix Solutions |
Standard volume (μL) |
Multiply By |
new volume |
|
add pipette error |
Final volume to add (μL) |
| Master mix |
25 |
44 |
1100 |
110 |
1210 |
1210 |
| FWD Primer |
1.5 |
44 |
66 |
6.6 |
72.6 |
72.6 |
| Rev Primer |
1.5 |
44 |
66 |
6.6 |
72.6 |
72.6 |
| Probe |
1 |
44 |
44 |
4.4 |
48.4 |
48.4 |
Added 510μL IQ multiplex power mix to 2ml tube then added another 700μL from another vial of IQ multiplex power mix to make 1210μL.
Need to make the same master micx for both plates so actual total reactions are 88. Need to make double mix then I made just now and be able to mix them together thoroughly.
Found a 15ml centrifuge tube in Roberts supply- added to it the mix that was already prepared in addition to another round of volumes listed above (prepared 44 reaction master mix made + 1210μL IQpowermix + 72.6μL FWD primer + 72.6μL REV primer + 48.4μL probe).
Mixed well by pipetting up and down multiple times using a pipette set to 1000μL.
Plate set up
Prepared plate using the set up described below for each plate (only one description is necessary since plates will be prepared exactly the same for comparison).
| 1 |
2 |
3 |
4 |
5 |
6 |
7 |
8 |
9 |
10 |
11 |
12 |
|
| A |
NTC |
RAW |
RAW |
RAW |
RAW |
RAW |
RAW |
|||||
| B |
NTC |
1Pg1 |
1Pg1 |
2Pg1 |
2Pg1 |
3Pg1 |
3Pg1 |
|||||
| C |
NTC |
1Pg5 |
1Pg5 |
2Pg5 |
2Pg5 |
3Pg5 |
3Pg5 |
|||||
| D |
NTC |
1Pg10 |
1Pg10 |
2Pg10 |
2Pg10 |
3Pg10 |
3Pg10 |
|||||
| E |
NTC |
1Pg25 |
1Pg25 |
2Pg25 |
2Pg25 |
3Pg25 |
3Pg25 |
|||||
| F |
NTC |
1Pg50 |
1Pg50 |
2Pg50 |
2Pg50 |
3Pg50 |
3Pg50 |
|||||
| G |
TC |
|||||||||||
| H |
TC |
Wells completed for the first plate with no issue.
For the second plate, since out master mix in the past has often been depleted prior to filling all wells that we wanted to fill, I pipetted out the NTC master mix but did not add the 21 of water on top in order to preserve it should I run out with our sample replicates. ||
| 1 |
2 |
3 |
4 |
5 |
6 |
7 |
9 |
10 |
11 |
12 |
||
| A |
NTC |
RAW |
RAW |
RAW |
RAW |
RAW |
RAW |
|||||
| B |
Empty |
1Pg1 |
1Pg1 |
2Pg1 |
2Pg1 |
3Pg1 |
3Pg1 |
|||||
| C |
Empty |
1Pg5 |
1Pg5 |
2Pg5 |
2Pg5 |
3Pg5 |
3Pg5 |
|||||
| D |
Empty |
1Pg10 |
1Pg10 |
2Pg10 |
2Pg10 |
3Pg10 |
3Pg10 |
|||||
| E |
Empty |
1Pg25 |
1Pg25 |
2Pg25 |
2Pg25 |
3Pg25 |
3Pg25 |
|||||
| F |
Empty |
1Pg50 |
1Pg50 |
2Pg50 |
2Pg50 |
3Pg50 |
3Pg50 |
|||||
| G |
TC |
|||||||||||
| H |
TC |
NTC- No template control
TC- template control using 18 16-day old geoduck larvae digested in 500μL modified pK solution.
Raw- only plankton (no larvae).
Other samples read as Tow rep: Species:# larvae samples spiked with. Example:2Pg10 Plankton rep 2 spiked with 10 geoduck larvae.
For both plates replicates are laid out per tow sample rep so columns 2,3 use first plankton sample, columns 4,5 use second plankton sample and columns 6 and 7 use third plankton sample.
Each sample was spiked with either 1,5,10,25, or 50 larvae and digested in 700μL modified pK solution.
For wells D7, E6, E7, F6, F7, I ran out of master mix. To complete these wells I pipetted out the master mix from NTC wells B-F IN column 1 and dispensed into D7, E6, E7, F6, F7. Will increase pipette error for future runs.
Centrifuged plates for 1 min at 2000RPM and brought first one to qPCR machine in Robert's Lab. The other will be run in the Friedman Lab.
PCR parameters
- Incubate 95C for 2 minutes 30 seconds
- Incubate 95C for 30 seconds
- Incubate 60C for 50 seconds
- Plate read
Made sure that reaction volumn was set to 50μL and it was. No changes on protocol necessary so placed plate with only a single NTC in machine wiped down caps and hit run.
Saved file as: .tad file 20151007_121059
Took the other plate to the Friedman Lab where I met Sam and he set up the machine with the same parameters listed above.
This machine is the CFX 96 real time system C1000 thermocycler and uses the software that is in the Oly drop box.
Sam shared the Robert's Lab dropbox with me where the data will be saved once the run is complete but I need to download the software to look at it.
Sam saved file in a folder named Michelle as CFX Run[CC009827] Michelle_2015-10-0712-23-58_CC009827.pcrd.
Went back to Robert's Lab and attempted to access shared folder for the data file through drop box but it's full. Need to delete Oly folder but will upload software prior to deleting it.
Was able to download and update the CFX 69 Bio Rad software so deleted the oly project from drop box and accepted invite from Sam to the Robert's Lab dropbox which will be storing the data from the machine in the Friedman Lab.
Retrieved data and saved to computer.
Down loaded and emailed self the .tad file from the computer in Robert's lab and saved to computer as well.
With these data, I will next need to retrieve the c(t)/Cq values from each for comparisons.
Results:
When I change change threshold options the Cts change with the Opticon software but should still be relatively the same difference from other samples unless running the baseline past the exponential part of the curve.
The Bio Rad software is new to me so I'm not sure how to specify where to set the threshold like the opticon data aside from what it's original settings are.
All wells selected targeting HEX dye on log scale (below). Using baseline where it is I was able to click on quantification data to retrieve the Cq values to compare with Ct values of Opticon data.
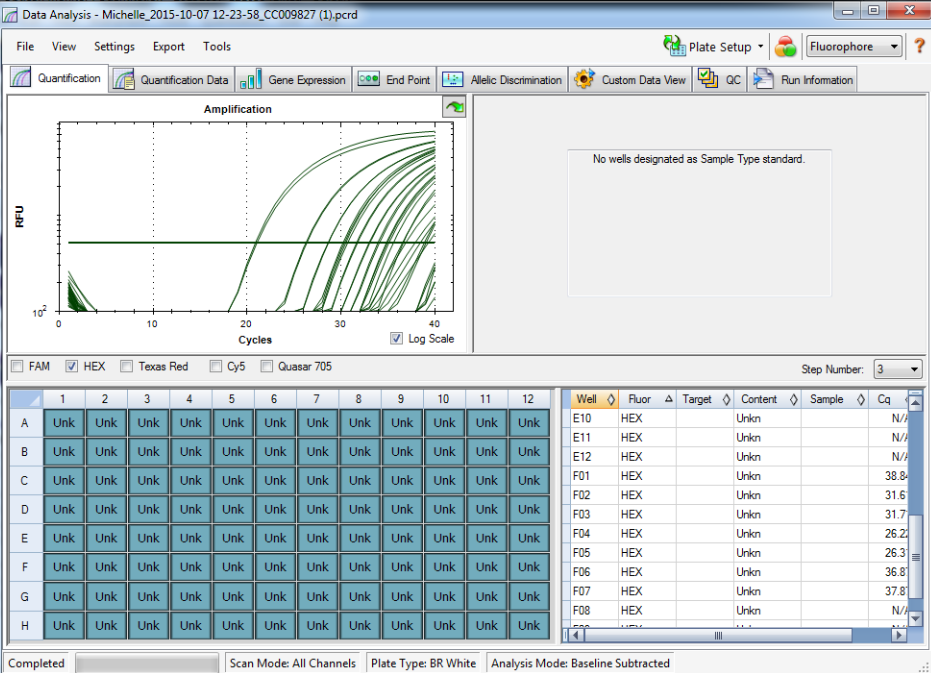
Settings of the CFX 96 software for setting Baseline Threshold (below).
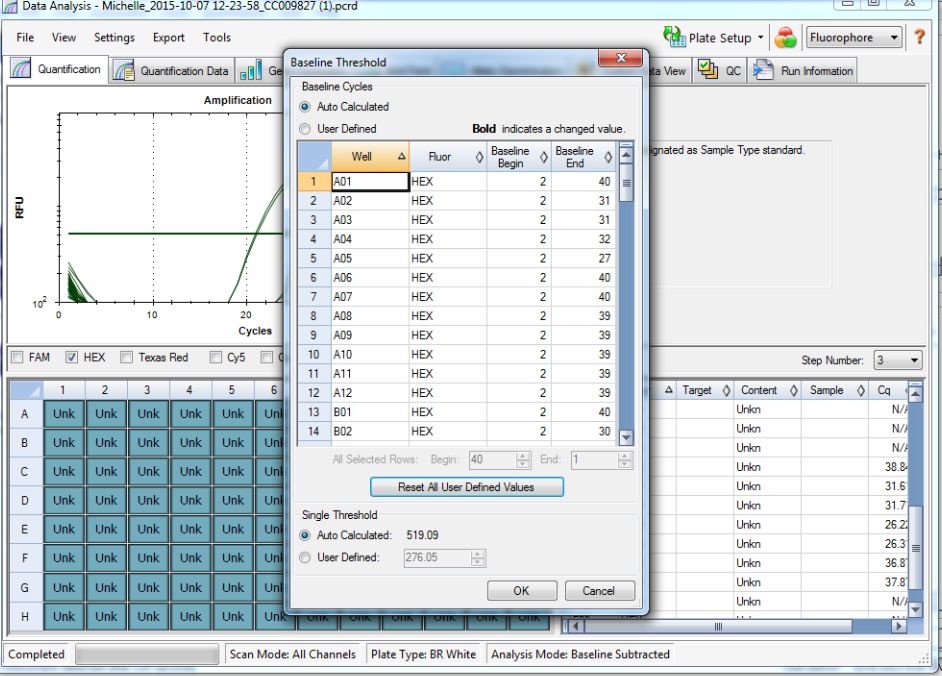 No template control groups showed some amplification past cycle 35 (below).Template control groups showed amplification near cycle 19.
All sample reps spiked with geoduck larvae using three different plankton tow samples using opticon machine (below). As listed under plate set up column 2,3 are the first plankton tow, column 4,5 are the second plankton tow and columns 6, 7 represent the third plankton tow. Then from rows A-F treatments differ as follows: Raw (only plankton no larvae) 1 larva, 5 larvae, 10 larvae, 25 larvae and 50 larvae respectively. Column 3, 5, and 7 are technical reps of 2,4 and 6.
No template control reactions and template control samples (below). Here the only A1 has solution representing a NTC group where as B1-E1 solution was pipetted out and left empty but they are all showing some amplification with the true NTC starting at cycle 35 like with the other machine. G1 and H1 both amplify around cycle 17 which is the same as the CFX 96 machine.
More specific view of results from first biological reps (below).
Collected all Ct and Cq values for comparison and put to a single excel file (below) which will be sent to Steven for review.
Summary of qPCR 10-07-15.xlsx
UWT -Becker LabMcCartha
Plankton tow and search for manila clam sequence 10-6-15Created by: Michelle McCartha
Goal:
- Need to collect plankton for both density gradient methods and future spiking of samples.
- Need to look for manila clam sequence with which to generate primers and probe from.
Methods:
- Packed up 153 micron plankton tow, approx. 20 50ml centrifuge tubes, 95% ETHANOL and squirt bottle for dispensing ethanol, sharpie, labeling tape, 10gal bucket, 1 quart container, line for towing the net and went to the Foss waterway Seaport dock to do the tow as we have done in the past.
- Cloud coverage is heave with a little drizzling and some wind.
- When got to dock, unpacked and realized I should have brought another bucket to hold tubes in and a seawater squirt bottle to rinse down the trap.
- Rinsed out ethanol bottle and will use this to collect plankton and when get to the lab will transfer samples into ethanol.
- Performed one tow on the outside of the dock- not much was collected but what was I poured into a tube.
- Performed second tow on the outside of the dock and same thing (not much sample) plus the current was dragging the net under the dock. Poured out was was collected into a new tube.
- Performed a third tow, but this time did it on the inside of the dock. Currents helped bring in a little more sample but still not much was collected. The net was not caught under the dock though which made for faster, longer, towing.
- Performed 14 more tows but still not getting a lot of plankton in the net. Think this is due to the cloud coverage. Need to come back on a more sunny day.
- Packed up and took samples back to the school.
- Used 75 micron and 333 micron mesh to filter sample by first filtering using 75 micron mesh to stop all plankton in range from getting discarded in salt water then filtering what was on 75 micron mesh onto 333 micron mesh using ethanol pouring over a beaker. What was collected in ethanol in the beaker was poured back into the 50ml tube and allowed to settle. Repeated this for all samples.
Results:
- Not much plankton was collected at all today. Will need to go back out to get plankton that can be used for standard curve testing but the plankton that was collected today will be used isolated to a few tubes and then used to perform density gradient testing.
- Need to keep looking for Manila clam primers to use.
UWT- Becker LabMcCartha
Manila clam primer/probe design 10-5-15Created by Michelle McCartha
GoalsTo verify all primers and probes that are currently in use for the project. To generate new Manila clam primers and probe for Steven's approval. Collect C(t) data from plankton spiked samples for manipulation.
MethodsVerify current probes and primers
- From Becker et al. 2012 pacific geoduck sequences primers and probe were designed as shown below.
- Forward primer: PGEN_18S_F - CCCAGTAAGCACGAGTCATC
- Reverse Primer: PGEN_18S_R - ATCCGAGGCGCTCATTAAC
- Probe: PGEN_18S_P - AGCTCGTGTTGATTACGTCCCTGC
- HEX/Blackhole quencher
- From Sanchez et al. 2014 pacific oyster primers and probe were tested for this study as shown below.
- CGIG/ANG16S_F GGGCGCCTAGAAAGCAAGT
- CGIG/ANG16S_R ATCGGGTCAAATCCGGAAAG
- Probe AACCTTTCTGAATAACTAAC
- FAM/Blackhole quencher
- Note** there seem to be some issues with this assay so we will be generating new primers and probe for potential use in the future.
- From Wight et al. 2009 Olympia oyster primers and probe were used for this study as shown below.
- Fwd TTTGAGTTTTGCCGGTTTCTC
- Rev ATGCCCGGTCTACTGAACG
- Probe ACAGGTTGAACTGTTTACCCGCCGT
- Will be using FAM/blackhole quencher
- Need to design manila clam assay.
- Will use HEX/Blackhole quencher for the probe.
Generating Manila clam assayFor design, Steven suggested using similar genes that were targeted in the other papers.Wight et al. 2009 used the COI gene for qPCR where as Becker et al. used the 18S rRNA gene.I will target both genes separately to give multiply possibilities for Steven's approval. COI gene.
COI geneUsing Accession number found in Wight et al. Table 1 for Venerupis philippinarum I was able to find the sequence to use in IDT to generate primers and probe.
- Gen Bank accession number: DQ399394
Input full sequence in IDT Primer Quest tool and clicked on 2 primers and probe.
Generated 5 sets of primers and probes to choose from as listed below from 1 to 5.
Parameter Set 1: RT-qPCR (Primers with Probe)
Sequence Name: Sequence 1
Amplicon Length: 99
| Start |
Stop |
Length |
Tm |
GC% |
|
|---|---|---|---|---|---|
| Forward CTGGTACTGGTTGAACAGTGTA (Sense) |
343 |
365 |
22 |
62 |
45.5 |
| Probe TGGGTTCCATTCAGGTTGTGCTGT (Sense) |
383 |
407 |
24 |
68 |
50 |
| Reverse CACCACCTACGTGAAGAGAAA (AntiSense) |
421 |
442 |
21 |
62 |
47.6 |
Parameter Set 2: RT-qPCR (Primers with Probe)
Sequence Name: Sequence 1
Amplicon Length: 94
| Start |
Stop |
Length |
Tm |
GC% |
|
|---|---|---|---|---|---|
| Forward GGTCTGCATATGTGGATGGT (Sense) |
319 |
339 |
20 |
62 |
50 |
| Probe TCCGTTGTCGTCAATTGGGTTCCA (Sense) |
368 |
392 |
24 |
68 |
50 |
| Reverse TAATCCACAGCACAACCTGAA (AntiSense) |
392 |
413 |
21 |
62 |
42.9 |
Parameter Set 3: RT-qPCR (Primers with Probe)
Sequence Name: Sequence 1
Amplicon Length: 92
| Start |
Stop |
Length |
Tm |
GC% |
|
|---|---|---|---|---|---|
| Forward TCAATTTGGGCTGGTCTGAT (Sense) |
45 |
65 |
20 |
62 |
45 |
| Probe TTCGTATAGAGTTGGCTATGCCGGG (Sense) |
88 |
113 |
25 |
67 |
52 |
| Reverse AGCTGACCATCATCTAGCATTT (AntiSense) |
115 |
137 |
22 |
62 |
40.9 |
Parameter Set 4: RT-qPCR (Primers with Probe)
Sequence Name: Sequence 1
Amplicon Length: 109
| Start |
Stop |
Length |
Tm |
GC% |
|
|---|---|---|---|---|---|
| Forward TCAGGTTGTGCTGTGGATTAT (Sense) |
393 |
414 |
21 |
62 |
42.9 |
| Probe TCTCTTCACGTAGGTGGTGTCTCTTCA (Sense) |
423 |
450 |
27 |
68 |
48 |
| Reverse CACCTGTTCGCATTAATGATGTAG (AntiSense) |
478 |
502 |
24 |
62 |
41.7 |
Parameter Set 5: RT-qPCR (Primers with Probe)
Sequence Name: Sequence 1
Amplicon Length: 98
| Start |
Stop |
Length |
Tm |
GC% |
|
|---|---|---|---|---|---|
| Forward GAACAGTGTACCCTCCGTTG (Sense) |
355 |
375 |
20 |
62 |
55 |
| Probe TGGGTTCCATTCAGGTTGTGCTGT (Sense) |
383 |
407 |
24 |
68 |
50 |
| Reverse AATTGAAGAGACACCACCTACG (AntiSense) |
431 |
453 |
22 |
62 |
45.5 |
18S rRNA gene
Using NCBI database search I typed in Venerupus philipinarum into the search bar and then clicked on the next page to search for already made primers and probe sequences since it took me a while of searching with little success for an 18S rRNA sequence. When I clicked on the primers/ and probe option it listed a few different sequence outputs and I was able to locate one:
Ruditapes philippinarum primer set probe EF426293.1 for Venerupis (Ruditapes) philippinarum 18S ribosomal RNA gene (EF426293.1)
I then clicked on the source sequence which is EF426293.1 and was brought to the voucher information for the species and sequence. Fasta view of sequence is as follows:
<span style="font-family: Monaco,Courier,monospace;"><span style="font-family: verdana,helvetica,sans-serif;">>gi|134141908|gb|EF426293.1| Venerupis (Ruditapes) philippinarum 18S ribosomal RNA gene, complete sequence
CCTACCTGGTTGATCCTGCCAGTAGTCATATGCTTGTCTCAAAGATTAAGCCATGCATGTCTAAGTACACGCCTTTACACGGCAAAACTGCGAATGGCTCATTAAATCAGTTATGGTTCCTTAGATCGTACAATCCTACTTGGATAACTGTGGCAATTCTAGAGCTAATACATGCAACACAGCTCCGACCTTACGGGAAGAGCGCTTTTGTTAGCCCAAAACCAATCCGGTCCTCGTGGCCGGTCCTCTATGGTGACTCTGAACAACTTTGTGCCGATCGTATGCCCTTGCGGCGACGACGCGTCTTTCAAATGTCTGCCCTATCAACTGTCGATGGTACGTGCTATGCCTACCATGGTGATAACGGGTAACGGGGAATCAGGGTTCGATTCCGGAGAGGGAGCATGAGATACGGCTACCACATCCAAGGAAGGCAGCAGGCGCGCAAATTACCCACTCCCGACACGGGGAGGTAGTGACGAAAAATAACAATACGGGACTCTTTCGAGGCCCCGTAATTGGAATGAGTACACTTTAAATCCTTTAACGAGGATCCATTGGAGGGCAAGTCTGGTGCCAGCAGCCGCGGTAATTCCAGCTCCAATAGCGTATATTAAAGTTGCTGCAGTTAAAAAGCTCGTAGTTGGATCTCGGGTGCAGGCTTGCGGTCCGTCTCGCGGCGGTCACTGCTCGTCCTGGCCTCCACGCCGGCGTACCGTCCCTTGGTGCTCTTGACTGAGTGTCTCGGGCGGCCGGAACGTTTACTTTGAAGAAATTAGAGTGCTCAAAGCAGGCCTTGGCCGCCTGCATAATGGTGCATGGAATAATGGAATAGGACCTCGGTTCTATTTTGTTGGTTTTCGGAGCTCGAGGTAATGATTAATAGGGACTGACGGGGGCATTCGTATTGCGGCGCTAGAGGTGAAATTCTTAGACCGTCGCAAGACGAACTACAGCGAAAGCATTTGCCAAGCATGTTTTCATTAATCAAGAACGAAAGTCAGAGGTTCGAAGACGATCAGATACCGTCGTAGTTCTGACCATAAACGATGCCAACTGTCGATCCGCCGGAGTTGCTTCAATGACTCGGCGGGCAGCCTCCGGGAAACCAAAGTTTCTGGGTTCCGGGGGGAGTATGGTTGCAAAGCTGAAACTTAAAGGAATTGACGGAAGGGCACCACCAGGAGTGGAGCCTGTGGCTTAATTTGACTCAACACGGGGAACCTCACCCGGCCCGGACACTGCAAGGATTGACAGATTGAGAGCTCTTTCTTGATTCGGTGGGTGGTGGTGCATGGCCGTTCTTAGTTGGTGGAGCGATTTGTCTGGTTAATTCCGATAACGAACGAGACTCTAGCCTACTAAATAGTTCGGGGATCCTCTATCGAGTCCCCGTCAACTTCTTAGAGGGACAAGTGGCGCTTAGCCACACGAGATTGAGCAATAACAGGTCTGTGATGCCCTTAGATGTTCGGGGCCGCACATGCGCTACACTGAATGGATCAGCGTGCGTCTCGCCTGACCCGAGAGGGTTGGGAAACCCGTTGAACCCCATTCGTGCTAGGGATTGGGGCTTGCAATTGTTCCCCATGAACGAGGAATTCCCAGTAAGCGCGAGTCATCAGCTCGCGTTGATTACGTCCCTGCCCTTTGTACACACCGCCCGTCGCTACTACCGATCGCTCCAGTTAATGAGCTCTTCGGATTGGTCCCGTAGGCTGCCCTTCGCGGGGTGGCTCTCGGTTGTGCCGAGAAGATGCGCAAATTGACCGGAGTAGAGGAAGTAAAAGTCGTAACAAGGTATCCGTAGGTGAACCTGCGGAAGGATCATTA

Copied the fasta sequence into the IDT PrimerQuest Design tool and clicked on 2 Primers and Probe.. here are the descriptions of the 5 sets of sequences that were generated as listed below from 1 to 5:</span></span>
<span style="font-family: Monaco,Courier,monospace;">
**Parameter Set 1:** RT-qPCR (Primers with Probe)</span>
Sequence Name: Sequence 1
Amplicon Length: 120
<span style="font-family: Monaco,Courier,monospace;"> </span>
<span style="font-family: Monaco,Courier,monospace;"> </span>
<span style="font-family: Monaco,Courier,monospace;"> </span>
| Start |
Stop |
Length |
Tm |
GC% |
|
|---|---|---|---|---|---|
| Forward CACTGCAAGGATTGACAGATTG (Sense) |
1240 |
1262 |
22 |
62 |
45.5 |
| Probe AGTTGGTGGAGCGATTTGTCTGGT (Sense) |
1307 |
1331 |
24 |
68 |
50 |
| Reverse GGCTAGAGTCTCGTTCGTTATC (AntiSense) |
1338 |
1360 |
22 |
62 |
50 |
Parameter Set 2: RT-qPCR (Primers with Probe)
Sequence Name: Sequence 1
Amplicon Length: 131
<span style="font-family: Monaco,Courier,monospace;"> </span>
| Start |
Stop |
Length |
Tm |
GC% |
|
|---|---|---|---|---|---|
| Forward CGAACGAGACTCTAGCCTACTA (Sense) |
1343 |
1365 |
22 |
62 |
50 |
| Probe TTCTTAGAGGGACAAGTGGCGCTT (Sense) |
1401 |
1425 |
24 |
68 |
50 |
| Reverse GAACATCTAAGGGCATCACAGA (AntiSense) |
1452 |
1474 |
22 |
62 |
45.5 |
Parameter Set 3: RT-qPCR (Primers with Probe)
Sequence Name: Sequence 1
Amplicon Length: 123
<span style="font-family: Monaco,Courier,monospace;"> </span>
| Start |
Stop |
Length |
Tm |
GC% |
|
|---|---|---|---|---|---|
| Forward GCTATGCCTACCATGGTGATAA (Sense) |
343 |
365 |
22 |
62 |
45.5 |
| Probe TACCACATCCAAGGAAGGCAGCAG (Sense) |
417 |
441 |
24 |
68 |
54 |
| Reverse TGTCGGGAGTGGGTAATTTG (AntiSense) |
446 |
466 |
20 |
62 |
50 |
Parameter Set 4: RT-qPCR (Primers with Probe)
Sequence Name: Sequence 1
Amplicon Length: 86
| Start |
Stop |
Length |
Tm |
GC% |
|
|---|---|---|---|---|---|
| Forward CGGACACTGCAAGGATTGA (Sense) |
1236 |
1255 |
19 |
62 |
52.6 |
| Probe TTTCTTGATTCGGTGGGTGGTGGT (Sense) |
1269 |
1293 |
24 |
68 |
50 |
| Reverse ATCGCTCCACCAACTAAGAAC (AntiSense) |
1301 |
1322 |
21 |
62 |
47.6 |
Parameter Set 5: RT-qPCR (Primers with Probe)
Sequence Name: Sequence 1
Amplicon Length: 102
| Start |
Stop |
Length |
Tm |
GC% |
|
|---|---|---|---|---|---|
| Forward GTGGAGCCTGTGGCTTAAT (Sense) |
1187 |
1206 |
19 |
62 |
52.6 |
| Probe CCGGACACTGCAAGGATTGACAGA (Sense) |
1235 |
1259 |
24 |
68 |
54 |
| Reverse CCACCCACCGAATCAAGAA (AntiSense) |
1270 |
1289 |
19 |
62 |
52.6 |
<span style="font-family: Monaco,Courier,monospace;"><span style="font-family: verdana,helvetica,sans-serif;">Typed these into a new excel file named (attached):Primer_ProbeDesign_OCT2015 Updated. This file also lists our current primers for geoduck and C gigas (note that the gigas primers that are in there are the one's we will most likely</span></span>Primer_ProbeDesign_OCT2015Update.xlsxSpiked plankton C(t) DataOn tad files from 9/25 and 9/29, changed threshold value to be at approx. -3.20 on Log Fluorescence scale (this pinpoints a time when there is a linear trajectory in the data). Copied to clipboard and created new file. Since I am running on parallels I had to email this file to myself then reopen using Mac software and resave file (attached), Deleted all columns on file aside from Well and C(t), added Sample description column before Well column. filtered so that the well column was descending from A-Z. Deleted any unwanted (FAM) data since we don't need it- only want info regarding geoduck.Emailed file to Steven to assist with manipulation and analyses.
Geoduck Ct values.xlsx
SAFS-Roberts LabMcCartha
qPCR run with "clean" geoduck and pacific oyster samples 10-2-15Created by Michelle McCartha
Goals
- Finish DNA isolation at UWT and bring materials up to SAFS.
- Run curve using isolations performed 10-1-15 with ethanol preserved geoduck and pacific oyster larvae (no plankton).
MethodsDNA isolation
- 7:30
- Finger vortexed all vials that had been sitting on the heat block with shaker table running overnight at 56C.
- Turned up heat to 98C (which reads 95C using a thermometer) and allowed to cook for another hour to denature the pK in the solution.
- When this was finished took samples and placed in cooler with ice to transport to Seattle campus.
- Also took 2 packages of 100 and 200 micoliter pipette reloading tips.
Checking primers/probe
- Want to make sure that the reason why we are not getting amplification with C. gigas isn't due to not having the correct primers from Sánchez et al. 2014 (C. gigas) and the sequences we pulled using DNA sequences used in Becker et al 2012.
Pacific oyster primers and probeSanchez et al. 2014Primers FWD/REV both match what was ordered
CGIG/ANG16S_F GGGCGCCTAGAAAGCAAGT
CGIG/ANG16S_R ATCGGGTCAAATCCGGAAAG 300
- However, could just be limited print options but the probe only displays AACCTTTCTGAATAACT and not the full sequence of AACCTTTCTGAATAACTAAC as is in the paper. I think it's just limited printing room since the geoduck probe has a similar cut off point. otherwise everything matches up.
Forward primer: PGEN_18S_F - CCCAGTAAGCACGAGTCATC
Reverse Primer: PGEN_18S_R - ATCCGAGGCGCTCATTAAC
Probe: PGEN_18S_P - AGCTCGTGTTGATTACGTCCCTGC
Creating master mix for curves
- To ensure no contamination will use fresh molecular water poured 9-24-15 into a 50ml centrifuge tube. Distributed the water into 3 2ml eppendorf tubes for easy dispense.
- Not enough room on the plate to test the multiplexing samples so will do those on Monday possibly and try to have them for the Becker Lab meeting.
| Master Mix Solutions |
Standard volume (μL) |
Multiply By |
new volume |
|
add pipette error |
Final volume to add (μL) |
| Master mix |
25 |
23 |
575 |
57.5 |
632.5 |
632.5 |
| FWD Primer |
1.5 |
23 |
34.5 |
3.45 |
37.95 |
37.95 |
| Rev Primer |
1.5 |
23 |
34.5 |
3.45 |
37.95 |
37.95 |
| Probe |
1 |
23 |
23 |
2.3 |
25.3 |
25.3 |
- Added to 2ml eppendorf tube by first adding powermix, then primers Fwd and REV then following up with probe. Water and template will be added to the reaction wells separately to being the total volume per reaction to 50μL.
Cg master mix volumes
| Master Mix Solutions |
Standard volume (μL) |
Multiply By |
new volume |
|
add pipette error |
Final volume to add (μL) |
| Master mix |
25 |
23 |
575 |
57.5 |
632.5 |
632.5 |
| FWD Primer |
1.5 |
23 |
34.5 |
3.45 |
37.95 |
37.95 |
| Rev Primer |
1.5 |
23 |
34.5 |
3.45 |
37.95 |
37.95 |
| Probe |
1 |
23 |
23 |
2.3 |
25.3 |
25.3 |
- Added to a new 2ml eppendorf tube same as the geoduck mix by first adding powermix, then primers Fwd and REV then following up with probe. Water and template will also be added to the reaction wells separately to being the total volume per reaction to 50μL.
- Need to make more 100μL 10μM primer solution for both Cg primers from 100μM. Did this by using the standard C1V1=C2V2 equation
- 100μMx=100μL*10μM=10μL of primer stock to 90μL of molecular water. These volumes were used for both FWD and REV Pac oyster primers.
- Im going to make a new probe for pac oyster also just to be sure- using the same calculations as primers with 10μLprobe stock and 90μLmolecular water to make a 10μM working stock.
Plate set up|| || 1
| 2 |
3 |
4 |
5 |
6 |
7 |
8 |
9 |
10 |
11 |
||
| A |
NTC |
1Pg1 |
2Pg1 |
3Pg1 |
NTC |
1Cg1 |
2Cg1 |
3Cg1 |
|||
| B |
NTC |
1Pg5 |
2Pg5 |
3Pg5 |
NTC |
1Cg5 |
2Cg5 |
3Cg5 |
|||
| C |
NTC |
1Pg10 |
2Pg10 |
3Pg10 |
NTC |
1Cg10 |
2Cg10 |
3Cg10 |
|||
| D |
NTC |
1Pg25 |
2Pg25 |
3Pg25 |
NTC |
1Cg25 |
2Cg25 |
3Cg25 |
|||
| E |
NTC |
1Pg50 |
2Pg50 |
3Pg50 |
NTC |
1Cg50 |
2Cg50 |
3Cg50 |
|||
| F |
NTC |
NTC |
|||||||||
| G |
PgTC |
CgTC |
|||||||||
| H |
PgTC |
CgTC |
TC: template control using DNA respective to each species where 4μL of template (larvae DNA) was used. PgTC contained 18 16-day old geoduck larvae digested in 500μL pK solution. CgTC contained 20 18-day old pacific oyster larvae digested in 500μL pK solution.
Pg: Geoduck
Cg Pacific oyster
- Rows 1-4 used geoduck primers and probe
- Rows 5-6 used pacific oyster primers and probe
- All samples were spiked with 1,5,10,25,50 geoduck and pacific oyster larvae respectively.
- Key for reading samples: 1Pg25= Sample Rep1/ Geoduck /25 larvae and 2Cg50= Sample Rep 2/ Pacific oyster/ 50 larvae.
- For all reactions 50μL was the total volume with 29μL of either Cg or Pg master mix added respective to the treatments.
- For all Not template control reactions only 21μL of molecular water was added (no template).
- For samples containing template 4μL of sample/template was used and the rest of the 50μL volume was made up with 17μL molecular water.
- Pipetted all reactions- only issue that came up was on E8 well only had 10μL of master mix left so continued with the reaction by adding 4μL template and 36μL molecular water.
- Centrifuged plate at 2000RPM for 1 minute using the one in the Roberts Lab that appears to have no issues anymore.
- Took plate to qPCR machine and set up machine after wiping down lids with a Kim wipe.
- Used standard protocol that we have been using but checked to make sure all steps remained the same- Did not need to change anything.
- Still set up for 50μL reactions
- Protocol steps still remain with the following parameters:
- Incubate at 95°C for 2:30
- Incubate at 95°C for 10 seconds
- Incubate at 60°C for 50 seconds
- Plate read
- Go to line 2 for 39 more times
- Hit run
- Saved run as tad file: 20151001_124735
UWT-Becker LabSmithhisler
Counting Fidalgo Bay and Port Gamble round 1 pump samples10/01/15Created by: Smithhisler McCartha edits in Blue
GoalsFinish counting bivalve larvae in the round 1 pump samples from Port Gamble and Fidalgo Bay.
- I will use this information to determine the maximum larvae in all samples by counting the Grass-Night-Deep samples from all locations.
Methods
- I began by rinsing the microscope bench with a 10% bleach solution and wiping dry with paper towels. I then rinsed the bench twice with nanopure water, drying with paper towels.
- I cleaned two counting plates using the 5-step rinsing process with materials set up by MM.
- The 5-step process includes one rinse with 10% bleach, three rinses with DI water, and a final rinse with nanopure water before drying with Kimwipes.
- Using a 5000uL pipette, I pipetted 1mL of sample up from the bottom of the tube from PGE-Dark-Grass-Deep and expelled into the counting plate. Holding the pipette tip near the top, I ejected the tip and rinsed the interior and exterior with 95% ethanol holding it over the plate to catch the liquid and any remaining sample. I visually checked that the pipette tip was clear, and tapped the bottom of the pipette tip on the inner edge of the plate to vacuum out the bottom of the sample into the dish. The pipette tip was then discarded.
- I used the polarizing lens to help count the bivalve larvae. I used a hand clicker to keep track of the larval count.
- After counting the larvae in the plate, I uncapped a new 50mL V-shaped bottom vial and tipped the plate so all of the contents ran to one corner. I poured the contents of the plate carefully into the vial, and rinsed the interior of the plate with 95% ethanol to bring down all particles. I then rinsed the bottom/exterior of the plate to cause any sample that went under the plate when pouring to fall into the vial. I tapped the plate on the interior top of the vial to transfer as much of the ethanol as possible. I then microscopically checked the plate for larvae.
- When the vial filled up, I centrifuged the components down at 3000rpm for 45 second. I pipetted out the supernatant and added it to the plate, rinsing the pipette tip with 95% ethanol. I then visually checked to make sure there were no larvae suspended in the supernatant.
- Once I finished pipetting up the sample, I rinsed the sides of the original sample vial with 95% ethanol and capped. I then gently swished the ethanol back and forth while holding the tube horizontally. I then pipetted out the ethanol to the plate, rinsed the pipette tip once again, and checked microscopically for bivalve larvae.
- This sample had extremely small larvae. Only 4 of the 13 total larvae I counted had nicely visible cross patterns. I feel less confident in this sample that I did not miss larvae.
- I then cleaned the counting plate with the 5-step rinse process. I made new solutions for the 5-step rinse process as the next rinse will be with a new sample.
- The next sample I counted, following the same procedure, was PGSE-Dark-Grass-Deep.
- 31
DNA isolation
- Took all samples from fume hood and capped until ready to add pK solution.
- Used new pK solution that Brenda made 9/22/15 with the corrected mass of potassium chloride.
- Took out 3 vials of pK solution in 15ml tubes in freezer and placed in ice bath to thaw.
- Every five or so minutes used hand friction to assist in speeding up the thawing process.
- Since we are testing to see if there is a difference in amplification of spiked samples when comparing samples "dirty" samples (spiked in plankton) to "clean" (no plankton just preserved in ethanol" samples with the same number of replicates and treatments, I will also use the same amount of digest solution as we used with the dirty samples.
- For dirty samples I used 700µL of modified pK solution to digest the sample and isolate DNA. Again, we decided to increase the volume of pK solution we used because there was so much plankton in the tubes and in previous methods increasing the solution was performed when ever there was an increase in "gunk".
- For the "clean" samples we decided to keep the volume of pK solution the same and added 700µL of the solution to each sample.
- This was done to all spiked samples as well as all multiplex test mix samples.
- After finger vortexing and mixing by inversion, the samples were placed on a heat block for overnight digestion.
- the Heat block was set to 56 but would not read 56 using thermometer so I turned it up to 60 and that seemed to work .
- left overnight with shaker table turned on.
- Brenda was able to finger vortex a couple more times during the day.
UWT- Becker Lab McCartha
Preparing samples for standard curve in ethanol only (no plankton) 9/30/15Created by Michelle McCartha
Goals:To collect larvae from pacific oyster and geoduck stock and place into respective tubes in increments of 50/25/10/5/1 for each species in triplicate from stock larvae. To also collect larvae to test multiplexing methods using pacific oyster and geoduck larvaeStart DNA isolation methods using modified pK methods.
Methods:Cleaned two petri dishes using 10% bleach and three DI water rinses then finishing off with a rinse using ultrapure water and drying with a clean kim wipe. took out pacific oyster larvae (10-day old from Taylor Shellfish on 3/13/15) and geoduck larvae (16-day old larvae from Taylor shellfish on 3/13/15) stock which will be used for spiking. always using a fresh pipette tip and only taking out a ml of suspended larvae at a time I counted first geoduck larvae and dispensed into vials and then counted pacific oyster larvae and placed into vials. Also, the petri dish was kept separate for each species which will help with not contaminating the stock. Any larvae that was not used was placed back into the respective stock by pipetting with 95% ethanol as needed. This was done for both species. Vials with samples were labeled as follows:
Geoduck "standard curve"
| Rep 1 |
Rep 2 |
Rep 3 |
| 1Pg50 |
2Pg50 |
3Pg50 |
| 1Pg25 |
2Pg25 |
3Pg25 |
| 1Pg10 |
2Pg10 |
3Pg10 |
| 1Pg5 |
2Pg5 |
3Pg5 |
| 1Pg1 |
2Pg1 |
3Pg1 |
Pacific oyster "standard curve"
| Rep 1 |
Rep 2 |
Rep 3 |
| 1Cg50 |
2Cg50 |
3Cg50 |
| 1Cg25 |
2Cg25 |
3Cg25 |
| 1Cg10 |
2Cg10 |
3Cg10 |
| 1PCg5 |
2Cg5 |
3Cg5 |
| 1Cg1 |
2Cg1 |
3Cg1 |
Spiked multiplexing
Ratios of larvae added which can be read as Pg:Cg (Pacific Geoduck : Pacific oyster) for all samples below.
Numbers next to ratio indicate vial where the larvae was added.
| 1 |
25/25 |
5 |
25/25 |
9 |
25/25 |
13 |
Discard |
17 |
Discard |
21 |
Discard |
| 2 |
25/10 |
6 |
25/10 |
10 |
25/10 |
14 |
10/25 |
18 |
10/25 |
22 |
10/25 |
| 3 |
25/5 |
7 |
25/5 |
11 |
25/5 |
15 |
5/25 |
19 |
5/25 |
23 |
5/25 |
| 4 |
25/1 |
8 |
25/1 |
12 |
25/1 |
16 |
1/25 |
20 |
1/25 |
24 |
1/25 |
13, 17, and 21 would have been replicates of 1, 5 and 9 so were found unnecessary and not made.
Made an extra 25/10 which was kept in ethanol for later use.
These samples were spun down and as much supernatant was removed as possible with out disturbing larvae that settled to the bottom. Caps were left open and the samples were placed in the fume hood to dry overnight.
SAFS- Roberts LabMcCartha and Smithhisler
qPCR on spiked plankton samples round two 9/29/15Created by: McCartha and Smithhisler
Goals:Prep and run qPCR on plankton reps spiked with assorted amounts of geoduck larvae.Prep and test multiplex qPCR on samples with geoduck (20), manila clam (20), and pacific oyster (20) larvae.
Methods:Preparing aliquots of Pg primers at 10µM concentration
C1V1=C2V2
(100µM)(x)=(10µM)(100µL)x=10µL of each primer
100µL aliquot-10µL primer=90µL of nuclease free water
- Brenda began by adding 90µL nuclease free water to 2 clean, labeled microcentrifuge tubes (1 tube labeled for forward, 1 tube labeled for reverse)
- Then Brenda added 10µL of primer to the correspondingly labeled tube (only 1 primer per tube, either forward or reverse) and mixed using pipette
Preparing mastermixUsing the calculations in the tables below, Brenda pipetted components for the iQ Pg master mix. She pipetted in the order of the iQ powermix, then primers (fwd then rev), then finally the probe.
- Standard volumes were obtained from calculations from the procedure manual for each master mix based on desired final concentration of primers and probe for each reaction.
- IQ Powermix Primers FWD/REV: ((10uM)(XuL)=(0.3uM)(50uL))=1.5uL each primer
- IQ Powermix Probe: ((10uM)(XuL)=(0.2uM)(50uL))=1.0uL probe
Pg iQ Mastermix
| Master Mix Solutions |
Standard volume (uL) |
Multiply by (# of total reactions) |
New volume (uL) |
*10% errror |
Add error (Final volume to add) (uL) |
| Power mix |
25 |
26 |
650 |
65 |
715 |
| FWD primer |
1.5 |
26 |
39 |
3.9 |
42.9 |
| Rev primer |
1.5 |
26 |
39 |
3.9 |
42.9 |
| Probe |
1.0 |
26 |
26 |
2.6 |
28.6 |
| Template |
4.0 |
||||
| Water |
17 |
Then, Michelle prepared the multiplex mastermix with Cg and Pg primers and probe according to the calculations in the table below.
Multiplex iQ Mastermix for Pg and Cg
| Master Mix Solutions |
Standard volume (uL) |
Multiply by (# of total reactions) |
New volume (uL) |
*10% errror |
Add error (Final volume to add) (uL) |
| Power mix |
25 |
10 |
250 |
25 |
275 |
| FWD primer |
1.5 |
10 |
15 |
1.5 |
16.5 |
| Rev primer |
1.5 |
10 |
15 |
1.5 |
16.5 |
| Probe |
1.0 |
10 |
10 |
1 |
11 |
| Template |
4.0 |
||||
| Water |
17 |
Preparing 96-well PCR plateMixing with the pipette when adding components, we added:
- Each well for Pg (first 4 columns)
- 29uL of mastermix made for iQ powermix
- When pipetting, we were careful to do this slowly and steady in order to lessen the chance of bubbles in the mix.
- 4uL of template (unless NTC, this amount will be replaced with water)
- 17uL water to top off reactions using iQ powermix to bring to 50uL volume per reaction
- 29uL of mastermix made for iQ powermix
- Each well for multiplex w/Cg and Pg
- 33uL of mastermix made for iQ powermix
- 4uL of template (unless NTC, this amount will be replaced with water)
- 13uL water to top off reactions using iQ powermix to bring to 50uL volume per reaction
-We were wondering as we began pipetting that we do not know how much we should mix the template DNA before adding it to the wells? Could the gunkiness be the problem or a problem with results? Today we finger vortexed twice and pipetted from the top/middle. However, there were some samples in column 2 that Brenda inverted (check to see inhibition).
Plate outline:
| 1 |
2 |
3 |
4 |
5 |
6 |
|
| A |
NTC |
1.1 |
2.1 |
3.1 |
NTC |
Mp |
| B |
NTC |
1.6 |
2.6 |
3.6 |
NTC |
Mp |
| C |
NTC |
1.5 |
2.5 |
3.5 |
NTC |
Mp* |
| D |
NTC |
1.4 |
2.4 |
3.4 |
NTC |
|
| E |
NTC |
1.3 |
2.3 |
3.3 |
Pg TC |
|
| F |
Pg TC |
1.2 |
2.2 |
3.2 |
Cg TC |
*Note: Column 6, Row C had only 15uL of mastermix as we ran out. Also, there was planned to be a column 6 row d but was not able to be filled.
- Due to difficulties with the power of the plate centrifuge in the Roberts Lab, we walked over to the Friedman Lab to use theirs. The plates were balanced using materials provided by the Friedman Lab. The plate balance was measured on a scale. Then, the plates were added to the centrifuge and the machine was set to ~1900rpm (we turned the knob rather than digitally inputting information) at 5 degrees Celsius for 2 minutes.
- The plate was removed and held carefully as we walked back to the Roberts Lab.
qPCR cycleFile saved as 20150929_623185Cycle began at 12:48pm.
Results:
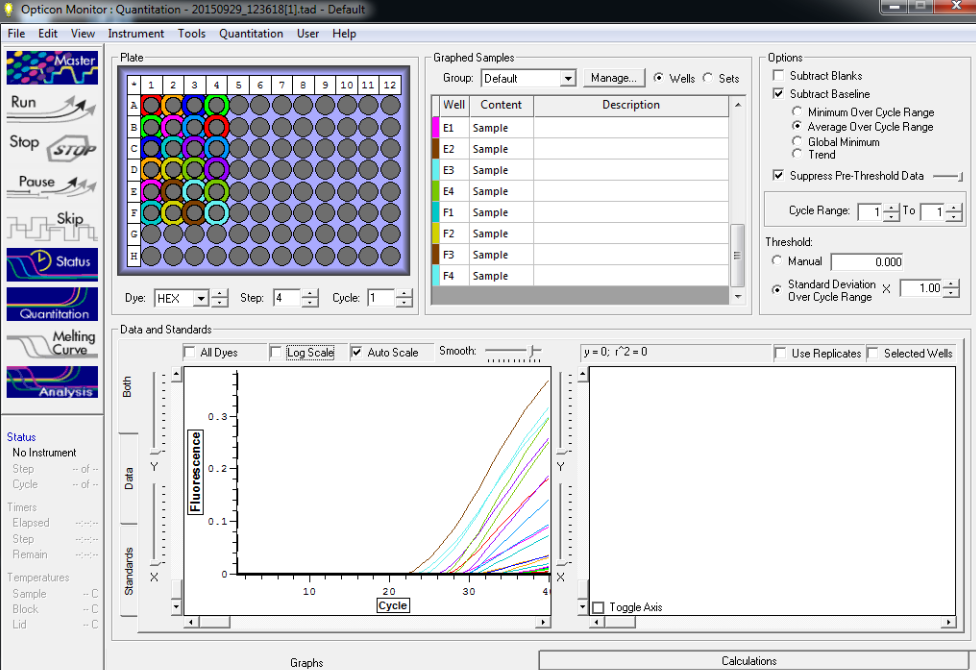 Image above from qPCR run using geoduck primers and probe and spiked plankton samples. Look similar to previous results from 9/25/15 with some step-wise pattern with random here and there's but then for plankton rep 1 there is little to show possibly due to inhibition?
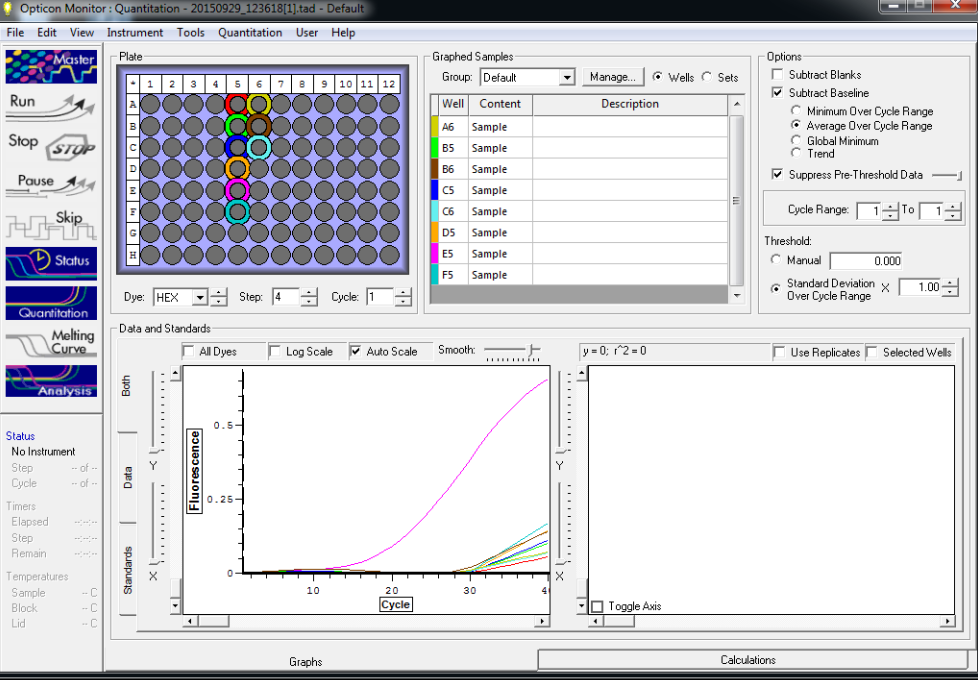 Image above is from qPCR multiplex test using geoduck and pac oyster DNA and sample containing 20 of each of the following organism: manila clam pac oyster geoduck. Some amplification is present for geoduck but nothing shows for Pac. oyster.
UWT-Becker LabSmithhisler
Counting Willapa Bay pump samples09/28/15Created by: Smithhisler
Goals
- Finish counting the Case Inlet South sample (Dark-Grass-Low).
- Count the larvae in the Willapa Bay samples. Only count those samples that have the same variables as the samples from Case Inlet that yielded the greatest amount of larvae (Dark-Grass-Low or deep)
Methods
- I began by preparing the microscope bench by clearing of all materials and rinsing with a 10% bleach solution and 2 rinses of nanopure water, wiping dry between each rinse. I then prepared 3 petri dishes by the 5-step rinsing procedure in the measuring containers rinsed with DI water. I first rinsed each dish in 10% bleach, then 3 rinses of DI water and a final rinse of nanopure water before drying with Kimwipes.
- I started with pump sample Case Inlet South-Grass-Low-Dark
- I counted the sample by using the 5mL pipette and pipetting 1-3mL at a time depending on the cloudiness of the sample. I began pipetting at the bottom of the vial and pipetted some of the clearer sample at the top to clear the contents on the petri dish a little. After expelling the sample into the petri dish, I ejected the pipette tip while holding the top of the tip in my hand. I then rinsed the exterior and interior of the pipette tip so as the contents would go into the petri dish. I visually checked to make sure the pipette tip looked clear. I tapped the end of the tip of the rinsed pipette on the inside edge of the plate to grab the last remaining ethanol in the pipette. With the sample and rinse of ethanol, the plate is covered with sample (this prevents drying of sample and is fine as long as it is moved with a steady hand so as not to shake up the plate too much and the larvae tend to stay still as they are most dense). I used the hand clicker to count the larvae from each pipette. After counting the petri dish, I used the 95% ethanol bottle to rinse the dish contents into a new, labeled, V-shaped bottom 50mL vial. I also rinsed the bottom/back corner of the dish because the ethanol flowed to that area when pouring out of the square plates. When nearing the last of the sample, I rinsed the vial with ethanol. I capped the original sample tube and gently swished the ethanol back and forth while holding the tube horizontally. I then carefully pipetted up as much of the remaining ethanol and sample as possible (some ethanol seems to seep to the bottom after the pipette appears to have gotten it all) and added it to the petri dish to be checked. I added more ethanol as a second rinse and pipetted this up as well to make sure I was not missing any larvae.
- I had to centrifuge this sample once at 3000rpm for 45 seconds. I did this because the ethanol from rinsing the plate and pipette tip filled the tube quickly. I then pipetted out the supernatant and added it to a petri dish. I then analyzed the supernatant for any organisms. By doing this, we make sure that we are only discarding ethanol and not any of the sample.
- If the sample was finished and the tube was over the 40mL mark, I centrifuged again and brought the volume to 40mL.
- This sample had 123 total bivalve larvae. The larvae were very round and most of them were large.
- I had to centrifuge this sample once at 3000rpm for 45 seconds. I did this because the ethanol from rinsing the plate and pipette tip filled the tube quickly. I then pipetted out the supernatant and added it to a petri dish. I then analyzed the supernatant for any organisms. By doing this, we make sure that we are only discarding ethanol and not any of the sample.
- I then washed both petri dishes with the 5-step rinse process.
- I gathered the Willapa Bay samples from grass-low-dark. The first I counted was Willapa Bay East-Grass-Low-Dark.
- This sample had lots of plankton that were stuck together and difficult to maneuver and see through.
- The larvae in this sample were very small in comparison to what I’ve seen. There were a few medium sized ones, but mostly small. I took a photo of the most common larvae in this sample (*add photo this evening)
- This sample had a total of 73 larvae
- I then changed the bleach and water rinses and cleaned the petri dishes with the 5-step rinsing process.
- The next sample I counted was Willapa Bay North-Grass-Low(deep)-Dark
- This sample, as with the WBE sample, had one large chunk of plankton that got stuck in the 5000uL pipette tip.
- This sample had a total of 63 larvae
- The Willapa Bay samples do not have as much plankton as Case Inlet.
- This sample was particularly hard to count because the larvae were small and there were a lot of what I believe are rock particles that make using the polarized lens more difficult because they reflect the light in similar ways.
- I replaced the solutions for the 5-step rinsing process and once again cleaned both petri dishes.
- The next sample I counted was Willapa Bay South-Grass-Low-Dark
- The larvae in this sample were hard to spot because they were so small. Many of the cross patterns did not appear and I judged by shape and color.
- This sample had 37 larvae.
Results
| Location |
Site |
Day/Night |
Grass/Bare |
High/Low |
Total Larvae |
| Case Inlet |
North |
Day |
Bare |
Low |
4 |
| Case Inlet |
North |
Day |
Bare |
High |
11 |
| Case Inlet |
North |
Night |
Bare |
High |
14 |
| Case Inlet |
North |
Night |
Bare |
Low |
22 |
| Case Inlet |
North |
Day |
Grass |
High |
34 |
| Case Inlet |
North |
Night |
Grass |
High |
43 |
| Case Inlet |
North |
Day |
Grass |
Low |
51 |
| Case Inlet |
North |
Night |
Grass |
Low |
117* |
| Case Inlet |
Rocky |
Night |
Grass |
Low |
113 |
| Case Inlet |
South |
Night |
Grass |
Low |
123 |
| Willapa Bay |
East |
Night |
Grass |
Low/Deep |
73 |
| Willapa Bay |
North |
Night |
Grass |
Low/Deep |
63 |
| Willapa Bay |
South |
Night |
Grass |
Low/Deep |
37 |
Future StepsI will count the Fidalgo Bay and Port Gamble Night-Grass-Deep samples later this week. I will count the Day-Bare-Low samples as well to get an idea of the minimums as well to determine qPCR specificity.
UWT-Becker Lab
Smithhisler
Finish counting Case Inlet round 1 pump samples09/27/15
Created by: Smithhisler
Goals
Finish counting Case Inlet pump samples
Methods
- I began by preparing the microscope bench by clearing of all materials and rinsing with a 10% bleach solution and 2 rinses of nanopure water, wiping dry between each rinse. I then prepared 3 petri dishes by the 5-step rinsing procedure in the measuring containers rinsed with DI water. I first rinsed each dish in 10% bleach, then 3 rinses of DI water and a final rinse of nanopure water before drying with Kimwipes.
- I started with pump sample Case Inlet North-Grass-High-Dark
- I counted the sample by using the 5mL pipette and pipetting 1-3mL at a time depending on the cloudiness of the sample. I began pipetting at the bottom of the vial and pipetted some of the clearer sample at the top to clear the contents on the petri dish a little. After expelling the sample into the petri dish, I ejected the pipette tip while holding the top of the tip in my hand. I then rinsed the exterior and interior of the pipette tip so as the contents would go into the petri dish. I visually checked to make sure the pipette tip looked clear.With the sample and rinse of ethanol, the plate is covered with sample (this prevents drying of sample and is fine as long as it is moved with a steady hand so as not to shake up the plate too much and the larvae tend to stay still as they are most dense). I used the hand clicker to count the larvae from each pipette. After counting the petri dish, I used the 95% ethanol bottle to rinse the dish contents into a new, labeled, V-shaped bottom 50mL vial. I also rinsed the bottom/back corner of the dish because the ethanol flowed to that area when pouring out of the square plates.
- I had to centrifuge this sample twice at 3000rpm for 45 seconds. I then pipetted out the supernatant and added it to a petri dish. I then analyzed the supernatant for any organisms. By doing this, we make sure that we are only discarding ethanol and not any of the sample.
- This sample had 43 larvae.
- I then washed both petri dishes with the 5-step rinse process.
- I then determined that it was the Grass-Low-Night that yielded the most larvae.
- The next sample I counted was Case Inlet Rocky-Grass-Low-Night.
- This sample was similar to the Case Inlet North sample with the same variables in the way that there was a large variety in shape and size of the larvae.
- There were many very small larvae that are responsible for the spike in numbers of larvae for these samples.
- When nearing the last of the sample, I rinsed the vial with ethanol. I capped the original sample tube and gently swished the ethanol back and forth while holding the tube horizontally. I then carefully pipetted up as much of the remaining ethanol and sample as possible (some ethanol seems to seep to the bottom after the pipette appears to have gotten it all) and added it to the petri dish to be checked.
- I counted 16 larvae just from the final rinse and swish procedure of the original tube. This step is important to make sure there are no larvae left in the original tube!
- This sample was similar to the Case Inlet North sample with the same variables in the way that there was a large variety in shape and size of the larvae.
- I cleaned the petri dishes with the 5-step rinse process. I then cleaned the microscope bench with a 10% bleach rinse and 2 rinses of nanopure water.
Results
| Location |
Site |
Day/Night |
Grass/Bare |
High/Low |
Total Larvae |
| Case Inlet |
North |
Day |
Bare |
Low |
4 |
| Case Inlet |
North |
Day |
Bare |
High |
11 |
| Case Inlet |
North |
Night |
Bare |
High |
14 |
| Case Inlet |
North |
Night |
Bare |
Low |
22 |
| Case Inlet |
North |
Day |
Grass |
High |
34 |
| Case Inlet |
North |
Night |
Grass |
High |
43 |
| Case Inlet |
North |
Day |
Grass |
Low |
51 |
| Case Inlet |
North |
Night |
Grass |
Low |
117* |
| Case Inlet |
Rocky |
Night |
Grass |
Low |
113 |
*Case Inlet North Night Grass Low is not a total count
Future StepsI will begin tomorrow by counting Case Inlet South-Grass-Low-Night to see if the pattern of a large amount of larvae (>100) continues. It was also recommended to me by Michelle McCartha to count the samples with the variables that yielded the least larvae. In this case, it was Day-Bare-Low. This may show if there is a correlation between the maximum and minimum numbers of larvae for sample sites and the variables.
UWT-Becker LabSmithhisler
Counting Case Inlet round 1 pump samples09/26/15Created by: Smithhisler
GoalsContinue counting Case Inlet pump samples
Methods
- I began by preparing the microscope bench by clearing of all materials and rinsing with a 10% bleach solution and 2 rinses of nan opure water, wiping dry between each rinse. I then prepared 3 petri dishes by the 5-step rinsing procedure in the measuring containers rinsed with DI water. I first rinsed each dish in 10% bleach, then 3 rinses of DI water and a final rinse of nanopure water before drying with Kimwipes.
- I started with pump sample Case Inlet North-Grass-Low-Dark
- I counted the sample by using the 5mL pipette and pipetting 1-3mL at a time depending on the cloudiness of the sample. I began pipetting at the bottom of the vial and pipetted some of the clearer sample at the top to clear the contents on the petri dish a little. After expelling the sample into the petri dish, I ejected the pipette tip while holding the top of the tip in my hand. I then rinsed the exterior and interior of the pipette tip so as the contents would go into the petri dish. I visually checked to make sure the pipette tip looked clear.With the sample and rinse of ethanol, the plate is covered with sample (this prevents drying of sample and is fine as long as it is moved with a steady hand so as not to shake up the plate too much and the larvae tend to stay still as they are most dense). I used the hand clicker to count the larvae from each pipette. After counting the petri dish, I used the 95% ethanol bottle to rinse the dish contents into a new, labeled, V-shaped bottom 50mL vial. I also rinsed the bottom/back corner of the dish because the ethanol flowed to that area when pouring out of the square plates.
- This sample had a varying size of larvae with different shapes. There were a lot of snails but these were fairly easy to distinguish.
- This sample had so many larvae it got difficult to count. I stopped counting at 117*, and still had about 8mL of sample left to count. This brings up the issue of subsampling. I will move on to other samples, but may want to come back and slowly count this sample to determine the total amount.
- *not total count
- 38-44-33
- I had to centrifuge this sample twice at 3400rpm for 45 seconds. I then pipetted out the supernatant and added it to a petri dish. I then analyzed the supernatant for any organisms. By doing this, we make sure that we are only discarding ethanol and not any of the sample.
- I then pipetted out the rest of the sample and added it directly to the new tube, without counting. I rinsed the original sample tube with the cap by swishing ethanol as done previously, pipetting out the resulting solution and adding it to the new tube.
- I then washed both petri dishes with the 5-step rinse process. I took out three more 50mL V-shaped bottom vials from the packaging (not sterile)
- Next I counted the sample Case Inlet North-Bare-Low-Light following similar procedures as above.
- This sample only had 4 larvae that I could find. 3 were large and 1 was small.
- I then rinsed the petri dished and next counted the sample Case Inlet North-Bare-High-Light following similar procedures as above.
- Larvae were very small and extremely difficult to see through all of the phytoplankton that was clumped up in this sample (chain diatoms mostly).
- 2 larger larvae without a distinctive umbo, more of a square shape
- 11 total larvae
Future StepsI will finish counting Case Inlet round 1 pump samples (CIN-Grass-High-Dark) tomorrow. Once I have determined the environmental factors that yielded the greatest number of larvae, I will count the other locations/sites with those variables to present a maximum larvae count for round 1 samples.
SAFS- Roberts LabMcCartha
qPCR using geoduck larvae spiked plankton tow samples and re-run of serial dilution of C. gigas DNA 9/25/15Created by Michelle McCartha
Goals:To run qPCR on 6 sets of triplicate plankton samples spiked with 50/25/10/5/1 geoduck larvaeTo run qPCR on serial dilution of C. gigas DNA again to see if we get better results.
Methods:
- Keeping volume of reactions at 50µL for now.
- Geoduck total reactions 32
- Pacific oyster total reactions 40
- Prepared master mix for each species separately using the following volumes.
| Master Mix Solutions |
Standard volume (μL) |
Multiply By |
new volume |
|
add pipette error |
Final volume to add (μL) |
| Master mix |
25 |
32 |
800 |
80 |
880 |
880 |
| FWD Primer |
1.5 |
32 |
48 |
4.8 |
52.8 |
52.8 |
| Rev Primer |
1.5 |
32 |
48 |
4.8 |
52.8 |
52.8 |
| Probe |
1 |
32 |
32 |
3.2 |
35.2 |
35.2 |
Pacific oyster master mix
| Master Mix Solutions |
Standard volume (μL) |
Multiply By |
new volume |
|
add pipette error |
Final volume to add (μL) |
| Master mix |
25 |
40 |
1000 |
100 |
1100 |
1100 |
| FWD Primer |
1.5 |
40 |
60 |
6 |
66 |
66 |
| Rev Primer |
1.5 |
40 |
60 |
6 |
66 |
66 |
| Probe |
1 |
40 |
40 |
4 |
44 |
44 |
- Template-4μL
- Water- 17μL for reactions with template 21μL for reactions with out template.
- Created master mix by first adding powermix, then FW/REV primers and probe mix by pipetting up and down upon adding to the vial.
- Had to make more geoduck probe. To do this used standard C1V1=C2V2 calculation to make a 10μM working stock solution from a 100μM shelf stock of geoduck probe.
- 90μL Water
- 10μL probe stock
- Added water then stock solution. Mixed by pipetting up and down and finger vortexing.
- Finished making master mixes.
Plate set up
| 1 |
2 |
3 |
4 |
5 |
6 |
7 |
8 |
9 |
10 |
11 |
|
| A |
NTC |
1.1(raw) |
2.1(raw) |
3.1(raw) |
NTC |
1 |
1 |
1* |
1* |
Pg NTC |
Cg NTC |
| B |
NTC |
1.2(50) |
2.2(50) |
3.2(50) |
NTC |
10^-1 |
10^-1 |
10^-1* |
10^-1* |
Pg NTC |
Cg NTC |
| C |
NTC |
1.3(25) |
2.3(25) |
3.3(25) |
NTC |
10^-2 |
10^-2 |
10^-2* |
10^-2* |
Pg NTC |
Cg NTC |
| D |
NTC |
1.4(10) |
2.4(10) |
3.4(10) |
NTC |
10^-3 |
10^-3 |
10^-3* |
10^-3* |
Pg NTC |
Cg NTC |
| E |
NTC |
1.5(5) |
2.5(5) |
3.5(5) |
NTC |
10^-4 |
10^-4 |
10^-4* |
10^-4* |
||
| F |
NTC |
1.6(1) |
2.6(1) |
3.6(1) |
NTC |
10^-5 |
10^-5 |
10^-5* |
10^-5* |
||
| G |
TC |
PL |
PL |
PL |
TC |
10^-6 |
10^-6 |
10^-6* |
10^-6* |
||
| H |
TC* |
AL |
AL |
AL |
TC* |
10^-7 |
10^-7 |
10^-7* |
10^-7* |
- NTC- No template control
- TC- template control using DNA isolated from adult specimen with 1G being geoduck tissue and 5G being from pacific oyster tissue isolated using DNAzol method.
- TC*- template control using DNA isolated from larvae (Geoduck larvae- 18 16-day old larvae using modified pK solution for digestion, oyster larvae- 20 18-day old pacific oyster larvae DNA isolated using modified pK method.
- AL- samples with a combination of manila clam, pacific oyster, and geoduck larvae (20:20:20 respectively).
- PL- bivalve larvae found in the plankton tows prior to spiking them- tests to see if there is any focal species in the samples that we should know about.
- * indicates where larvae DNA was used in serial dilution samples and in TC groups.
- Columns 1-4 use geoduck primers and columns 2-4 rows B-F are spiked samples.
- Key to the numbers in the spiked samples: Numbers simply represent sample rep and treatment of labeled vial where 1:3 (25) where sample:treatment (number larvae spiked with) so this reads sample rep 1 treatment 3 which contains 25 larvae. All reps were from a single collection of plankton and distributed into the six treatments.
- Columns 10, 11 are extra NTC groups for each species since there was extra mix.
- Pipetted volumes listed above into each reaction well and capped wells and centrifuged for 1 min and 2000RPM. Cleaned caps with kim wipe.
- Rows 5-9 use pac. oyster primers and are serial dilutions up to 10-7
- Changed the time for annealing temp from 20 seconds at 60C to 50 seconds as this is the suggested time frame in the IQ powermix user guide..
- Changed volume of reactions from 20μL to 50μL.
- Tried setting up standards but failed, I think I can do this when it's finished an don my computer...
- Saved file as Tad file 20150925_114020
Results
Data image 1 (below) plankton spiked samples and geoduck primers and probe with IQ master mix. There was some amplification but seems to be variable although when you examine closer looking at rep by rep (row 1,2,3 individually) there is a step-wise pattern between the samples that relates to how many larvae the samples were spiked with which is promising.
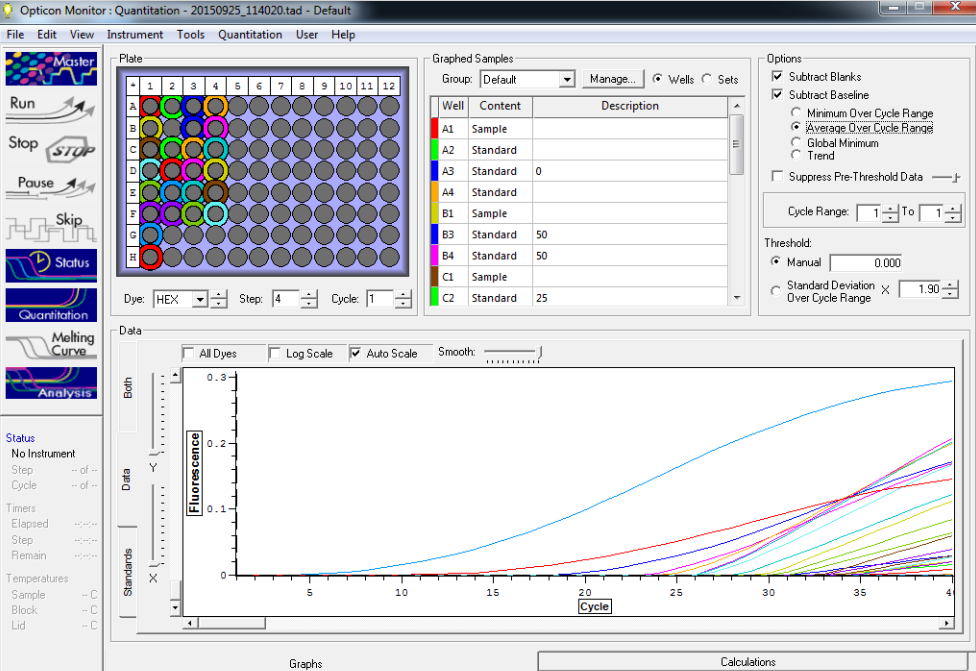
Data image 2 (below): Still used geoduck primers and probe here with samples that contained larvae found in the plankton tow prior to spiking and assorted larvae. Blue and red lines are out template control groups. Other samples also showed amplification.
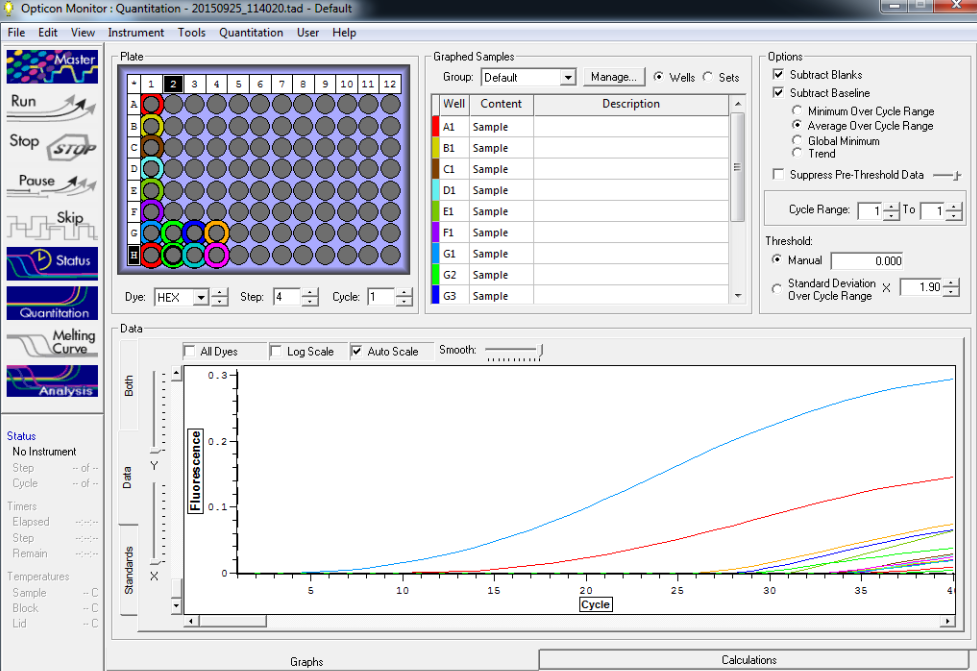
Data image 3 (below): C. gigas primers and probe used with IQ master mix. These were supposed to be serial dilutions but no amplification was present in the reaction. Not sure what happened- will test again.*image coming soon
UWT-Becker LabMcCartha
Checking plankton from density gradient and cleaning up DNA isolation of spiked plankton samples 9/24/15Created by Michelle McCartha
Goals:To centrifuge down spiked plankton samples that were digested to get rid of plankton and other unwanted materials so that only DNA is assumed to be in the tubesTo check phase 3 (sugar phase) of the density gradient solutions to see if there are more larvae to be found in it.
Methods:Checking Phase 3 for larvaeWith out disturbing the plankton that seemed to be isolated to the bottom of the 50ml vial, pipetted approx. 20ml out 1 ml at a time and checked for larvae in contents via microscopy. In the last 5 ml checked for plankton 20 microliters at a time after swirling to suspend the plankton. 22 out of the 31 larvae were retrieved from the sugar can syrup density at 1.2g/cm3.Other contents in the sugar solution was phytoplankton and zooplankton like copepods.
Cleaning up spiked samplesRetrieved samples from the freezer and set out to thaw. Once thawed, centrifuged at 2000rpm for 3 minutes. Pipetted out supernatant that is assumed to contain DNA into new tube with corresponding label with out disturbing pellet containing plankton mess. Still had some liquid in the pellet so centrifuged again 2000RPM for 3 minutes and pipetted out supernatant as much as could and dispensed into corresponding tube. New samples had suspended material in it as well so centrifuged those down at 2000RPM for 3 minutes and dispensed supernatant into a new labeled vial. Placed samples in freezer until ready to prep for taking to Seattle.
UWT- Becker LabMcCartha
Completing DNA isolation from mock up samples and testing density gradient methods 9/23/15.Created by: Michelle McCartha
Goals**:
- To finish digesting samples that were set out overnight in pK solution.
- To test density gradient methods as a form of filtering larvae from plankton samples.
Methods:DNA isolation
- Upon entering lab, finger vortexed samples and turned on shaker table so that the samples could get some movement during digestion.
- Since the samples were set up in the pK solution yesterday at 5:00pm, they will continue their digestion until 3:00pm today.
- 11:00am- finger vortexed samples again and checked temp- still reading 56C.
- 2:00pm- finger vortexed samples again and turned up temp to 95C to denature the pK as the last step in the method of DNA isolation.
- 3:00pm- turned of shaker table and heat block finger vortexed samples and placed them in a cryo-box then in the freezer. They still have a large amount of sediment in them so I intend to centrifuge them down and keep the supernatant prior to running them with qPCR.
Density GradientNeed plankton- there is still some plankton remaining in the 18 Thea Foss samples used in the spiked mock up reps so pipetted it all and placed into a single 50ml vial.Starting Densities:
- Seawater- 1.027g/cm3
- Water-1.0022g/cm3
- Ethanol-0.789g/cm3
- Sugar cane syrup-1.430g/cm3
- 141- the radius of the centrifuge for ThermoScientific model CL-2 Swing bucket rotor.
- Want 300G
- Equation: G=1.12*R*RPM
- 300=1.12*141*(RPM/1000)2=1378RPM
- 300=1.12*141(x/1000)2----->
- 300=157.92(x/1000)2----->
- (300/157.92)=(x/1000)2----->
- 1.89969605=x/10002----->
- Sqroot(1.89969605)=x/1000----->
- 1.378294617*1000=X----->
- X= 1378
- Set the centrifuge to 1300
Paugam et al. 2003Density of sugar close to 1.30Centrifuged 300G for 2 min first and poured off supernatant which contained 70% ethanol.Pellet with different plankton gently poured onto the surface of 20ml syrup in another tube. Centrifuged again at 300G for 2 min.
Diluting sugar cane syrup
- Using lyle's Golden Syrup which according to their website has a density of 1.430g/cm3
- Want to dilute (using ultrapure water for now) to 1.2g/cm3 following literature from Perez et al. (above).
- Since density is like a concentration (molecules in a given volume) can use standard concentration dilution equation C1V1=C2V2.
- (1.430g/cm3 )(XmL)= (1.200g/cm3 )(50mL)
- X=60/1.430----->
- X=41.958mL or roughly 42mL sugar cane syrup diluted with 8mL ultra pure water.
- I would not recommend measuring in a graduated cylinder- syrup is extremely viscous and is hard and time consuming to pour accurately with little mess and spill over. Instead I decided to pour directly into the 50mL centrifuge tube and top off with the volume of water needed to dilute the syrup. I stirred using a glass stir rod until well mixed. Once it was mixed it was visibly less dense than the original product.
- In the plankton sample that I am using to test, there are no larvae that I could see when checked. Spiked sample with geoduck larvae given to us from Taylor shellfish stock. First I added 18- then thought this may be a low number so added 13 more for a total of 31 larvae.
- Centrifuged for 2 min at 1.3X1000rpm
- Poured (so as to not distrub pellet) supernatant until only 5ml volume left in 50ml sample which should contain 95% ethanol, plankton and spiked larvae.
- Retrieved new 50mL and added 20ml of diluted syrup labeled tube Density gradient test 1.
- Slowly poured mock up plankton sample on top of syrup. Did this at an angle so I wouldn't destabilize the gradient.
- Rinsed sample tube with ethanol to get all sample out which was difficult so tried squeezing at an angle and that seemed to wash it all down well but need to be conservative with ethanol- ended up adding an additional 15mL ethanol with sample. So now the tube has a total volume of 40mL (20 syrup and 20 plankton in ethanol).
- Centrifuged for 2 min at 1.3RPM (300G)
- density separation was visually successful. Clear pellet at the bottom that should have larvae and sediment (pellet). Appears to be some stuff trapped in the syrup (phase 3). There is a clear area on top of the syrup which should contain plankton (phase 2)and then there is the ethanol supernatant (phase 1).
- Poured phase 1 and 2 as best as could into new 50ml sample tube labeled phase 1, 2. Poured phase 3 in another 50mL vial labeled phase 3 .
- Kept pellet in test tube 1 but it still has sugar in it. tried diluting with 95% ethanol but then it just formed a ball of sugar after twirling it around so centrifuged again 300G 2 min to separate out ethanol which was placed with phase 1/2 sample.
- With pellet fully formed at the bottom again tried pipetting out most of the syrup and placing in the phase 3 tube.
- Need to separate sample from rest of stick syrup so diluted with ultra pure water. Swirled to dilute and mix then pipetted 1.5ml at a time into 6 2ml micro-centrifuge tubes.
- Centrifuged micro-centrifuge tubes for 2 min at 1300RPM. Pipetted off water. Checked water to make sure no larvae was present and discarded. Resuspended pellets in 95% ethanol.
- Next will check to see what are present in each of the gradients.
Checking Gradients
- Using a pipette set to 0.5mL I checked the micro-centrifuge tubes. Nothing but sediment and some phytoplankton is present. This is a drag since our larvae was supposed to be in the pellet.
- Phase1/2 vial of ethanol and top layer containing lower density critters mostly had micro algae and some phytoplankton.
- Need to check sugar solution.
- Added 10mL ultrapure water to vial to decrease viscosity and mixed by inversion.
- After it was well mixed, pipetted 1.5 ml onto clean petri dish and noted that there were numerous zoo and phytoplankton as well as two bivalve larvae indicating that our larvae may be caught up in the sugar.
- Placed the entire sample on the petri dish back into the sample tube with the sugar which I will continue to check for the rest of the larvae to see if they are all retrieved or if some were lost during the mix.
Image 1 (above): test on density gradient prior to centrifugation. Here we have almost equal amounts of plankton sample in ethanol (cloudy liquid at the top of the vial) and our sugar that we altered to have a density of 1.2g/cm3 at the bottom (amber colored).
Image two (above) after centrifugation, clear separations are visible where phase 1 is ethanol supernatant, phase 2 is this film of plankton above the sugar, phase 3 is the sugar syrup and the pellet is as the bottom of the tube.
Image 3 (above): Pellet at the bottom of the tube should be were our larvae went to but only contained sediment particles and some phytoplankton.
Future steps:To finish pK DNA isolation on spiked samples.To check the sugar for larvae that may have been trapped in it due to it's density being to high still.Need to play with the density of the sugar solution- need to make less dense so the larvae filter through it but not too dense so that the undesired plankton go down with the larvae defeating the purpose of using the density gradient in our methods.
UWT-Becker LabSmithhisler
Counting Case Inlet pump samples09/23/15Created by: Smithhisler
Goals1) Continue counting bivalve larvae in Case Inlet North pump samples to determine which has the maximum number of larvae.
Methods
- I began by preparing the microscope bench by clearing of all materials and rinsing with a 10% bleach solution and 2 rinses of nanopure water, wiping dry between each rinse. I then prepared 3 petri dishes by the 5-step rinsing procedure in the measuring containers rinsed with DI water. I first rinsed each dish in 10% bleach, then 3 rinses of DI water and a final rinse of nanopure water before drying with Kimwipes.
- I started with pump sample Case Inlet North-Grass-High-Light
- I counted the sample by using the 5mL pipette and pipetting 1-3mL at a time depending on the cloudiness of the sample. I began pipetting at the bottom of the vial and pipetted some of the clearer sample at the top to clear the contents on the petri dish a little. After expelling the sample into the petri dish, I ejected the pipette tip while holding the top of the tip in my hand. I then rinsed the exterior and interior of the pipette tip so as the contents would go into the petri dish. I visually checked to make sure the pipette tip looked clear. I used the hand clicker to count the larvae from each pipette. After counting the petri dish, I used the 95% ethanol bottle to rinse the dish contents into a new, labeled, V-shaped bottom 50mL vial. I also rinsed the bottom/back corner of the dish because the ethanol flowed to that area when pouring out of the square plates.
- The total larvae count for CIN-Grass-High-Light was 34. The sample was mostly chain diatoms and other phytoplankton.
- When nearing the last of the sample, I rinsed the vial with ethanol. I capped the original sample tube and gently swished the ethanol back and forth while holding the tube horizontally. I then pipetted up the remaining ethanol and sample and added it to the petri dish to be checked.
- This sample did not have any photos taken of its larvae, but had mostly large sized larvae
- I counted the sample by using the 5mL pipette and pipetting 1-3mL at a time depending on the cloudiness of the sample. I began pipetting at the bottom of the vial and pipetted some of the clearer sample at the top to clear the contents on the petri dish a little. After expelling the sample into the petri dish, I ejected the pipette tip while holding the top of the tip in my hand. I then rinsed the exterior and interior of the pipette tip so as the contents would go into the petri dish. I visually checked to make sure the pipette tip looked clear. I used the hand clicker to count the larvae from each pipette. After counting the petri dish, I used the 95% ethanol bottle to rinse the dish contents into a new, labeled, V-shaped bottom 50mL vial. I also rinsed the bottom/back corner of the dish because the ethanol flowed to that area when pouring out of the square plates.
- I then used a clean petri dish and repeated this process for two other samples, cleaning petri dishes with the 5-step rinsing process if used.
- The next sample from Case Inlet North that was arbitrarily chosen to count was Case Inlet North-Bare-High-Dark
- This sample had a small amount of very small larvae. Many of these did not have a distinctive umbo as I had seen in CIN-Grass-High-Light (today) and CIN-Grass-Low-Light (yesterday)
- Many of these larvae were photographed using Michelle’s iPhone. These photos were taken at the same time as the sugar gradient photos captured by Michelle.
- This sample had 14 total larvae.
- Case Inlet-North-Bare-Low-Dark
- This sample had a lot of phytoplankton ‘gunk’ and I found mostly small larvae.
- This had 22 bivalve larvae.
- No photos were taken of this sample.
- The next sample from Case Inlet North that was arbitrarily chosen to count was Case Inlet North-Bare-High-Dark
- It is possible that larvae were missed or snails were mistaken for bivalve larvae.
- This means actual numbers may be more or less than what I have counted.
- After completion of three samples, I rinsed the petri dishes with the 5-step rinsing process. I returned all materials and cleaned the microscope bench with 10% bleach and nanopure water.
Future stepsI will continue to count and transfer Case Inlet North samples from round 1 pumping. After determining the sample(s) with the maximum amount of larvae, I will count the other locations and sites with the same conditions.
UWT- Becker LabMcCartha
Digesting geoduck spiked plankton samples using modified pK solution 9-22-15Created by: Michelle McCartha
Goals:To add pK solution to spiked mock up samples for to start DNA isolation process.
Methods:Retrieved samples spiked with geoduck larvae from fume hood and placed the caps back on.They all appear to have dried well and there is still a very visible pellet of plankton at the bottom of the tube. After a brief discussion with Megan about how She and Brent decided to increase the volume of pK solution from 200 microliters to 500microliters due to the amount of "gunk" in the tubes she had, we decided it would be ok to digest our samples in 700microliters to see how if we get a good digestion.Pipeted 700 microliters of modified pK solution from the new stock Brenda made using the corrected ingredients into each sample.Finger vortexed to suspend and break up pellet. Placed on heat block set to 58C (which reads 56C) and left for overnight digestion.
UWT-Becker LabMcCartha, Smithhisler
Making modified Proteinase K solution, setting up equipment and counting live pump samples09/22/15Created by: Smithhisler
Goals1) Make 80mL of modified Pk solution2) Set up equipment and review protocol for looking at live pump samples under the microscope
MethodsMaking modified Pk digestion solution from Wright et al. 2009
- We had a 100mM Tris base solution already prepared by MM 08/04, but the SOP calls for 10mM concentration.
- C1xV1=C2xV2
- 100mMxV1=10mMx80mL
- (final volume of total solution needs to be 80mL, this was used for calculations for Tris base as done previously by MM BS 09/03/15)
- V1=8mL of 100mM Tris base
- To dilute, I rinsed a 10mL graduated cylinder with nanopure water. I then poured 8mL of the 100mM Tris base into the graduated cylinder. I rinsed a 50mL Erlenmeyer flask with nanopure water. I added about 15mL of nanopure water to the flask. I then poured the measured 8mL of Tris base solution from the graduated cylinder into the flask. I rinsed the graduated cylinder with nanopure water and added the rinse solution to the flask.
- To calculate the amount of KCl required to make 50mM solution in 80mL final volume, I used the molar mass to determine grams of KCl to add.
- Molar mass (g/mol) x Desired molarity (mol/L) x Final volume (L)= mass (g)
- 74.5513g/mol x 0.05M x 0.08L=0.298g of KCl
- We realized that the calculations for previous pk solutions and KCl amount was wrong. If following the SOP, a 40mL solution would only need 0.149g of KCl. This means that the (3) 15mL centrifuge tubes prepared by MM and BS on 09/03/15 had a 0.10mM concentration of KCl.
- I measured 0.298g of KCl in a weigh boat (actual mass: 0.300g). Then, I added the KCl to the Erlenmeyer flask with Tris base and water by pinching and folding the weight boat, and scooping and tapping the the KCl into the flask using the scupula. To get any further residual salt, I gently and lightly rinsed the weight boat with nanopure water and allowed it to run into the flask, making sure to keep in mind that the pK solution still needed additional material added to it. The solution in the flask was swirled to dissolve the KCl.
- To determine the amount of Tween-20 to add to the solution, I used the desired final concentration of 0.5% Tween 20 and the final volume of 80mL
- 0.5%/1000=0.0005
- 0.0005 x 80mL=0.04mLx1000µL=40µL
- I pipetted up 40µL of Tween 20 slowly in a 100µL pipette, trying to avoid bubbles in the pipette tip. The 40µL was added to the Erlenmeyer flask, mixing with the pipette in different locations in the pK solution to mix thoroughly but still trying to avoid bubbles.
- I then added 4mL of Proteinase K using four 1mL vials of Proteinase K and a 1000µL pipette. For each 1mL, I changed pipette tips and checked for residual Proteinase K for keeping. However, three of the 1mL vials of Proteinase K were emptied and only 1 had more than 1mL in the vial.
- 4mL of 20mg/1mL=80mg/mL into final volume of 80mL to obtain 80mg/80mL and a 1mg/1mL final concentration
- I poured the solution into the 100mL graduated cylinder and rinsed out the flask with nanopure water, adding the contents of the rinse to the graduated cylinder. I then poured the solution in the graduated cylinder back into the flask for mixing. I carefully poured the solution in the flask back into the graduated cylinder. I rinsed the Erlenmeyer flask twice with nanopure water, adding the contents to the graduated cylinder. I then added nanopure water to the graduated cylinder up to the 80mL mark.
- I distributed the 80mL solution into (6) labeled 15mL vials and placed in the freezer and returned KCl and Tween 20 to the chemistry prep room.
- I began by preparing the microscope bench by clearing of all materials and rinsing with a 10% bleach solution and 2 rinses of nanopure water, wiping dry between each rinse. I then prepared 3 petri dishes by the 5-step rinsing procedure in the measuring containers rinsed with DI water. I first rinsed each dish in 10% bleach, then 3 rinses of DI water and a final rinse of nanopure water before drying with Kimwipes.
- Megan, Michelle, and I discussed the best method for working with samples and the microscope. It was decided that it would be best to use a hand clicker and to transfer the sample to the new 50mL vials with V-shaped bottoms because these are better for sample storage. This also aided in the transfer/holding of sample after it has been reviewed and counted because the new vial acted as the storage container.
- I started with pump sample Case Inlet North-Grass-Low-Light
- I counted the sample by using the 5mL pipette and pipetting 1mL at a time, beginning at the bottom of the vial and working up as the sample decreased. After expelling the sample into the petri dish, I ejected the pipette tip while holding the top of the tip in my hand. I then rinsed the exterior and interior of the pipette tip so as the contents would go into the petri dish. I visually checked to make sure the pipette tip looked clear.
- For the first four milliliters, I counted 38-7-5-1 larvae respectively. This totals to 51 larvae. The rest of the sample did not have any larvae, but was pipetted and checked in the petri dish. After counting each plate, I poured the contents into the newly labeled 50mL V-shaped vial, and rinsed the plate with 95% ethanol and shook off all liquid. If there was sample on the outside corner edge of the dish after pouring, I rinsed the outside/bottom with ethanol and tapped into the vial.
- Once the new 50mL had become full, Michelle and I took the vial and an empty vial to the biology room to centrifuge. She filled the empty vial with water and we centrifuged at 2500rpm for 45 seconds. This did not appear to split the sample enough, so we centrifuged at 3300rpm for about 25 seconds. This appeared to work well, so we returned to the lab to finish processing the sample. Upon return, I pipetted out 20mL from the top of the vial and checked it in a petri dish under the microscope to make sure there were no larvae.
- There was no larvae and the ethanol was placed aside in waste.
- I rinsed the original sample vial with ethanol, and found that many particles were stuck to the sides. Michelle tried adding about 1-2mL of ethanol and swishing it back and forth, holding the tube horizontally, to dislodge the material. Not all particles were able to come off of the sides of the vial, but there was some that went to the bottom of the vial and was pipetted out and checked under the microscope for bivalve larvae.
- I had to perform centrifugation one more time of the new sample tube and pipetted out and checked 25mL of ethanol for larvae.
- I used a 1000µL pipette to gather all of the remaining particles at the bottom of the original sample tube and check for larvae.
Future StepsContinue analyzing and counting bivalve larvae in pump samples under the microscope. We will perform this to find the rough maximum amount of larvae in the samples. I will count all of the Case Inlet North samples to find which variables yielded the most larvae (light or dark, deep or shallow). This information will then be used to count the other samples that have these same variable from the other sites and locations to hopefully find the maximum larvae of all samples. This information will help us determine the procedures for working with samples and if we will need to perform subsampling.
UWT- Becker LabMcCartha
Preparing plankton samples for geoduck spiked curve 9-21-15Created by Michelle McCartha
Goals:To spike them with larvae and set out to dry overnight so they can start digestion 9/22/15 using pK method.
Methods:Centrifuged plankton samples for 1000G 5 minutes and collected then in 2ml tubes by pipetting from the bottom.1.5 ml at a time.When the 2ml tube was full and there was still sample to retrieve, centrifuged briefly and pipetted out supernatant (ethanol) with out disturbing pellet of plankton.This was repeated until all plankton was taken from mock up sample (roughly 10 times).This was then repeated for all mock up samples until they were all in 2ml tubes which will be used for digestion.Labeled tubes by sample and treatment as follows:
| Treatment |
Sample 1 |
Sample 2 |
Sample 3 |
| 1-(0 larvae)/Raw |
1.1 |
2.1 |
3.1 |
| 2- (50 larvae) |
1.2 |
2.2 |
3.2 |
| 3-(25 larvae) |
1.3 |
2.3 |
3.3 |
| 4- (10 larvae) |
1.4 |
2.4 |
3.4 |
| 5- (5 larvae) |
1.5 |
2.5 |
3.5 |
| 6- (1 larva) |
1.6 |
2.6 |
3.6 |
Using geoduck larvae provided by taylor shellfish, I pipetted larvae onto a clean petri dish and counted 50 larvae which were pipetted as a group and placed into sample 1.2. This continued from the remaining treatments.
When all samples had been spiked there were no left over larvae to place into the stock of geoduck larvae so the stock pile was put away.
The vials with spiked sample were centrifuged at 1000G for 2 minutes and ethanol supernatant was discarded with out disturbing pellet.
At 2:15 the tubes were placed in the fume hood with caps open to dry overnight.
SAFS- Roberts LabMcCartha
qPCR using C. gigas larvae and adult DNA 9/18/15Created by Michelle McCartha
Goal
- Remake working stock of C. gigas primers and probe.
- Remake serial dilution using DNA from 20 18-day old pacific oysters.
- Make serial dilution using DNA isolated in May/2015 from adult pacific oyster.
- Run qPCR using serial dilutions and SsoAdvanced supermix.
MethodsDiluting primers and probe
- To make a 10µM working stock from a 100µM stock solution with a total volume of 100µL need 10µL primer/probe and 90µL water. (C1V1=C2V2)
- Labeled three tubes with either Fwd primer, rev primer of probe.
- Added 9µL water to each tube.
- Topped up with 10µL each primer/probe respectively.
- Finger vortexed and set aside.
Serial dilutions of Adult and larvae DNA
- Labeled 20 tubes so that there would be 2 sets counting down from 1 - 10-9 and placed a red * on the top of 10 tube so we would know they contain the larvae serial dilution
- Added 90µL to each tube.
- Starting with the vial containing DNA from 20 pacific oyster larvae isolated using the modified pK method, pipetted out 10µL of solution and placed into tube labeled 1. Finger vortexed.
- Pipetted 10µL of vial labeled 1 and dispensed into vial 10-1. Finger vortexed.
- This repeated until all 10 vials were filled using 10µL of the vial before it.
- These steps were then repeated but using the DNA from an adult pacific oyster that was isolated in DNAzol May/2015.
qPCR prep and runPreparing master mix
- Labeled vial for master mix and added volumes listed below.
- Decided to run a total of 22 reactions since I am limited to 250µL of SsoAdvanced supermix.
- Added SsoAdvanced super mix volume, then primers (FWD/REV), probe. and finishing with water.
| Master Mix Solutions |
Standard volume (μL) |
Multiply By |
new volume |
|
add pipette error |
Final volume to add (μL) |
| Master mix |
10 |
22 |
220 |
22 |
242 |
242 |
| FWD Primer |
0.8 |
22 |
17.6 |
1.76 |
19.36 |
19.36 |
| Rev Primer |
0.8 |
22 |
17.6 |
1.76 |
19.36 |
19.36 |
| Probe |
0.4 |
22 |
8.8 |
0.88 |
9.68 |
9.68 |
Preparing 96-well PCR plate
- Filled plate using as described below.
- NTC- 12µL master mix, 8µL molecular water
- TC and other reactions- 12µL master mic, 4µL molecular water, 4µL template DNA
- In the table the * denotes reactions using DNA isolated from larvae.
| 1 |
2 |
3 |
4 |
5 |
|
| A |
NTC |
1 |
1 |
1* |
1* |
| B |
NTC |
-1 |
-1 |
10^-1* |
10^-1* |
| C |
NTC |
-2 |
-2 |
10^-2* |
10^-2* |
| D |
NTC |
-3 |
-3 |
10^-3* |
10^-3* |
| E |
TC |
||||
| F |
TC* |
||||
| G |
|||||
| H |
- Centrifuged plate at 2000 RPM for 1 minute.
- Took to qPCR machine to run.
- Edited step 3 from 50 seconds to 20 seconds since we are not running IQ powermix and this time is recommended in the SsoAdvanced manual.
- Parameters for qPCR:
- Incubate at 95°C for 2:30
- Incubate at 95°C for 10 seconds
- Incubate at 60°C for 20 seconds
- Plate read
- Go to line 2 for 39 more times
- Hit run Saved file as 20150918_102630
- Checked on the machine and at around cycle 11 the surge protecter box is beeping. Stayed with the machine for a minute and the beeping is going on and off depending on how high the output gets. The beeping is now just a straight noise and the machines shut down. Asked Sam for assistance after a brief discussion decided that we would go ahead and run my plate again even though it was already in the middle of qPCR and probably wouldn't give reliable results. Since I'm out of SsoAdvanced and only have a little of the IQ powermix left I can't make another set of reactions. I just am interested in seeing if the reactions show amplification with less template and see if there is something wrong with the larvae DNA that we have be testing adult DNA. We should still be able to answer these questions with what we get if we run it again.
- Set up machine and hit run again. Stayed with it for a minute and continued to check on it over the period of the run time.
- Second data file saved as 20150918_110407
- No further issues happened aside from the beeping once in a while when the temperature was going up during qPCR.
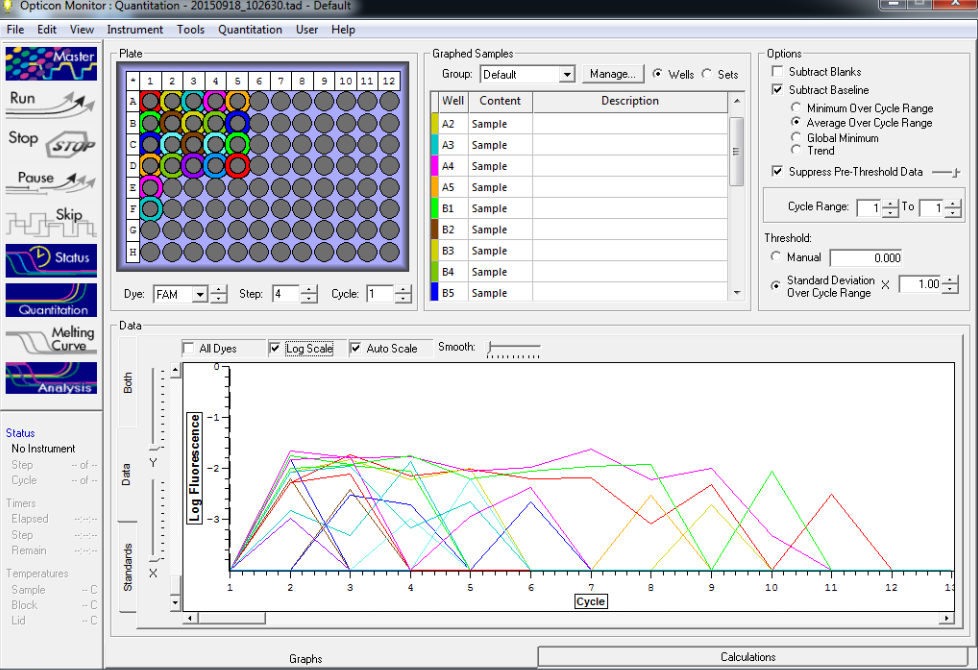
Image above from qPCR before the machine crashed.
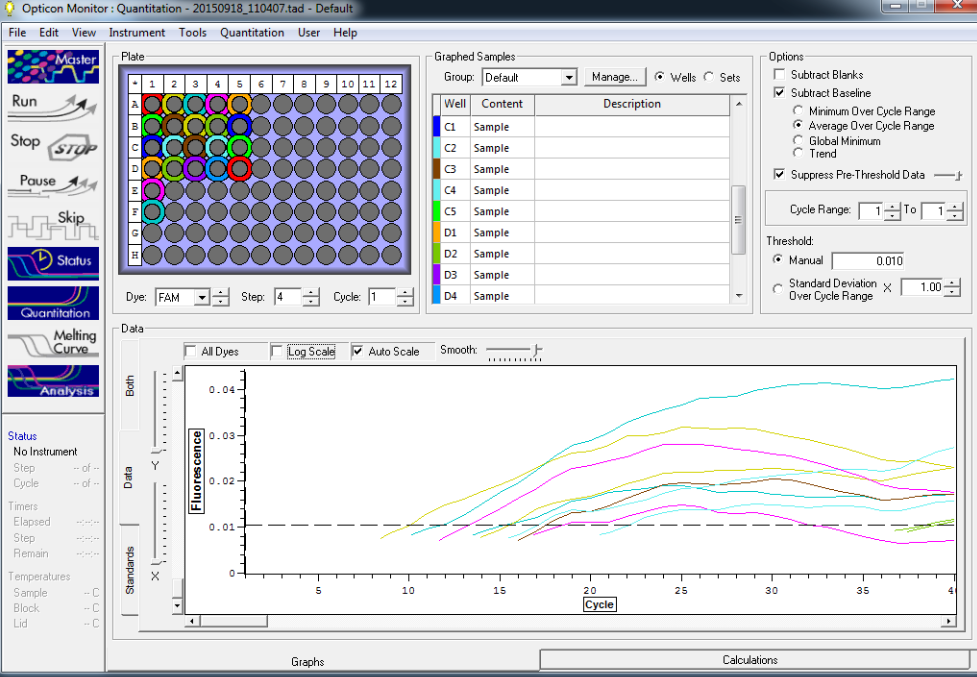
Image above from qPCR after the machine crashed and continued to run the curve anyway.
UWT- Becker LabMcCartha
Redistributing plankton in mock up samples 9/17/15Created by Michelle McCartha
Goal:Re-preserve samples in 95% ethanolEvenly distribute samples after mixing well so that there are 6 even subsamples of a single well mixed batch in triplicate.Start preparing samples to be spiked with geoduck larvae.
MethodsThree complete sets of six plankton replicates representing a single tow were created.To get a go0d representation of a single plankton tow, six sample tows (from 50 ml vials )were mixed together in a beaker. To ensure proper preservation was done, these samples were filtered using 68micron mesh and rinsed back into the beaker with 95% ethanol. Micro algae was left in the solution and we want that too so i poured the remaining liquid into centriguge tubes and centrifuged them for 2 min at 3000RPM. I then pipetted the micro algae out and placed into the beaker with mixed plankton.I discarded the rest of the contents of the tubes. From the beaker, I poured after swirling gently, the plankton into six 50ml tubes and labeled them as plankton rep 1 and what they will be spiked with. I ensured that there was roughly equal amounts of plankton in each sample and topped off with ethanol to 50 ml mark. This was repeated for representative tows 2 and 3.
Future steps:Isolate plankton to the bottom of the tubes transfer to 2ml tubes and spike with geoduck larvae.
UWT-Becker LabHintz, McCartha, Smithhisler09/16/15Plankton tow and splitting of plankton samplesCreated by: Smithhisler McCartha edits in blue
Goals1) Collect more plankton samples to be spiked with larvae and used for qPCR to check for inhibition2) Split plankton among vials
MethodsPlankton tow
- Megan, Michelle, and I drove to the Foss Waterway Seaport and performed 5 plankton tows occurring between 11-11:45am using a 153 micron net.
- The weather was overcast with patches of sun.
- Tows were performed in a zig-zag manner as a combination of vertical and horizontal tows because we were trying to get as much as possible and quantifying was not necessary
- Two samples were kept alive in vials with seawater. Five vials were filled with sample preserved in ~95% ethanol.
Splitting samples and spiking with larvae
- I began by analyzing plankton samples from today at the Thea Foss as well as previous samples from Case Inlet to make sure there are no bivalve larvae.
- Case Inlet samples may have manila clam larvae
- Thea Foss has bivalve larvae, but we predict they are mussels. We will keep these for later testing alongside spiked samples to check our prediction.
- Ultimately, we want to have 18 vials: three replicate mock up samples split 6 ways and treated (spiked) differently to create a type of standard curve- Raw (to be just the plankton sample with no added larvae), sample spiked with 50 geoduck larvae, sample spiked with 25 geoduck larvae, sample spiked with 10 geoduck larvae, sample spiked with 5 geoduck larvae, and sample spiked with a single geoduck larva,
- Split samples into (18) 50mL vials in equal concentrations/levels of plankton
- Used pipette set at 1.8mL to get rough but equal amounts of plankton in each of 18 vials
- Centrifuged down components for 1 minute at 3,500rpm.
- Live samples were mixed in with the preserved samples. Since we want to follow methods as closely as we can to what was done in the field we will need to make sure the samples are preserved correctly otherwise results may differ from expected patterns .
- Also determined that the reps are not representative of any single sample so will mix 6 vials together 3 times so that the reps seemingly come from one sample which then will be spiked with larvae.
- Will filter samples to preserve them in 95% ethanol, mix, and redistribute them among vials 9/17/15.
Future stepsSpike vials with geoduck larvae in the increments of raw, 50, 25, 10, 5, 1. One vial is to be left raw, with just plankton and no larvae added. These will be used for qPCR to determine if inhibition occurs with ‘gunky’ plankton samples in addition to further testing of our geoduck primers.
Roberts Lab-UWSMcCartha, Smithhisler
qPCR using Ssofast supreme supermix and iQ Multiplex powermix with Pg adult and larvae DNA 9-15-15Created by: Smithhisler McCartha edits in blue
GoalsPerform qPCR with adult and larval geoduck DNA using two master mix to determine which mix to use in future qPCR runs.
MethodsSerial dilution
- Michelle labeled 10 2mL vials beginning with 1, then 10-1, then 10-2, and ending with 10-9
- I began by adding 90uL nuclease free water to each vial
- I then added 10uL of DNA from eighteen larvae [age 16 day old] geoduck (vial 5) to vial 1, mixing with pipette. I then finger vortexed the tube, inverted one time, and centrifuged tube for 2-3 seconds.
- I pipetted 10uL of the solution from vial 1 into the 10-1 vial and mixed with the pipette, finger vortexed, inverted once, and centrifuged down components for 2-3 seconds.
- I pipetted 10uL of the solution from the 10-1 vial into the 10-2 vial and mixed with the pipette, finger vortexed, inverted once, and centrifuged down components for 2-3 seconds
- I repeated this procedure through the vials, ending by adding 10uL of 10-8 solution to the 10-9 vial, mixing with the pipette, finger vortexing, inverting once, and centrifuging down components.
Preparing mastermix
- I labeled two tubes for supermixes.
-Ssoadvanced
-iQ Multiplex
- We had to make more primers from stock because there was not enough to have uniform throughout.
- Michelle added 90uL of nuclease free water to two, 2mL vials labeled Pg fwd and Pg rev.
- I added 10uL of each corresponding 100uM concentration stock primer solution to the labeled tube mixing with the pipette. I finger vortexed and centrifuged the 10uM primer solutions.
- Using the calculations in the tables below, Michelle pipetted components for the two sets of master mixes, beginning with the powermix or supermix, then primers (fwd then rev), then probe.
- Standard volumes were obtained from calculations from the procedure manual for each master mix based on desired final concentration of primers and probe for each reaction.
SsoAdvanced Primers FWD/REV: ((10uM)(XuL)=(0.4uM)(20uL))=0.8uL each primer SsoAdvanced Probe: ((10uM)(XuL)=(0.2uM)(20uL))=0.4uL probe
IQ Powermix Primers FWD/REV: ((10uM)(XuL)=(0.3uM)(50uL))=1.5uL each primer
IQ Powermix Probe: ((10uM)(XuL)=(0.2uM)(50uL))=1.0uL probe
SsoAdvanced Supermix
| Master Mix Solutions |
Standard volume (uL) |
Multiply by (# of total reactions) |
New volume (uL) |
*10% errror |
Add error (Final volume to add) (uL) |
| Master mix |
10 |
38 |
380 |
38 |
418 |
| FWD primer |
0.8 |
38 |
30.4 |
3.04 |
33.44 |
| Rev primer |
0.8 |
38 |
30.4 |
3.04 |
33.44 |
| Probe |
0.4 |
38 |
15.2 |
1.52 |
16.72 |
| Template |
4.0 |
||||
| Water |
4.0 |
iQ Powermix
| Master Mix Solutions |
Standard volume (uL) |
Multiply by (# of total reactions) |
New volume (uL) |
*10% errror |
Add error (Final volume to add) (uL) |
| Master mix |
25 |
38 |
950 |
95 |
1045 |
| FWD primer |
1.5 |
38 |
57 |
5.7 |
62.7 |
| Rev primer |
1.5 |
38 |
57 |
5.7 |
62.7 |
| Probe |
1.0 |
38 |
38 |
3.8 |
41.8 |
| Template |
4.0 |
||||
| Water |
17 |
Initially, Michelle designed the plate template with two repetitions of serial dilution of adult geoduck DNA and two repetitions of the serial dilution of 16 day old larval DNA per master mix. Each master mix also was designed with 6 no template controls and 2 template controls. This equaled to 48 reactions per master mix. However, upon calculations for the master mixes after determining this total reaction value per mix, it was discovered by Michelle that all of the iQ powermix would be used up today. To space this out, one rep of serial dilutions of the 16 day old larvae DNA reactions were excluded from the plate template. The value of total reactions per master mix were brought down to 38, totaling on the plate to 76 reactions. We thought this would be an appropriate choice because we could still evaluate the reactions of the larvae with DNA isolated by the modified pK method for both master mixes.
Spoke with Steven to discuss options for how much template to add to reactions, specifically with the IQ mix due to the increased volume. Per the IQ powermix manual, adding between 5 and 10uL of template is suggested to increase precision. Steven suggested adding 4uL. It was suggested that this reduced amount of template may also reduce any inhibition that may occur in the reaction.
Preparing 96-well PCR plateWe got in our optically clear caps from Bio Rad to go with the plates we ordered through Micah and the lids snap tightly so we have no hesitation in using them today.
For reactions will add:
- 29uL of mastermix made for iQ powermix
- 12uL mastermix made for SsoAdvanced supermix
- 4uL of template for both master mixes (unless NTC, this amount will be replaced with water)
- 17uL water to top off reactions using iQ powermix to bring to 50uL volume per reaction
- 4uL water to top off reactions using SsoAdvanced supermix to bring to 20uL volume per reaction
| SsoAdvanced Reactions |
IQ Powermix Reactions |
|||||||||
| 1 |
2 |
3 |
4 |
5 |
6 |
7 |
8 |
9 |
10 |
|
| A |
NTC |
1 |
10^-8 |
10^-6 |
10^-4* |
NTC |
1 |
10^-8 |
10^-6 |
10^-4* |
| B |
NTC |
10^-1 |
10^-9 |
10^-7 |
10^-5* |
NTC |
10^-1 |
10^-9 |
10^-7 |
10^-5* |
| C |
NTC |
10^-2 |
1 |
10^-8 |
10^-6* |
NTC |
10^-2 |
1 |
10^-8 |
10^-6* |
| D |
NTC |
10^-3 |
10^-1 |
10^-9 |
10^-7* |
NTC |
10^-3 |
10^-1 |
10^-9 |
10^-7* |
| E |
NTC |
10^-4 |
10^-2 |
1* |
10^-8* |
NTC |
10^-4 |
10^-2 |
1* |
10^-8* |
| F |
NTC |
10^-5 |
10^-3 |
10^-1* |
10^-9* |
NTC |
10^-5 |
10^-3 |
10^-1* |
10^-9* |
| G |
TC |
10^-6 |
10^-4 |
10^-2* |
TC |
10^-6 |
10^-4 |
10^-2* |
||
| H |
TC* |
10^-7 |
10^-5 |
10^-3* |
TC* |
10^-7 |
10^-5 |
10^-3* |
||
- SsoAdvanced reactions are in columns 1-5
- IQ Powermix reactions are in columns 6-10
- TC used template DNA from an adult geoduck tissue sample digested in DNAzol
- TC* used template DNA from 18 geoduck larvae digested in the modified pK solution (eighteen larvae [age 16 day old] geoduck (vial 5))
- Samples with an * refer to the serial dilution processed today using the same geoduck larvae sample digested in pK that was used in the TC* (eighteen larvae [age 16 day old] geoduck (vial 5))
New Run Parameters:
- Incubate at 95°C for 2:30
- Incubate at 95°C for 10 seconds
- Incubate at 60°C for 50 seconds
- Plate read
- Go to line 2 for 39 more times
Saved file as 20150915_125925Hit runEstimated time 1hour 35minutes. Start time 1:01. End dine 2:30.Emailed file for records.Forgot to fill out Roberts Lab qPCR well template so took a sheet from their binder and will fill out and place in binder upon return to the lab.
Results
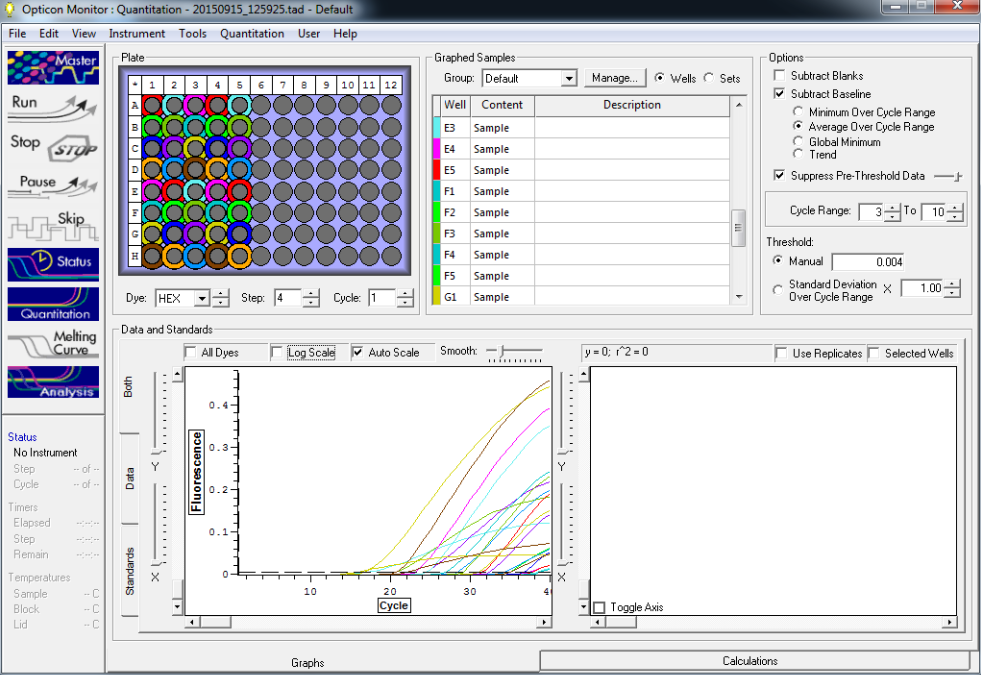
SsoAdvanced chemistry was promising (image above) but seemed to be slightly less sensitive.
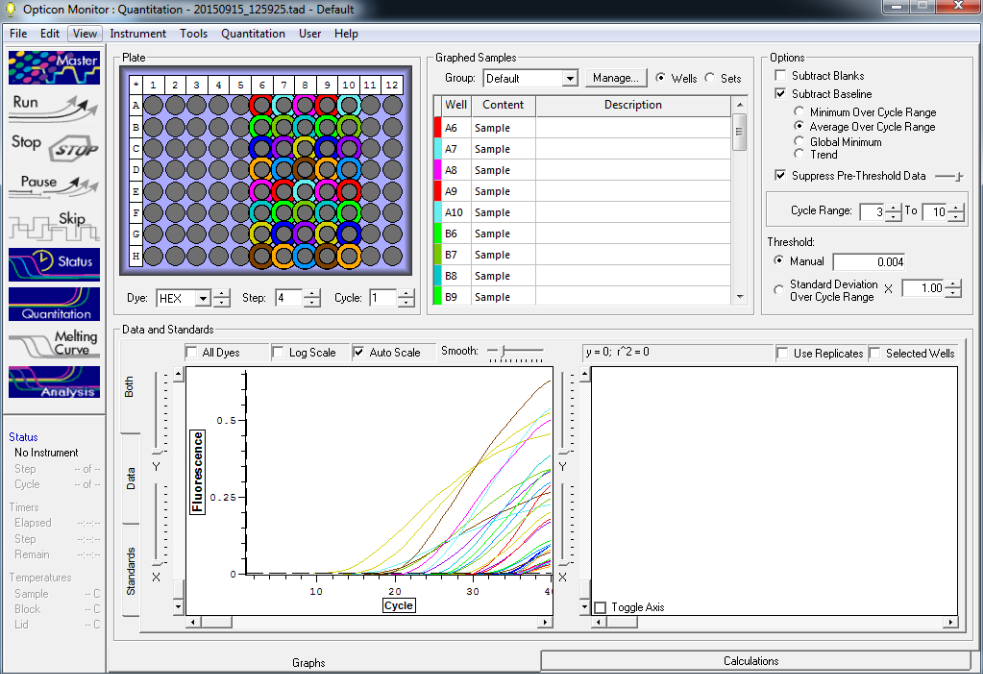
IQ multi-mix powermix test (image above) was more sensitive than the SsoAdvanced system and will be what we will use in the future.
UWT-Becker LabSmithhisler
Testing subsampling methods with a greater number of larvae 09/14/15Created by: Smithhisler
GoalsPerform the modified beaker technique and pipette pump on a sample with 40 larvae and plankton.
Methods
- I cleaned the microscope bench work area with 10% bleach and 2 rinses of nanopure water
- I cleaned the sedgewick rafter and petri dish with a 10% bleach rinse, then 3 rinses of DI water, and a final rinse of nanopure water before drying with a Kimwipe
- Rep 1: I poured a gunky plankton sample into the petri dish and extracted any bivalve larvae. I then added the plankton sample to a clean, not sterile, 50mL vial. I repeated this with another vial of plankton sample. I rinsed the petri dish with ethanol and dried with a Kimwipe.
- I pipetted 40 of a combination of the larger sized bivalve larvae (from tube of miscellaneous larvae being used 09/13/15) and some geoduck larvae from the stock tube into the 50mL vial with the plankton sample.
- performed on the sedgewick rafter
- I filled the vial to the 40mL mark with ~95% ethanol (BS 07/10/15). I then inverted the vial and shook slightly to suspend particles and to represent the handling of our pump samples (have been agitated through travel, etc.)
- I uncapped the subsample 1 vial, and poured all contents into a clean, but not sterile, empty 50mL vial labeled as subsample 2. Then I poured the sample back and forth 4 times and then poured from the subsample 1 vial holding all of the sample to the 20mL mark on the subsample 2 vial. I then rinsed down the sides of the vials and the caps with ~95% ethanol.
- a small drop of sample lost in the process of pouring back and forth
- Using a 5000µL pipette, I began transferring subsample 1 to the petri dish to count and extract larvae.
- Pipetted 7mL or 10.5mL at a time, depending on how cloudy sample was when pipetting
- I left the pipette tip in the sample when not in use.
- After extracting all sample from the vial, I rinsed the interior of the vial once more with ethanol to bring down any components that attached to the sides during pipetting, and used this as an initial rinse for the pipette tip as well.
- I then took off the pipette tip and rinsed the interior with ethanol, catching the runoff in the petri dish.
- I found 1 larvae from the vial and pipette rinse
- I cleaned the petri dish and rafter with 10% bleach, 3 rinses w/DI, and 1 rinse w/nanopure water before drying with a Kimwipe. Vials and caps were rinsed w/DI water, then cleaned with soap and shaken. Then they were rinsed with DI water and shaken to dry.
- Rep 2: I added 10mL of ~95% ethanol to the cleaned subsample 1 vial. Then I added 30 larvae from the miscellaneous tube used previously, and needed to take 10 geoduck larvae from the stock tube (using a fresh pipette!) to get the larvae count in the subsample 1 vial to 40.
- I added ~95% ethanol to bring the volume of vial 1 to 40mL.
Pipette Pump
- I cleaned the petri dish with the 5-step rinsing procedure and the vials and caps with soap, shaken, and rinsed as before. I then rinsed the glass pipette with nanopure water and ethanol (was cleaned with soap last night), and dried the exterior of the glass and attached it to the pipette pump.
Results
| Modified beaker technique using vials |
Original sample |
New sample |
|||
| Rep |
Starting volume (mL) |
Starting number of larvae |
Subsample 1 larvae |
Subsample 2 larvae |
Loss of larvae |
| 1-ethanol + plankton |
40 |
40 |
25 |
10 |
5 |
| 2-ethanol+plankton |
40 |
40 |
22 |
17 |
1 |
| Average larvae |
18.5 |
||||
| St. Deviation |
6.557438524 |
||||
| Average larvae loss |
3 |
| Pipette Pump |
Original sample |
New sample |
|||
| Rep |
Starting volume (mL) |
Starting number of larvae |
Subsample 1 larvae |
Subsample 2 larvae |
Loss of larvae |
| 1-ethanol + plankton |
40 |
40 |
24 |
11 |
5 |
| 2-ethanol+ plankton |
40 |
40 |
33 |
3 |
4 |
| Average larvae |
17.75 |
||||
| St. Deviation |
13.35102992 |
||||
| Average larvae loss |
4.5 |
Future stepsSubsampling methodsSAFS- Roberts LabMcCartha
qPCR with C. gigas and P. generosa template using SsoAdvanced Supermix 9/11/15Created by Michelle McCartha
Goals:
- Make serial dilution of P. generosa
- Suspend geoduck primers and probe
- Re-run C. gigas to see if we get different results from last time.
- Run P. generosa to see if there is anything different in results.
Methods:
Serial Dilution of P. generosa DNA
- Followed serial dilution suggestions found in Instruction Manual, SsoAdvanced™ Universal Probes Supermix on page 9 of guide.
- Collected 10 eppendorf tubes and labeled them 1-10-9
- Labeled them also with Pg for Penopea generosa and the date.
- Added 90µL of water to each tube.
- Started with P. generosa DNA that was isolated in July and pipetted 10µL and placed into tube labeled concentration 1x.
- Mixed by finger vortex and centrifuged down briefly.
- Pipetted 10µL of the 1x solution and placed into the 10-1 tube.
- Finger vortexed and briefly centrifuged down.
- Pipetted out 10µL of the 10-1 solution and placed in tube labeled 10-2
- Finger vortexed and centrifuged down.
- Continued this process until all tubes were filled with different concentrations for making the serial dilution.
- Fwd Primer
- 25.7nmol on the vial
- 25.7x10= 257µL Low TE to add to make 100µM stock solution
- Dilute to 10µM working stock
- C1V1=C2V2
- 100µM (XµL)= 10µM (100µL)
- 10µL of Stock primer solution to add
- 90µL of water to bring it at final volume of 100µL
- Rev Primer
- 27.2nmol on the vial
- 27.2X10= 272µL of Low TE to add to make 100µM stock solution
- Dilute to 10µM working stock
- C1V1=C2V2
- 100µM (XµL)= 10µM (100µL)
- 10µL of Stock primer solution to add
- 90µL of water to bring it at final volume of 100µL
- Probe
- 15.9nmol on the vial
- µm Stock solution
- µM working stock
- C1V1=C2V2
- 100µM (XµL)= 10µM (100µL)
- 10µL of Stock primer solution to add
- 90µL of water to bring it at final volume of 100µL
Making master mix for both species
- Using SsoAdvanced powermix for all reactions
- Making total of 45 reactions PER SPECIES (absolute total 90)
- 27 spiked samples
- 10 serial dilution samples
- 7 no template control
- 1 template control
- Making total of 45 reactions PER SPECIES (absolute total 90)
- Labeled two 2ml eppendorf tubes and labeled them one for each specie
- FAM- C. gigas
- HEX- P. generosa
- Using the volumes listed below, made master mix for each specie by adding powermix, then Fwd/Rev primers, and finishing up with probe.
- Volumes were the same for each specie since using the same powermix.
| Cg/Pg qPCR re-run |
9/11/15 |
|||||
| Master Mix Solutions |
Standard volume (μL) |
Multiply By |
new volume |
|
add pipette error |
Final volume to add (μL) |
| Master mix |
10 |
45 |
450 |
45 |
495 |
495 |
| FWD Primer |
0.8 |
45 |
36 |
3.6 |
39.6 |
39.6 |
| Rev Primer |
0.8 |
45 |
36 |
3.6 |
39.6 |
39.6 |
| Probe |
0.4 |
45 |
18 |
1.8 |
19.8 |
19.8 |
- Using hand friction defrosted all samples that will be run today.
- qPCR will be set up as in 20μL 1X reactions using 12μL master mix and topping off each well with 8μL template (or water in case of NTC)
- Wells were loaded from left to right (1-12) top to bottom (A-H) as shown below.
| 1 |
2 |
3 |
4 |
5 |
6 |
7 |
8 |
9 |
10 |
11 |
12 |
|
| A |
NTC |
1 |
10^-8 |
1/1/15 |
2/3/05 |
3/2/05 |
Pg NTC |
10^-5 |
1/1/05 |
2/3/01 |
3/2/01 |
Blank |
| B |
NTC |
10^-1 |
10^-9 |
1/2/15 |
2/1/15 |
3/3/05 |
Pg NTC |
10^-6 |
1/2/05 |
2/1/05 |
3/3/01 |
Blank |
| C |
NTC |
10^-2 |
1/1/01 |
1/3/15 |
2/2/15 |
BLANK |
Pg TC |
10^-7 |
1/3/05 |
2/2/05 |
3/1/05 |
Blank |
| D |
NTC |
10^-3 |
1/2/01 |
2/1/01 |
2/3/15 |
BLANK |
1 |
10^-8 |
1/1/15 |
2/3/05 |
3/2/05 |
Blank |
| E |
NTC |
10^-4 |
1/3/01 |
2/2/01 |
3/1/01 |
BLANK |
10^-1 |
10^-9 |
1/2/15 |
2/1/15 |
3/3/05 |
Blank |
| F |
NTC |
10^-5 |
1/1/05 |
2/3/01 |
3/2/01 |
Pg NTC |
10^-2 |
1/1/01 |
1/3/15 |
2/2/15 |
3/1/15 |
Blank |
| G |
NTC |
10^-6 |
1/2/05 |
2/1/05 |
3/3/01 |
Pg NTC |
10^-3 |
1/2/01 |
2/1/01 |
3/1/01 |
3/2/15 |
Blank |
| H |
TC |
10^-7 |
1/3/05 |
2/2/05 |
3/1/05 |
Pg NTC |
10^-4 |
1/3/01 |
2/2/01 |
2/3/15 |
3/3/15 |
Blank |
- Spiked samples are written as: sample number/rep number/ number of larvae spiked with. So 3/2/15 would be sample three /rep 2 /15 larvae spiked in the sample.
- NTC- NO template control
- TC- template control
- Pipetted geoduck DNA in Pacific oyster TC well- pipetted all out and re-added master mix and pacific oyster DNA.
- 10g/10h were mixed so reversed.
- Ran out of master mix on pacific oyster wells : Column 7- C, D, and E which would have been 3-1-15, 3-2-15, 3-3-15 respectively.
- Serial dilutions for each specie are labeled 1-10^-9 made with same DNA sample as template control.
- Pg DNA tube- isolated may 12, 2015, small geoduck, isolation method: DNAzol
- Cg DNA tube- 20 18-day old larvae provided by Taylor shellfish, isolation method modified pK solution.
- Checked parameters on qPCR machine. Decided to run using same method as last time:
- Check to make sure the machine is reading for both Hex and FAM
- Incubate at 95°C for 2:30
- Incubate at 95°C for 10 seconds
- Incubate at 60°C for 20 seconds
- Plate read
- Go to line 2 for 39 more times
- Check to make sure the machine is reading for both Hex and FAM
ResultsCg data (Image below) are show no specific amplification of Cg DNA.
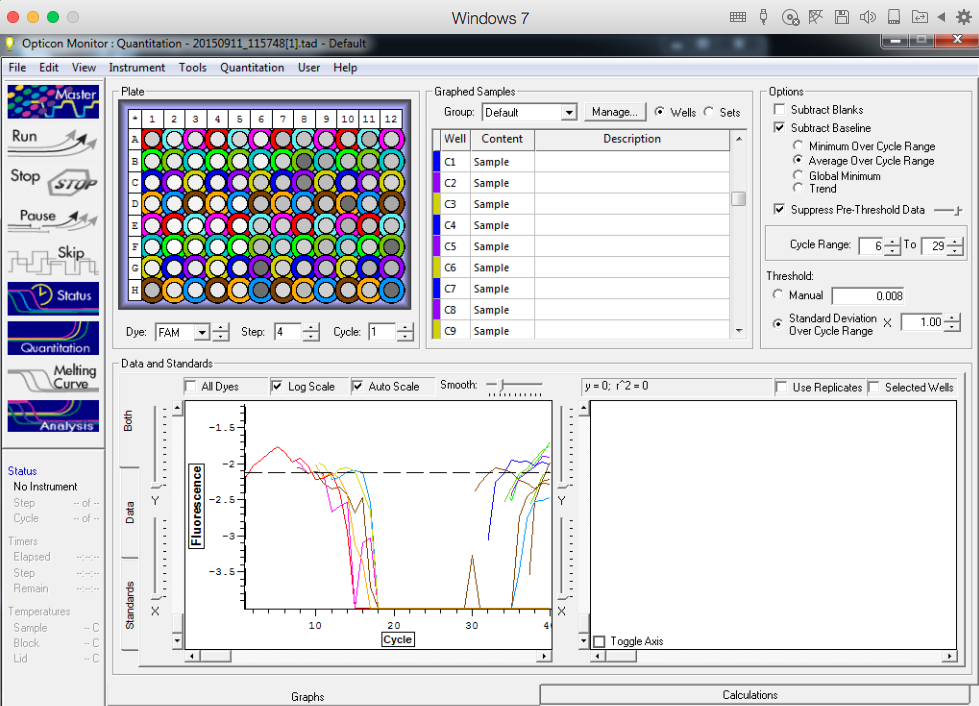
All Pg data (Image below) show amplification indicating qPCR primers and probe for this species worked.
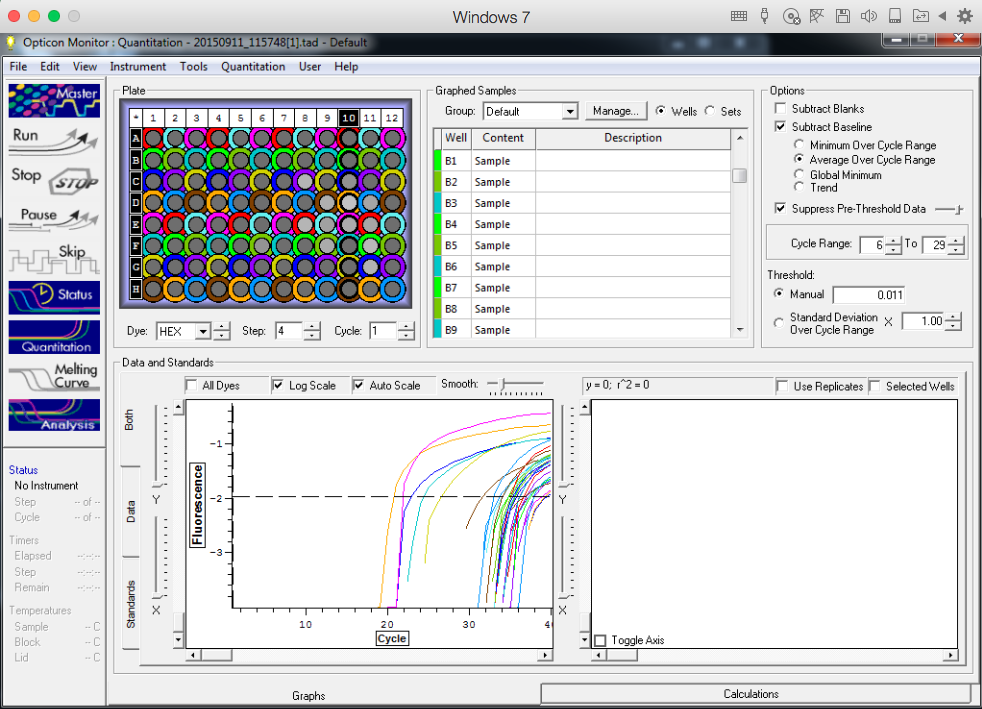
Pg NTC showed amplification as well as our template control group (C-7) (Image below).
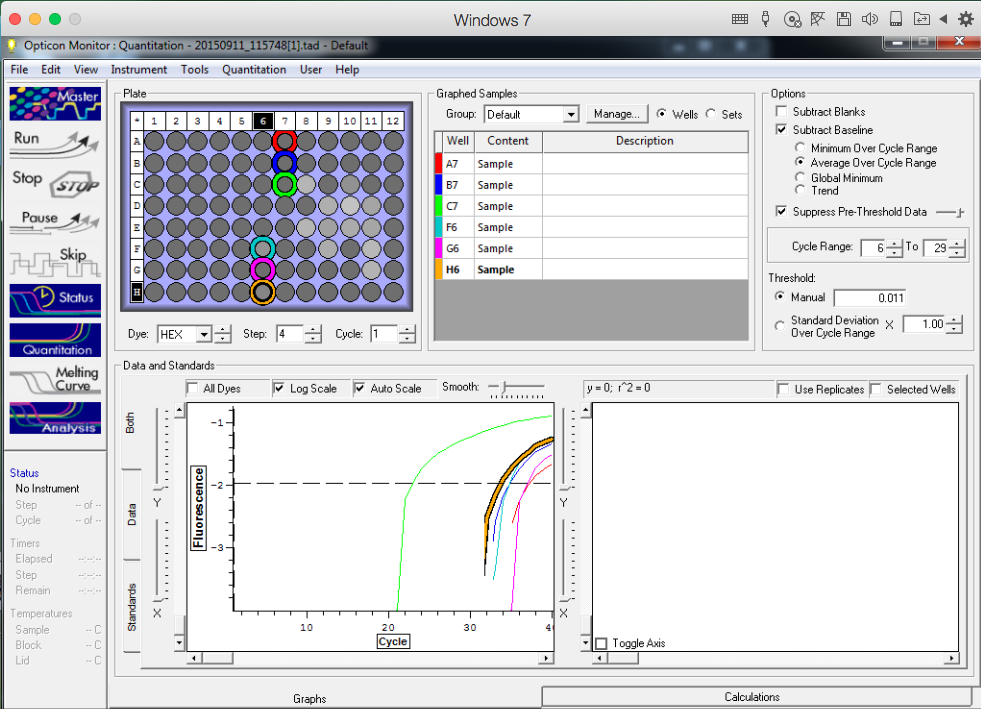
Serial dilutions also showed amplification in somewhat step-wise pattern (Images below).
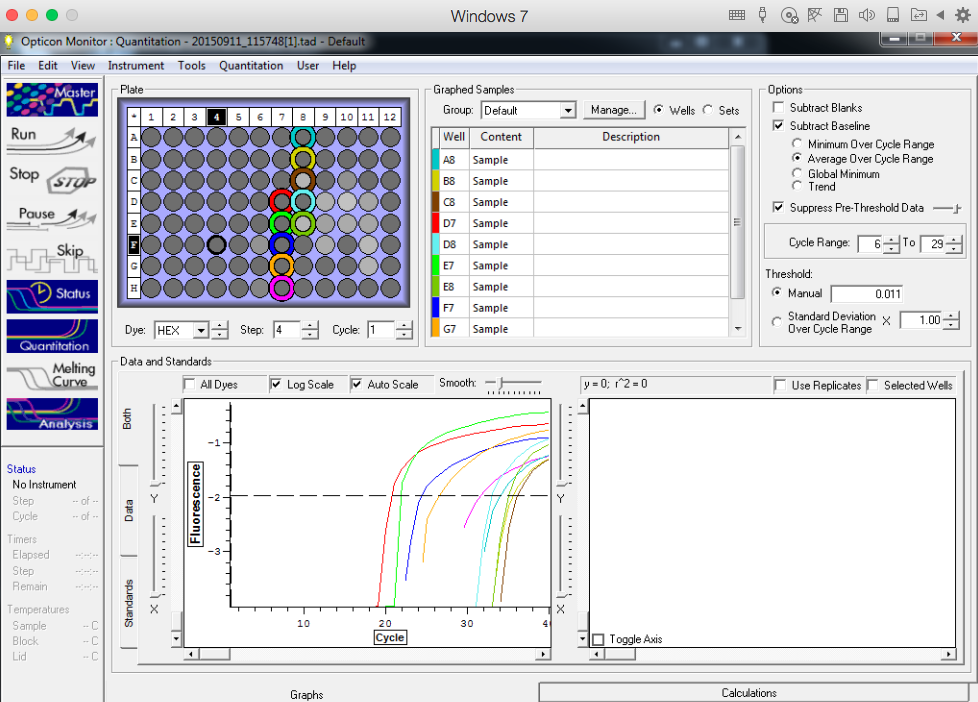
Spiked samples showed amplification of larvae spiked with 1, 5, and 15, individuals in different sets (image below)
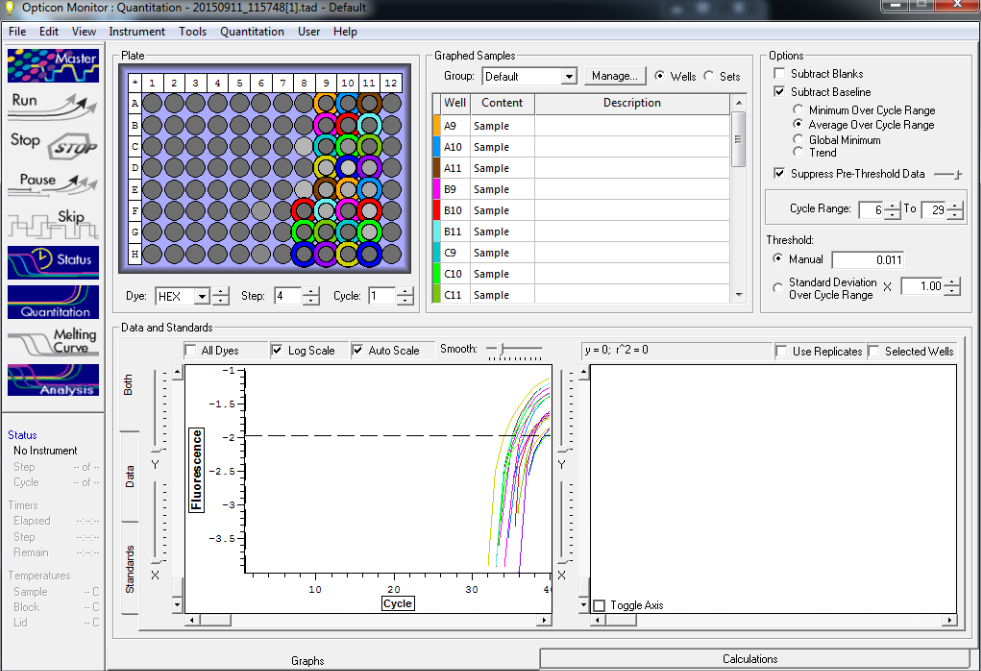
Next steps
- Will test IQ powermix and Sso Advanced supermix using geoduck DNA serial dilutions to see which one may work better for our samples.
- Want to test DNA isolated from adult pacific oyster using DNAzol to see if that could be the reason why we aren't seeing amplification in our samples.
- Could also try decreasing the template volume added to the reactions to reduce inhibition.
Becker Lab
Smithhisler, McCartha
9/8/15Spiking plankton samples with C.gigas larvaeCreated by: Smithhisler
Goals1) Spike plankton subsamples with 20 10-day old Pacific oyster larvae, 20 Pacific geoduck larvae, 20 3-day old Pacific oyster larvae, and 20 manila clam larvae.2) Prepare voucher slides with 1 larva to be used as reference for future identification of samples.
MethodsSpiking plankton sample
- I cleaned the microscope lab bench with a 10% bleach rinse and dry and two rinses of MilliQ water. I cleaned two glass petri dishes following the 4 step rinsing cycle. This cycle begins with a 10% bleach rinse made from DI water and bleach. The petri dish is submerged in the solution and rotated by hand. Then the dish was rinsed in three tubs of DI water labeled Rinse #1, 2, and 3. For the final rinse in the rinse #3 tub, excess DI water is shaken gently off of the petri dish and the dish is rinsed with bottled MilliQ water and dried with Kimwipes.
- I gathered 3 sterile 2mL vials using gloves them and labeling. The labeling procedure is Species-Sample #- Rep #-# of larvae. Today we spiked subsample 8 with 2 reps and 20 larvae each.
- For subsampling, I began by shaking and inverting the plankton sample so particles appeared suspended and rapidly pipetted 200µL at an angle as much as possible from the middle of the tube, of both height and width, into the corresponding vial. I replaced pipette tips between reps.
- To get larvae to be used for spiking, I mixed the tube of 10 day old Pacific oyster larvae (3-6-15) by shaking and inverting. Then, I pipetted out a generous amount of larvae but counted as I added them to the petri dish, approximating my target. Excess larvae were returned to the stock tube by pipette.
- Then, I added larvae individually to each 2mL labeled tube, totaling to 20 larvae per tube.
- I also had to add 95% ethanol periodically to the petri dish as needed because of drying. Excess larvae were pipetted, using a fresh tip, from the petri dish back into the stock tube of larvae. The spiked samples prepared today were left in the ethanol to sit at room temperature.
- Michelle let me know that we do not need subsamples but instead would like to add 20 larvae to the plankton sample tube 8 to be used in the future for microscope identification practice
- I fixed this by pipetting the contents of one of the vials into the sample 8 tube. I filled the empty 2mL vial with 95% ethanol and pipetted out contents, repeating this procedure to rinse the vial and pipette tip.
- I rinsed both petri dishes and dried
- I then began pipetting 18 day old geoduck larvae (3-6-15) into a petri dish using a 100µL pipette, counting approximately 20 as I pipetted into the petri dish
- I then added the larvae and recorded by tally the amount as I added until I added a total of 20 geoduck larvae
- I repeated this process with geoduck, 3 day pacific oyster, and 1 day old manila clam larvae.
- I cleaned a slide with a Kimwipe and pipetted one larva of geoduck onto the slide from the petri dish. I checked under the microscope to make sure the larva was transferred to the slide. As the ethanol dried on the slide, Michelle put 180 glue on a glass cover slide using the end of a pipette tip. Then we added the cover slide to the microscope slide. There were many bubbles and it was extremely difficult to see the larva through the glue, but it was decided to let it dry and try other placing other larvae on a depressed slide. This slide was labeled with white labeling tape and the species, larval age, and today’s date.
- For the other 3 larvae, I used a depressed slide and we changed suspending liquids to
Future stepsThe spiked plankton samples will be used to work with for subsampling methods and microscope identification practice.We will see how the glue dries for the voucher slides and may need to re-do them as needed.
Roberts Lab, UWSMcCartha, Roberts, Smithhisler
09/04/15 qPCR with probes
Created by: Smithhisler with McCartha edits
Goals:1) Perform serial dilution of Cg DNA2) Run qPCR using Cg probes on spiked plankton samples serial dilution
Methods:Mastermix Preparation
- Followed the Bio-Rad protocol for Ssoadvanced Probe Supermix to calculate the volume of primers, template, probes, and nuclease-free water for a 20µL reaction based on the final concentration restrictions
- Primers: need a final concentration in the range of 250-900nM each (we’ll shoot for 400nM)
- C1V1=C2V2
- (10µM)(V1)=(0.4µM)(20µL)
- V1=0.8µL per primer
- C1V1=C2V2
- Fluorogenic probe: final concentration 150-250nM each (we’ll shoot for 200nM)
- C1V1=C2V2
- (10µM)(V1)=(0.2µM)(20µL)
- V1=0.4µL probe
- C1V1=C2V2
- Adding the reaction components so far, we have 10µL supermix + 0.8µL forward primer + 0.8µL reverse primer + 0.4µL probe =12µL
- Leftover volume will be filled with template, at a volume of 8.0µL
- Primers: need a final concentration in the range of 250-900nM each (we’ll shoot for 400nM)
- We had 27 samples, 10 serial dilutions, 7 NTC, 1 TC=45 total reactions
| Master Mix Solutions |
Standard volume (μL) |
Multiply By |
New volume |
* 10% pipette error |
add pipette error |
Final volume to add (μL) |
| Master mix |
10 |
45 |
450 |
45 |
495 |
495 |
| FWD Primer |
0.8 |
45 |
36 |
3.6 |
39.6 |
39.6 |
| Rev Primer |
0.8 |
45 |
36 |
3.6 |
39.6 |
39.6 |
| Probe |
0.4 |
45 |
18 |
1.8 |
19.8 |
19.8 |
Serial Dilution
- I labeled 10 sterile microcentrifuge tubes for the dilution, beginning with tube 1, then 10^-1, 10^-2, and so on up to 10^-9.
- I added 90μL of nuclease free water to each tube.
- I then added 10μL of Cg DNA to tube 1, mixing with pipette. I then finger vortexed the tube, inverted one time, and centrifuged tube for 2-3 seconds.
- I then pipetted out 10μL of the solution in tube 1 into the 10^-1 tube, mixing with pipette. I finger vortexed and centrifuged components.
- Then, following this pattern, I pipetted out 10μL of solution in the 10^-1 tube and pipetted it into the 10^-2 tube, mixing with pipette, finger vortexing, and centrifuging.
- This process was repeated for the remaining tubes, until the final concentration of 10^-9.
Plate outline
| 5 |
6 |
7 |
8 |
9 |
10 |
11 |
12 |
|
| A |
Empty |
Empty |
NTC |
TC |
10^-7 |
1-3-5 |
2-2-5 |
3-1-5 |
| B |
Empty |
Empty |
NTC |
1 |
10^-8 |
1-1-15 |
2-3-5 |
3-2-5 |
| C |
Empty |
Empty |
NTC |
10^-1 |
10^-9 |
1-2-15 |
2-1-15 |
3-3-5 |
| D |
Empty |
Empty |
NTC |
10^-2 |
1-1-1 |
1-3-15 |
2-2-15 |
3-1-15 |
| E |
Empty |
Empty |
NTC |
10^-3 |
1-2-1 |
2-1-1 |
2-3-15 |
3-2-15 |
| F |
Empty |
Empty |
NTC |
10^-4 |
1-3-1 |
2-2-1 |
3-1-1 |
3-3-15 |
| G |
Empty |
Empty |
NTC |
10^-5 |
1-1-5 |
2-1-5 |
3-2-1 |
Empty |
| H |
Empty |
Empty |
Empty |
10^-6 |
1-2-5 |
2-3-1 |
3-3-1 |
Empty |
- I began by pipetting 12μL of master mix into each well.
- Michelle then added 8μL of template to the corresponding well. The only error was at the location column 10 rows G and H where the wells are not consistent with the plate pattern because 2-3-1 was pipetted in row H instead of G. This is shown in the plate outline above.
- When finished and ready to centrifuge, problems with the lids sealing to the plate caused us to ask Steven for advice on centrifuging. He recommended to pipette each well into another plate that will provide a good cap seal. We used the cut plate from 08/28/15 and replaced lids if bent or contaminated in the transfer process. It appeared that because we were unable to centrifuge the original plate before transferring solutions that the amount transferred was less than 20.0μL.
- The plates from the Roberts Lab are white USA Scientific Inc. 96 wells
Running qPCR
- Steven helped us set up the computer connected to the Opticon 2 machine and chose the computer options of FAM for dye and white for plate color.
- Steven created a new cycle program named Taqmanprobe-based with the parameters below
- These parameters were from the previous cycle run with Sam with melting curves, however exclude the final step of creating a melting curve. These parameters were also cross-referenced with the SsofastAdvanced Universal Probed Supermix Instructions Manual and were found to fit in the thermal cycling protocol.
1) Incubate at 95°C for 2:30
2) Incubate at 95°C for 10 seconds
3) Incubate at 60°C for 20 seconds
4) Plate read
5) Go to line 2 for 39 more times
- The cycle began around 1:20pm and Brenda filled out the plate sheet and added it to the binder in the qPCR room.
Amplification was not seen in todays reactions. Could we have calculated the concentration for the master mix wrong, or possibly the method for the machine, or is the super mix SsoAdvanced not a good fit for this (however, since it's pretty universal there should really be no problem with the super mix right?).
File saved as 20150904_132119.tad.
Plates 5,6,7,8,9,10,11,12 matched up with machine rows 3,4,5,6,7,8,9,10.
So where 5 and 6 were empty, here 1,2,3,4 and 11,12 were empty.
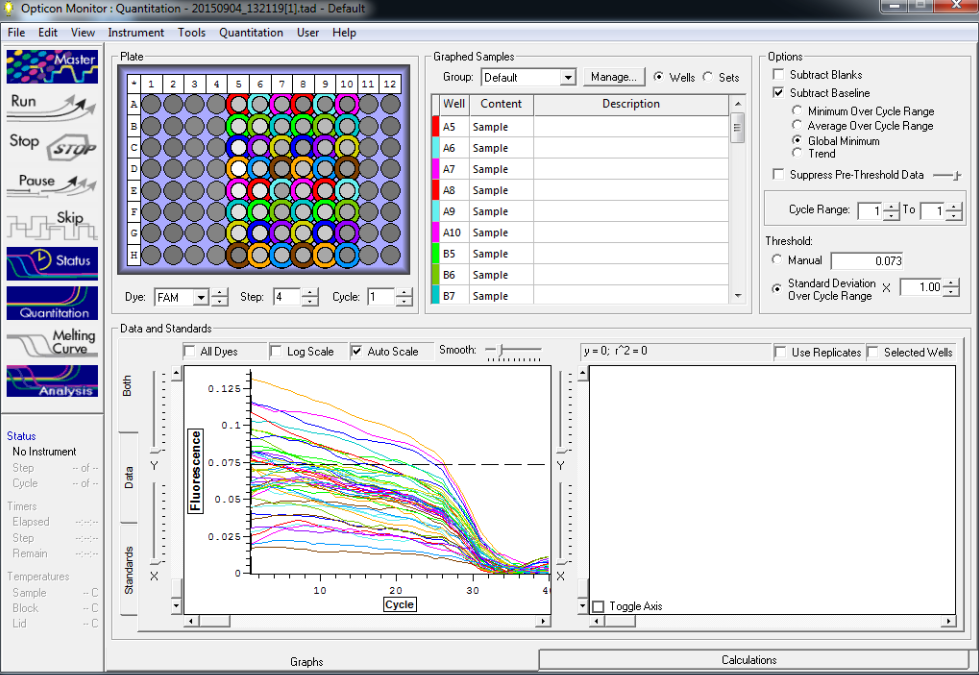
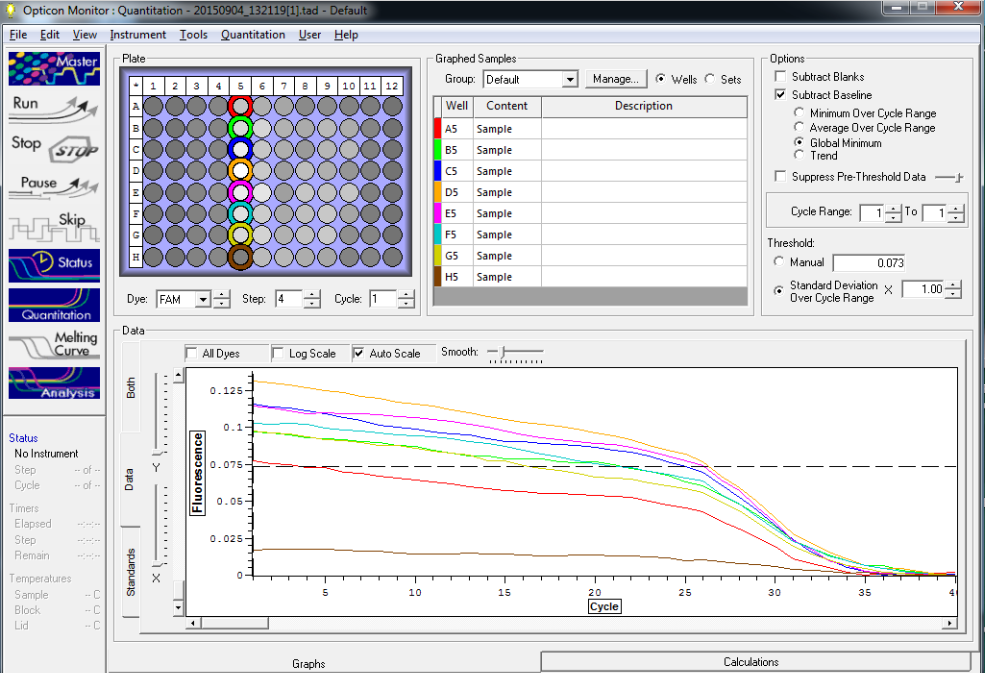
All data from qPCR preformed today (Top image). No amplification present in any wells from Serial dilution series NTC groups TC or spiked samples. Note that samples spiked with 5 and 15 larvae were the sample samples used in intercalating PCR performed 8/28/15.
No template controls were in the first 7 wells (Bottom image).
Future steps:
- Try this method again and see if we can't get amplification using the C. gigas probe and primers- I think the issue has more to do with the machine protocol or the concentration of the master mix. I will re-check the calculations to make sure those are correct then talk with Steven and Sam about different protocols to use with the machine when running qPCR in the future.
- Suspend geoduck primers when they get in and do a serial dilution with the P. generosa DNA from adult specimen as was done with C. gigas today.
- Work on optimizing DNA isolation and sub sampling protocols for pump samples.
Becker Lab
Smithhisler, McCartha
Making pK solution 09/03/15
Created by: Smithhisler and McCartha
Goals
1) Make modified pK solution
2) Spike samples with Manila clam larvae
3) Attempt density gradient method with sugar
Methods
Making pK solution
- I began by gathering all equipment to be used for making modified pK solution. This included a 50mL Erlenmeyer flask, a 100mL graduated cylinder, KCl and Tween 20 (little brown bottle) from the chemical storage area in the chemistry preparation room, the 100mM Tris Base solution, and three 15mL centrifuge tubes.
- We had a 100mM Tris base solution already prepared, but the SOP calls for 10mM concentration.
- C1xV1=C2xV2
- 100mMxV1=10mMx40mL (final volume of total solution needs to be 40mL)
- V1=4mL of 100mM
- Originally looking at the SOP that calls for solid Tris base in 20mL of MilliQ water to create a 10mM solution, we believed that 20mL should be the final volume in the equation and we require 2mL of the 100mM for a 10mM solution. However, after reviewing the full SOP and realizing the final volume will be 40mL rather than the 20mL 10mM Tris Base that was initially added at the start of the protocol, the equation was altered from McCartha 09-02-15 and 4mL of 100mM was used for dilution.
- To dilute, we first rinsed a 50mL Erlenmeyer flask with ultra pure water, then added around 10-15mL of ultra pure water to the Erlenmeyer flask. Michelle then pipetted 4mL of 100mM tris base solution using a 5mL pipette and added it to the flask, making sure the solution went into the water.
- To calculate the amount of KCl required to make 50mM solution in 40mL final volume, we used the molar mass to determine grams of KCl to add.
- Molar mass (g/mol) x Desired molarity (mol/L) x Final volume (L)= mass (g)
- 74.5513g/mol x 0.05M x 40.0mL=0.298g of KCl
- We measured out of 0.298g KCl (actual amount: 0.297g) in a weigh boat. Then, we added the KCl to the Erlenmeyer flask with Tris base and water by pinching and folding the weight boat (almost as if lateral sides when held are touching together) and scooping the KCl into the flask. We also tapped the side of the boat with the scupula to shake down any material that is attached to the sides of the boat, holding it tightly folded. To get any further residual salt, I gently and lightly rinsed the weight boat with nano pure water and allowed it to run into the flask, making sure to keep in mind that the pK solution still needed additional material added to it. The solution in the flask was swirled to dissolve the KCl.
- We then pipetted up 20µL of Tween 20 slowly, trying to avoid bubbles in the pipette tip. The 20µL was added to the Erlenmeyer flask, mixing with the pipette in different locations in the pK solution to mix thoroughly but still trying to avoid bubbles.
- When adding the pK, we had to add 1mL at a time using a 1000uL pipette. This was because the vials of pK were only 1mL and also that any larger pipette tip would not fit into the vial. We added two pipettes of 1mL each, totaling 2mL of pK added to the flask. One of the vials had excess pK that was saved for use later, however this supports the pipetting procedure because volumes in the vials cannot be assumed and vary.
- The contents in the flask were swirled, and carefully poured into a 100mL graduated cylinder. The erlenmeyer flask was rinsed with MilliQ water that was then added to the Erlenmeyer flask. The volume of the solution in the graduate cylinder was raised to the 40mL mark by adding MilliQ water. To mix the contents, the 40mL solution was re-added to the Erlenmeyer flask after the flask was rinsed twice with MilliQ water, not including the initial rinse that was added to the graduated cylinder. The solution was swirled again in the flask and then dispensed into three 15mL centrifuge tubes, filling fairly close to the top (around the 14 mark). The third and final tube was not full. The three tubes were placed in the freezer and will be thawed individually when used in the future (pK solution should be limited on amount of thawing cycles).
Spiking samples
- Using Kimwipes, Michelle sprayed down microscope bench with 10% bleach and wiped dry. Then she sprayed the bench with ultra pure water and wiped dry. She repeated the spraying and drying procedure with water once more, as we do not want bleach into contact with samples. We then removed the cloth cover on the microscope, making sure to leave foil on the top camera attachment.
- We then set up the rinsing procedure to be used for cleaning petri dishes by using 4 labeled tubs: 10% bleach wash, Rinse #1, Rinse #2, Rinse #3. Rinse buckets were rinsed and filled with DI water. The 10% bleach was prepared in the tub by adding 50mL of bleach and filling the tub with sink water to the 500mL mark.
- To use this set up, I rinsed a glass petri dish in each tub, starting with bleach and then the rinses in numerical order. After rinsing the petri dish in each tub, I rinsed the dish with MilliQ water over the rinse #3 tub and dried using Kimwipe.
- Michelle and I decided that for rinsing petri dishes when working with samples, after 10 samples of one species, get new rinse solutions and water. If using a new sample or changing species, also get new rinsing materials.
- For working with samples and spiking, it is easiest to bring pipette carousel to microscope bench.
- I began by gathering sterile 2mL vials using gloves them and labeling. The labeling procedure is Species-Sample #- Rep #-# of larvae. For example, I began todays labeling, as we were spiking with manila clam larvae, as Rp 1-1-1. The next tube would be labeled Rp 1-2-1, for rep 2 from sample 1. There were 3 reps per sample, and I added 1 larvae to each. This was performed for 1-5 of the plankton samples.
- To spike with larvae, I began by shaking and inverting the plankton sample so particles appeared suspended and rapidly pipetted 200µL from the middle of the tube, of both height and width, into the corresponding vial. I replaced pipette tips between reps.
pipetted at an angle without fully submerging the pipette tip. It was difficult to see how many larvae were being uptake, so to reduce waste of larvae I counted approximately how many larvae I added to the petri dish and stopped when I reached near the desired amount. Then I returned any extra larvae from the pipette to the tube. - To get larvae to be used for spiking, I mixed the tube of larvae by shaking and inverting, and I pipetted one larvae into each rep tube, using a new pipette tip every time. I also had to add 95% ethanol periodically to the petri dish as needed because of drying. Excess larvae were pipetted, using a fresh tip, from the petri dish back into the stock tube of larvae. The spiked samples prepared today were left in the ethanol to sit at room temperature.
Sorting by Density Gradient
- Using methods from Perez et al. 2009 we will attempt to sorter plankton samples based on the difference in densities that phytoplankton and other crustaceans have in relation to the higher dense bivalve larvae.
- Found a good website that states different densities of marine inverts and such: http://www.fao.org/docrep/007/y5720e/y5720e0a.htm
- Will be using testing Lyle’s Golden Syrup for the method which is a scane sugar syrup.
- Attempted to pipette out a ml of syrup and dispense into a 2ml pipette but the syrup was too viscous.
- Attempted to use a 30ml syringe since it has a wider opening but still count suck much out reliably.
- Warmed a scoop of syrup in a glass pyrex bowl and microwaved for 10 sec. This loosened up the syrup and made pipetting easier. Pipetted 1 ml into 6 different eppendorf tubes for later use.
- Pulled a Fidalgo Bay trial sample from earlier in the project. This sample had phytoplankton in it that was isolated in the bottom. Since I wanted all the plankton, I pipetted straight from the bottom of the tube with out mixing the sample I took 2 ml and dispensed one mil into 2 different 2ml eppendorf tubes.
- According to the methods from Perez et al. 2009, they poured the plankton sample slowly onto the syrup so I followed this and tried to centrifuge it down in a micro centrifuge for 2 min.
- The sample didn’t budge. Tried to pour the syrup into the sample instead and centrifuge it down but still saw no gradient.
- In the paper it states that they altered the density of the syrup to be lower than the density of the larvae they were after. Spent some time going over methods of changing density of syrup.
- Best idea is that since the units for density is g/cm3 (mass over volume)density is a concentration and we can calculate the necessary volume of liquid to dilute the density of the syrup as needed using the C1V1 approach.
- Will need to researchahis further.
Future Steps:
- Spiked samples today will later be removed of ethanol supernatant and pellets dried overnight in the hood. We will add pK solution to them and place them on the heat block. Then these samples will be run with qPCR to test the primers and begin the process of creating standard curves.
- Continue working with the density gradient method to see if it will be useful in cleaning up samples for DNA isolation.
Becker Lab McCartha
Continuing DNA isolation from mock subsamples spiked with geoduck and pac oyster larvae 9-2-15Created by: Michelle McCartha
Goal:1) Work on prep for making more modified pK solution 2) Continue DNA isolation of spiked subsamples by adding pk solution and setting to cook overnight.
Methods:Making modified pK solution
- Started setting up for titration of Tris Base by gathering supplies for titration.
- After re-reading SOP and contacting Megan about how to acuratily measure the solution (which glassware they used, understood that there was already a 100mM Tris Base stock made and ready to dilute to 10mM.
- Put gathered titration equipment away and continued with making solution.
- Gathered chems TWEEN20 and KCl from UWT lab supply.
- To dilute 100mM Tris Base to 10mM (20ml needed to make 40ml pK solution):
- (C1)(V1)=(C2)(V2)
- (100mM)(X)=(10mM)(20ml)
- 2ml stock solution needed to make 10mM Tris Base from 100mM stock
- Poured a little ultra pure water into graduated cylinder that was rinsed with ultra pure water and added 2ml 100mM stock Tris Base solution into it.
- Added ultra pure water until at 20ml mark.
- Poured into 50ml erlenmyer flask that was rinsed with ultra pure water.
- Added .298g of KCl to mixture.
- Added 20 microliters TWEEN 20. This was difficult and I had to play around with it a little since it was super viscous. Ended up having to switch pipettes and use on of the labs that had a tip with a wider opening which seemed to help reduce air bubbles interfering with suction of pipette.
- swirled to mix and poured into graduated cylinder again.
- Filled graduated cylinder to 40ml mark and realized there was a lot of bubbles in mix. tried to get a clearer reading but couldn't get rid of bubbles.
- Realized that I never added the pK chemical to the mix so wasted and started over.
- Pulled out pK solution from freezer.
- Realized that there was only a little over 2ml of pK in freezer to work (we used this with the DNAzol protocol as well with so decided to continue prep for working with solution but will actually make it with Brenda on 9-3-15.
- Emailed Micah that we need more pK solution.
- Will use modified pK solution Megan made in 8/2014 and replenish her stock when we can make more pK solution.
- Pulled samples that were set for overnight drying from fume hood in Becker lab.
- Checked and all samples were dry.
- Using hand friction, defrosted pk solution and once in a while placed vials in ice bath to keep chilled.
- When solutions were defrosted, pipetted 0.500ml pk solution into each sample switching out pipette tip at each transfer.
- When all samples were in solution, finger vortexted them to suspend the dried sample.
- Set up heat block so the temp was at 56C.
- Placed thermometer in heat block and it read 51C, turned up setting to 59 and then the thermometer read 56C.
- Placed heat block with samples in it on shaker platform and set for continuous shaking.
- Left for overnight digestion.
Becker LabMcCartha
Subsampling and starting pK isolation for geoduck larvae qPCR test 9-1-15Created by: Michelle McCartha
Goal:1) To subsample mock pump samples taken in the Thea Foss Waterway and spike them with sets of 1, 5, and 15, larvae in triplicate for pump samples 1, 2, and 3.2) To subsample mock pump samples taken in the Thea Foss Waterway and spike them with a single larvae in triplicate for pump samples 1, 2, and 3.
Methods:Set up clean area around microscope by using 10% bleach solution to wipe up desk area and rinse with ultra pure water. Cleaned 2 petri dishes using 10% bleach solution and rinsed them three times using ultra pure water and finally drying them with kim wipe. Labeled 9 2ml vials for pacific oyster samples that will be spiked with a single larvae. Pipetted 0.2ml of each sample in respective vial so that there were three subsamples for each mock sample. Pippetted out pacific oyster larvae from 8 day old larvae provided by Taylor shellfish and dispensed onto clean petri dish. Pipetted a single oyster for each subsample and closed the lid so that no multiple larvae were placed in a vial. Set samples aside for later drying.Labeled vials for geoduck larvae spiking so that there were a total of 27 samples (3 mock pump samples with three subsamples, each to be spiked with either 1, 5, or 15 larvae respectively.Pipetted 0.200ml of each mock pump sample into respective vials.Pipetted out larvae using 16 day old geoduck larvae provided by Taylor shellfish and dispensed onto petri dish. Counted and pipetted larvae into respective tubes so that each tube had the quantity of larvae that it was supposed to have. For each transfer I used a clean pipette tip to avoid any cross contamination even if it was the same specie larvae.Took all vials (geoduck and pacific oyster) to the centrifuge and centrifuged for 2 minutes at 10000G to settle all larvae and plankton in sample. Pipetted off supernatant to dry pellet as much as possible. Set in fume hood to dry overnight.
UWS-Roberts Lab
McCartha, Roberts, Smithhisler, White Cg intercalating qPCE in Seattle 08-28-15Created by: Smithhisler
Goals:Finish digesting DNA in pK solution to take up to Roberts LabPrepare and run qPCR using nonsequence-specific intercalating dyes on the plankton samples spiked with Pacific Oyster larvae.Design and order geoduck primers and probe.Locate DNA sequence for primers and probe used in Sanchez et al. 2014Weekly meeting with Steven and Sam.
Methods:Complete digesting subsamples in pK solutionCame to the lab and finger vortexed samples that have been sitting in pK solution overnight. Turned heat plate up to 95C. Thermometer reading only 90C after a while so turned up plate to 98C. Thermometer reading 95C now. Left samples at 95 C for an hour. Upon returning turned off instrument and placed samples in rack for transport to Roberts Lab.
Suspending primers To determine how much low TE buffer to add to stock primer tube, we multiplied the nanomols of stock by 10 and added that amount in microliters.
- CG/G/ANG16S_R-26.8nmol stock x 10=268.µL of low TE
- CG/G/ANG16S_F-27.8nmol stockx 10=278.µL of low TE
Tubes were agitated after addition of low TE buffer by finger vortexing.
Preparing aliquots of 10µ
M concentration
C1V1=C2V2(100µM)(x)=(10µM)(100µL)x=10µL of each primer 100µL aliquot-10µL primer=90µL of nuclease free water
- Began by adding 90µL nuclease free water to 2 clean, labeled micro centrifuge tubes (1 tube labeled for forward, 1 tube labeled for reverse)
- Then added 10µL of primer to the correspondingly labeled tube (only 1 primer per tube, either forward or reverse) and mixed using pipette
Preparing Intercalating Dye qPCRGather equipment:
- white plates
- optically clear lids
- Ssofast green Master Mix
It was decided that we would perform a total of 20 reactions (see below for alteration to a final total of 24 reactions).This was done by using each rep from each subsample prepared by McCartha 08-26-15 as well as a no template control with nuclease free water and a template control with adult Pacific Oyster DNA. We cut the plate after row 4 because we only were using 3 rows for reactions.
To prepare Mastermix, we followed the table conversions below as given to us from the Robert’s lab for Ssofast procedures for 20 reactions. Michelle first added 240µL of Ssofast MM. This had to be split into two pipetting procedures because we used the last of one aliquot and required pipetting from another aliquot. The first pipette had a volume of 220µL and the second had 20µL to total the desired volume of 240µL. Brenda then added 12µL of each primer to the master mix.
| Reagent |
Volume (µL) |
Reaction |
Error |
Total Volume (µL) |
| Ssofast green MM |
10 |
x20 |
x1.2 |
240 |
| FWD primer |
0.5 |
x20 |
x1.2 |
12 |
| REV primer |
0.5 |
x20 |
x1.2 |
12 |
After this step, we talked to Steven and were recommended to do more NTC reactions, so we added enough Ssofast and each primer for 4 more reactions to total to 5 NTC reactions.
| More NTC reagent |
Volume (µL) |
Reaction |
Error |
New volume to add (µL) |
| Ssofast green MM |
10 |
x4 |
x1.2 |
48 |
| FWD primer |
0.5 |
x4 |
x1.2 |
2.4 |
| REV primer |
0.5 |
x4 |
x1.2 |
2.4 |
We then added 11 µL of the prepared mastermix to each well. We added 9µL of nuclease free water to the NTC wells, 9µL of adult Cg DNA to the TC, and 9µL of each subsample rep to the corresponding well as outlined below (tubes and wells have the same labeling format). After all additions, the lids were pushed down until they clicked on each tube and were triple checked to be tightly closed. We then centrifuged the entire plate for 1 minute at 2000rpm. The plate was then taken to the qPCR machine.
Plate outline:
| 1 |
2 |
3 |
4 |
|
| A |
NTC |
1-3-5 |
1-2-15 |
Empty |
| B |
NTC |
2-1-5 |
1-3-15 |
Empty |
| C |
NTC |
2-2-5 |
2-1-15 |
Empty |
| D |
NTC |
2-3-5 |
2-2-15 |
Empty |
| E |
NTC |
3-1-5 |
2-3-15 |
Empty |
| F |
TC |
3-2-5 |
3-1-15 |
Empty |
| G |
1-1-5 |
3-3-5 |
3-2-15 |
Empty |
| H |
1-2-5 |
1-1-15 |
3-3-15 |
Empty |
Performing qPCRqPCR cycle:
1) Incubate at 95 for 2:30
2) Incubate at 95 for 10 seconds
3) Incubate at 60 for 20 seconds
4) Plate read
5) Go to line 2 for 39 more times
6) Melting curve from 65-95C. Read at every 0.5 degrees and hold 3 seconds
END
Cycle began running at 12:12pm, saved as a file 20150828_121222.tad. We filled out the plate outline paper sheet and gave to Sam to put into the qPCR binder.
After the cycle had finished, Sam showed us how to analyze the graphs on the computer program. Results showed that our template control had large amount of fluorescence, the no template controls did not show amplification (well 1-A had a very small bump-also the one we had issues pipetting due to a lack of tight fit on the tip used), and our samples had a varying range of DNA in them but has a similarly shaped and located curve.Sam mentioned that it was odd that the template control had a large amplification of fluorescence when compared to the samples, however Steven said we can trouble shoot when we have probes by performing serial dilution to compare.
Screen shot of qPCR results, with the largest amplification being our adult template control
Melting curve
Meeting with Steven and SamBrenda posted the 18SrRNA sequence from Bonnie’s paper into IDT’s Primer Quest website and the option clicked for choose your design was “qPCR 2 primers+probe” (the middle box on the bottom left).
Sequence:
CTTAGATGTTCGGGGCCGCACACGCGCTACACTGAATGCATCAGCGTGCGTCTACTCTTGCCCGAGAGGGCTGGGAAACCCGTTGAACCGCATTCGTGCTAGGGATTGGGGCTTGTAATTCTTCCCCATGAACGAGGAATTCCCAGTAAGCACGAGTCATCAGCTCGTGTTGATTACGTCCCTGCCCTTTGTACACACCGCCCGTCGCTACTACCGATCGTTCCAGTTAATGAGCGCCTCGGATTGGTCCCGTAAGCGGATTCGCGTCTGCTCTCTGGCGTGCCGAGCAA
Results:Amplicon Length: 103
| Start |
Stop |
Length |
Tm |
GC% |
|
|---|---|---|---|---|---|
| ForwardCCCAGTAAGCACGAGTCATC (Sense) |
142 |
162 |
20 |
62 |
55 |
| ProbeAGCTCGTGTTGATTACGTCCCTGC (Sense) |
162 |
186 |
24 |
68 |
54 |
| ReverseATCCGAGGCGCTCATTAAC (AntiSense) |
226 |
245 |
19 |
62 |
52.6 |
Pacific Oyster DNA sequence of 16s rRNA geneIn NCBI typed in accession number from Sanchez et al 2014 paper # JF808180Search came up with Accession information below:
Crassostrea gigas 16S ribosomal RNA gene, partial sequence; mitochondrial
GenBank: JF808180.1
GenBank Graphics PopSet
>gi|334085882|gb|JF808180.1| Crassostrea gigas 16S ribosomal RNA gene, partial sequence; mitochondrial GAAGATAAAGACTTTTAGCAATACCTGCCCAGTGCGAAATATTACTGTAAACGGCCGCCCTAGCGTGAGG GTGCTAAGGTAGCGAAATTCCTTGCCTTTTGATTGTGGGCCTGCATGAATGGTTTAACGAGGGTTTGACT GTCTCTAAATTTTTTATTGAAATTGTACTGAAGGTGAAGATACCTTCATTTAAAAGTTAGACAAAAAGAC CCCGTGCAACTTTGAAAATTAACTTTATTCAGGAGTAAAAGATTTTTAGGTGGGGCGCCTAGAAAGCAAG TCTAACCTTTCTGAATAACTAACTCTTTCCGGATTTGACCCGATTATATTCGATCATAGGAGAAGTTACG CCGGGGATAACAGGCTAATCCTTTAGTAGAGTTCGTATTGGCTAAAGGGATTGGCACCTCGATGTTGAAT CAGGGATAATAGCTTCAAGGCGTAGAGGCTTTGAAAGTAGGTCTGTTCGACCTTTAATACCCTACGT
Forward primer
CGIG/ANG16S_F - GGGCGCCTAGAAAGCAAGT
Reverse PrimerCGIG/ANG16S_R - ATCGGGTCAAATCCGGAAAG
Probe (5' Mod 6-FAM, 3' Mod Black Hole Quencher 1; 100nmoles)
Order from IDT PrimeTime Probes : http://www.idtdna.com/order/PrimeTimeProbes.aspx
CGIG/ANG16S_P - AACCTTTCTGAATAACTAAC
UWT- Becker LabMcCartha
Add pK solution to subsamples 8-27-15Created by: Michelle McCartha
Goal:1)Add pK solution to spikes subsamples from mock pump samples.
Methods:Digesting samples
- Took the samples from the fume hood where they were set out overnight to dry and placed on counter.
- Took pK solution that Megan had made and defrosted using hand friction and cooling occasionally in an ice bath.
- Added 500µL of pK solution to each sample and finger vortexed multiple times to suspend the sample.
- Placed samples on heat block set to 56C.
- Thermometer on block was reading 51 C so turned up to 60C.
- Thermometer was reading at 56C now so no longer moved it.
- Before leaving lab for the day- finger vortexed all samples once more to mix again.
- Left samples in heat block for overnight digestion.
UWT-Becker LabMcCartha Pumping plankton samples to test DNA extraction methods 8-26-15Created by: Michelle McCartha
Goals:
- Mimicking pumping methods done in the field, pump samples to test DNA extraction methods which could potentially be used with field samples.
- Sub sample mock-up pump samples.
- Spike sub-samples with hatchery pacific oyster larvae and start DNA isolation process.
Methods:Pumping mock-up samples
- Mock-up samples were taken from the Thea Foss Waterway at the Foss seaport public dock in Tacoma, Washington at 11:00am.
- Pump samples were taken using a modified pump, which typically pumps approx. 100gal of water in under 5 minutes.
- To mimic field pumping, where we only pumped 10gal of water, I tested how much time passed to fill a 10gal bucket. This time was approx. 30 seconds.
- We did not have the same size sieves (500 and 75 micron openings) that were used in the field (they are with the DNR now, but I was able to locate a 500 micron and a 68 micron sieve in the lab. These I used placing the course sieve on top of the finer sieve. Course sieve material was not collected, finer sieve materials were collected.
- I set the pump in the water from the outer side of the dock and deployed it as deep as it could go which was approx. 4 meters. I attached the holding line to one of the cleats which held the pump in place while pumping.
- I set the battery up out of possible splash area and attached the red clip to the battery. Holding the out-flow end of the pump above the sieves, I attached the black clip to the battery which initiated the pumping process.
- After 30 seconds passed, the I removed the black clip and set aside the course sieve. Using filtered seawater, I isolated the contents of the finer sieve to one side and using 95% ethanol I collected all of the material in a 50ml collection tube.
- Pumping was repeated until I had 8 vials of plankton preserved in ethanol.
- Pumping was repeated four more times to collect live plankton in a 50ml vial with seawater; these samples were placed in the freezer upon re-entering the lab.
- I want to use 3 different mock-up samples to spike with a high (15 larvae) and low) 5 larvae) amount of plankton larvae which will be used to test DNA extraction processes.
- I also want to test each high and low sub-sample in triplicate.
- So 3 (high)+3(low)= 6 subsamples per mock-up sample totaling 18 sub-samples.
- Sub-sampling was performed from vials 1, 2, and 3 of mock-up pump samples.
- Sub-sampling was performed by inverting tube multiple times to mix sample and quickly pipetting 0.5ml of sample which was then placed in a 2ml eppendorf tube.
- This was repeated 5 more times until a total of 6 sub samples were taken for a single mock-up sample.
- Upon starting a new sub-sample the mock-up sample was re-mixed and a new pipette tip was used.
- This was done for mock-up samples 1, 2, and 3.
- The tubes were closed and set aside to be spiked later using hatchery pacific oyster larvae.
Spiking sub-samples with hatchery larvae
- Eighteen day old pacific oyster larvae donated from Taylor shellfish was used to spike subsamples to test DNA extraction process using a modified pK solution.
- After cleaning and rinsing (X3) a petri dish with 10% bleach and ultra pure water respectively, I pipetted (using a sterile pipette tip) approx. 0.100ml of larvae from collection tube and deposited on petri dish.
- Using a new tip for each sample, I counted and pipetted 5 larvae and deposited into tubes that are to be used as the lower spiked samples.
- Again, using a new tip for each sample, I counted and pipetted 15 larvae and deposited into tubes that are to be used as the higher spiked samples.
- Id necessary, I pipetted more larvae and deposited onto the dish.
- I also had to add more 95% ethanol to the dish when the ethanol that was pipetted out with the larvae evaporated to the point where I could no longer pipette the larvae.
- All tubes were centrifuged at 3000G for 2 minutes and the supernatant was removed, drying the pellet as much as possible.
- They were placed in a tube rack and, with open lids, placed in the fume hood to dry overnight.
- When I return in the morning, I intend to add the modified pK solution, starting the DNA isolation process.
UWT-Becker LabMcCartha
Developing Primers through NCBICreated by Michelle McCartha
Goals:
The primers that we currently have may not be what we need to run through with qPCR. The Olympia oyster, Pacific oyster and Manila clam primers may be too long as qPCR requires primers with max of 300bp and the geoduck primers that we grabbed from Becker et al. 2012 were the wrong ones so we need to pull the correct ones from the paper to run with. Also, we need to find DNA sequences that are associated with all primers. So goals for today are:
- Pull correct primers from Becker et al. 2012, find DNA sequence associated with primers and see if we can generate new primers between100-300bp in length.
- Locate the other targeted species' DNA sequences associated with the primers we have and generate new primers between100-300bp in length for each of them.
- Send all newly generated primers to Sam in the Roberts lab to review our work prior to ordering new primers.
- Below is brief overview of primers that were generated using methods described below. This information was given to Sam to verify of the primers are good to go ahead and order through IDT.
New Primers
Pacific Geoduck
Forward Primer CACACGCGCTACACTGAATG
Reverse Primer GGGCAGGGACGTAATCAACA
Product Length 169
Gene: 18S ribosomal RNA gene
Complete genome NCBI accession number: KC429374.1
Results link: http://www.ncbi.nlm.nih.gov/tools/primer-blast/primertool.cgi?ctg_time=1439416230&job_key=Egn-cYd7Ll8VYRFvcEEjEWtsEQB4cwwF&CheckStatus=Check
Location of Primers on DNA sequence
Forward Primer start/stop: 1281/1300
Reverse primer start/stop: 1449/1430
CTTAGATGTTCGGGGCCGCACACGCGCTACACTGAATGCATCAGCGTGCGTCTACTCTTGCCCGAGAGGGCTGGGAAACCCGTTGAACCGCATTCGTGCTAGGGATTGGGGCTTGTAATTCTTCCCCATGAACGAGGAATTCCCAGTAAGCACGAGTCATCAGCTCGTGTTGATTACGTCCCTGCCCTTTGTACACACCGCCCGTCGCTACTACCGATCGTTCCAGTTAATGAGCGCCTCGGATTGGTCCCGTAAGCGGATTCGCGTCTGCTCTCTGGCGTGCCGAGCAA
Pacific Oyster
Forward Primer GGGGGTTTGGTAACTGGCTT
Reverse Primer AATTGTTCACCCTGCCCCAA
Product Length 158
Gene: COI
Complete genome NCBI accession number: KR084952.1
Results link: http://www.ncbi.nlm.nih.gov/tools/primer-blast/primertool.cgi?ctg_time=1439488258&job_key=9O8FMzQ5nR2iMKY-xxCUQNw9plHPIrtU&CheckStatus=Check
Location of Primers on DNA sequence:
Forward Primer start/stop: 180/199
Reverse primer start/stop: 337/318
gactttataaccctggagctaagtttttagaccccgtgacttataatgcagttgtaactaggcatgcgttggttatgatttttttctttgttatacctgtaataattggggggtttggtaactggcttatccctttgatgcttctagtagcagacatgcaatttcctcgattaaatgcatttagattttgagttttgccagggtctctttatcttatgcttatgtctaacattgtagaaaacggagttggggcagggtgaacaatttaccctcctttatcaacttactcttatcatggagtttgtatagaccttgcaattctaagccttcaccttgctggtattagctctattttcaggtcaat
Manila Clam
Forward Primer CTGAGTTTTTAATTGAAGTTTAGTTGGG
Reverse Primer CCCTGCGGTAGCTTTTGCT
Product Length 107
Gene: 16s rRNA
Complete genome NCBI accession number: JF901812.1
Results link: http://www.ncbi.nlm.nih.gov/tools/primer-blast/primertool.cgi?ctg_time=1439410680&job_key=jJdg7YXnLMMX_RPzct0hjWnwE5x67w6Z&CheckStatus=Check
Location of Primers on DNA sequence:
Forward Primer start/stop: 83/110
Reverse primer start/stop: 189/171
aagacgagaagaccctgtcgagcttaattaaataaaaaactagatatggttaaatgaaaagtgttaatagtttaattgttggctgagtttttaattgaagtttagttggggagagctgagtttaaggtaataaacttaagaaatactaaagatcctctttgagagaagttagcaaaagctaccgcagggataacagcgtaattctttttaagagatcttattgagggaagagtttgcgacctcgatgttg
Olympia Clam
Forward Primer TTGGCTAGTGGGATTGGCAC
Reverse Primer ACGGTCCTTTCGTACATGCC
Product Length 181
Complete genome NCBI accession number: KC768038.1
Results link: http://www.ncbi.nlm.nih.gov/tools/primer-blast/primertool.cgi---This link doesn’t work but I can generate it again if needed.
Location of Primers on DNA sequence
Forward Primer start/stop: 10832/10851
Reverse primer start/stop: 11012/10993
ATAACAGGCTAATCCACTAGTAGAGAACGTATTGGCTAGTGGGATTGGCACCTCGATGTTGAATCAGGGATGATACCTTTAAGGCGTAGAAGCTTTAAAAGTAGGTCTGTTCGACCTTTAATACCCTACGTGATTTGAGTTCAGACCGGCGCAAGCCAGGTCGGTTTCTATCTTCTTTTATAATATTCTTTTGGCATGTACGAAAGGACCGTTAAAAGAGGAAGTTTCCTTTTAAAAGAA
- Below is a more detailed description of the methods that were used to find DNA sequences and develop primers for the Pacific geoduck, Pacific oyster, Manila clam, and Olympia oyster.
Looking for DNA sequence from Becker et al. 2012
Pulled forward and reverse primers from Becker et al. 2012
Fwd: CCGCACACGCGCTACACTGA
Rev: TCGGCACGCCAGAGAGCAGA
Searched FASTA files given to us from collaborators of the paper (attached) and searched for primers using copy/paste methods to narrow down DNA sequence that matched both forward and reverse primers.
Identified three sequences that matched primers listed in the FASTA as:
4H_SB
11C_SB
1G_SB
Copy and pasted sequences into separate file saved as “Geoduck DNA Seq.test “.
We will use these sequences in NCBI to develop new primers.
Using NCBI as a search tool for sequences and primer
Geoduck
Opened NCBI website (blast.ncbi.nlm.nih.gov) to Nucleotide blast.
Copy and pasted FWD/REV primers from Bonnie’s paper with a bunch of Ns in between primers and deleted numbers and other characters.
Clicked somewhat similar sequences.
Hit “BLAST”
Results- No significant matches were found.
Went to NCBI home screen and clicked Primer-Blast under specialized blast.
Copied DNA seq 11C_SB and pasted into open box for PCR template.
Copied FWD/REV primers and pasted into Primer Parameters.
Changed nothing else and clicked “Get Primers”.
Results:
http://www.ncbi.nlm.nih.gov/tools/primer-blast/primertool.cgi?ctg_time=1439410539&job_key=z9Q-XvNUWnBhyGXGBOhXuB_FZakM2nis
Verified that the sequence was the same as what I had placed in the template box.
Primer Pair 1
FWD Primer: CCGCACACGCGCTACACTGA
REV Primer: TCGGCACGCCAGAGAGCAGA
Product length: 271
FWD Start/Stop: 22/41
REV Start /Stop: 292/273
Saved screenshot as Geoduck1 Screenshot 2015-08-12@2.01.09pm
We decided not to trust this set however because in the blue box at the top it states: Primer pairs are specific to input template as no other targets were found in selected data base: Refseq mRNA (organism limited to Homosapiens ).
Copied DNA seq from doc GeoduckDNAseqtest: 4H_SB.
Verified geoduck primers from Becker et al. 2012 were still in primer parameter boxes.
Pasted 4H_SB DNA sequence into template boc in Primer-Blas on NCBI.
Changed database to “nr” and removed “homo sapiens” from organism box.
Hit “ Get Primers”.
Results look much better with gen bank accession numbers and shows panopea species along with primer information.
Took accession number KC429374.1 Clicked on it and got voucher information. Copied all information and pasted into new doc labeled GEODUCK_NCBI Blast info_4h_SB. Took screen shot of NCBI Blast including top two results. Labeled screenshot as 4H_SB_Results_Screen shot 2015-08-12 at 2:34:12pm.
FWD Primer: CCGCACACGCGCTACACTGA
REV Primer: TCGGCACGCCAGAGAGCAGA
Product length: 271
FWD Start/Stop: 16/35
REV Start /Stop: 286/267
Pasted results link to doc with full 4H_SB sequence and labeled Geoduck_4H_SB_Seq.Results_271bp.
Now we need to generate smaller sequences for primers so returned to Primer Blast to make primers up to 200bp.
Deleted FWD/REV primer sequences in template box
Left DNA sequence in sequence box.
Changed organism from Homo sapiens to nothing and clicked “Get Primers”.
Brought to a screen asking to pick a similar accession number to go with ans saw one that we chose before- KC429374.1.
Clicked that accession number and hit submit.
Came to results and we have new primers.
Took screen Shot of results and labeled: GEODUCK_NCBIBlastPrimers 169bp_Screenshot 2015-08-12 at @.59.04pm.
Clicked on gen bank accession number and it was all the same as what we already had so I didn’t make another copy.
Made new doc labeled GeoduckNewPrimers169bp and copied everything to that doc for new primer info.
Olympia Oyster
From NCBI homepage went to Nucleotide Blast.
In “Enter Query Sequence copied Primers (FWD/REV) from what Megan gave us to box with about 20 Ns in the middle
FWD Primer: TTTGAGTTTTGGTTTCCTC
REV Primer: NATGCCCGGTCTACTGAACG
Selected for “somewhat similar sequences”
Hit “Blast”
Results included complete genome for Ostrea lurida and a different species sequence.
Accession number : KC768038.1
Clicked on Ostrea lurida
Saved sequence information to doc titled: OlyOyster_FullDNASeq.
Moved just FASTA of DNA sequence to doc titled: Seqdump(2).txt.
Copy and pasted DNA seq from Seqdump file and pasted to Primer design tool accession box in NCBI.
Pasted FWD/REV primers to Primer Parameter area.
Limited PCR product size to 100 min 300 max
Changed data base to nr
Deleted Homo sapiens for organism and typed Ostrea lurida (taxid:627230)
Clicked “Get Primers”
Results: Error- could not find right primer.
Deleted both primers
Hit get primers
Clicked accession box for KC768038.1 and hit submit.
Results: Came up with a bunch of primer pairs.
Selected primer pair 3 to give to Sam- 181 bp
Took snapshot of screen and saved as PotOlyPrimers Screen shot 2015-08-12 at 12.18.16am
FWD: TTGGCTAGTGGGATTGGCAC
REV: ACGGTCCTTTCGTACATGCC
Product length:181bp
Pacific Oyster
Copied Pacific Oyster Primers from Patil et al. 2005.
FWD: TATTCGTTGGAGACTTTATAACCCT
REV: AAGGCTTAGAATTGCAAGGTCTATA
Pasted primers into NCBI Primer Blast tool and clicked for somewhat similar sequences deleted Homo sapiens and entered Crassostrea gigas name- selected data base nr.
Hit get Primers.
Came up with many accession numbers- selected KR084952.1 Crassostrea gigas voucher MT09441 cytochrome oxidase subunit 1 (COI) gene, partial cds; mitochondrial.
Saved draft of voucher.
Copied DNA sequence to another doc- removed all numbers and spaces. Copied SNA sequence and pasted to DNA template box in Primer design tool on NCBI.
Limited primers to 100/300bp min/max.
Deleted primers in primer parameters.
Changed organism to Crassostrea gigas and data base set to nr.
Hit Get Primers.
Selected accession number KR084952.1
Hit submit.
Came up with new primers for C. gigas.
Took screen shot and saved as Cgigas_PotPrimers_Screen Shot 2015-08-13 at 10.52.22 AM and CgigasPotPriimers_Screen Shot 2015-08-13 at 10.52.30 AM as multiple pairs were generated. Selected primer pair to give to Sam to verify.
Brenda SmithhislerChecking Manila clam primers-8-12-15
GoalsTo find the template sequence used for primer selection of Ruditapes philippinarum and to check the base pair product size of PCR, since we need primers 200bp or less for qPCR.
MethodsI went to the NCBI nucleotide page to look up the GenBank Accession number JF901812 referenced from the table in Quintero et al. 2011.www.ncbi.nlm.nih.gov/nuccore/I entered the accession number in the search box and clicked search. The results that showed up on a new page gave the Ruditapes philippinarum voucher Tphi 3mm 16S ribosomal RNA gene, partial sequence; mitochondrial. With this voucher, I gathered information that the partial sequence used was 250bp and the origin of this is:
1 aagacgagaa gaccctgtcg agcttaatta aataaaaaac tagatatggt taaatgaaaa
61 gtgttaatag tttaattgtt ggctgagttt ttaattgaag tttagttggg gagagctgag
121 tttaaggtaa taaacttaag aaatactaaa gatcctcttt gagagaagtt agcaaaagct
181 accgcaggga taacagcgta attcttttta agagatctta ttgagggaag agtttgcgac
241 ctcgatgttg
The version of this voucher is JF901812.1 with GI:332649812
I then copied all of the text from the voucher to a document and named the file Ruditapes philippinarum voucher. I then copied just the origin sequence without spaces or numbers into another document and saved the file as R.p. 16S rRNA partial sequence.
Next I opened Primer BLAST and pasted the 250bp partial sequence from the Quintero/Nuccore voucher, as well as the forward and reverse primer sequences presented in the google sheet ‘Primer data base’ in the corresponding boxes. The primer sequences were:
Forward: 5’-CTGAGTTTTTAATTGAAGTTTAGTTGGG-3'
Reverse: 5’-CCCTGCGGTAGCTTTTGCT-3'
I altered the manual entry settings by changing the PCR product size to Minimum: 100 and Maximum: 300. After clicking “Get Primers” on the bottom left of the screen, the results opened in a new page (had to click ‘check’ for status updates as the primer blast took approx. 50 seconds to complete). The results of the primer BLAST were as follows,
Product Length: 107
Forward primer:
Length-28
Start-83
Stop-110
GC%-32.14
Tm-58.06
Self complementarity-6.00
Self 3’ complementarity-0.00
Template stand-Plus
Reverse primer:
Length-19
Start-189
Stop-171
GC%-57.89
Tm-60.68
Self complementarity-4.00
Self 3’ complementarity-2.00
Template stand-Minus
I then proceeded to fill out the primer data base google sheet with the following information,
#bp as the length of primers
GC%
Gene Accession # as the GenBank reference number from Quinteiro et al.
Full sequence with the 205bp partial sequence from Quinteiro
Location on reference as the start and stop location base pair numbers
I did not fill in the columns of pair w/sr_ID and IDT#
I added a column for the URL of primer BLAST results, a column for the length of the partial sequence used (250bp for this specific template), and added a final column for the listing of the nucleotide sequence from the beginning of the forward primer and the ending of the reverse (the product essentially).
I added the URL of Primer BLAST results to the document R.p. 16S rRNA partial sequence, took a screen shot of Primer BLAST results, and added the two documents and one photo to the google drive, as well as given below.
I also ran the primer BLAST, changing the database to nr as seen in Steven’s introduction to primer sequencing. I deleted ‘homo sapiens’ from the organism box, and left it blank and clicked ‘Get Primers’. Results showed that there are many similar primer sequences just with larger templates, but each with a product of 107bp and only for the manila clam. This reassured us that this primer sequence is organism-specific and may be more commonly used and analyzed by others. The link to these results, with their included accession numbers, is given second in order on the R.p. 16S rRNA partial sequence document.
UWT- Becker LabMcCartha
Testing geoduck primers with changes to electrophoresis settings- 8/10/2015Created by Michelle McCartha
GoalsTo run PCR with annealing temp at 65 and change voltage/time settings from 100V/30min to 80V/45min and see if there is more separation in PCR products.
MethodsPreparing PCR reactions
- Prepared master mix with volumes listed below by first adding mix, then primers, and lastly water.
| Master Mix Solutions |
Standard volume (μL) |
Multiply By |
new volume |
|
add pipette error |
Final volume to add (μL) |
| Master mix |
12.5 |
16 |
200 |
20 |
220 |
220 |
| FWD Primer |
0.5 |
16 |
8 |
0.8 |
8.8 |
8.8 |
| Rev Primer |
0.5 |
16 |
8 |
0.8 |
8.8 |
8.8 |
| Water |
9.5 |
16 |
152 |
15.2 |
167.2 |
167.2 |
- Pipetted up and down for good mixing.
- Labeled PCR tubes so that they read from L-R:
- NTC, TC, 1,1,1,2,2,2
- NTC, TC, 6,6,6,15,15,15
- Added 23μL of mix to labeled PCR tubes.
- Added 2μL DNA isolations to respective tubes as listed above.
- Placed in thermocycler with setting for annealing temp at 65C (no other settings were altered).
Preparing 1.2% Agarose gel
- Need 150ml for one gel
- 50*3=150ml 1X TAE buffer solution
- 0.6*3=1.8g Agarose
- Weighed out agarose- actual weight 1.812g
- Measured 150ml 1X TAE buffer solution and poured into 500ml erlenmeyer flask saving some to rinse weigh boat of agarose.
- poured in agarose and swirled- rinsed boat with remaining buffer solution.
- Microwaved for approximately 4 minutes until agarose dissolved. Poured into clean gel mold with two row combs placed in gel. Let cool.
- Realized did not add ethidium bromide to solution so took out and placed gel back into flask.
- Re-heated until completely dissolved once more- 2 min.
- Added 15μL ethidium bromide and swirled.
- Re-poured into gel mold with 2 comb rows. Let cool.
Electrophoresis
- When gel was cooled placed mold into gel box and poured 1X TAE buffer solution into box until gel was just covered.
- Took reactions from thermocycler.
- Pipetted 10μL DNA ladder into first well
- Pipetted 10μL reactions into remaining wells so that gel would read from L-R
- Row 1-Ladder, NTC, TC, 1,1,1,2,2,2
- Row 2- Ladder, NTC, TC, 6,6,6,15,15,15
- Placed remaining reactions in freezer for possible future use when testing volt/time changes.
- Set power source to 80V and 45 minutes instead of running at 100V and 30 minutes.
- When complete, took to Cline lab to view under UV light and photograph.
DNA isolation of Geoduck DNA and other DNA sets
- Took remaining piece of siphon that was fixed in RNAlater from the Robert's Lab and measured it.
- Measured at 0.026g.
- Cut up entire piece and placed in labeled 2ml tube.
- Added 0.5ml DNAzol to tube
- Added 2μL to tube
- Time in solution 4:35pm
- Took other DNA isolution sets that were in DNAzol out of freezer and will complete isolation steps for all sets on 8/11/2015.
- For species collected and fixed in ethanol for DNA isolation using modified pK method (these samples will also be cross-testing our primers with) I took them out and centrifuged them down at 10G for 5 minutes.
- I pipetted off all ethanol supernatant leaving pellet behind (pellet should be species of concern.
- Set out for overnight drying of ethanol and in the am will place on heat block with pK solution for digestion.
Results
Image below is of PCR ran today. Gel reads from left to right/ top to bottom rows- Row 1-Ladder, NTC, TC, 1,1,1,2,2,2 and Row 2- Ladder, NTC, TC, 6,6,6,15,15,15. The DNA ladder does appear to be separating a little more but it's hard to say if there is an amplified product anywhere throughout the gel (maybe it's all primer dimer?). There are some light areas where primer dimer may be present but nothing concrete from what I can tell. What do the streaks mean (wells with DNA set 6- row 2 wells 4,5,6)?
Future Steps
- I want to try the reactions that I have in the freezer again tomorrow to see if I can get more separation in the ladder and future products.
- I am going to put some more geoduck tissue in DNAzol for overnight digestion to test if we are just not getting any good DNA in the TC to compare other DNA isolations to.
- I'm still working on getting the full DNA sequence the primers associate with, this will help to determine if or not primer dimer is what we are seeing.
8/7/2015UWT- Becker LabMcCartha
Testing Geoduck primers at annealing different annealing temperatures.Created by: Michelle McCartha
Goal:Use DNA isolations 1,2,6, and 15 to see if changing the annealing temperatures to 60 and 65 affects the amplification that we are seeing during PCR.
Methods:Changing annealing temperature to 60.
- Used volumes below to create master mix by first adding mix, then fwd/rev geoduck primers and finally water.
| Master Mix Solutions |
Standard volume (μL) |
Multiply By |
new volume |
|
add pipette error |
Final volume to add (μL) |
| Master mix |
12.5 |
16 |
200 |
20 |
220 |
220 |
| FWD Primer |
0.5 |
16 |
8 |
0.8 |
8.8 |
8.8 |
| Rev Primer |
0.5 |
16 |
8 |
0.8 |
8.8 |
8.8 |
| Water |
9.5 |
16 |
152 |
15.2 |
167.2 |
167.2 |
- Labeled PCR tubes
- NTC, TC, 1,1,1,2,2,2
- NTC, TC, 6,6,6,15,15,15
- 1-Shore crab
- 2- snail
- 6- acorn barnacle
- 15- moonsnail
- pipetted 23μL master mix in all tubes
- Pipetted 2μL DNA in respective tubes
- Pipetted geoduck DNA in template control tubes
- Did not pipette water or anything else in no template control tubes- just master mix.
- Took to thermocycler and changed annealing temperature to 60 from 55.
- Program looks like this:
- 95.0°C-10 minutes
- 40 cycles of
- 95.0°C-20 seconds
- 60°C-20 seconds
- 72°C-30 seconds
- 72°C-2 minutes
- Hold at 4°C forever
- When finished took back to Becker Lab to prep for electrophoresis.
- Used gel made on 8/3/15 and placed in gel box.
- Filled with 1x TAE buffer solution until gel was just covered.
- Pipetted 10μL Ladder to first wells on row 1 and 2.
- Pipetted 10μL of PCR reactions into remaining wells so gel read:
- Row 1- Ladder, NTC, TC, 1,1,1,2,2,2
- Row 2- Ladder, NTC, TC, 6,6,6,15,15,15
- Turned on power source and ran electrophoresis at 100V for 30 minutes.
- Took to Cline lab to look under UV light and photograph.
Changing annealing temperature to 65.
- Used same methods as done when changed annealing temperature to 60.
- Used volumes below to create master mix by first adding mix, then fwd/rev geoduck primers and finally water.
| Master Mix Solutions |
Standard volume (μL) |
Multiply By |
new volume |
|
add pipette error |
Final volume to add (μL) |
| Master mix |
12.5 |
16 |
200 |
20 |
220 |
220 |
| FWD Primer |
0.5 |
16 |
8 |
0.8 |
8.8 |
8.8 |
| Rev Primer |
0.5 |
16 |
8 |
0.8 |
8.8 |
8.8 |
| Water |
9.5 |
16 |
152 |
15.2 |
167.2 |
167.2 |
- Labeled PCR tubes
- NTC, TC, 1,1,1,2,2,2
- NTC, TC, 6,6,6,15,15,15
- 1-Shore crab
- 2- snail
- 6- acorn barnacle
- 15- moonsnail
- pipetted 23μL master mix in all tubes
- Pipetted 2μL DNA in respective tubes
- Pipetted geoduck DNA in template control tubes
- Did not pipette water or anything else in no template control tubes- just master mix.
- Took to thermocycler and changed annealing temperature to 65 from 60.
- Program looks like this:
- 95.0°C-10 minutes
- 40 cycles of
- 95.0°C-20 seconds
- 65°C-20 seconds
- 72°C-30 seconds
- 72°C-2 minutes
- Hold at 4°C forever
- When finished took back to Becker Lab to prep for electrophoresis.
- Used final gel made on 8/3/15 and placed in gel box.
- Filled with 1x TAE buffer solution until gel was just covered again as had removed some after the first gel was ran..
- Pipetted 10μL actual Ladder to first wells on row 1 and 2.
- Pipetted 10μL of PCR reactions into remaining wells so gel read:
- Row 1- Ladder, NTC, TC, 1,1,1,2,2,2
- Row 2- Ladder, NTC, TC, 6,6,6,15,15,15
- Turned on power source and ran electrophoresis at 100V for 30 minutes.
- Took to Cline lab to look under UV light and photograph.
Image 1 (below): Gel when changing the annealing temperature to 60C. Read from L-R: Row 1 (Top)- Ladder, NTC, TC,1,1,1,2,2,2 Row 2 (Bottom)- Ladder, NTC, TC, 6,6,6,15,15,15.Ladder again was not showing up but that is because we were using the gel loading dye and not the actual ladder as stated above. This was fixed for the second gel. There is still product at similar lengths on the gel however the TC wells don't show a super bright product anymore BUT product is still present.
Image 2 (Below): Gel when changing temperature of annealing stage to 65C. Read from L-R: Row 1 (Top)- Ladder, NTC, TC,1,1,1,2,2,2 Row 2 (Bottom)- Ladder, NTC, TC, 6,6,6,15,15,15. Here you can see that the ladder is working.There is a brighter marker where the template control is which seems to be offset than the other products that are showing up (or it's just too light to see that it's the same length)
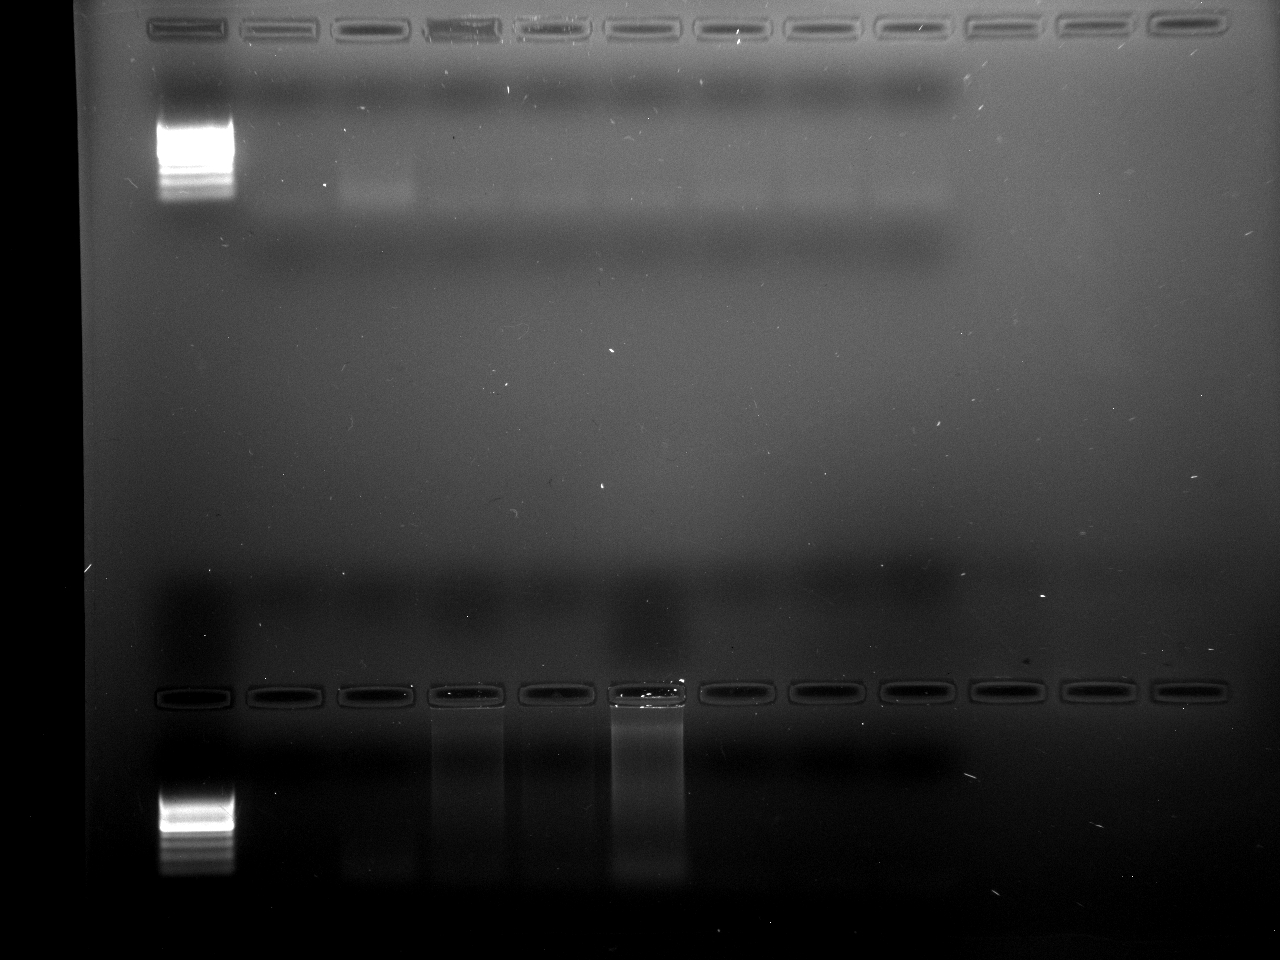
Future Steps:Maybe we should try lowering the voltage and adding more time during electrophoresis and see if we can get more separation that we may have been seeing with Image 2? Or trying a higher concentration gel than 1.2%?
8/7/2015UWT- Becker LabMcCartha
List of Primers currently in use- with attachment also.
| Primer name |
Primer Sequence |
Designed By |
date ordered |
#bp |
GC% |
Organism |
Gene |
Gene Accession# |
nmole |
| Rp TPHI16S-1F |
5#-CTGAGTTTTTAATTGAAGTTTAGTTGGG-3# |
Paper-Quinteiro et al 2011 |
4/8/15 |
Manilla Clam |
16S rRNA |
10.96 |
|||
| Rp TOHI16S-2R |
5#- CCCTGCGGTAGCTTTTGCT-3# |
Paper-Quinteiro et al 2011 |
4/8/15 |
Manilla Clam |
16S rRNA |
18.53 |
|||
| Cg CCGS4F |
TATTCGTTGGAGACTTTATAACCCT |
Paper-Patil et al 2005 |
4/8/15 |
700 |
Pacific Oyster |
COI |
12.63 |
||
| Cg CCGS4R |
AAGGCTTAGAATTGCAAGGTCTATA |
Paper-Patil et al 2005 |
4/8/15 |
700 |
Pacific Oyster |
COI |
11.67 |
||
| PGNewForward |
5#-CAGGTCTGTGATGCYC-3# |
Paper-Bonnie et al. 2012 |
5/11/15 |
385 |
Panopea generosa |
18S |
31.8 |
||
| PgNewReverse |
5#-TGATCCATCTGCAGGTTC-3# |
Paper-Bonnie et al. 2012 |
5/11/15 |
385 |
Panopea generosa |
18S |
27.6 |
||
| Oly fwd |
5’-TTTGAGTTTTGCCGGTTTCTC-3’ |
Paper-Wight et al 2009 |
7/8/15 |
Olympia Oyster |
COI |
22.2 |
|||
| Oly Rev |
5’-ATGCCCGGTCTACTGAACG-3’ |
Paper-Wight et al 2009 |
7/8/15 |
Olympia Oyster |
COI |
23.3 |
List of DNA isolations to cross-test primers- with attachment.
| ID Number |
Date of collection |
Species |
| 1 |
7/3/15 |
Hemigrapsus oregonensis |
| 2 |
7/3/15 |
Clinocardium nuttallii |
| 3 |
7/3/15 |
Unknown 1 |
| 4 |
7/3/15 |
Dendraster excentricus |
| 5 |
7/3/15 |
Unknown 2 |
| 6 |
7/10/15 |
Acorn Barnacle |
| 7 |
7/10/15 |
Shield Limpet |
| 8 |
7/10/15 |
Barnacle larvae |
| 9 |
7/10/15 |
Polychaete larvae |
| 10 |
7/10/15 |
Copepod |
| 11 |
7/10/15 |
Amphipod |
| 12 |
7/13/15 |
red rock crab |
| 13 |
7/13/15 |
Dendraster excentricus |
| 14 |
7/13/15 |
frilled dogwinkle |
| 15 |
7/13/15 |
Moonsnail |
| 16 |
7/13/15 |
Manilla Clam |
| 17 |
7/13/15 |
Aggregating green Anenomie |
| 18 |
7/13/15 |
Oly Oyster |
| 19 |
7/14/15 |
Crab |
| 20 |
7/14/15 |
Crab |
| 21 |
7/13/15 |
grainyhand hermit crab |
| 22 |
7/13/15 |
Native littleneck |
| 23 |
6/15/15 |
burrowing mussel mydiolus |
| 24 |
7/14/15 |
Purple Mahogany Clam |
| 25 |
7/13/15 |
unid 3 |
SpeciesCrossTest_Log.xlsx
8/3/2015UWT- Becker LabMcCarthaGeoduck primer testing for specificity continued.Created by Michelle McCartha
Goal:1) To run PCR using geoduck primers on DNA isolations 1,2,6, and 15 following 7/30/15 Oly primers testing.
Methods: PCR Prep
- Prepared master mix using volumes as listed below:
| Master Mix Solutions |
Standard volume (μL) |
Multiply By |
new volume |
|
add pipette error |
Final volume to add (μL) |
| Master mix |
12.5 |
16 |
200 |
20 |
220 |
220 |
| FWD Primer |
0.5 |
16 |
8 |
0.8 |
8.8 |
8.8 |
| Rev Primer |
0.5 |
16 |
8 |
0.8 |
8.8 |
8.8 |
| Water |
9.5 |
16 |
152 |
15.2 |
167.2 |
167.2 |
- Added mix then primers and lastly water.
- Vortexed slightly then set asid and labeled PCR tubes
- Labeled PCR tubes similar to 7/30/15 as shown below:
- NTC, Pg, 1,1,1,2,2,2
- NTC, Pg, 6,6,6,15,15,15
- Added 23μL prepared master mix to each PCR tube.
- Added DNA to each respective tube- did not add water to NTC tube.
- Sealed lids and placed in thermocycler.
- Set for program listed under "Bonnie".
- When finished took out and placed in Fridge until ready for electrophoresis (waiting on gels to cool).
- Only need on gel with two rows in it but decided to make three so would have a few extra for future use.
- Want about 300mL agarose/TAE solution
- 50mL*6= 300mL
- 0.6*6= 3.6g agarose.
- 30μL Ethedium Bromide
- Added 200mL of 1X TAE buffer solution to erlenmyer flask (saved rest to rinse weigh boat)
- Added 3.6g (actual 3.612g) agarose to solution and rinsed wiegh boat using remaining 100mL TAE buffer solution.
- Swirled and microwaved for approx. 4 minutes stopping in between to swirl some more and let bubbles settle.
- When all agarose dissolved added 30μL Ethedium bromide to flask and swirled som more.
- Poured solution into three clean gel molds with two comb rows in each mold. moved and popped any bubbles that formed while pouring.
- Let sit for 30 minutes.
- Set a prepared mold in gel box and poured 1X TAE buffer solution over gel until just covered.
- Added 10μL DNA ladder into first well.
- Added 10μL of prepared reactions into remaining wells so that the gel would read:
- Row 1- Ladder, NTC, PgDNA, 1,1,1,2,2,2
- Row 2- Ladder, NTC, PgDNA, 6,6,6,15,15,15
- Set power source for 30 minutes at 100V.
- When completed took gel to Cline lab to view under UV light and photograph.
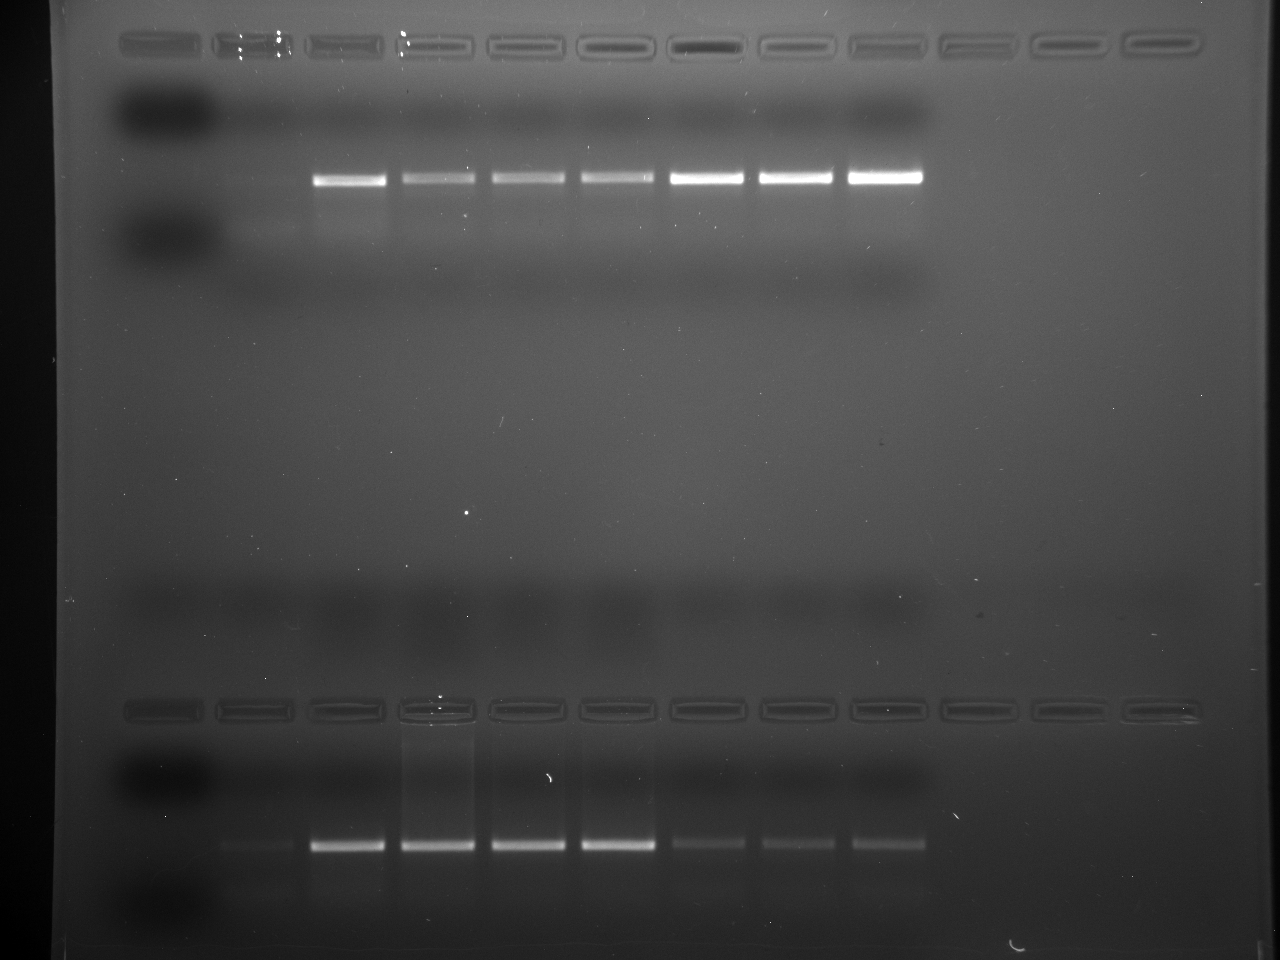
Future steps:
- A new ladder was used with this run and did not show on the gel. We need to go back to old ladder.
- Because geoduck DNA was once again amplified where it was not in Pacific oyster PCR there could be a number of issues going on:
7/30/2015UWT-Becker LabMcCartha
Testing Pacific Oyster primers for specificityCreated by: McCartha
Goal:1- To test Pac oyster primers of specific DNA isolations which amplified during geoduck primer testing.
Methods:Preparing for PCR
- Compared two sets of images from geoduck runs to determine best DNA isolation to test today. Wanted ones that showed consistent amplification in both runs.
- Decided to use DNA isolations labeled 1, 2, 6, 15 (shore crab, snail, acorn barnacle, moonsnail respectively, (sci names are known for each species).
- Labeled 2 sets of 8-tube PCR strips using the following labels
- NTC, TC, 1,1,1,2,2,2
- NTC, TC, 6,6,6,15,15,15
- NTC- no template control
- TC- template control using Pac oyster DNA
- Prepared master mix using volumes below:
- || Master Mix Solutions || Standard volume (μL) || Multiply By || new volume || * 10% pipette error || add pipette error || Final volume to add (μL) ||
- || Master mix || 12.5 || 16 || 200 || 20 || 220 || 220 ||
- || FWD Primer || 0.5 || 16 || 8 || 0.8 || 8.8 || 8.8 ||
- || Rev Primer || 0.5 || 16 || 8 || 0.8 || 8.8 || 8.8 ||
- || Water || 9.5 || 16 || 152 || 15.2 || 167.2 || 167.2 ||
- Added each volume to a labeled eppendorf tube by first adding the Go Taq, then fwd/rev primers and finally water.
- Vortexed slightly
- Also slightly vortexed all DNA isolation
- Added 23μL of the prepared master mix to each PCR tube changing out pipette tips after each transfer.
- Added 2μL of DNA to each respective tube changing out tips with each transfer.
- Did not add water to NTC tube- left with just mix as we have been doing in the past.
- Placed in thermocycler making sure all lids for tubes were intact and ran program under "Bonnie".
- Set up gel boxes for electrophoresis.
- Will use prepared 1.5% TAE agarose gel that Brenda prepared 7-29-15.
- Pipetted 10μL of each reaction in to wells so that read from L-R:
- Ladder, NTC, TC, 1,1,1,2,2,2 (Top wells on gel)
- Ladder, NTC, TC, 6,6,6,15,15,15 (Bottom wells on gel)
- Turned on power source and ran electrophoresis at 100V for 30 minutes.
- After starting process, realized I neglected to pipette Ladder into first well of each row of wells. :( But this is ok since it's more of a check on primers and to compare them with results from geoduck primers- not actually measuring base pair length.
- When electrophoresis finished, took to Cline lab to look under UV light and photograph.
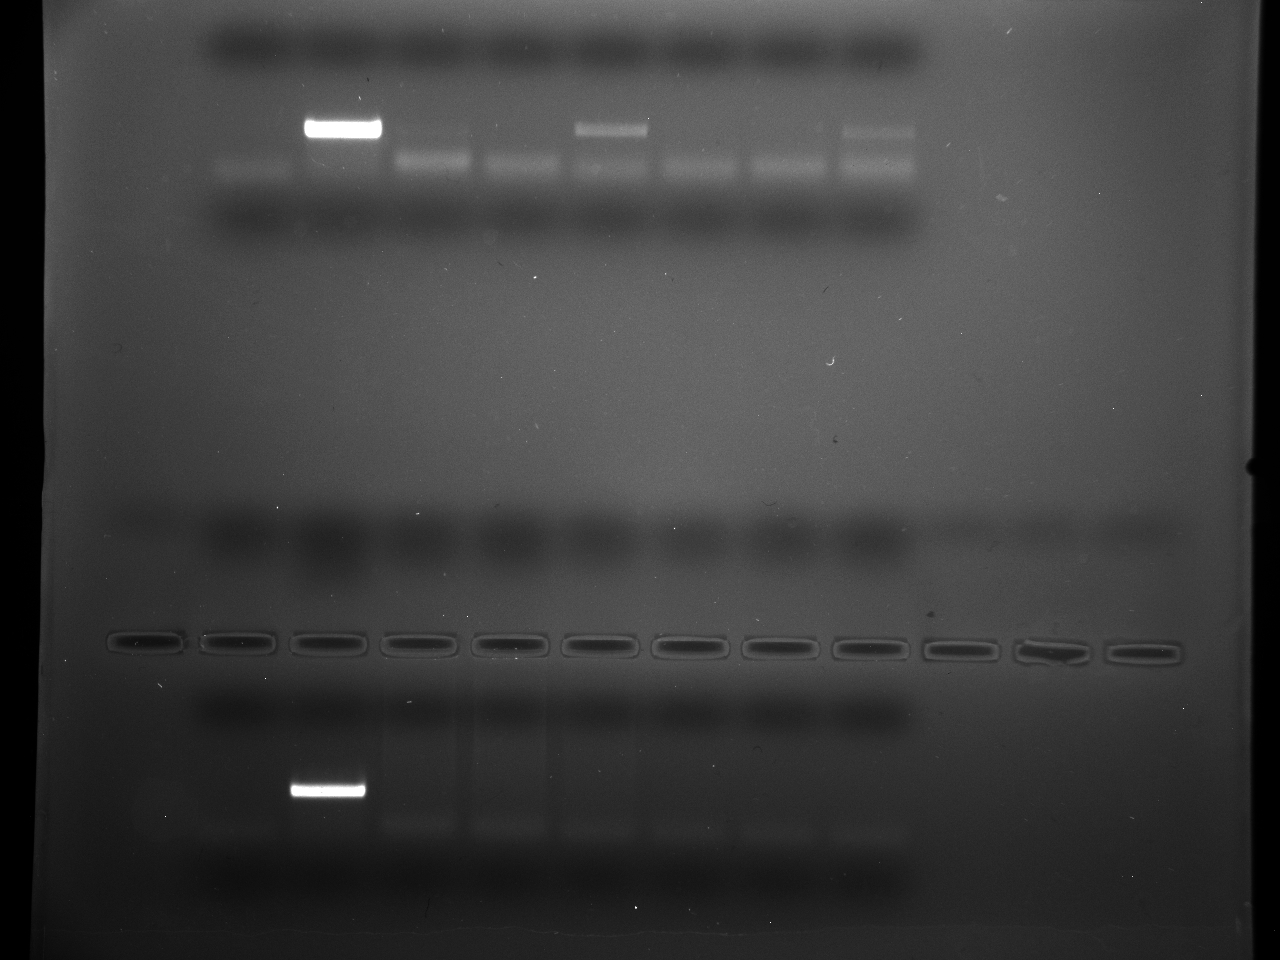
Future steps:
- Today's product was good. Shows that the method we are using is still fine and that we should be doing everything correctly.
- I would like to step back and use our geoduck primers and the same DNA isolations that were used here next week mimicking what we did here exactly.
- Going back to the geoduck primers and using the same DNA isolations used today may (or may not) tell us if the geoduck primers are specific enough to continue with.
7/29/2015UWT-Becker LabMcCartha_Smithhisler
Cross-test geoduck primers with DNA isolations from other inverts collected in the Puget SoundCreated by: McCartha with edits from Smithisler in blue
Goal:
- Make new aliquots of geoduck primers received 5/11/15
- Run PCR using geoduck primers on different DNA samples.
1. Suspending new aliquots of geoduck primers using stock solution from 5/11/15. Made 100μL 10μM aliquots of stock primer
- (C1V 1=C2V 2; 100μM x ?uL = 10μM x 100uL)
- 10 μL of stock solution
- 90 μL of molecular H2O
- For each tube (FWD/REV)Added H2O to 2ml tube then added primer stock primer.
- Vortexed for a second to mix well and set aside.
- Prepared master mix using new geoduck primers. The volumes are listed below:
| Master Mix Solutions |
Standard volume (μL) |
Multiply By |
new volume |
|
add pipette error |
Final volume to add (μL) |
| Master mix |
12.5 |
72 |
900 |
90 |
990 |
990 |
| FWD Primer |
0.5 |
72 |
36 |
3.6 |
39.6 |
39.6 |
| Rev Primer |
0.5 |
72 |
36 |
3.6 |
39.6 |
39.6 |
| Water |
9.5 |
72 |
684 |
68.4 |
752.4 |
752.4 |
- Made master mix by first adding water, then primers (REV and FWD), then topping off with water.
- Vortexed mix slightly.
- Set up and labeled 9 8-tube strips as follows:
| Strip 1 |
NTC |
TC |
1 |
1 |
1 |
2 |
2 |
2 |
| Strip 2 |
NTC |
TC |
4 |
4 |
4 |
6 |
6 |
6 |
| Strip 3 |
NTC |
TC |
7 |
7 |
7 |
12 |
12 |
12 |
| Strip 4 |
NTC |
TC |
13 |
13 |
13 |
14 |
14 |
14 |
| Strip 5 |
NTC |
TC |
15 |
15 |
15 |
17 |
17 |
17 |
| Strip 6 |
NTC |
TC |
21 |
21 |
21 |
22 |
22 |
22 |
| Strip 7 |
NTC |
TC |
23 |
23 |
23 |
24 |
24 |
24 |
| Strip 8 |
NTC |
TC |
26 |
26 |
26 |
27 |
27 |
27 |
| Strip 9 |
NTC |
TC |
29 |
29 |
29 |
|||
- Pipetted 23μL master mix and 2μL sample DNA into respective tubes.
- Numbers from tube set up indicate different samples of DNA from different inverts collected over the past four weeks.
- Brenda finished pipetting samples into tubes. Strips were briefly vortexes and then centrifuged for 10-15 seconds. Brenda checked to make sure caps were tightly sealed. Strips were then placed in thermocycler and the sealing of the lids on all strips was double-checked. Michelle noticed that many tubes were not properly sealed unless pressed with a direct force in the center. Strips were then ran through the program “Bonnie—>Pg_4-24-15”
- When program finished, took to Becker lab where gels and gel boxes were set up for electrophoresis. 4 agarose gels were prepared by measuring out 4.8g of agarose powder in a tared weigh boat. 300mL of TAE-1X buffer was poured into a 1000mL Erlenmeyer flask after being measured out in increments of 100mL in a 100mL graduated cylinder. The agarose powder was added to the 300mL of TAE-1X buffer in the Erlenmeyer flask, then the final 100mL of TAE-1X buffer was used to rinse the weigh boat of any remaining agarose powder into the flask. The solution was swirled and weighed, then covered with a Kimwipe gently stuffed in the top. Then, the agarose and TAE-1X solution was heated, still covered with the Kimwipe, in the microwave for 5 minutes. The flask was weighed and TAE-1X buffer was added to the flask until the final mass equaled the mass before heating at 728.g. 40.mL of ethidium bromide was pipetted into the heated agarose solution and swirled. After allowing the flask and agarose solution to cool for around 10 minutes, the agarose was poured evenly between the 4 gel molds and set to cool for 35 minutes.
- Brenda prepared more 1X-TAE solution by diluting the 50X BioRad stock solution.
- C1V1=C2V2, where C stands for concentration and V stands for volume.
This translated to: (50X)(V1)=(1X)(1000mL desired total volume).
Volume=20mL of TAE buffer original 50X - A 1000mL volumetric flask was rinsed with nano pure water. 20mL of 50X TAE buffer stock solution was measured out in a 100mL graduated cylinder. About 400mL of nano pure water was added to the volumetric flask. The measured 20mL of TAE-50X buffer was then poured into the volumetric flask and swirled with the 400mL of nano pure water. Nano pure water was added to the flask until the water reached the 1000mL level. The 1X prepared solution was poured into a 1L labeled nalgene bottle.
- C1V1=C2V2, where C stands for concentration and V stands for volume.
- Placed gels that Brenda made into gel boxes and poured 1XTAE buffer into boxes until just covering gel.
- Added 10μL ladder and samples so that the gels would read from L-R/Top-Bottom (Gels 1, 2, 3)
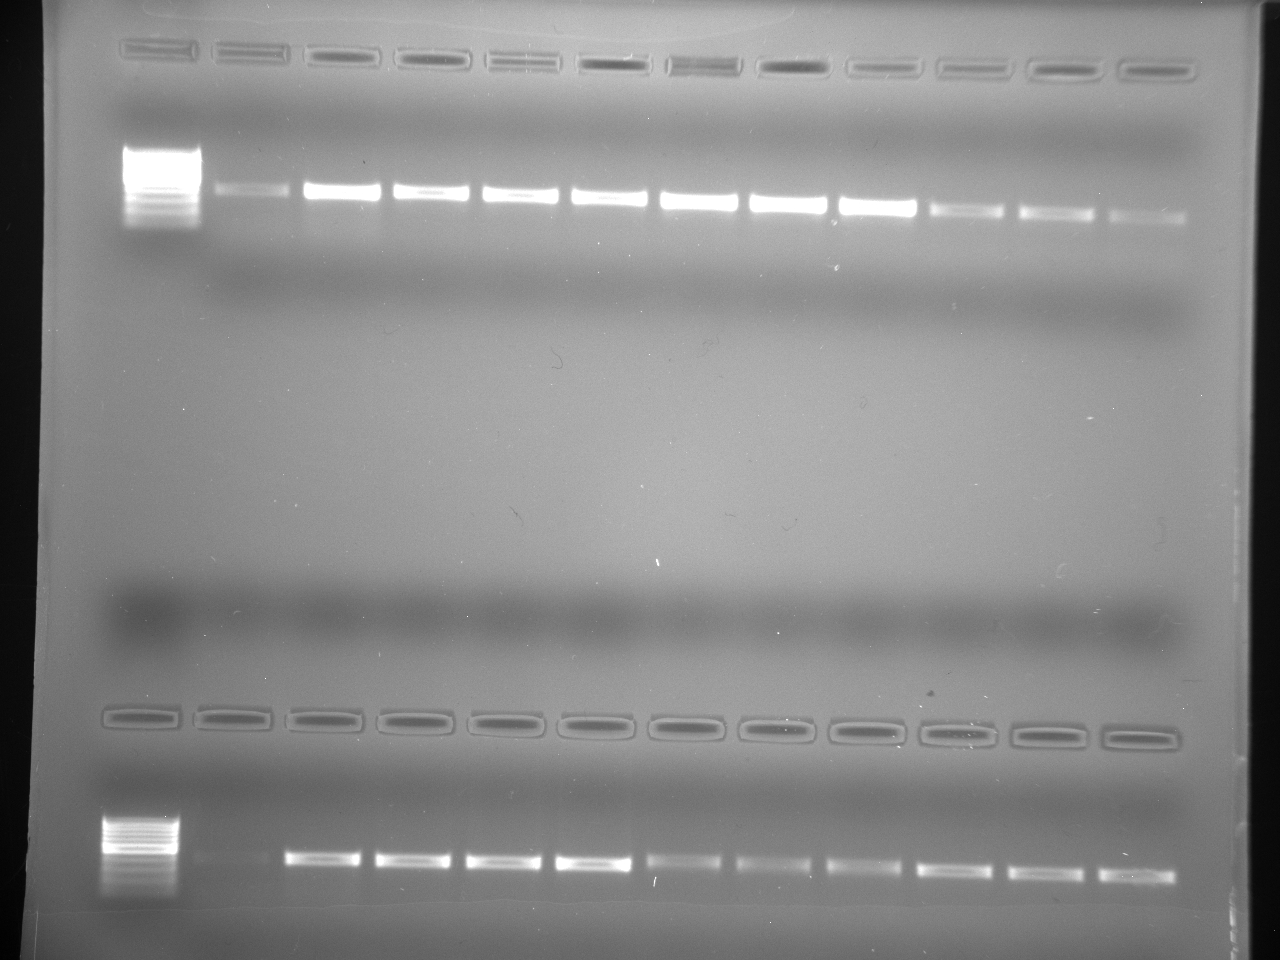
Image above: Wells set up as: Row 1 (top) Ladder, NTC, TC, 1,1,1,2,2,2,4,4,4; Row 2 (bottom) Ladder, NTC, TC, 6,6,6,7,7,7,12,12,12. There appears to be some amplification in wells with DNA isolations 1,2, and 6. The other wells may have some primer dimer (?) showing or it may just be a really light amplification product.
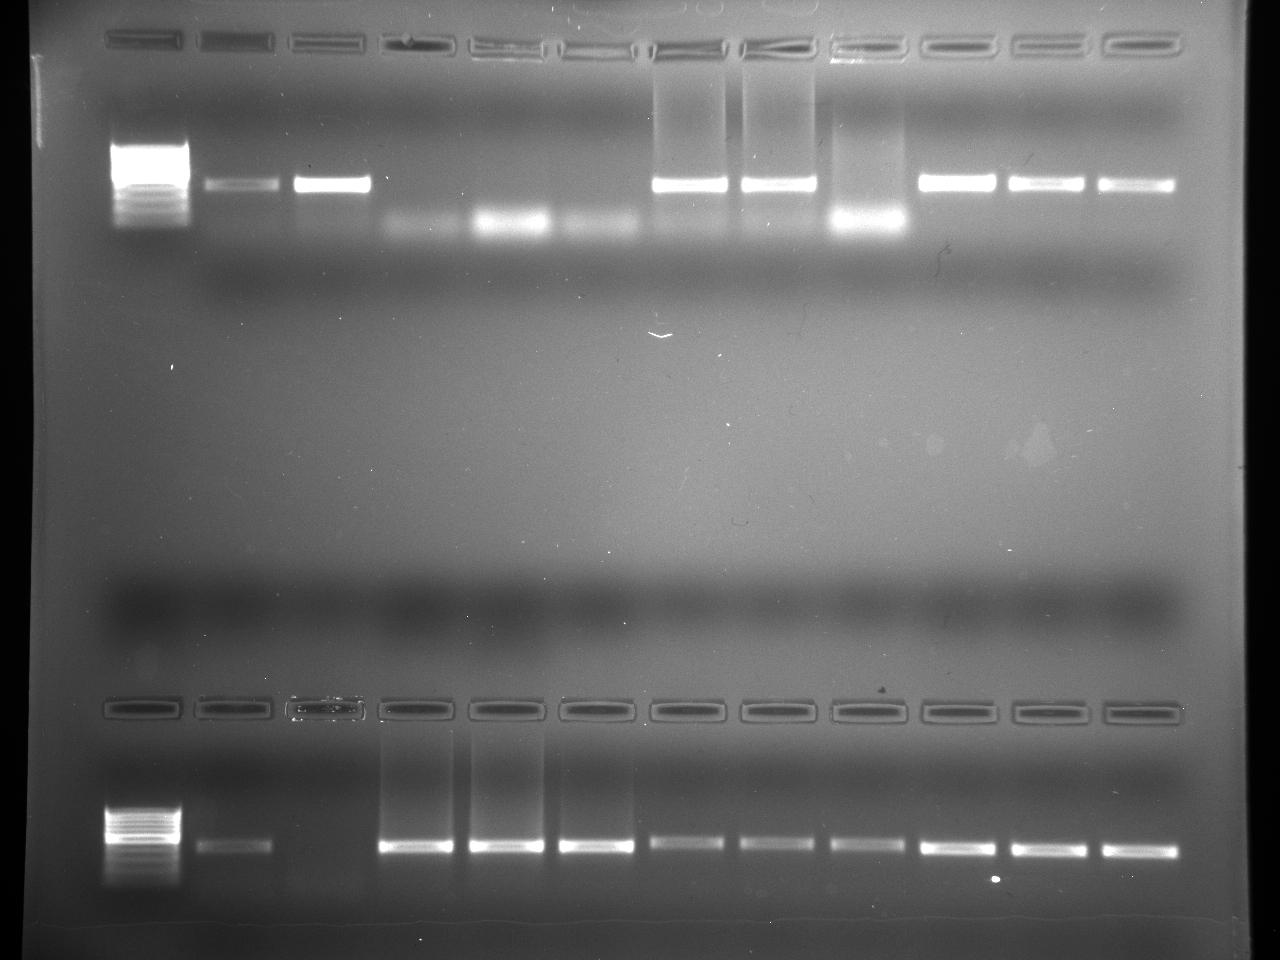
Image above: Wells set up as: Row 1 (top) Ladder, NTC, TC, 13,13,13,14,14,14,15,15,15; Row 2 (bottom) Ladder, NTC, TC, 17,17,17,21,21,21,22,22,22. Amplification is present through out the gel. Doesn't look like primer dimer.
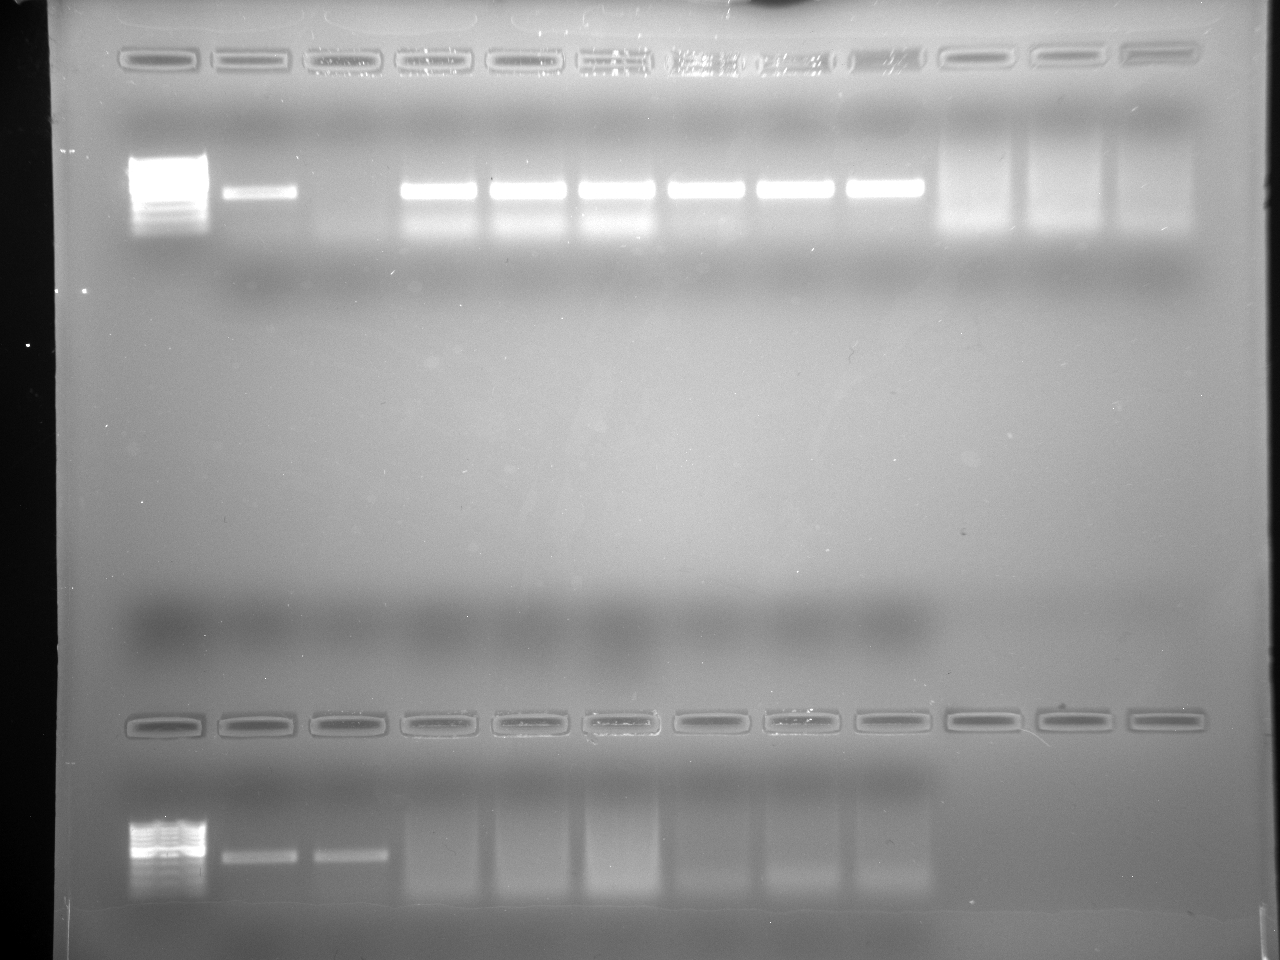
Image above: Wells set up as: Row 1 (top) Ladder, NTC, TC, 23,23,23,24,24,24,26,26,26; Row 2 (bottom) Ladder, NTC, TC, 27,27,27,29,29,29. Amplification is apparent in wells with DNA isolation 23 and 24, all other wells with cross-testing DNA isolations look like primer dimer. NTC also appears to have some amplification.
Future steps:
I would like to step away from the geoduck primers and test a different set with DNA isolations that showed amplification from PCR runs done today and yesterday. These primers may not be specific enough which can be determined by the consistent amplification in wells with DNA not of geoduck.
7/28/2015UWT-Becker LabMcCartha_Smithhisler
Re-run Oly primers and start cross testing all primers with different species.Created by: McCartha with edits from Smithisler in blue
Goal:
- To re-make aliquots and other ingredients from scratch for Oly primers to cancel out possibility of contamination.
- To re-run Oly primers with DNA from Blue mussel, pac oyster, geoduck and manilla clam.
- To start cross testing all primers that will be used in the present research on DNA collected from other species in the Puget Sound to test for specificity.
Methods:1. New Forward and Reverse Oly Primers
- Made 100μL 10μM aliquots of stock primer
- (C1V 1=C2V 2; 100μM x ?uL = 10μM x 100uL)
- 10 μL of stock solution
- 90 μL of molecular H2O
- For each tube (FWD/REV)Added H2O to 2ml tube then added primer stock primer.
- Pulled out 2 sterile 8-tube strips and labeled them so that they read:
- 1-NTC,NTC, OZ,OZ,OH,OH,Pg, Pg
- 2- NTC, NTC, Rp,Rp, Mt, Mt, Cg, Cg
- NTC- No template control
- OZ- Oly frozen Dna
- OH- Oly fresh DNA
- Pg- geoduck
- Rp- Manila clam
- Mt- Blue mussel
- Cg- Pacific Oyster
- Prepared master mix using volumes listed below. Added mix, then primers, then water and briefly vortexed.
| Master Mix Solutions |
Standard volume (μL) |
Multiply By |
new volume |
|
add pipette error |
Final volume to add (μL) |
| Master mix |
12.5 |
16 |
200 |
20 |
220 |
220 |
| FWD Primer |
0.5 |
16 |
8 |
0.8 |
8.8 |
8.8 |
| Rev Primer |
0.5 |
16 |
8 |
0.8 |
8.8 |
8.8 |
| Water |
9.5 |
16 |
152 |
15.2 |
167.2 |
167.2 |
- Prepared strip tubes by adding 23μL of the prepared master mix and 2μL of respective DNA in order of :
- 1-NTC,NTC, OZ,OZ,OH,OH,Pg, Pg
- 2- NTC, NTC, Rp,Rp, Mt, Mt, Cg, Cg
- Placed tubes in thermocycler and started cycler program named "Bonnie".
- Once finished, the two strips were ran through electrophoresis in one of the double-combed gels for 30 minutes at 100 volts. To perform this process, 10μL of PCR product from each tube was pipetted into an individual well, replacing pipette tips every transfer as well as DNA ladder for well 9 on each row.
- Took vials (1,2,4,6,7,8,12,13,14,15) of collected DNA that were isolated on 7/22/15. (Tube 8 is actually labeled tube 18 which is not a sample that we needed to process).
- Made master mix using Pg primers made on 5/12/15 using volumes listed below to make a total of 40 wells.
- || Master Mix Solutions || Standard volume (μL) || Multiply By || new volume || * 10% pipette error || add pipette error || Final volume to add (μL) ||
- || Master mix || 12.5 || 40 || 500 || 50 || 550 || 550 ||
- || FWD Primer || 0.5 || 40 || 20 || 2 || 22 || 22 ||
- || Rev Primer || 0.5 || 40 || 20 || 2 || 22 || 22 ||
- || Water || 9.5 || 40 || 380 || 38 || 418 || 418 ||
- Pipetted 23μL master mix that was prepared and 2μL of each respective DNA sample into 8-tube strips as follows:
| NTC |
TC |
1 |
1 |
1 |
2 |
2 |
2 |
- || || || || || || || || ||
- || NTC || TC || 4 || 4 || 4 || 6 || 6 || 6 ||
- || || || || || || || || ||
- || NTC || TC || 7 || 7 || 7 || 8 || 8 || 8 ||
- || || || || || || || || ||
- || NTC || TC || 12 || 12 || 12 || 13 || 13 || 13 ||
- || || || || || || || || ||
- || NTC || TC || 14 || 14 || 14 || 15 || 15 || 15 ||
- || || || || || || || || ||
- Placed strips in thermocycler and ran program labeled "Bonnie".
- When thermocycler was finished pipetted 10μL of each reaction to three prepared gels using two strips per gel and one for the final gel.
- Some of the tubes popped open in the NTC and TC groups during thermocycler process. Used some spare reaction samples for other gels that had no solution to use during electrophoresis.
- Each row was set up as follows fro L-R: Ladder, NTC, TC, Sample A, Sample A, Sample A, Sample B, Sample B, Sample B.
- Electrophoresis was ran at 100V for 30 minutes.
- When finished, took gels to Cline lab to look at using UV light and photograph.
Gel ElectrophoresiSBrenda measured out 4.821g of agarose powder (1.2g per gel, need 4 gels) and added the agarose powder to 400mL of TAE-1X buffer pre-made at UWT (Made by: MM 05/25/15) that was measured out in a 100mL graduated cylinder and combined in a 1000mL flask and covered with a Kim wipe.Then the flask was weighed without the Kim wipe and heated in the microwave with the Kim wipe replaced until the solution was clear of particles as well as the sides of the flask, however had not boiled over/out. Then, TAE-1X buffer was poured into the flask to return the flask to original mass. 40.0mL of ethidium bromide was added to the flask using an automatic pipette. After letting cool for 10 minutes, the gel was poured into 4 gel box molds wiped down with a Kim wipe, with well combs on the 1.5 side.
Results:Oly gel
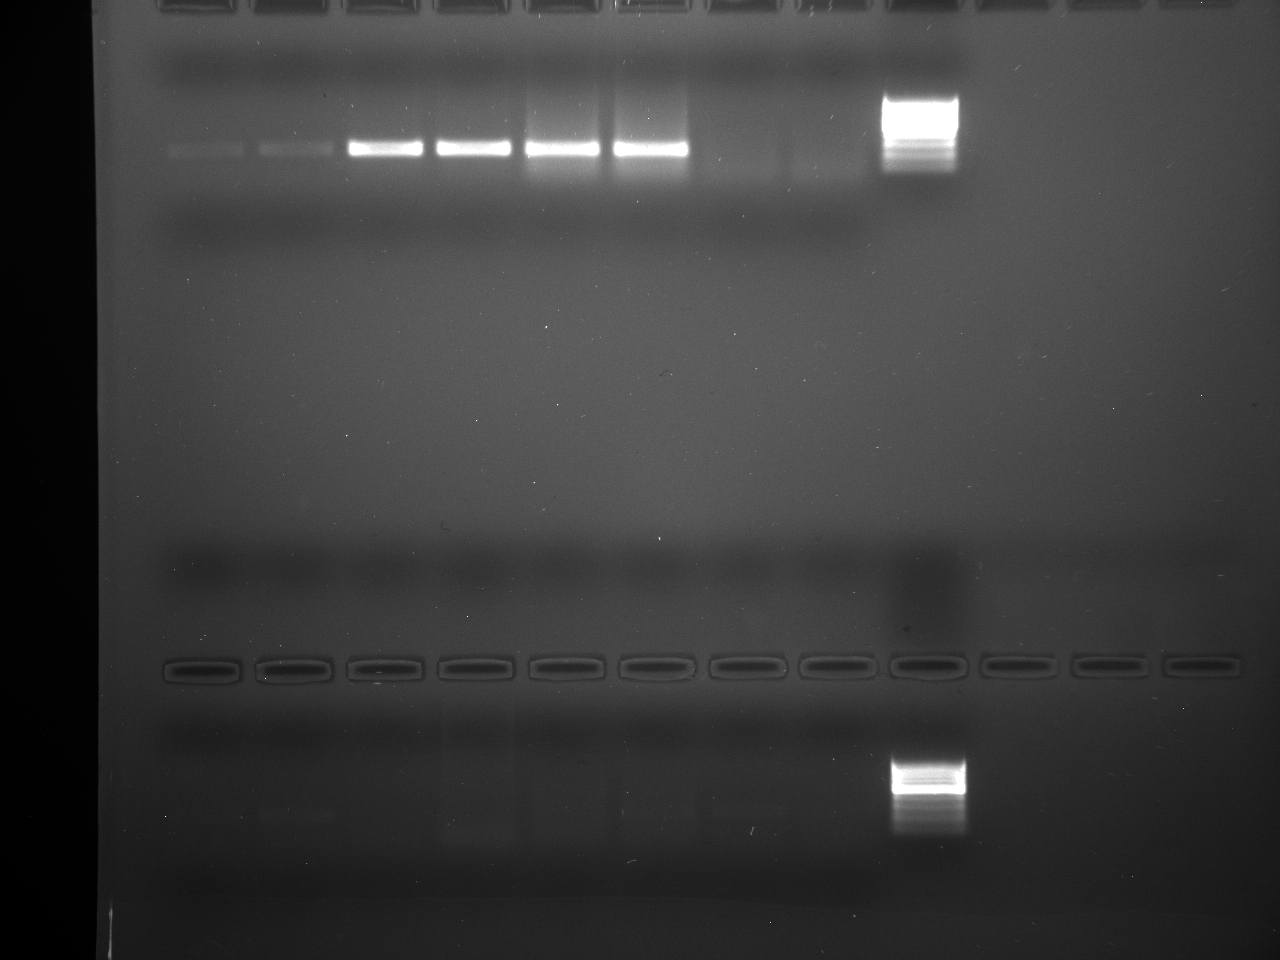
Row 1 (above) L-R: NTC, NTC, OZ,OZ,OH,OH,Pg, Pg, DNA ladderRow 2 (below) L-R: NTC, NTC, Rp,Rp, Mt, Mt, Cg, Cg, DNA lader
Geoduck Primers
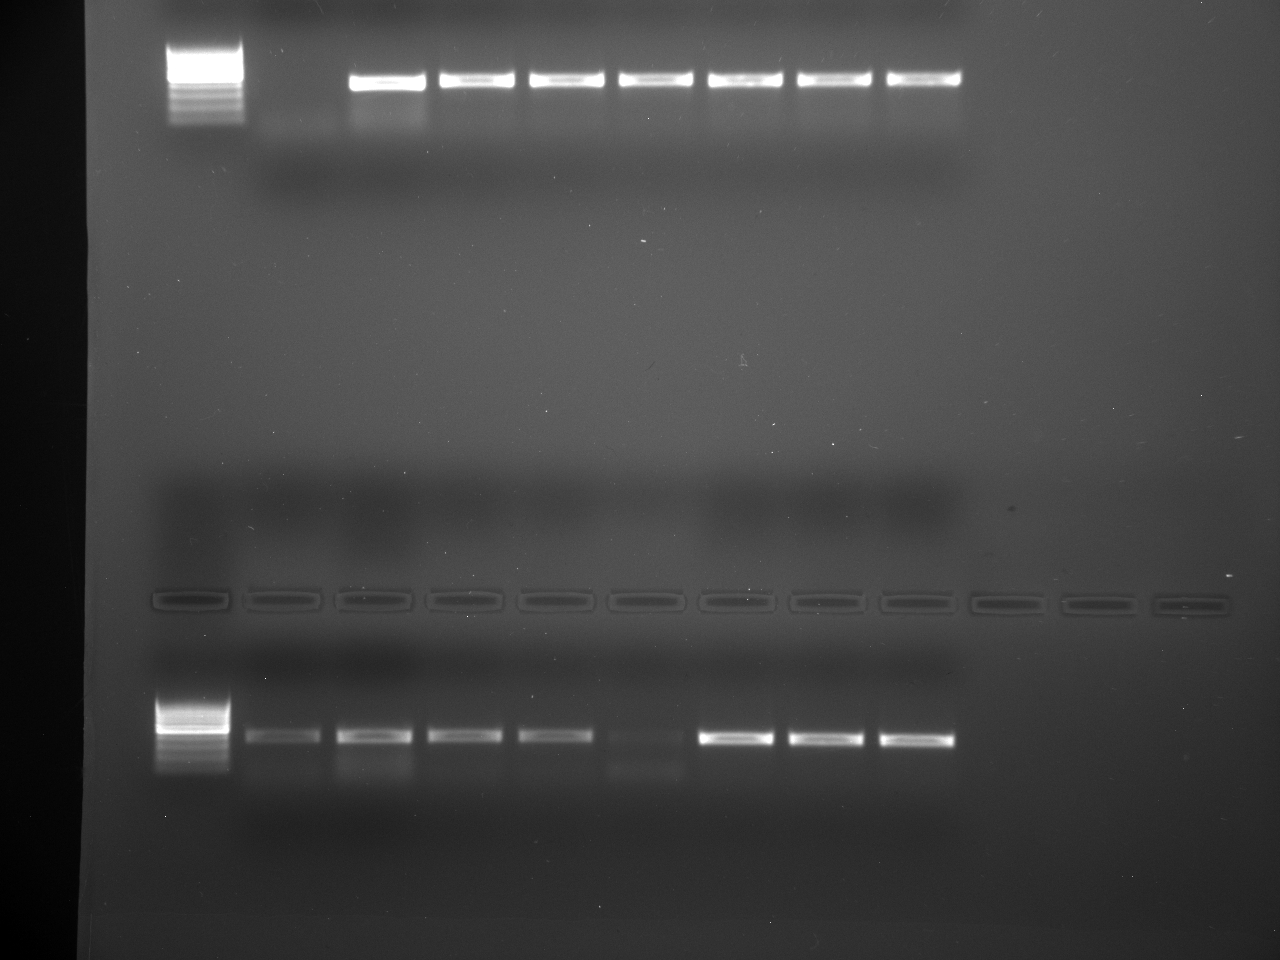
Image above is of gel processed using Geoduck primers and different DNA isolations from various inverts to test for primer specificity. The top set of products are set up from L-R as Ladder, NTC, Pg, 1,1,1,2,2,2. These products show amplification not only with the geoduck DNA that was used as a template control but in all other wells as well. The bottom products are set up from L-R as Ladder, NTC, Pg, 4,4,4,6,6,6. These products show amplification in the least three wells which is DNA isolation 6 (Acorn barnacle). There is a less amplification in the template control and some amplification or primer dimer in all other wells including the no template control aside from DNA isolation 4 rep 3.
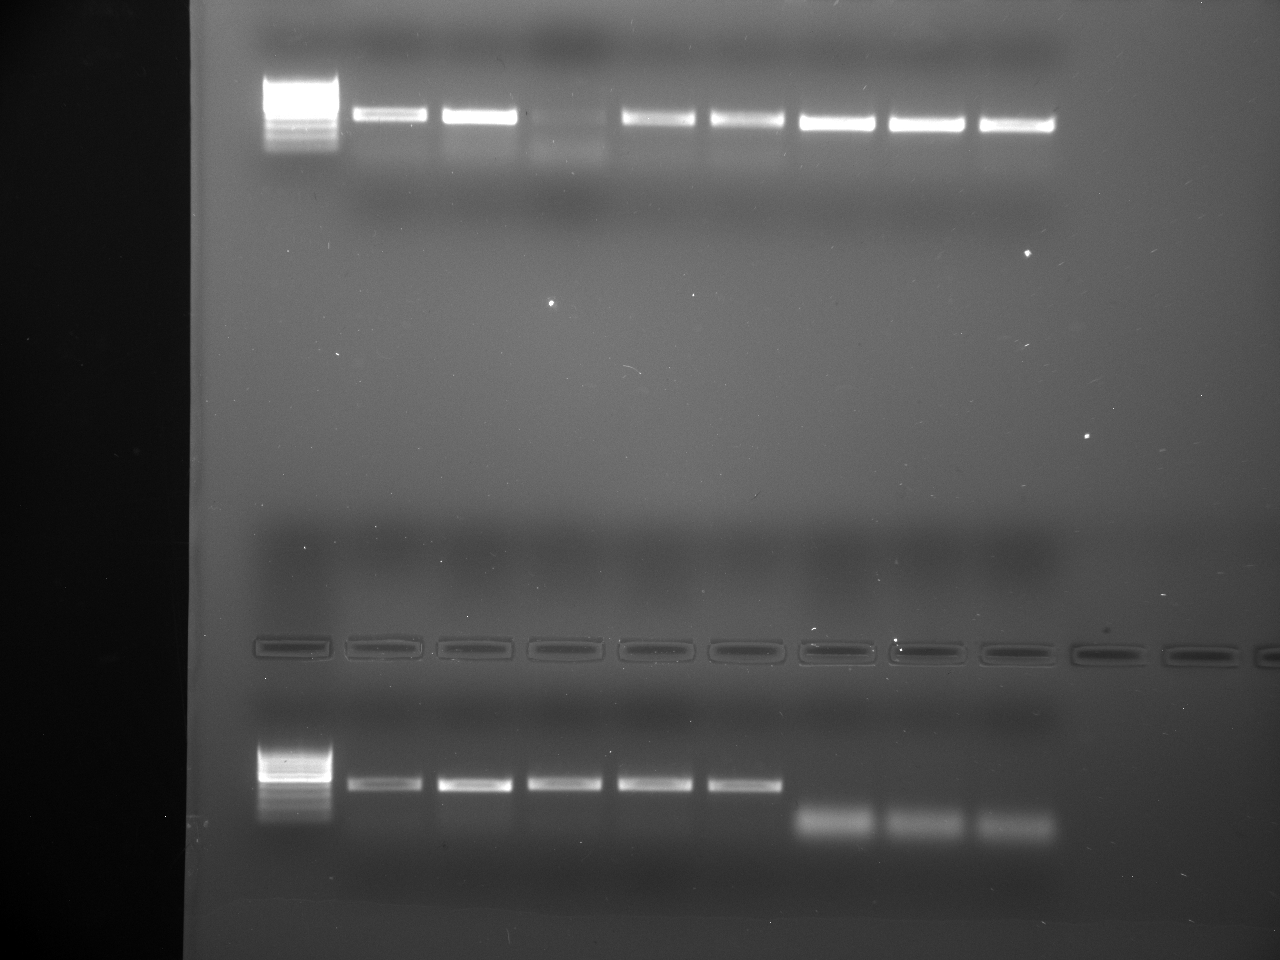
Image above is of gel processed using Geoduck primers and different DNA isolations from various inverts to test for primer specificity. The top set of products are set up from L-R as Ladder, NTC, Pg, 7,7,7,8,8,8. These products show amplification not only with the geoduck DNA that was used as a template control but in all other wells as well aside from DNA isolation 7 rep 1. The bottom products are set up from L-R as Ladder, NTC, Pg, 12,12,12,13,13,13. These products show possible amplification in the first five wells which would be the NTC, TC, and DNA isolation number 12 (red rock crab).
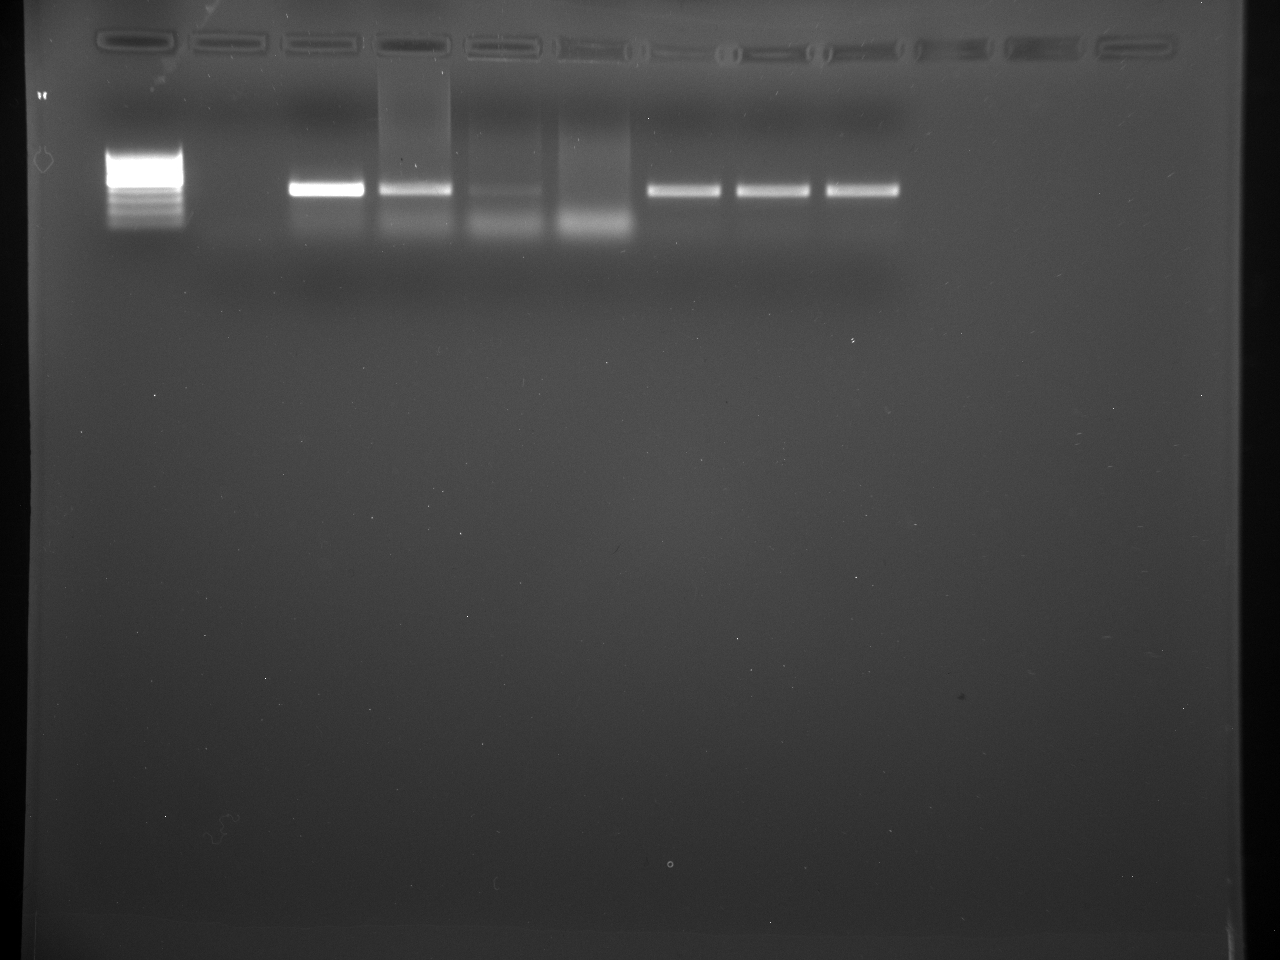
Image above is of gel processed using Geoduck primers and different DNA isolations from various inverts to test for primer specificity. The top set of products are set up from L-R as Ladder, NTC, Pg, 14,14,14,15,15,15. These products show amplification with the geoduck DNA used as a template control and possible primer dimers in the test groups. DNA isolation 15 (moon snail) reps 1,2, and 3 show a pretty distinct product though so I'm not sure if this is amplification or not. The same goes for DNA isolation 14 (frilled dogwinkle) rep 1.
Future steps:
We will do all Pg primer cross testing again in the morning. Since some of the lids on the strip tubes popped off during the thermocycler processing, this may have contaminated some of our reactions (?). We will make new aliquots of geoduck primers to test with.
UWT- Becker LabParticipants: Smithhisler
7/27/2015
Catching Oly primers up with other primers by testing them with Rp, Mt, Cg, and Pg DNA as well as Oly DNA.
Created by: Smithhisler (With McCartha edits in Bold)
Goals:Run PCR and gel electrophoresis using Oly primers and Pg, Rt, Mt, and Cg DNA used in previous PCR reactions
Methods:Master Mix Preparation
I multiplied PCR ingredients by 15 (3 wells per species, 4 species plus water= factor of 5) and accounted for 10% pipetting error in attached excel sheet. In a micro centrifuge tube, I pipetted 156.75µl of nuclease free water, 8.25µl of forward oly primer, 8.25µl of reverse oly primer, and finally added 206.25µl of Taq° green master mix.
PCR preparationI labeled two strips of 8-0.2mL PCR tubes with the following order:Strip 1: W W W Pg Pg Pg (Blank) MtStrip 2: Rp Rp Rp Cg Cg Cg Mt Mt
23µl of master mix was pipetted into each tube, except for the blank on strip 1.
Then, 2.0µl of the respective DNA (nuclease free water for the 3-NTC’s in strip 1) was pipetted into the according tubes. Finally, I took both strips to the Cline lab to be centrifuged before taking them to the thermal cycler for PCR.
Begin PCR of Oly primers and DNA prepared 05/12/15I had to turn on the thermal cycler this morning, but did not wait for a specific amount of time for the machine to “ready”. I ran the Bonnie program named Pg_4-24-15 and checked yes for a heated lid. The cycle began at 8:32am and finished at 10:19am, however the PCR products were left to sit in the thermal cycler until gels were prepared at….. These are the steps of the PCR reaction for the Pg_4-24-15 program as listed below. These samples were removed from the thermocycler and placed in the Fridge after they had been completed.
Step 1) 95.0°C-10 minutes
Step 2) 95.0°C-20 seconds
Step 3) 55°C-20 seconds
Step 4) 72°C-30 seconds
Step 5) Repeat steps 2-4 39 more times (40 times total)
Step 6) 72°C-2 minutes
Step 7) Hold at 4°C forever
Preparing 1.2% agarose gel: (3)
- Zero weigh boat on analytical balance
- Measure out ~1.2g of agarose powder for each gel
- Measure 100mL of TAE-1X buffer pre-made at UWT (Made by: MM 05/25/15) in a 100mL graduated cylinder for each gel
- Pour 200mL TAE-1X from graduated cylinder into a clean 1000mL Erlenmeyer flask
- Add 2.4g of agarose powder, rinsing weigh boat with remaining 100mL 1X TAE and adding to flask.
- Swirl solution and weigh before heating
- Place/stuff Kimwipe gently covering top hole of flask and put in the lab 217 microwave
- Microwave flask for 30 seconds
- Using hot glove for protection, carefully take flask out of microwave and swirl to stir
- Replace in microwave and heat for another 30 seconds
- Continue this until solution had began to bubble and is clear with no particles remaining visible on the sides of the flask (3 minutes total)
- Mass of flask and solution (no Kimwipe) after heating: 500.5g
- Add 10µl per gel ethidium bromide
- Place 1.5mm side of comb into gel box
- Let gel solution cool in flask for 1-2 minutes
- Wipe gel molds with Kim wipe
- Slowly pour gel into electrophoresis gel block, making sure there are no visible bubbles or particles (1:19pm)
- Let 2 gels cool for 20 minutes
Preparing electrophoresisThe power supply was set to run at 100V for 30 minutes. After transferring the gels from mold to electrophoresis box (keep actual gel in the holder), I added 1X TAE buffer until gel was generously covered and buffer reached both electrical poles. Then I pipetted 10µl of the PCR product to corresponding individual wells, replacing the pipette tip for each well.Gel 1: -Well 1: DNA ladder (green) -Well 2,3: NTC (from strip 1, tubes 1 and 2) -Well 4,5,6: Pg -Well 7,8,9: Mt (well 7 was from strip 1, wells 8 and 9 were from strip 2 [9 and 8 accordingly]) Gel 2: -Well 1: DNA ladder (green) -Well 2: NTC (3rd tube in strip 1)-Well 3,4,5: Rp -Well 6,7,8: CgThe samples were “ran to red" beginning at 1:53pm. After run to completion, I removed the gels from each box by tilting slightly and gently to allow aqueous buffer to slide off from a corner. I then took gels to the computer with the UV camera to take photos.
Results:
 Gel 1 reads from L-R: DNA Ladder, NTC, NTC, Pg, Pg, Pg, Mt, Mt, MtIn gel 1 well 2, our water shows a very bright PCR product, whereas in well 3 there is nothing visible, as we would want. The next 3 wells were Pg, which look like a mix of primer dimer. However, the last 3 wells on gel 1 appear to have amplified a certain base pair length of DNA that is visible as a distinct band (it is higher than the primer dimer which traveled as far as the DNA ladder).
  Gel 2 reads from L-R: DNA Ladder, NTC, Rp, Rp, Rp, Cg, Cg, Cg
Gel 2 shows some discrepancies as all wells show a bit of primer dimer at the farthest point of travel (easily seen as the bands in wells 3 and 4). However, well 2 as the NTC appears to have a specific band of amplification, as well as wells 7 and 8. This brings up questions as to why all of the Cg wells did not have uniform amplification (in this case, well 6 should also have a specific band segment).
Michelle will perform PCR tomorrow testing the same primers and DNA samples and we will compare the results with today’s gel photos to determine if primers need to be more specific. The resulting product could be primer dimer but I'm concerned with the products being at varying lengths on the DNA ladder relative to different DNA templates. Other considerations is that some ingredient in the master mix could have gotten contaminated. Or maybe while placing DNA in the wells, there was some solution overflow? Tomorrow we will do this test again but using all new ingredients for the master mix.
5-25-2015UWT- Becker LabMcCartha
Finish digestion of all 8 samples for larval DNA and run all samples for PCRCreated by: Michelle McCartha
Goal:To run PCR on all samples collected for the early warning system of detecting larvae in two bays: Fidalgo Bay and Case Inlet.
Methods:In the lab, turned hot plate up to 95 degrees C for the last hour of digestion. Once digestion complete set aside for cool down. Prepared master mix for Cg, Rp, and Pg primers to run all samples.
8 different DNA samples (for each well from L-R: NTC (2), Hatchery collected larvae (2), Sample collection(2), Control using adult specimen DNA(2))3 samples with larvae to test for amplification of respective DNA (9 gels total)24 total reactions (multiply standard mix by 24 as shown below)
For each Primer :
| Master Mix Solutions |
Standard volume (μL) |
Multiply By |
new volume |
|
add pipette error |
Final volume to add (μL) |
| Master mix |
12.5 |
24 |
300 |
30 |
330 |
330 |
| FWD Primer |
0.5 |
24 |
12 |
1.2 |
13.2 |
13.2 |
| Rev Primer |
0.5 |
24 |
12 |
1.2 |
13.2 |
13.2 |
| Water |
9.5 |
24 |
228 |
22.8 |
250.8 |
250.8 |
- Prepared solutions by adding water then primers and last master mix.
- For preparation of 8-strip tubes set up from L-R as NTC, NTC, H sp. H sp. (sp. for each species used from sample collected from hatchery), Sample sp. Sample sp. (using sample site and species testing for), Control, Control (from adult species for a positive control).
- Used Hatchery species to test digestion method as well as to test PCR amplification using the digestion method to make sure any larvae in the sample would show amplification if present.
- Used adult specimen as a positive control to make sure primers working.
- Used NTC to make sure PCR working
- Added 23μL of prepared master mix to each tube in 8-tube strip. To each tube then placed 2μL water in the first tube then 2 μL hatchery samples to tubes 3,4, then 2μL sample to tubes 5,6 and lastly 2μL of adult DNA to tubes 7,8.
- Did this for all primers and all three samples that were processed for DNA isolation.
- Ran in thermocycler under program labeled Bonnie.
- Could only run 8 samples on thermocycler so left out Case inlet manila clam sample which will be run 5-26-15
- Prepared 8 1.2% agarose gels using1000L of 1XTAE buffer solution and 12g agarose.
- Separated in 2 batches of 500mL and 6g agarose for ease of microwaving and pouring.
- Poured gels and set up gel boxes.
- Once gels cooled, placed gels in gel boxes and poured 1XTAE buffer into gel boxes until gels just covered.
- Once cycler done pipetted 10μL of DNA ladder in the first well of each gel.
- Pipetted 10μL of each reaction into respective gels in order from left to right as listed: NTC, NTC, H sp. H sp. (sp. for each species used from sample collected from hatchery), Sample sp. Sample sp. (using sample site and species testing for), Control, Control (from adult species for a positive control)
- Ran gels at 100V for 30 minutes.
- First three images using geoduck primers (Case Inlet, Fidalgo Bay sample 1, and Fidalgo Bay sample 2 respectively) show amplification of geoduck DNA in Fidalgo Bay samples. Test for hatchery and control also show amplification of geoduck DNA.
- Images 4 and 5 using manila clam primers (Fidalgo Bay reps 1 and 2 respectively) do not show amplification of manila clam but possible primer dimers present. Hatchery and control reactions show amplification of manila clam DNA.
- Images 6, 7, and 8 using pacific oyster primers (Case Inlet, Fidalgo Bay sample 1, and Fidalgo Bay sample 2 respectively) Show possible primer dimers in Case inlet and fidalgo bay sample 2 gels and amplification in hatchery and control reactions. Fidalgo Bay sample 1 must have been set up wrong because no PCR product was present.
- Will re-run PCR on Fidalgo Bay sample 1 for Pacific oyster and Case inlet sample for manila clam in the near future.
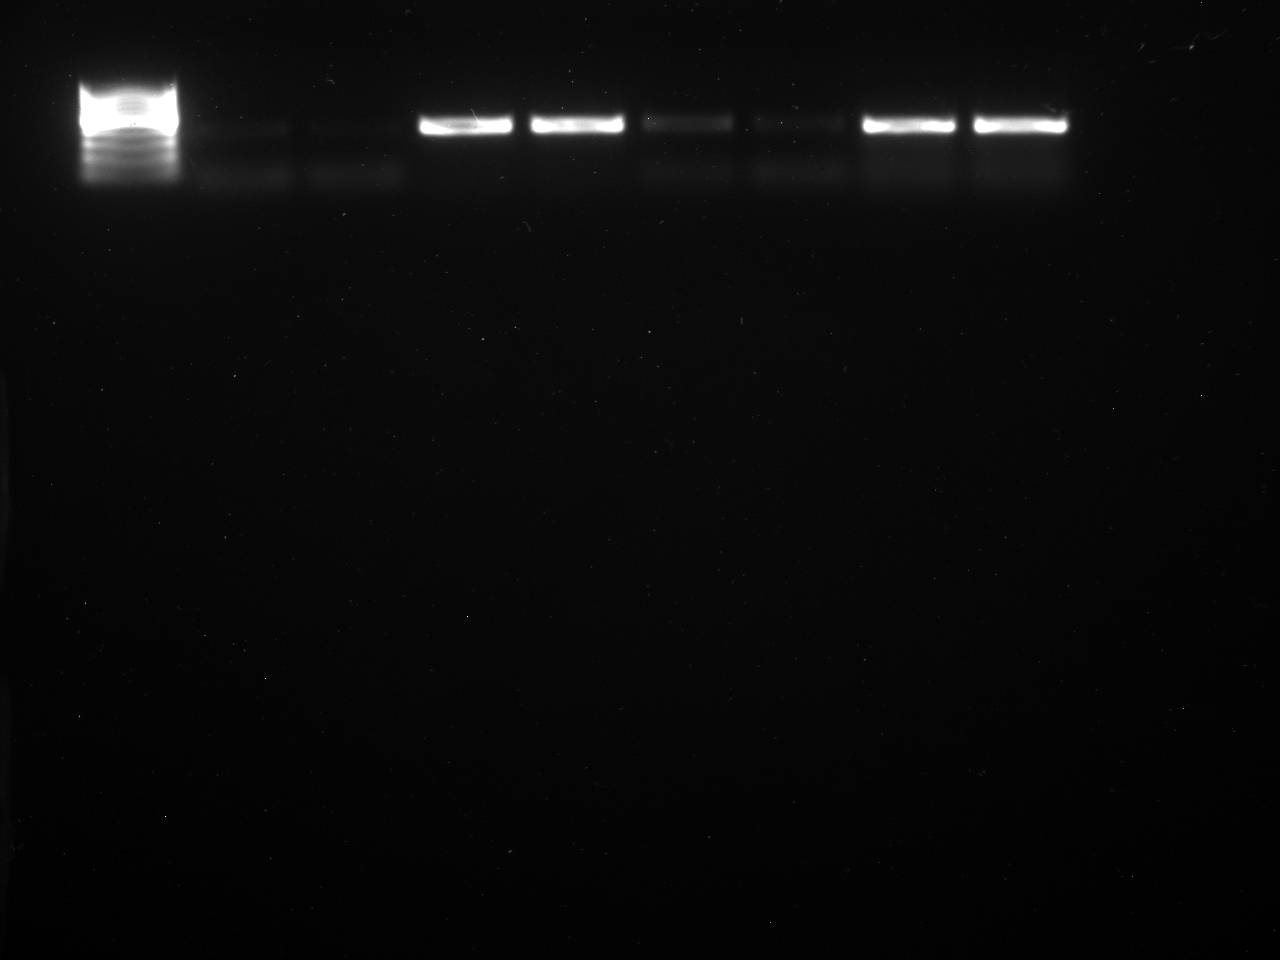
Set up from L-R: Ladder, NTC, NTC, hatchery geoduck larvae, hatchery geoduck larvae, Case Inlet sample, Case Inlet sample, geoduck template control, geoduck template control.
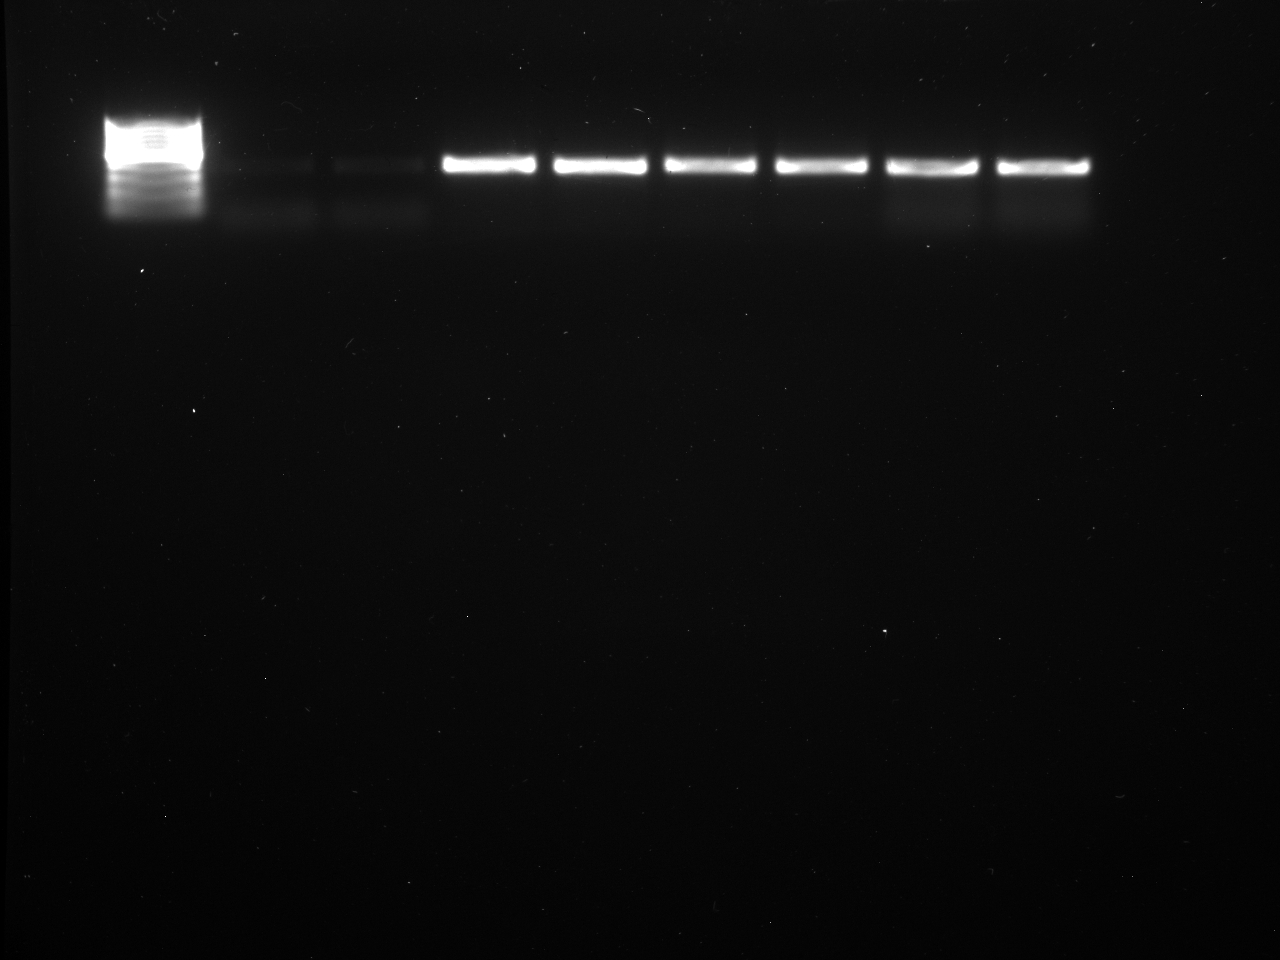
Set up from L-R: Ladder, NTC, NTC, hatchery geoduck larvae, hatchery geoduck larvae, Fidalgo Bay rep 1 sample, Fidalgo Bay rep 1 sample, geoduck template control, geoduck template control.
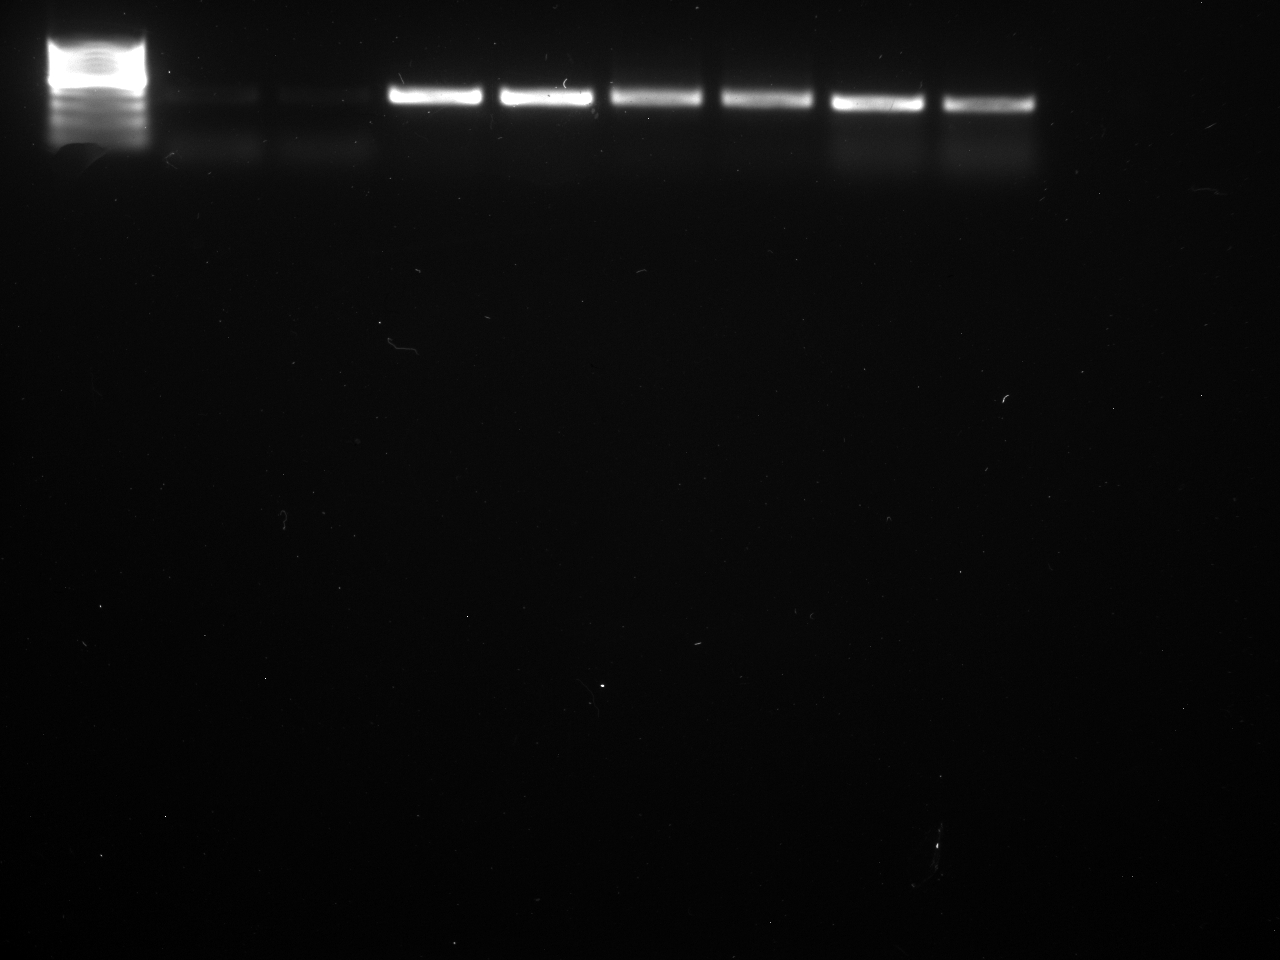
Set up from L-R: Ladder, NTC, NTC, hatchery larvae, hatchery geoduck larvae, Fidalgo Bay rep 2 sample, Fidalgo Bay rep 2 sample, geoduck template control, geoduck template control.
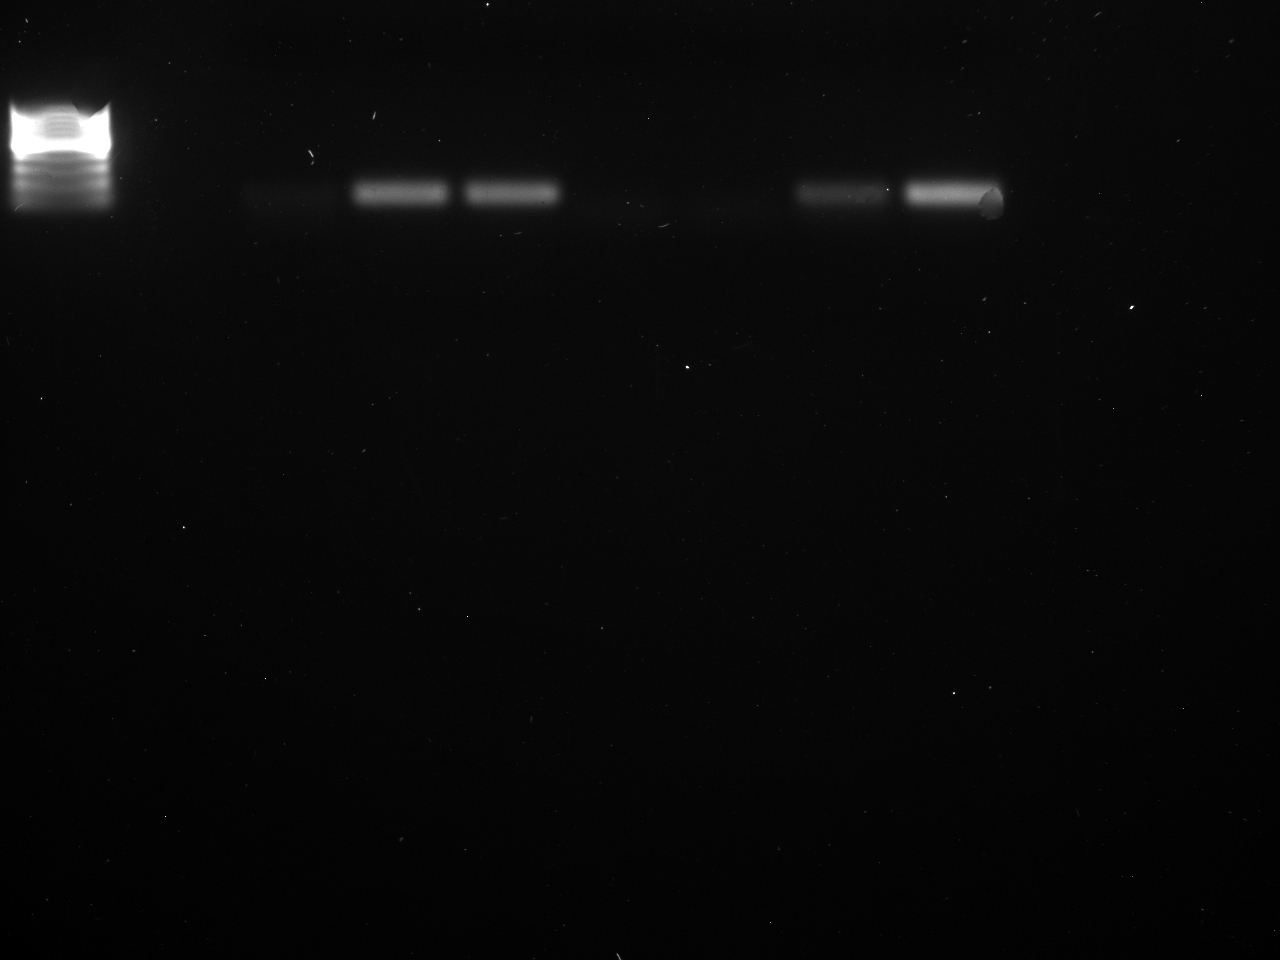
Set up from L-R: Ladder, NTC, NTC, hatchery manila clam larvae, hatchery manila clam larvae, Fidalgo Bay rep 1 sample, Fidalgo Bay rep 1 sample, manila clam template control, manila cam template control.
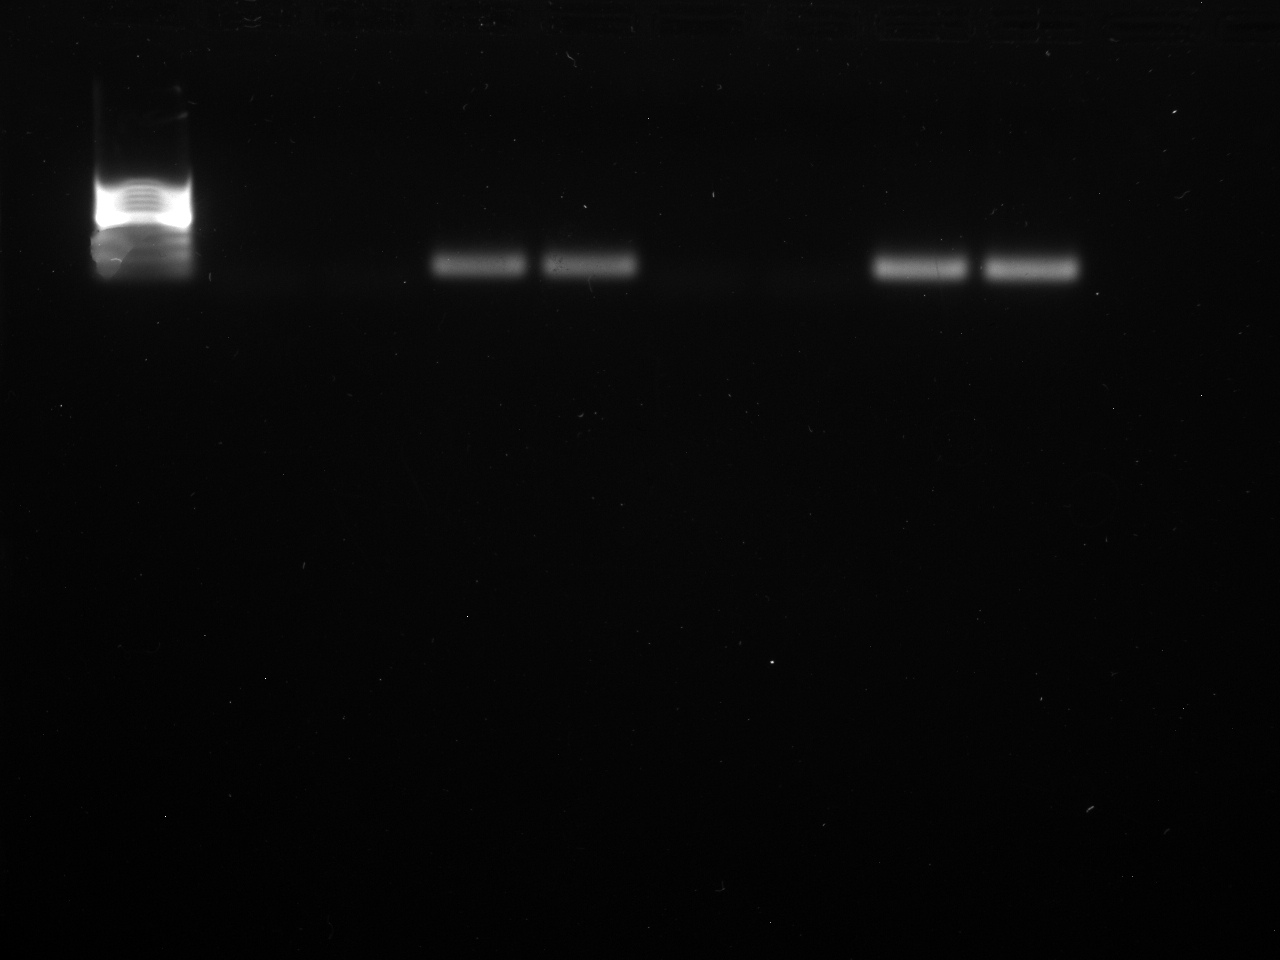
Set up from L-R: Ladder, NTC, NTC, hatchery manila clam larvae, hatchery manila clam larvae, Fidalgo Bay rep 2 sample, Fidalgo Bay rep 2 sample, manila clam template control, manila cam template control.
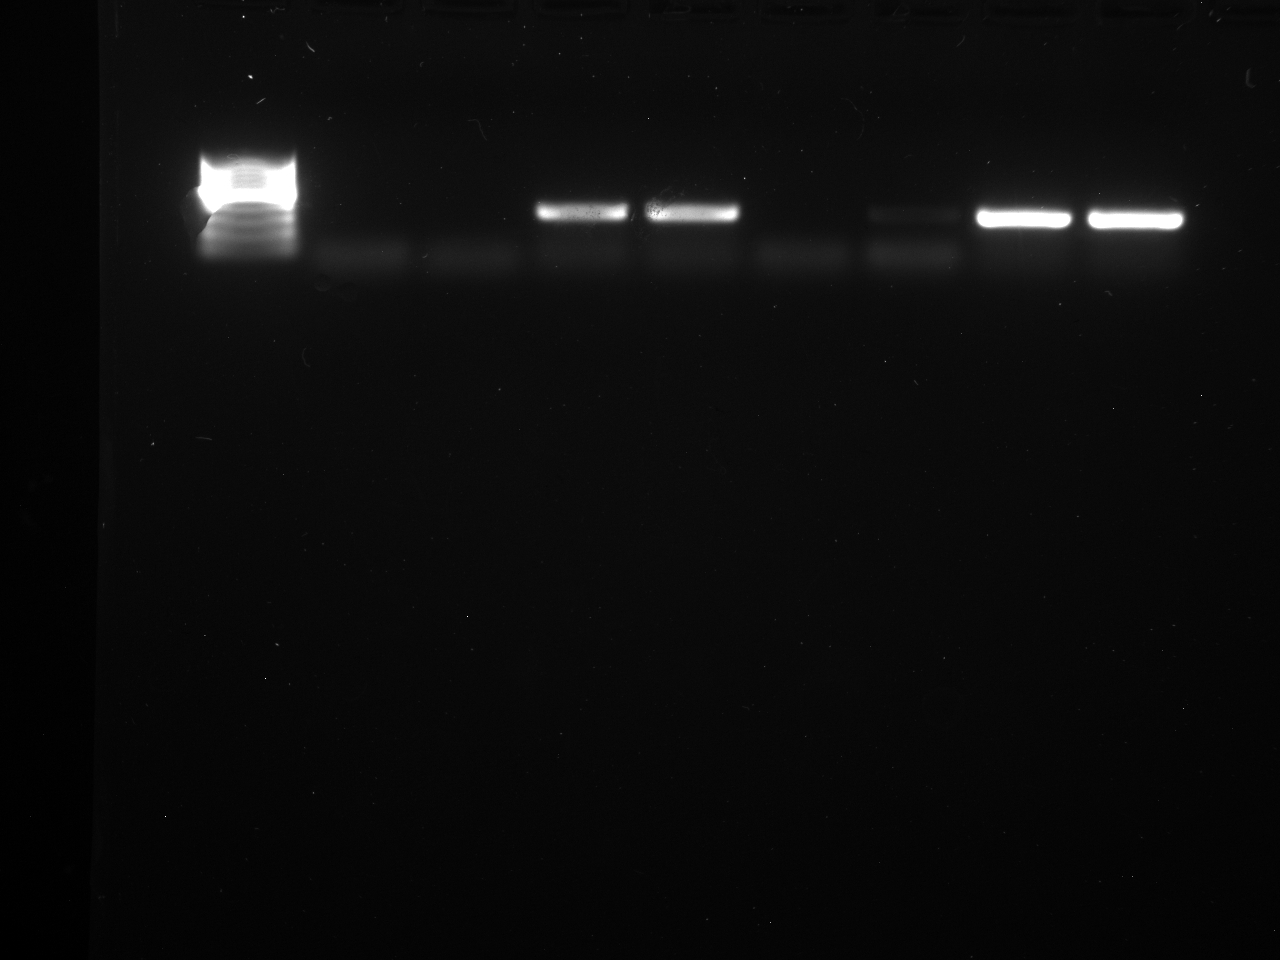
Set up from L-R: Ladder, NTC, NTC, hatchery pacific oyster larvae, hatchery pacific oyster larvae, Case Inlet sample, Case Inlet sample, pacific oyster template control, pacific oyster template control.
Set up from L-R: Ladder, NTC, NTC, hatchery pacific oyster larvae, hatchery pacific oyster larvae, Fidalgo Bay rep 1 sample, Fidalgo Bay rep 1 sample, pacific oyster template control, pacific oyster template control.
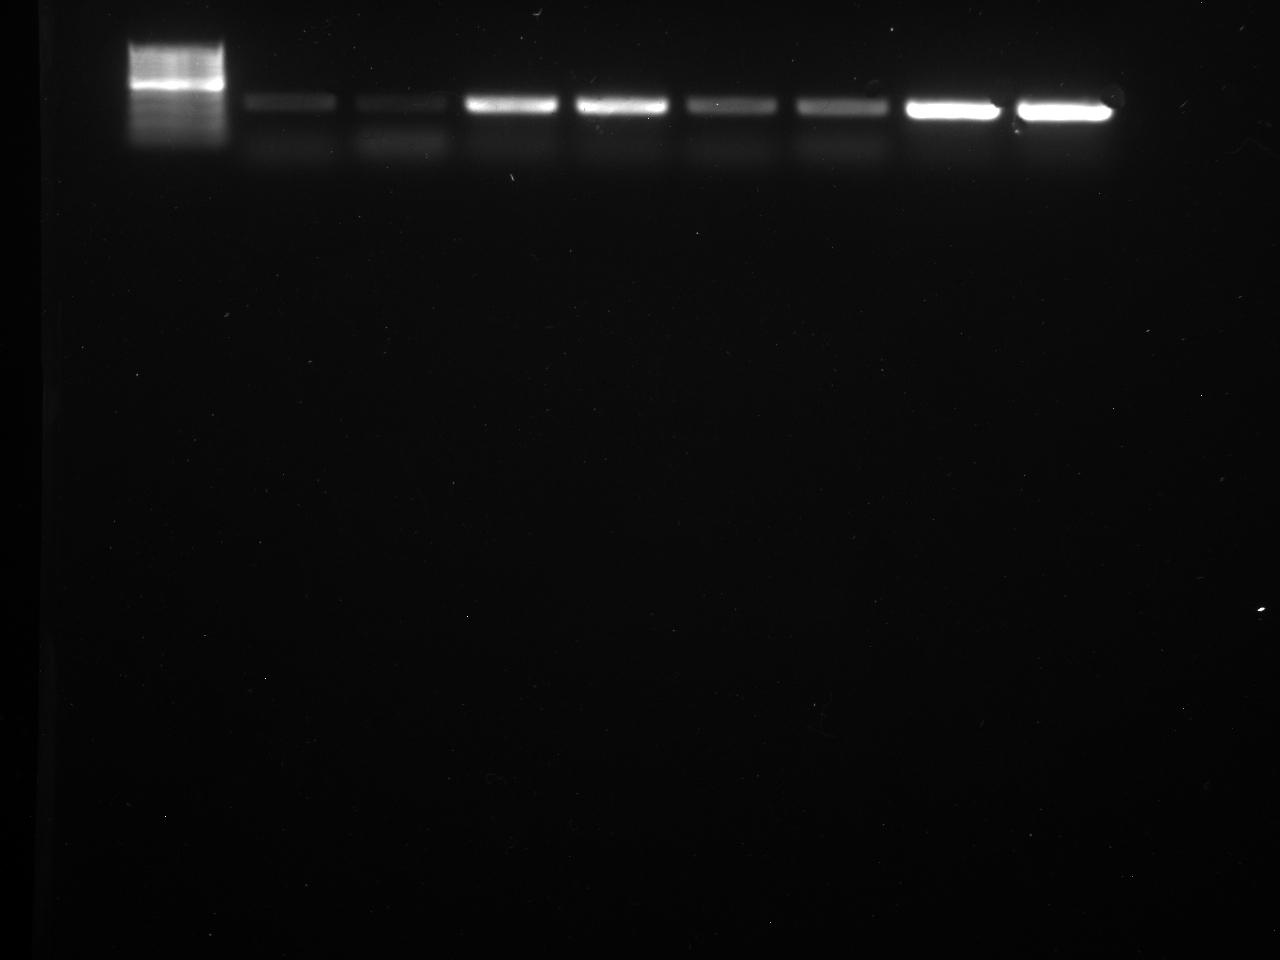
Set up from L-R: Ladder, NTC, NTC, hatchery pacific oyster larvae, hatchery pacific oyster larvae, Fidalgo Bay rep 2 sample, Fidalgo Bay rep 2 sample, pacific oyster template control, pacific oyster template control.
5-24-2015UWT- Becker LabMcCartha
Lab Report: Start digestion processing using pK solutionCreated by: Michelle McCartha
Goal:
- To start the digestion process for all samples (1-8) that were gathered 5-23-15.
Methods:
- Removed samples and verified that all ethanol had evaporated.
- In fridge, took out pK solution previously prepared by Megan Hintz.
- Went into Cline lab and retrieved hot plate.
- Plugged in hotplate and started defrosting pK solution by hand friction while intermittently cooling with hot bath.
- Once solution defrosted, pipetted .5mL to each sample and placed in hotplate set to 56 degrees C.
May 23, 2015UWT- Becker LabMcCartha
Lab Report: Prep samples for digestion using pH solutionCreated by: Michelle McCartha
Goals:
- To paint pucks using clear gloss Helsman spar utethane.
- To do a quick resort to make sure all bivalve larvae are accounted for and set out to dry
Methods:PucksUsing a sponge brush and the Clear gloss applied the first coat to the pucks leaving the flat side of it unpainted (only painted the sides and the screw point of the pucks).Left in fume hood to dry overnight.
LarvaeWent through all samples from Case Inlet and Fidalgo Bay one mre time to make sure that no larave was left behind. Took samples that were collected in centrifuge tubes and made sure that they were all bivalve larvae and recounted them. Pulled hatchery larvae from preserved samples that we will be using for standards which will digest to test digestion process and PCR on actual larvae samples for manila clam, pacific oysters and geoduck. Placed all samples in respective labeled 2mL centrifuge tubes and set in fume hood to dry overnight.
Below: Table of sample and quantity of larvae in sample that will be digested and used for PCR.
| Sample ID number |
Species description |
Quantity in sample |
| 1 |
1 day old Manila clam |
20 |
| 2 |
3 day old Pac Oyster |
11 |
| 3 |
10 day old Pac Oyster |
25 |
| 4 |
18 day old Pac Oyster |
20 |
| 5 |
16 day old Geoduck |
18 |
| 6 |
Case Inlet cumulative from all replicates |
2 |
| 7 |
Fidalgo Bay rep 1 |
8 |
| 8 |
Fidalgo Bay rep 2 |
8 |
May 22, 2015UWT- Becker LabMcCartha
Lab Report: Sorting Fidalgo Bay Samples from 5-21-15Created by: Michelle McCartha
Goal:
- To remove pucks from orange caps.
- Go through Fidalgo Bay samples for bivalve larvae.
Methods:Pucks
- Removed all pucks from orange cap molding.
- Noticed that a few of the screws were off set in the dried molding. Need to consider making sure that the screws can not move and are perfectly straight next time.
- Chose 24 of the pucks (ones that were less off set than others) that will use in the field and labeled them using sharpie marker( see attached excel file at bottom).
- Made weigh boat with matching label for each puck.
- Will need to paint pucks prior to weighing them for starting weight before putting them in the field.
- Using a polarized-lens microscope (3mm across whole FOV @ greatest magnification) searched for bivalve larvae by visually analyzing cross-patterns.
- Found in the first sample 8 bivalve larvae, in the second sample 8 bivalve larvae and in the third sample no larvae. Placed each larvae set in respective 2mL tubes with a little amount of ethanol and set aside for future digestion of tissues for DNA.

42.5 KB
May 21, 2015UWT-Becker LabMcCartha and Smithhisler
Lab Report: Field equipment gathering and Sorting Case Inlet samplesCreated by Michelle McCartha
Goal:
- Find and test necessary tube traps
- Make pucks
- Sort samples from case inlet again to make sure nothing missed
MethodsTube Traps
- Found tube traps in the outside storage of UWT that belongs to the Science Building nlocated near the loading dock.
- Brought them into the lab and filled each tube (approx. total 300) 3/4 full with tap water and arranged on available counter space and let sit to determine if any are leaking
- As filling, any tubes noticeably leaking were set aside for repair.
- As tubes were found leaking on the counter, pulled and set aside for repair.
- Allowed tubes to sit for approximately 4 hours before determining they were good for field use with out repair.
Pucks
- Located puck materials which include 4 inch stainless steel crews of about 1/3 of an inch in diameter, orange 4 inch diameter caps, dental chalk, 1 quart mixing container, paint stirrer, tap water, 1X4.5 inch cut up pieces of card board.
- Cut holes in card board and placed screw in the hole allowing less than an inch of the screw from the top to be seen on one side.
- Used a kids beach shovel to scoop out four scoops of dental chalk and placed in mixing container.
- Added water while mixing until reached a "thicker than latex paint" consistency.
- Poured into caps slowly tapping the cap down on counter once to make sure evenly distributed in cap, then pouring unto almost completely full.
- Tapped cap down again to make sure even.
- Added cardboard/screw piece so that the head of the screw was in the center of the cap and in the mixture by about 1/2 of an inch allowing the cardboard to rest on the edges of the cap which prevented the screw from sinking deeper into the mixture. Allowed to sit overnight.
- Made a total of 35
Sorting Case Inlet Samples
- Sorted through all Case Inlet samples again and found two larvae in rep 2 sample. Aside in a small amount of ethanol in a 2 mL tube for later digestion.
May 20, 2015UWT-Becker LabMcCartha and Smithhisler
Field Report: Case Inlet samplingCreated by Michelle McCartha with notes added form Brenda Smithhisler
Goal:
- To determine if larvae are in the water.
- To perform a test run through of sampling methods that will be used during field sampling for pumping and filtering larvae.
Methods:Prepared 500mL 95% ethanol with with to preserve the samples we will collect.
- 25mL water to 475mL EtOH.
Site descriptionCase Inlet at the time of arrival (1:00pm) was decreasing in tidal height. There is a small parking area off the left side of the road as driving north which allows up to 6 cars to park easily. From there, a small trail with a slight incline is off to the northern side of the parking lot. We walked out to sample from this pathway. The bay on it's eastern side is littered with aquaculture production so being careful not to step on nets and other aquaculture gear is important. Was approached by fishery workman and was told as much as well as was advised of a good area to go out and sample from so we took his direction.
Sampling procedures
Start time 1:30pm
- We placed the pump so it sits up inside the the tub so it would not get wet and pushed the tub into the water
- We were able to get approximately 3/4 of a meter into the water which may have limited our sample output.
- The filters were arranged so that the 333μm filter was on top and 78μm filter on the bottom being held together by a connector piece.
- turning the pump on and allowing the intake come from the sea water and the output going into the filters.
- The intake tube was held approximately 1-2 feet into the water
- Time was being kept by a gopro camera recording.
- The pump ran for 10 minutes (10min equals approx. 10L of water).
- When complete, the samples were taken to the beach and the filters were removed from each other.
- Using seawater, we isolated the sample in the 333μm filter and collected using ethanol into a 50mL labeled centrifuge tube by holding the tube in place and angling the filter face down toward the tube while squirting ethanol from the mesh.
- This process was done for the 78μm mesh as well.
Brenda's notes
Notes from samples:
Rep 1-tide going out
Rep 2-slow tidal movement (in transition from out to in)
Rep 3 (and 4) taken in area containing algae area, also as tide was coming in
Polarized-lens microscope: 3mm across whole FOV @ greatest magnification
1) Search for bivalve larvae by visually analyzing cross-patterns
- Overall, 333µm sieves for all reps did not present bivalve larvae
- Rep 1-copepod, lots of unknown egg-yolk like circles (~100 microns) [too big to be larvae—>undeveloped larvae (fish?)]
- Rep 1- 78µm sample contained gastropods
- Rep 2-sand, dirt
- Rep 3-dirt, arthropods, copepods, phytoplankton
- Rep 4-bivalve larvae
2) Use pipette to retrieve larvae and transfer into microcentrifuge tube.
3) Set all microcentrifuge tubes in hood with door held open (set bottle as a stopper to prevent hood from shutting).
4) Let dry overnight.
Suggestions for future sampling:
- Bonnie—> aim for high tide, especially slack tide
- larvae want to feed when water will not cause stress + they can "maintain position in estuary"
- try to find dock for deeper sampling
- longer sampling time?
May 13, 2015
UWT- Becker Lab
McCartha
Lab Report: Performing PCR on samples from May 12, 2015
Created by: Michelle McCartha
Goal: To finish PCR runs from May 12, 2015 using DNA that was isolated May 11, 2015.
Methods:
- Retrieved PCR tubes that were stored in standard 4degreesC freezer in Becker Lab. Placed tubes in thermocycler and ran using program under Becker.
- Made 3 1.2% agarose gels.
- Placed 4 gels in 4 gel boxes (one from 5-12-15) and filled box until gel was just covered with 1X TAE buffer solution.
- Once thermocycler completed took samples back to Becker Lab and started set up for PCR.
- Labeled each box with species name (Rp, Cg, Pg (P-1) Mix (P-2). For the "mix" gel box aside from the ladder and NTC wells, Pg, Rp, and Cg were added as this was what was in the prepared tubes.
- Pippeted place 10μL of each reaction and ladder into wells as follows mimicking the same set up for each gel with exception of the P-2 reaction set from L-R: Ladder, NTC, NTC, NTC, DNA, DNA, DNA (DNA for Pg, Rp, and Cg DNA isolated 5/11/15). For these gels, no DNA for once species was placed into a separately designated species gel box.
- For the P-2 samples the set up was from L-R: Ladder, NTC, NTC, Pg, Pg, Rp, Rp, Cg, Cg.
- Ran electrophoresis for 30 minutes at 100V.
Results Images and next steps
- Gels P-1 (first image), Rp (second image), and Cg (third image) showed normal amplification in DNA reactions and NTC showed no amplification (possible primer dimers).
- P-2 (forth image) showed no amplification in Pg reactions and visual amplification in Cg reactions. This could be because of the interactions of both Brenda and I contributing to this set of reactions however.
- Next we should test the specificity of the Pg primers on Rp and Cg DNA.
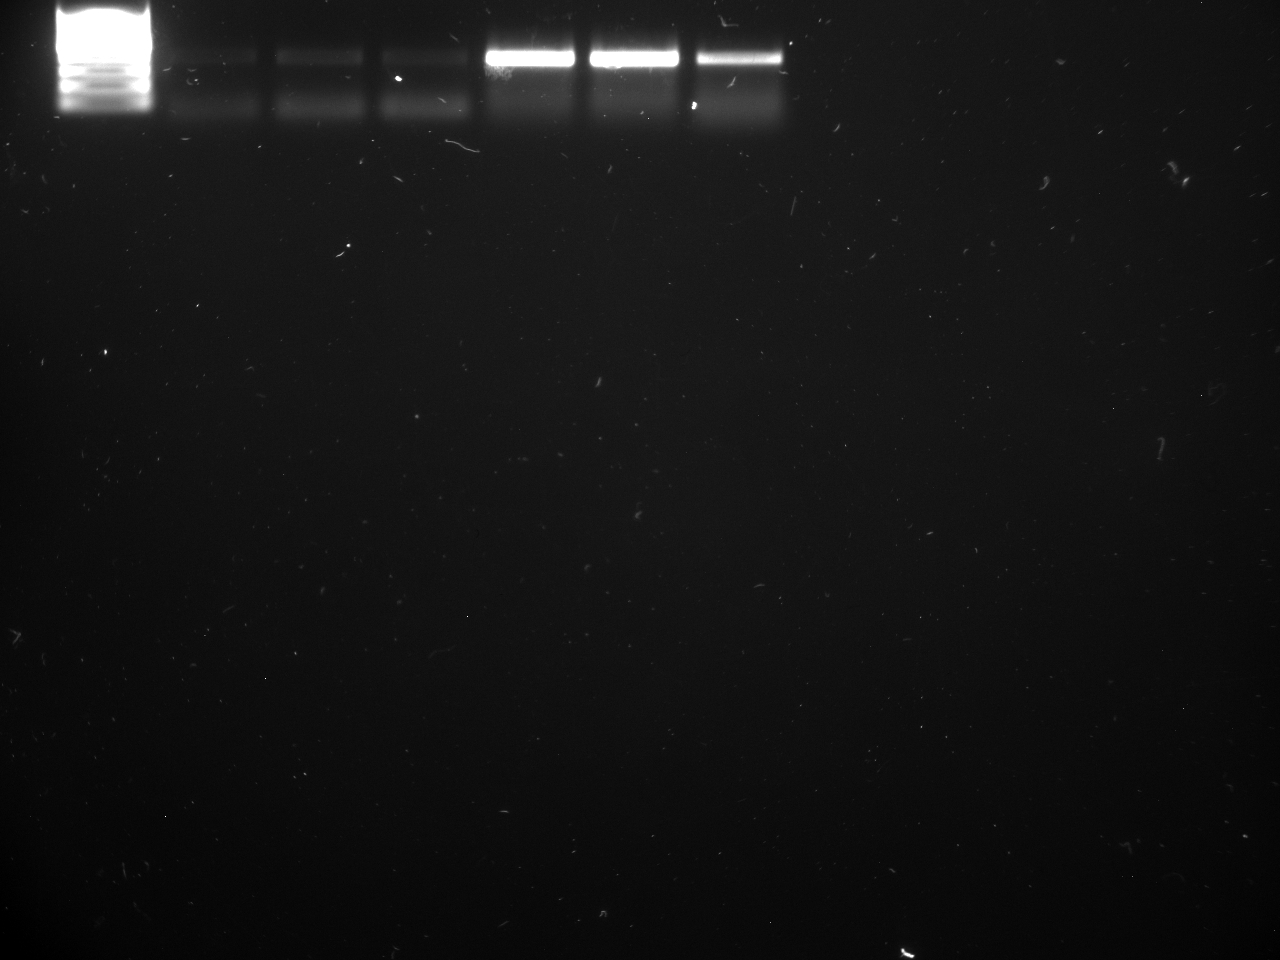
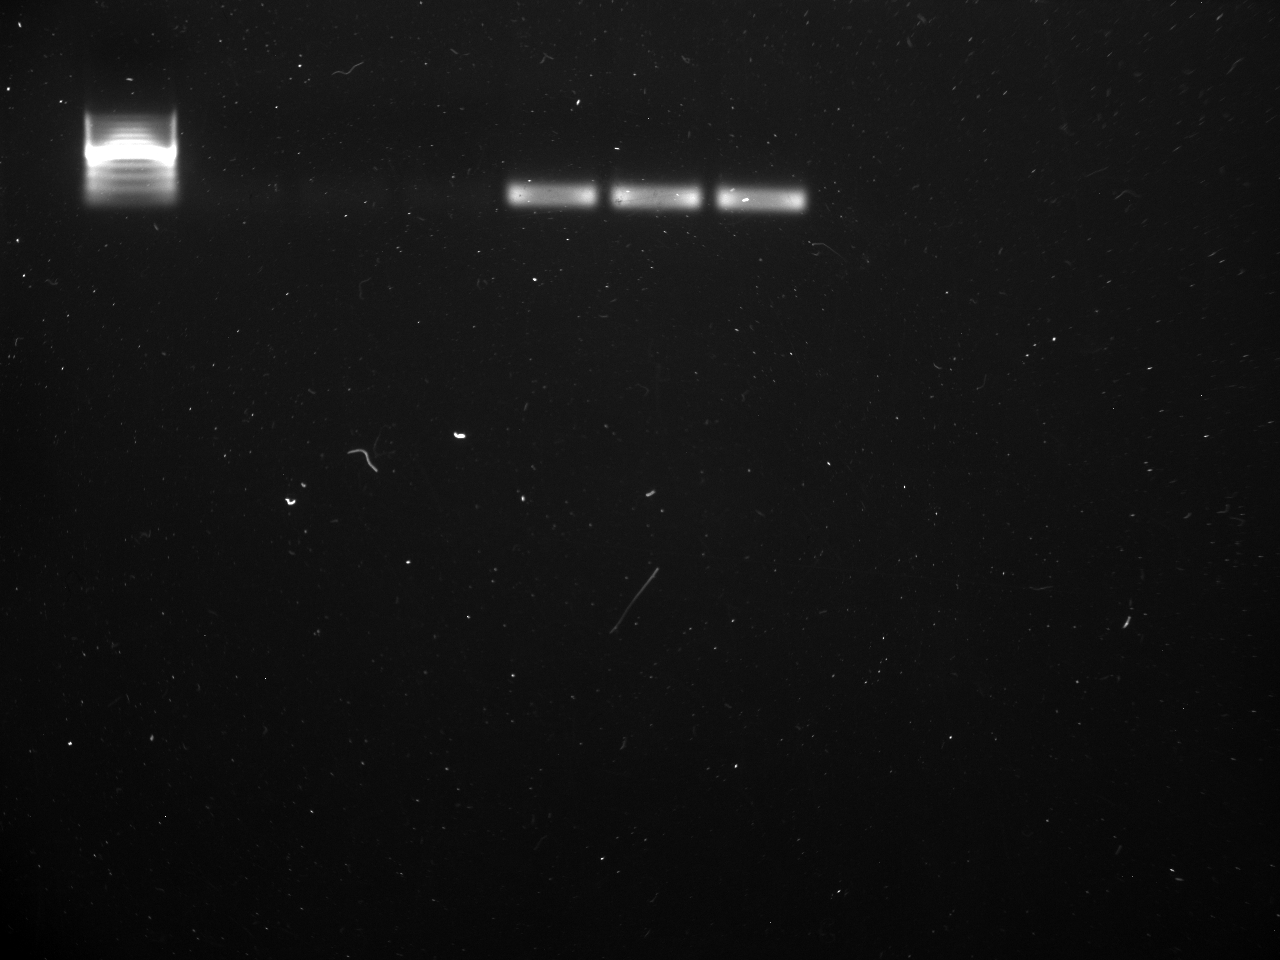
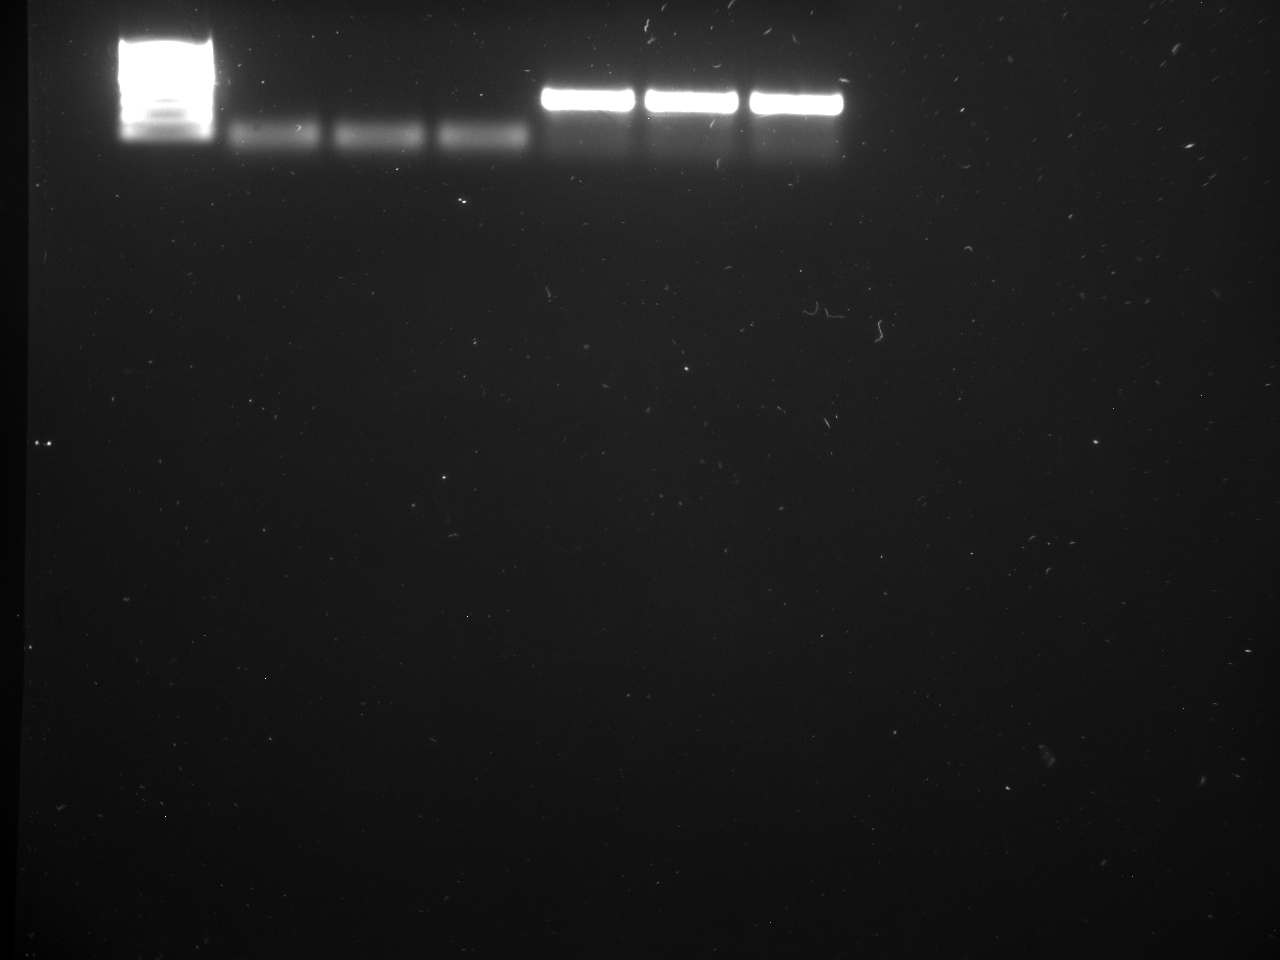
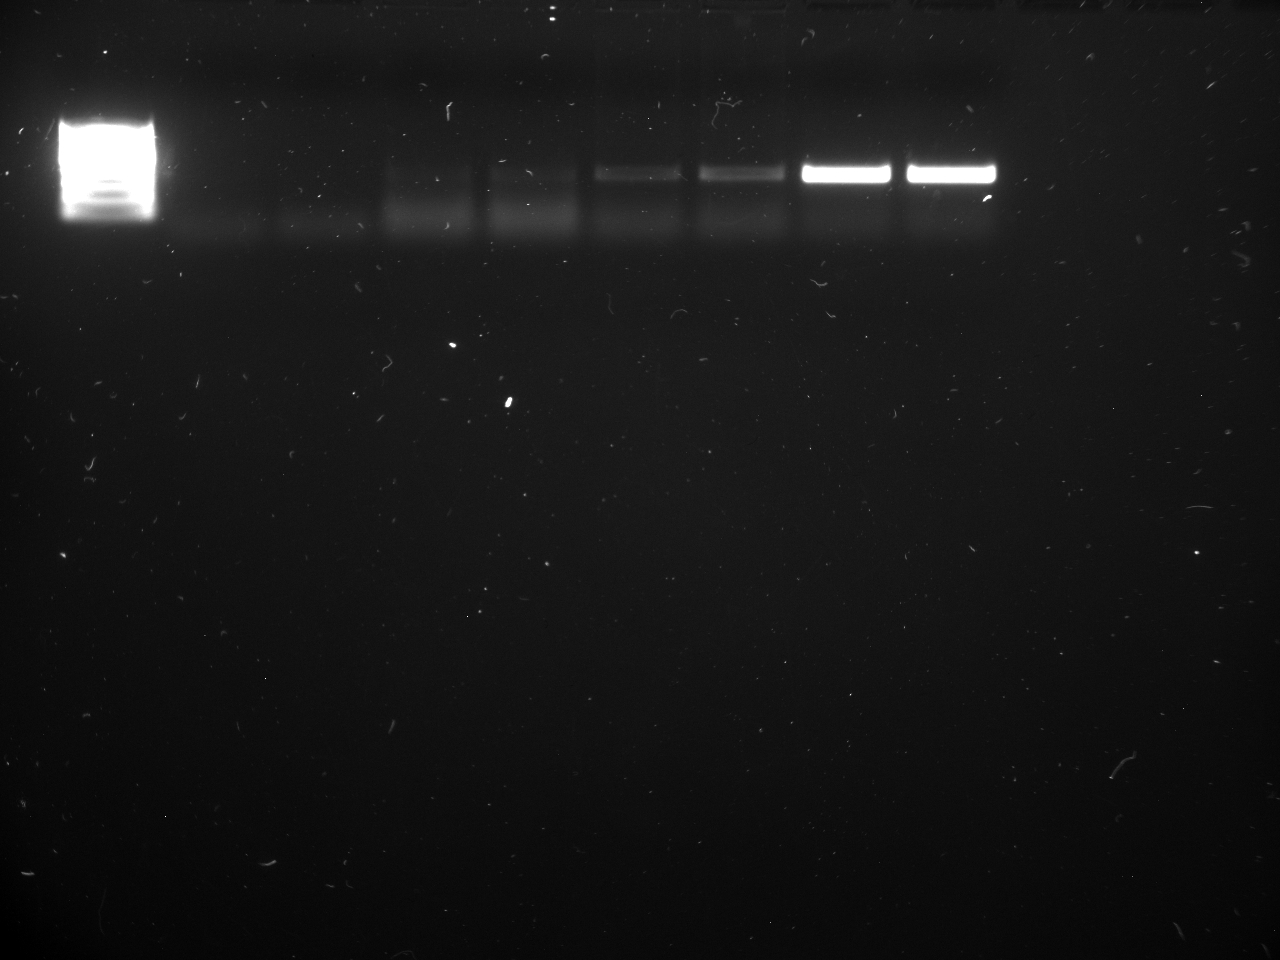
May 12, 2015
UWT- Becker LabMcCartha_Smithhisler
Lab Report: PCR, DNA isolation processes
Created by Michelle with edits from Brenda in Blue
Goal:
- To complete DNA isolation process that was started 5-11-15.
- To Perform PCR using NTC once more to test methods.
- To perform PCR using recently isolated DNA from Geoduck, Pacific oyster, and Manilla clam.
- Wanted to fill 4 wells and ladder for this PCR.
- Realized there was little master mix left so sent Micah and email to see about ordering more.
- Used volumes listed in table below to prepare master mix for NTC PCR.
| 8/12/15 |
NTC |
|||||
| Master Mix Solutions |
Standard volume (μL) |
Multiply By |
new volume |
|
add pipette error |
Final volume to add (μL) |
| Master mix |
12.5 |
4 |
50 |
5 |
55 |
55 |
| FWD Primer |
0.5 |
4 |
2 |
0.2 |
2.2 |
2.2 |
| Rev Primer |
0.5 |
4 |
2 |
0.2 |
2.2 |
2.2 |
| Water |
9.5 |
4 |
38 |
3.8 |
41.8 |
41.8 |
- Prepared Master mix by adding mix, then primers, then Water.
- Finger vortexed to mix then centrifuged solution down briefly.
- Pipetted 23μL of solution into 4 wells of an 8-tube PCR strip.
- To tubes 1,2 added 2μLog water (just to see if there is a difference in PCR if additional water added to NTC group makes a difference- Steven said it wouldn't).
- Placed in thermocycler on program named under Bonnie.
Brenda's notes on prep for PCR including making 1.2% gel and setting up Electrophoresis.Preparing 1.2% agarose gel: (3)
1) Zero weigh boat on top-loading balance
2) Measure out ~0.6g of agarose powder for each gel
0.6g x 3 gels = 1.8g
[exact mass=1.806g]
Agarose (Received UWT 04/23/15)
Fisher BioReagents
BP164-25
Lot 134655
3) Measure 50mL of TAE-1X buffer pre-made at UWT (Made by: MM, BS 04/16/15) in a 100mL graduated cylinder for each gel
4) Pour 50mL TAE-1X from graduated cylinder into a clean 1000mL Erlenmeyer flask
50mL per gel x 3 gels =150.mL total
-Note: measured 3 sets of 50mL in a 100-mL graduated cylinder
5) Add 1.8g of agarose powder
6) Swirl solution and weigh before heating
Mass of flask and solution (no Kimwipe) before heating: 459.3g
7) Place/stuff Kimwipe gently covering top hole of flask and put in the lab 217 microwave
8) Microwave flask for 30 seconds
9) Using hot glove for protection, carefully take flask out of microwave and swirl to stir
10) Replace in microwave and heat for another 30 seconds
11) Continue this until solution had began to bubble and is clear with no particles remaining visible on the sides of the flask
(2.5 minutes total)
12) Mass of flask and solution (no Kimwipe) after heating: 430.7g
Add 1X TAE buffer solution to Erlenmeyer flask until mass after heating equals
mass before heating (account for evaporation of solution to once again reach
1.2% concentration of agarose)
Final mass: 459.4g
13) Add 5µl per gel SyberSAFE dye
5µl x 3 gels =15µl
14) Place 1.5mm side of comb into gel box
15) Let gel solution cool in flask for 1-2 minutes
16) Wipe gel molds with Kim wipe and DI water
17) Slowly pour gel into electrophoresis gel block, making sure there are no visible bubbles or particles (10:10am)
*Had leak in first box, only able to make 2 gels out of the agarose solution
18) Let 2 gels cool for at least 15-20 minutes
Preparing electrophoresis of NTC w/Pg primers:
1) Set box to 100V
2) Set time to 30 minutes
3) Pipette 10µl of PCR product to corresponding individual wells, replacing pipette tip for each sample/well
-Well 1: DNA ladder (green)
Thermo Scientific-Mass Ruler Low Range DNA ladder, ready-to-use
60.8ng/µl, 500µl. #SM0383 Lot 00251093
-Well 2-3: NTC
-Well 4-5: H2O
4) Turn on power source (10:58am) and let run for 30 minutes
5) Remove gel from box, tilting slightly to force aqueous buffer to slide off corner
5) Place gel on UV light source and take photos in UV light (11:35pm)
Wells in photo read 1) DNA ladder, 2+3) NTC, 4+5) Water. Photo shows slight primer dimer in all 4 samples but no PCR products.
Completing DNA isolation
- Made 50mL 70% EtOH solution by adding 35 mL of EtOH to 15mL ultra pure water.
- C1 V1 = C2 V2
- (.70EtOH)*(50mL)=(1EtOH)*(XmL)=35mL EtOH
- Inverted DNA in DNAzol solution frequently in the morning to keep the solution and tissue samples in the solution moving.
Want 10mL of a 70% DNAzol 30% ethanol solution
Ethyl alcohol 200 proof anhydrous 99.5+%
ACROS CAS#64-17-5
Lot: B0529679
Received UWT 04/23/15
1) Measure 3mL of 200 proof ethanol in a 10mL graduated cylinder using plastic transfer pipette
2) Pour 7mL of DNAzol into the 10mL graduated cylinder
3) Pour 10mL solution from graduated cylinder into blue-capped tube labeled "DNA-wash"
Used the following methods for each species sample.
- When ready to start the completion process of DNA isolation SOP prepped and labeled transfer tubes accordingly with species and date of isolation.
- Centrifuged after lysis of tissue for 10min at 10,000G
- Pipetted out supernatant and tossed tissue sample.
- Some of the samples required more centrifugation so for the Mt and Rp samples repeated at 10,000G for 5min in order to attempt to get all supernatant with out tissue sample.
- To supernatant added 0.5mL 100% EtOH and allowed to sit vertically for 4 minutes.
- Centrifuged 5000G for 5 minutes
- Pipetted out supernatant and kept pellet
- (Starting DNA wash) Added 1mL 70:30 DNAzol:EtOH solution that Brenda made and allowed to sit vertically for 3 minutes.
- Centrifuged for 2 minutes at 1000G
- Pellet is very noticeable at the bottom and on side of tube, appears as white to off white material. Concerned that this material is not what we want and that we want the supernatant so kept everything until confirmed by Sam. For now, continued with washing pellet.
- Pipetted out DNAzol:EtOH solution and added 1mL of 70 % EtOH. Let this sit for 3 minutes after inverted 8 times. Then centrifuged at 1000G for 2 minutes.
- Repeated the above step again.
- Pipetted out all supernatant wash that I could, repeating centrifugation as needed and let sit for 5 minutes.
- Resuspended the pellet as stated below and made sure to pipette up and down to attempt to well mix the DNA in the water.
|| Species || Amount water added to suspend DNA ||
|| Rp- Manila clam || 1mL ||
|| Cg- Pacific Oyster || .500mL ||
|| Pg- Pacific geoduck || .500mL ||
|| Mt- Blue mussel || .500mL || - Received an email response from Sam after the DNA was suspended and he had advised that there seemed to be a good amount of DNA in the tubes and to suspend with 0.150mL of water. I advised him of my actions and offered to re-pellet the DNA and add the appropriate amount of water. Waiting on response.
Brenda's notes on Preparing Master Mixes for Pg-1(NTC and Geoduck DNA only) , Pg-2(NTC, Pg, Cg, and Rp DNA), Cg (NTC and Pacific oyster DNA only), and Rp (NTC and Manilla clam DNA only) PCR runs using DNA isolated from today. Notes from Brenda below...
Master Mix Preparation:
1) Multiply ingredient materials from Megan’s PCR methods by 6 (1 well ladder, 3 wells DNA, 3 wells water, + pipetting error) for each species (4 total species)
2) Multiply ingredient materials by 8 (1 well ladder, 2 wells NTC, 2 wells Pg
DNA, 2 wells Rp DNA, 2 wells Cg DNA, + pipetting error)
-Want to run one PCR with Pg primers and Pg, Cg, and Rp DNA w/NTC
APEX 2.0X Taq RED Master Mix 1.5mM MgCl2
ID No.:5200300—0050
Lot No.: 13C22
Promega GoTaq Green Master Mix, 2X
Lot No.: 0000096319
3) Prepare Pg-1 (regular) strip first by adding materials in this order to micro centrifuge tube:
1) 62.7µl pure water (H2O 05-12 by MM)
2) 3.3µl of forward primer (PgNew Fwd from 05/11/15 by MM)
3) 3.3µl of reverse primer (PgNew Rev from 05/11/15 by MM)
4) 82.5µl of Taq RED Master mix
4) Prepare Pg-2 micro centrifuge tube (8 well trial as cross-check for Pg primers) by adding:
1) 83.6µl pure water (H2O 05-12 by MM)
2) 4.4µl of forward primer (PgNew Fwd from 05/11/15 by MM)
3) 4.4µl of reverse primer (PgNew Rev from 05/11/15 by MM)
4) 110.µl of GoTaq green master mix
5) Prepare Cg run in micro centrifuge tube by adding:
1) 62.7µl pure water (H2O 05-12 by MM)
2) 3.3µl of forward primer (Cg 4F from 04/30/15 by BS)
3) 3.3µl of reverse primer (Cg 4R from 04/30/15 by BS)
4) 82.5µl of GoTaq green master mix
6) Prepare Rp run in micro centrifuge by adding:
1) 62.7µl pure water (H2O 05-12 by MM)
2) 3.3µl of forward primer (Rp 1F Fwd from 04/30/15 by BS)
3) 3.3µl of reverse primer (Rp 2R from 04/30/15 by BS)
4) 82.5µl of Taq RED Master mix
-Note: different choice of used master mix based on material limitations
PCR preparation:
Pg-1
1) Add 23.0µl of Pg-1 (red) master mix to each of 6 tubes in an 8-strip of PCR tubes, replacing pipette tip every tube
2) Add 2.0µl of Pg DNA isolated in UWT lab by MM on 05/11/15 to tubes 4-6
Pg-2
1) Add 23.0µl of Pg-2 (green) master mix to each of 8 tubes in an 8-strip of PCR tubes, replacing pipette tip every tube
2) Add 2.0µl of Pg DNA isolated in UWT lab by MM on 05/11/15 to tubes 3-4
3) Add 2.0µl of Rp DNA isolated in UWT lab by MM on 05/11/15 to tubes 5-6
4) Add 2.0µl of Cg DNA isolated in UWT lab by MM on 05/11/15 to tubes 7-8
- Assisted in filling Pg-2, Cg, and Rp PCR runs.
- Added 23μL of Cg master mix to 6 wells changing out pipette tip with each transfer.
- Did not add water to first three tubes (1,2,3) for NTC.
- Added Cg DNA to tubes 4,5,6. Capped and set aside for thermocycer.
- Repeated with Rp tube strip.
- For Pg-2 PCR strip added Cg DNA to tubes 7,8,; Rp DNA to tubes 5,6,; Pg DNA to tubes 3,4,; and NTC tubes are 1,2.
Results and Future stepsUnable to use thermal cycler this afternoon, all 4 sets of 8-strip PCR tubes containing solutions were frozen in the lab for use tomorrow morning in PCR and electrophoresis. One agarose gel that was made was wrapped in saran-wrap and put in lab refrigerator for use tomorrow as well. PCR on NTC reactions done this morning went well, no DNA amplification was detected.DNA isolation seemed to go smoothly, waiting on Sam's email to see if we should pellet the DNA and resuspended with a smaller amount of water. Will not know if DNA was successfully isolated and good for use until PCR tomorrow or when can return to Seattle and run on Nano-drop.
ImagesPCR performed on NTC set up from L-R as Ladder, NTC, NTC, NTC, NTC. No amplification present, only possible primer dimers.
May 11, 2015
UWT- Becker Lab
McCartha
Lab Report: PCR with No Template Control only
Created by: Michelle McCartha
Goal:
- To run PCR using only No Template Control (NTC) in order to test methods and see if there is somehow a contamination issue since amplification showing on previous PCR runs with NTC group.
- To suspend new geoduck primers that came in today so can run PCR with them tomorrow.
- To start DNA isolation with DNAzol process so can digest for between 4-24 hours as SOP suggests.
Making Master Mix solution for PCR on NTC reactions
- Want to fill 8 wells so that PCR reads from L-R : Ladder, NTC, NTC, NTC, NTC, NTC, NTC, NTC, NTC.
- Prepared master mix using volumes below starting with water then primers and ending with Apex.
| Solution for Master Mix (μL) |
Standard volume (μL) |
Multiply by (# wells) |
+ ( * 10% Error)(μL) |
Volume to add (μL) |
| Apex |
12.5 |
8 |
10 |
110 |
| Fwd Primer |
0.5 |
8 |
0.4 |
4.4 |
| Rev Primer |
0.5 |
8 |
0.4 |
4.4 |
| Water |
9.5 |
8 |
7.6 |
83.6 |
- Mixed well and centrifuged down.
- Pulled out 8-tube strip and pipetted 23μL of master mix.
- Wanted to test product of not adding 2μL of water to NTC so added 2μL of water to first 4 tubes and not to last four.
- Ran thermocycler under Bonnie's program as normal.
- Made 1.2% agarose gel using 200ml of TAE buffer and 1.2g (actual mass 1.196g) agarose.
- Microwaved for approx 3 min swirling every 30 seconds.
- Added 20μL Sybersafe dye to gel.
- Poured gel in gel tray and let sit till completely hardened.
- Came back when thermocycler finished and took to gel and placed gel tray with hardened gel in gel box.
- Filled gel box until gel just covered with 1X TAE buffer solution.
- Pipeted 10μL of ladder to first well.
- Pipetted 10μL of each reaction sequentially into wells 2-9.
- Placed lid on gel box and turned on power supply; set to 100V and 30 min.
- Allowed run time and when finished took to take photos using UV light box with camera attachment.
Suspending new Geoduck Primers
- Received primers that were used in Bonnie et al. 2012.
- To suspend in Low TE and make 100μM solution of stock primer, multiplied nmoles on primer vials by 10. the resulting figure will be the amount of μL of Low TE to add to the vial and suspend the primers in respectively (each nmole is different on the vials is different ).
| Primer Name |
nmoles in vial |
multiply by |
resulting volume |
Chem adding |
| PgNewForward |
31.8 |
10 |
318 |
Low TE |
| PgNewReverse |
27.6 |
10 |
276 |
- Added volumes of Low TE ass needed respectively.
- Finger vortexed and allowed to sit for approx. 20 minutes, finger vortexed again and again allowed to sit, finger vortexed again, and centrifuged down.
- To make 10μM aliquot of stock primer, pipetted 90μL of H20 and 10μL of FWD primer into a microcentrifuge tube and vortexed.
- Repeated for the REV primer. Placed in freezer with other primers until ready to use.
Beginning DNA isolation process using DNAzol
- Geoduck DNA will be isolated from a chunk of geoduck siphon that was preserved in RNAlater and given to us by the Roberts Lab.
- Manila clam (Rp), Pacific Oyster (Cg), and Blue mussel (Mt) tissue are from organisms previously collected from Hood Canal and kept in salt water system at UWT. They were harvested today and remaining tissue will be preserved in RNAlater.
- Between 35-50mg of each organism was collected and diced to isolate DNA from.
- Here, specific tissues samples (where the tissues were collected on the organism) were noted.
| Species / tissue sample |
Mass (mg) |
| Mt / Abductor muscle |
45 |
| Rp / Mantle |
41 |
| Cg / Abductor Muscle |
42 |
| Pg / Siphon |
38 |
- Prepared tissue samples using the tissue masses listed above.
- Placed each sample in labeled microcentrifuge tube and added 500μL of DNAzol and 2μL Proteinase K solution.
- Inverted multiple times until all tissue in each sample in solution.
- Was going to keep it mixing by placing on slow moving vortex, but the SOP advises against vortexing. Since we don't have a rotator to invert overnight will just have to let sit and manually invert when able to.
- Added additional 200μL DNAzol to each vial (we did similar when Sam was working on it with us).
- Allowed to sit overnight and continue DNA isolation in the morning.
Results and Next steps
- Plans for 5/12/15
- Finish DNA isolation
- Run PCR using new Pg primers and newly isolated Pg DNA
- PCR on NTC today seemed to work. There appears to be some primer dimer in the gel but no obvious amplification. Although contamination of previous PCR reactions seems unlikely, these results indicate something must have gone wrong on previous runs.
Images
Below is the image for the PCR run today using only NTC and can be read from L-R as: Ladder, NTC, NTC, NTC, NTC, NTC, NTC, NTC, NTC. The camera was not at the same setting I think but I couldn't seem to figue out how to adjust it. That being said, no obvious amplification is present and there is some faint primer dimer effect in all reactions.
May 8, 2015
UWT- Becker Lab
McCartha
PCR using just Pg DNA for a single gel (Also Cg and Rp PCR in separate gels)
Created by: Michelle McCartha
Goal:To test PCR on Pg geoduck absent of running alternate DNA with Pg primers on gel. To test PCR on Cg and Rp primers and DNA on separate gels.
Methods:Want to fill 8 wells total (4 DNA, 4 neg. control) aside from ladder. Multiply by 10.
| Solution for Master Mix (μL) |
Standard Volume (μL) |
Multiply by |
Volume to add (μL) |
| APEX |
12.5 |
10 |
125 |
| FWD |
0.5 |
10 |
5 |
| REV |
0.5 |
10 |
5 |
| Water |
9.5 |
10 |
95 |
- Added apex, fwd, rev, then water last.
- Took to Thermocycler and ran program under "Bonnie"
- Prepared (3) 1.2% gels using 400mL 1X TAE buffer and 4.8g agarose (actual amount 4.79g)
- Microwaved for approx. five minutes.
- Poured gels.
- Turned out wavy, remade gels.
- Turned out wavy again, remade gels.
- Turned out wavy again (maybe the cooling process, pouring to hot (?) running with it.
- Made more 1X TAE buffer solution by adding 20mL of 50X TAE buffer to 980mL ultra pure water. Did this twice to make 2L.
- Placed gels into gel boxes and poured 1X TAE Buffer into gel boxes so that the gels are just covered.
- Pipetted 10μL of each reaction to their respectively assigned boxes so that no species is crossed with another species box. Wells set up as: Ladder, DNA, DNA, DNA, DNA, NTC,NTC,NTC,NTC.
- Allowed to run at 100V for 40 minutes.
Results and future steps
All wells ran from L-R as Ladder, DNA, DNA, DNA, DNA, No Template Control (NTC), NTC, NTC, NTC, for three species: Pg- Geoduck, Cg- Pacific oyster, Rp- Manila clam. NC still showing with PCR product in Pg reactions. No product was showing in Cg reactions but did on Monday which suggests depletion of DNA so need to digest more sample to have more (and better quality?) DNA. Quality and quantity issues was verified during yesterdays activities in the Steven's lab using Nanodrop- See notebook. Rp gel show amplification in the DNA reactions and not in the NC reactions which also suggests that there may not be a lot of measurable DNA but that PCR did work. Monday we will start the DNA extraction protocol again and allow it to run overnight to hopefully digest as much tissue and isolate a good amount of (high quality?) DNA. Please note that I used new water to insure no water contamination. Used same Mix for all master mix solutions. We will also run PCR using no template controls (water only, no DNA) added at all for all sets to see what happens there.
Images
All images below use are shown the same from L-R as: Ladder, DNA, DNA, DNA, DNA, NTC,NTC,NTC,NTC. Image 1 (Top) show Geoduck Primers and DNA. Here the NTCs amplified similar to what happened on on 5-7-15, and not the Pg DNA reactions. Image 2 (middle) show Pacific oyster reactions and no amplification. Image 3 (bottom) are the Manila clam reactions and here seem to have some amplification but it is pretty faint.
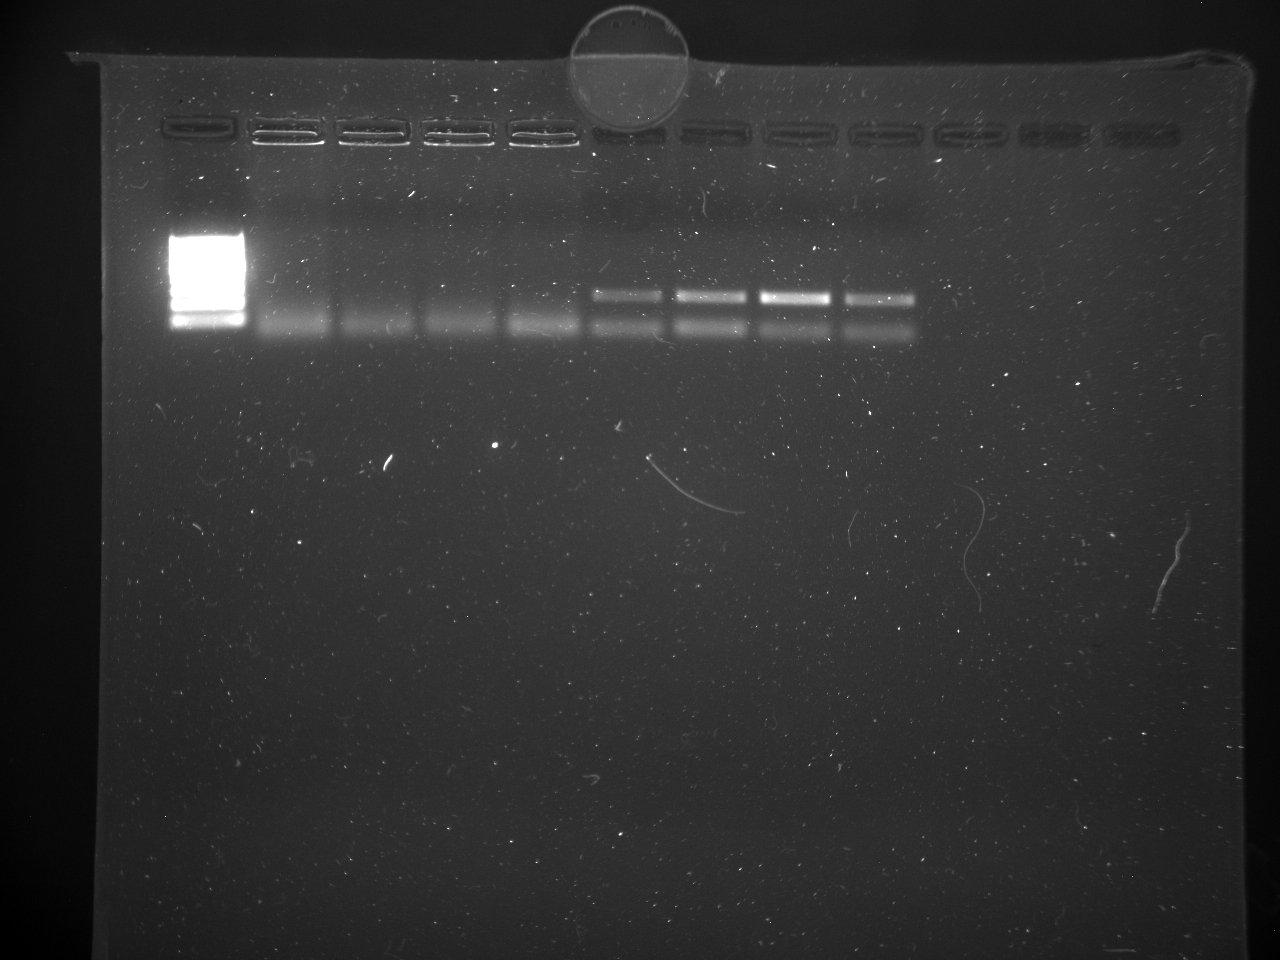
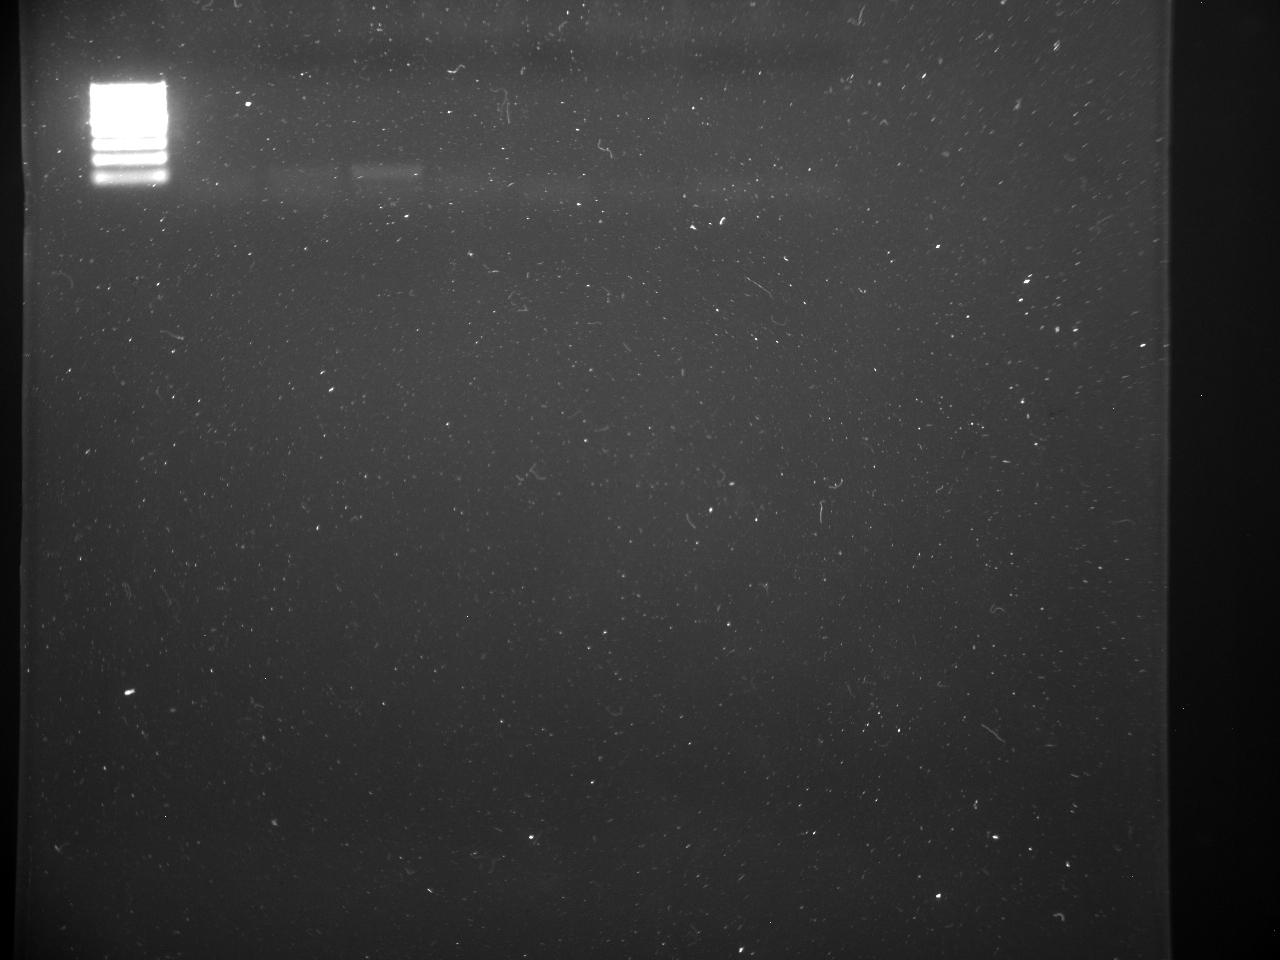
May 7, 2015
SAFS- Robert's Lab
McCartha_Smithhisler
PCR using Pg DNA and uncontaminated Pg primers 5-7-15
Created by: Michelle McCartha
Goal:
1) Suspend new FWD and REV Pg primers and make 100μL aliquots.
2) To test new Pg primers by running PCR using primers and DNA extracted from 4-30-15.
3) Test specificity of Pg primers on Cg Rp and Mt (pac oyster, manila clam and blue mussel respectively) DNA
4) Test bivalve spp. DNA that was extracted 4-30-15 using nanodrop.Methods:Suspending Pg primersFWD 24.4 nmoles * 10 = 244μL Low TE to add to Primer tube.REV 31.4 nmoles * 10 = 315μL Low TE to add to Primer tube.
Making aliquots
C1 V1 = C2 V2100M * X = 10M*100μL(10M *100μL)/100MX = 10μL of FWD and REV stock primers and 90μL Nuclease-Free water.
Making Master Mix
- Will set up their 8-well gel so that it reads from L-R as follows:
- Ladder, DNA, DNA, DNA, WATER, WATER, WATER, BLANK.
- Will need to multiply standard master mix volume by 10μL to account for pipette error.
(Note from Sam: In future, to account for pipette error use 10% of final desired volume that way there is not so much extra as well as having a standard remaining volume. This helps to identify possible errors in method prior to finishing PCR methods (it ill save time, effort, and frustration).)
To make Master Mix will need:
| Solution for Master Mix (μL) |
Standard Volume (μL) |
Multiply by |
Volume to add (μL) |
| APEX |
12.5 |
10 |
125 |
| FWD Pg primer |
0.5 |
10 |
5 |
| REV Pg primer |
0.5 |
10 |
5 |
| Water |
9.5 |
10 |
95 |
(Note: Where the numbers come from. Everything can change depending on how much reaction solution you want to make. The Apex Red is at 2.0X and in the master solution we want it at 1.0X. The Primer volume to add (μL) is dependent on the molarity o the working solution that the primer is and how much master solution we want but the end concentration in the solution should be at 0.2M. The water makes up the difference for the amount of solution that you want.)
- Added water, then primers, then Apex solution.
- Labeled 8-strip tube as 1,2,3,4,5,6 1-3 DNA reactions, 4-6 water reaction.
- Added2 23μL Master Mix solution to all tubes.
- Added 2μL DNA to tubes 1-3
- Added 2μL Water to tubes 4-6
- Vortexed and centrifuged down.
- The gel will be read from L-R as: Ladder Cg, Rp, Mt, water.
- Labeled second 8-tube strip as 7, 8, 9, 10 (Cg, Rp, Mt, water)
- Added 23μL of master mix to tubes 1,2,3
- Added remaining 10μL to water tube (it was all that remained, must have lost 10μL during pipette transfers.
- Added 2μL DNA to each respective tube and 2μL water to water tube.
- Took both strip tubes to Thermocycler and ran under Sam-AAAAA, after adjusting parameters of the program (listed below), with heated lid.
PTC-200 Program Parameters
Always use SAM-AAAAA. This method is meant to be a program that can be altered at anytime for anyone, so always check it before running it.
- 95oC-10min
- 40 cycles of:
- 95oC-20sec
- 55oC-20sec
- 72oC-30sec
- 72oC-2min
- 4oC- Hold For Ever
Pouring 1.2% Agarose gel
- Poured 50mL of 1X TAE buffer solution into graduated cylinder and from there poured 25mL OF solution into 250mL Erlenmeyer flask.
- Measured 0.6g (actual 0.62g) of agarose and poured into Erlenmeyer flask.
- Used remaining buffer solution to rinse weigh boat into flask.
- Placed flask onto balance and tarred.
- Placed in microwave and let run for 2min stopping to swirl flask three times.
- Once microwave was finished, filled back to 50mL so that back at 1.2% agarose gel (some buffer evaporated), added 0.5μL ethidium bromide to gel and swirled until well mixed.
- Sam placed a 12-well comb in gel tray so wouldn't have to run 2 gels.
- Poured into cleaned gel tray and let cool.
Running PCR
- Thermocycler end time 12:43 (start time 11:12)
- Placed gel correctly in gel box and poured 1X TAE buffer solution in it so that it just covered the gel (we poured a little too much and decanted some off so that it just covered the gel).
- Pipetted 10μL of reaction solutions into wells as well as Ladder so that the gel read from L-R as: Ladder, DNA, DNA, DNA, Water, Water, Water, Cg, Rp, Mt, Water.
- Started PCR at 1:10pm set at 100V
- End time: 1:41pm
(Note: Manila clam has two scientific names that many articles refer to. In order to be uniform between notebooks and other writings, decided that for us we will use the name Ruditapes philippinarum unless otherwise corrected. Changed all initials from Vp to Rp.)
Results and future steps
- PCR product present in all but the geoduck DNA reactions.
- Used nanodrop to test concentrations of DNA in all species and there was poor DNA quality and quantity in all DNA extractions.(Note: The gooie stuff in the tube of processed tissue is the DNA, this is the stuff that we want. There is an alternate step in the method under the"spooling DNA" step that involves a solution using DNAzol etc and that should be used.. Look into that next time.)
- We will run the PCR product again, this time using just the Pg primers and Pg DNA and water (Note: Steven said that we don't need to add water to the negative control groups, it may just be wasteful and may eliminate potential error in the future.).
- Ordering new primers from Becker et al. 2012 for geoduck-
Images
Image 1 (top) shows PCR ran today. Gel reads from L-R: Ladder, DNA, DNA, DNA, Water, Water, Water, Cg, Rp, Mt, Water. All reactions show amplification except DNA reactions which is not as expected. Image 2 (middle) is a table of measurable DNA which was isolated 4-30-15. Image 3 (bottom) is a graph of measurable DNA which was isolated 4-30-15
May 4, 2015
UWT- Becker Lab
McCartha
Lab Report: PCR using Cg DNA and Cg Primers
Created by: Michelle McCartha
Goal:
1) To test success of DNA extraction methods performed in Robert's Lab on 4-30-15.2) To run PCR using Cg DNA and Cg primers.
Methods:
Master Mix
| Solution for Master Mix (μL) |
Standard Volume |
Multiplied By |
Volume to add to Master Mix (μL) |
| Apex |
12.5 |
14 |
175 |
| Cg FWD primer |
0.5 |
14 |
7 |
| Cg REV primer |
0.5 |
14 |
7 |
| Water |
9.5 |
14 |
133 |
- Created master mix starting with water, then FWD/REV primers, then Apex Red.
- Pulled two 8-tube strips, one for the 5 water negative controls reactions and one for the 5 Cg DNA reactions.
- Added 23μL to both the water and the DNA tubes.
- Added 2μL of water to the water tubes and capped.
- Added 2μL of the already extracted Cg DNA from 4-30-15 to the DNA reaction tubes and capped.
- Took sets of tubes to the Thermocycler and ran under pre-formatted (from 4-23-15) program listed as "Bonnie" .
- Added prepared gel to gel box and poured 1X TAE buffer solution to gel box until just covering gel.
- When finished, took back to Becker Lab and pipetted 10μL of each reaction to gel and ran PCR for 40 minutes at 100V.
- Reactions pipetted read from L-R as: Ladder, DNA, DNA, DNA, DNA, DNA, Water, Water, Water, Water, Water, Blank.
Pouring gel for PCR
- Prepared 150mL of 1.2% agarose by adding 1.8g (actual 1.820g) agarose to 150mL 1X TAE buffer. Microwaved for 2 minutes swirling after every 30 seconds.
- Cleaned gel tray and placed in pouring lane.
- Poured agarose gel solution to gel tray until approx. 2/3 full and let sit for approx. 20 minutes until solid.
Results and next steps
Cg DNA was amplified and the Water reactions had no PCR product as was supposed to happen. This implies that:
1) The DNA extraction method worked fine and we should have DNA for all species which DNA was extracted from 4-30-15.
2) PCR worked just fine and we should expect similar results with the other species.
Images Image below shows PCR product read from L-R as: Ladder, DNA, DNA, DNA, DNA, DNA, Water, Water, Water, Water, Water, Blank. Cg DNA was amplified in all DNA-added wells and no amplification was present (possible primer dimer) in the water-added negative control wells
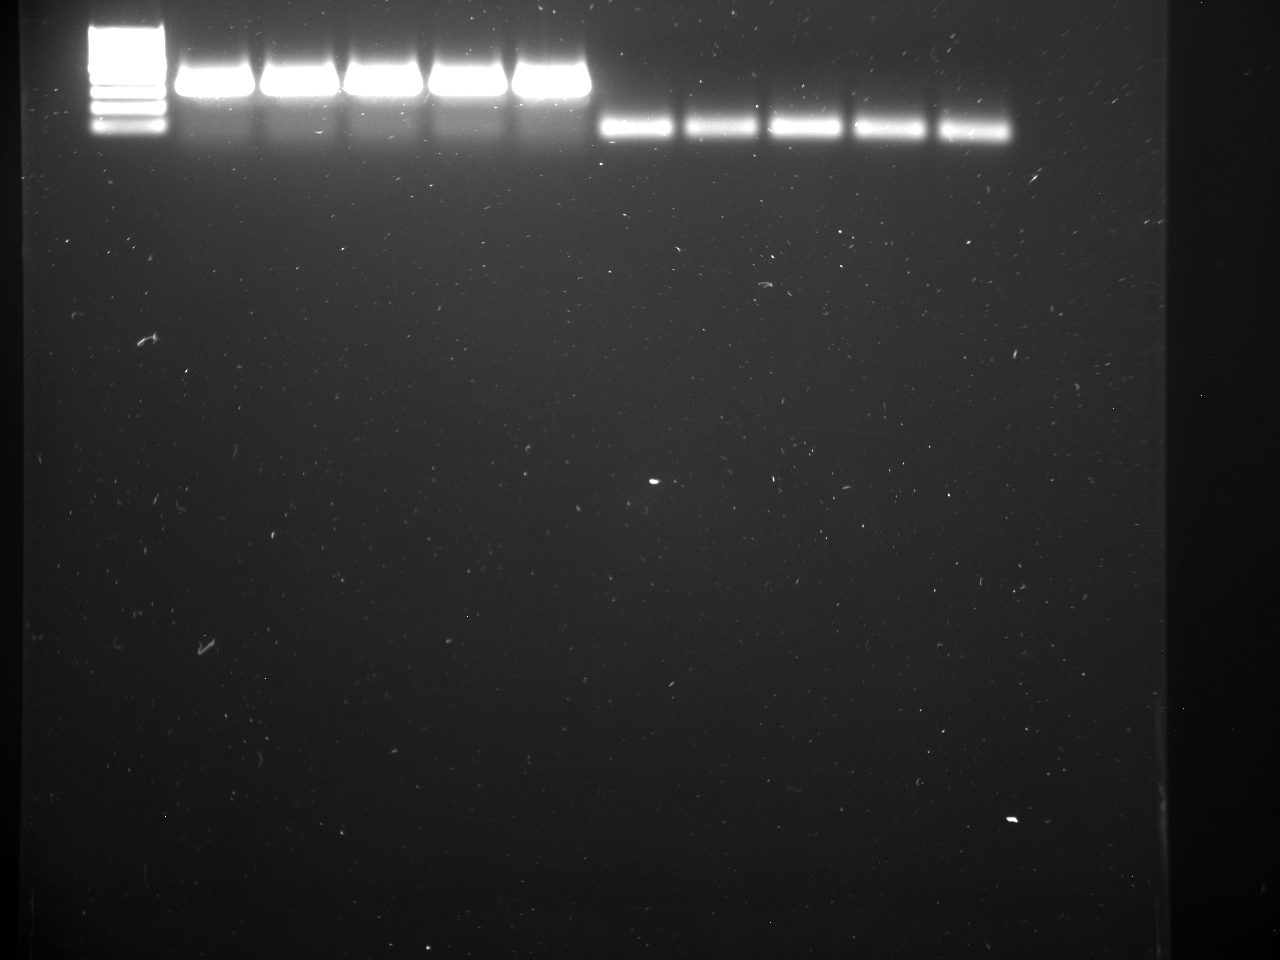
April 30, 2015
SAFS- Robert's Lab
McCartha_Smithhisler
Lab Report: DNA isolation and PCR on new primers
Created by: Michelle McCartha
UW Seattle- SAFS-Robert's LabMichelle McCartha and Brenda SmithhislerCreated by: Michelle McCartha
Goal
- To isolate DNA from samples (manila clam, pacific oyster, blue mussel, and unidentified clam) collected 4/26/15 and some of the geoduck in the Robert's lab.
- Suspend Cg and Vp primers to 100μM then dilute to 100μL of 10μM stock primers.
- Aliquot 10micromolar primer from Jutta's fish primer for testing.
- Run PCR using new primers and fish primers with out DNA( just water).
Methods
DNA isolation
- Cut of chunks of bivalve tissue so that tissue weighed between 20-50mg as described in DNAzol protocol.
| Species |
Tissue Mass (mg) |
| C gigas |
36.8 |
| R philippinarum |
44.1 |
| P generosa |
44.2 |
| M trossulus |
37.8 |
| Unidentified sp. |
38.5 |
- Placed chunks in 2mL tubes.
- Added 500μL DNAzol and 2μL of pK solution to tube. Inverted and placed on rotating rack for 4 hours.
- During rotation process, removed from rack twice and inverted to get tissues away from packing up at the bottom of the tube.
- Couldn't wait for four hours. Took them off after 2.5 hours.
- Centrifuged tubes for 10 mins at 10000G
- Removed supernatant and discarded pellet.
- To supernatant, added 5μL of 100% ETOH. Inverted 8 times and let sit for 3 minutes.
- Centrifuged 5000G for 5 minutes.
- Took out supernatant and kept pellet. Suspended pellet in 1mL 70% ETOH and centrifuged 5000G for 5 minutes to clean DNA.
- Again, took out supernatant and kept pellet. Suspended pellet in 1mL 70% ETOH and centrifuged 5000G for 5 minutes to clean DNA.
- Pipetted out Supernatant and discarded keeping pellet. Centrifuged once more at 5000G for 5 minutes then removed remaining supernatant careful not to disturb pellet.
- Let sit for 5 minutes then suspended pellet in 35μL ultrapure water. Vortexed and stored in -20 Freezer.
Suspending and making 100μL aliquot of Pacific oyster and Manila clam primers
Multiplied the nmoles of each primer by 10 and used this number as the volume of LowTE to suspend the primers with (See table below).Added the necessary LowTE to each primer and vortexed.This makes 100μM stock solution that can then be diluted as necessary (usually going to be about 10μM).
| Primer ID Name |
Nmoles on primer tube (nmoles) |
Multiply by |
Amount of Low TE to add (μL) |
| Rp TPHI16S- 1F |
10.96 |
10 |
109.6 |
| Rp TPHI16S-2R |
18.53 |
10 |
185.3 |
| Cg CCGS4F |
12.63 |
10 |
126.3 |
| Cg CCGS4R |
11.67 |
10 |
116.7 |
DNA sequence for primers from papers:
- Primer Name- CCGS4F Primer Sequence- TATTCGTTGGAGACTTTATAACCCT Resource: Patil et al. 2005
- Primer Name- CCGS4R Primer Sequence- AAGGCTTAGAATTGCAAGGTCTATA Resource: Patil et al. 2005
- Primer Name- TPHI16S-1F Primer Sequence- CTGAGTTTTTAATTGAAGTT TAGTTGGG Resource: Quinteiro et al. 2011
- Primer Name- TPHI16S-2R Primer Sequence- CCCTGCGGTAGC TTTTGCT Resource: Quinteiro et al. 2011
Diluted to 10μM from the stock solution.
- (C1V 1 = C2V 2
X = ((10μM) (100uL)) / 100μM
X=10
- 10 μL of stock solution
- 90 μL of molecular H2O
- Start by adding H2O to the aliquot vials, then add the smaller volume oF stock solution into the H2O
- This method of dilution was also used this morning by Brenda to dilute Jutta's Fish prime that was used to test our PCR methods.
| Solution for master mix |
Standard volume (μL) |
Multiply by # wells needed (4 here) |
Volume to add to Master Mix (μL) |
| Apex Red |
12.5 |
4 |
50 |
| Fwd primer |
0.5 |
4 |
2 |
| Rev primer |
0.5 |
4 |
2 |
| Water |
9.5 |
4 |
38 |
- Made each master mix (one for each set of primers, Fish, oyster, clam) using the above figures.
- Added 23μL of master mix to 8-well PCR strip set up as Fish for wells 1 and 2, Oyster for 3 and 4, and clam for 5 and 6. Added 2μL pure water to each tube. This will be used as negative control for each primer and should show no DNA amplification.
- Took to thermocycler and ran program under Sam-AAAAA. There were some differences from the one we used before but it wasn't that much so no changes were made with the program.
- Once finished, Noticed that the mix had separated. Was advised by Jake to centrifuge down which I did but also had to vortex to mix solution up again Steven indicated that PCR should still run ok.
- Poured gel while thermocycler was running by adding .6g agarose to 50mL 1X TAE. microwaved for 3 intervals of 30 seconds swirling between intervals. Added 5μL ethidium bromide to solution and set down while set up gel tray.
- Stuck in gel tray and placed in comb so that the 1.5 lettering faced up correctly. Poured gel with no bubbles. let size. Once solid pulled out comb and took out gel, rotating in gel box.
- Poured 1X TAE but didn't have enough so had to make more from 10 TAE stock using 100mL 10X TAE and 900mL ultra pure water.
- Poured more 1XTAE so that the gel is just covered.
- Pipetted 10μL of reaction mix to each well after adding DNA ladder. Wells were set up so that they read from L-R : Ladder, Blank, Fish, Fish, Pacific oyster, Pacific oyster, Manila clam, Manila clam.
- Ran PCR AT 100V for about 30 minutes. Steven had to press the DC start button to get working.
Results and Future Steps
- DNA seemed to have been extracted well but was unable to test on nano drop today. There was a white substance that could have been the DNA which was on the side or bottom of the tubes. In the future I suggest allowing enough time to DNA extraction, maybe even have it be overnight next time.
- Primers were suspended with out issue. Need to order more P generosa primer.
- Brenda was also able to successfully aliquot the Fish primer provided by Jutta. Although we may not use this primer, i will keep in case there is a need to test something using it in the future.
- PCR went well. There was "primer dimer" present but Steven assured that this was a good run and we should move forward to testing the primers with the DNA next so when Brenda and I come up next Thursday this is the plan along with the pac. oyster and manila clam primers and DNA. This will also allow us to see if the DNA extraction was performed successfully.
- The bp adn DNA sequence for the oyster and clam primer suspended today is still unknown but
- Steven said he could how us how to generate these items in the NCBI blast tool.
Images
Image 1 (top) is a picture of the reactions made with Master mix primers and water after coming out of the thermocycle and vortexing and centrifuging. Notice the separation in the liquid as seen with the change in color. Before pipetting to the PCR wells, I used the pipette to mix up the remaining solution which helped. Image 2 (bottom) shows the PCR run that was performed. Again, the gel was set up from L-R as Ladder, Blank, Fish, Fish, Pacific oyster, Pacific oyster, Manila clam, Manila clam. You can see a faint line that is much less bright than other products have shown so far. Steven suggests this is "primer dimer".
April 28, 2015
UWT-Becker Lab
McCartha
Lab Report: Testing PCR Master mix for contamination
Created by: Michelle McCartha
Goal:
1) Run 4/24 reactions to see if freezing the reactions prior to running thermocycler program changes the results of the product.
2) Prepare previously processed samples from 4/23 so that they can be sent up to Seattle and be sequenced to see if there is anything abnormal about the different reactions and the primers (Water/DNA. FWD Primer).
3) Run PCR to compare master mixes as was doing on 4/24 but this time with out freezing the reactions.
4) Preserve manilla clam larvae that was received today (4//28/2015) from Coast Seafoods' Quilcene hatchery. The clams were spawned on April 27th (1 day old larvae); a sample in 95% ethanol and another sample in DMSO (bottle the larvae was sent in has label saying D15 123M on it).
5) Suspend Cg and Rp primers
6) Preserve adult specimen for DNA extraction
Methods:
- Placed frozen reactions from 4/24/15 in thermocycler and ran Bonnie's cycle. Start time 9:35.
- Making agarose gels for PCR: Need three gels one for frozen reactions and 2 for new comparisons of RED/GRN master mixes.
- 0.6g agarose and 50mL 1X TAE makes 1.2% agarose gel.
- Need 300mL for 3 gels
- Need 3.6g agarose with 300mL 1X TAE to make 3 1.2% agarose gels.
- Weighed out 3.6 g agarose (Actual mass 3.621g)
- Poured 200mL 1x TAE into Erlenmeyer flask.
- Poured measured agarose into flask, rinsing weigh boat with remaining 100mL 1X TAE.
- Took to room 215 in UWT Science building (where microwave is located)
- Microwaved mixture for 7 30sec intervals swirling between intervals.
- Once all agarose has dissolved in TAE took back to Bonnie's lab and added 30μL SyberSAFE dye (1:10,000 =10μL for every 100mL) and swirled to dye is throughout solution.
- Cleaned pouring lane and three gel trays using kimwipe and di water added combs to trays.
- Dispensed gel solution to three trays so that it is about 2/3 full.
- Let sit for 30 minutes
- Came back and gels solid. Placed one in gel box with power supply connected and set at 200V for 30 min runs from neg to positive. Wrapped other two in Clingwrap and placed in fridge for later use.
- Poured 1xTAE solution into gel box until just covering gel.
- Collected samples from thermocycler and added 10μL of reaction samples to slots running from L-R: GRN,GRN,GRN,GRN,RED,RED,RED,RED,RED, Blank, Ladder.
- When finished took gel to Cline lab to photograph.
Preparing reactions to send out for sequencing
- Prepared reactions from 4/23/15 to send up to get sequenced along with professor Jutta's samples to see if the product was P. generosa or other random contamination (or possible lack of specificity in the primers?).
- One PCR Plate using 1 8-tube strip placed the following in three separate tubes for sequencing:
- 10μL Water sample from PCR run on 4/23
- 10μL DNA sample from PCR run on 4/23
- 10μL of 3μM FWD primer from new 10 μM 100μL aliquot made 4/24
- C1V 1 = C2V 2 10μM x ?uL = 3μM x 20uL
- Labeled tubes
- MM01-DNA test
- MM02-Water test
- MM03- Primer test
- Placed on labeled PCR plate and placed in freezer in SCI217 for Jutta to arrange when she is ready to prepare the plate for sequencing.
Preparing master mix of GRN and RED
(Following same method performed from 4/24/15)
- For both GRN and RED master mix we will use the same volumes calculated below
- Apex - 12.5 μL
- Fwd - 0.5 μL
- Rev - 0.5 μL
- H2O - 9.5 μL
- Will preform 6 runs for each master mix so will multiply by x6.5 in order to account for pipette error.
- RED/GRN - 12.5 μL X 6.5 μL= 81.25μL
- Fwd - 0.5 μL X 6.5 μL= 3.25μL
- Rev - 0.5 μL X 6.5 μL= 3.25μL
- H2O - 9.5 μL X 6.5 μL= 61.75μL
- Prepared 2 8-well strip tubes for PCR
- One strip for GRN mix
- Filled 6 wells
- 23μL Master Mix Reagent using GRN master mix
- 2μL new molecular grade water
- One strip for RED mix
- Filled 6 wells
- 23μL Master Mix Reagent using GRN master mix
- 2μL new molecular grade water
- One strip for GRN mix
- Set up in Thermocycler under Bonnie's cycle 12:40 start time 2:30 end time
- Set up gel box: Ended up only using one of the gels .
- pipetted 10μL of reactions and ladder to slots as follows: Ladder, GRN, GRN, GRN, GRN, GRN, GRN, RED, RED, RED, RED, RED.
- Ran PCR at 200V for 30 min.
- Took gel to Cline lab to photograph.
Preserving manilla clams received from Coast Seafoods
- Coast seafoods sent an overnight 1mL vial of manilla clams that were spawned 4/27. We received the cooled package on 4/28. They were wet but not in any solution of seawater.
- Using a sterile pipette, larvae were scooped and placed in a 15mL tube containing already made 95% ethanol. Not all of the larvae were scooped so that the remaining will be preserved in DMSO.
- Using a new sterile pipette, DMSO was added to the 1mL vial and remaining larvae then pipetted out of the vial and placed in a a15mL tube of DMSO. More DMSO was added to the vial and pipetted out again to ensure that all of the larvae were captured.
- These samples were placed with the other larvae samples in the Becker lab and will be used to make standard curves for qPCR.
Suspending Rp and Cg primers and making aliquots
Need to make 100uM stock concentration,
- Multiply the nmole amount printed on the stock package by 10
- Add that amount of Low TE in microliters (uL).
- Finger vortex, let sit for 5 minutes, then finger vortex again to make sure the assays are completely dissolved and re-suspended.
Preserving live adult samples for DNA extractions
Froze live samples to use for specificity tests;
- Manilla Clam
- Pacific Oyster
- Blue Mussel
- Unidentified clam
These samples were collected 4/27/15 in Twanoh State Park which has Hood Canal access.
Results and Future Steps
- Both frozen (from 4/24) and newly prepared samples (from 4/28) exhibited amplification indicating that there was DNA in the samples. The master mixes may not have been contaminated and the molecular water was newly opened on 4/24/15. The aliquots of FWD and REV primer were newly prepared on 4/24 from stock solutions. Conclusion: Primer Stock may be contaminated. Future steps: To suspend new primers for Manilla clam and Pacific oyster and test using PCR with only water.
- Comparison of freezing reactions from 4/24 and new reactions from 4/28: There was no observable difference in PCR product between frozen and newly prepared reaction however it's probably best to prep reactions same day as PCR run.
- Manilla clam and Pacific oyster primers had insufficient information on it (no nmole value) so could not suspend using LowTE. Next steps: To contact primer manufacturer (IDT) and Micah to find out what the nmole value is for each of the primers so that we can suspend them and run PCR on Thursday (4/30) when we are up in the Robert's lab.
- Adult specimen will be removed from -80 freezer 4/29 and prepped to extract DNA at the Robert's lab on Thursday (4/30).
Images
Images below were taken from today's results. GRN indicates test performed with new master mix and RED indicated test performed with master mix provided by Robert's Lab. These were a test to determine if RED Master mix was contaminated with Pg DNA.
- Image 1 (top) was set up from L-R: GRN,GRN,GRN,GRN,RED,RED,RED,RED,RED, Blank, Ladder using reactions prepared from 4/24 frozen samples which could not be run on the date they were prepared. All reactions amplified indicating that there was DNA in each sample.
- Image 2 (bottom) was set up from L-R as Ladder, GRN, GRN, GRN, GRN, GRN, GRN, RED, RED, RED, RED, RED. These reactions were not frozen and were run using PCR same day as prepared. All samples appear to have been amplified indicating that there was DNA in each sample.
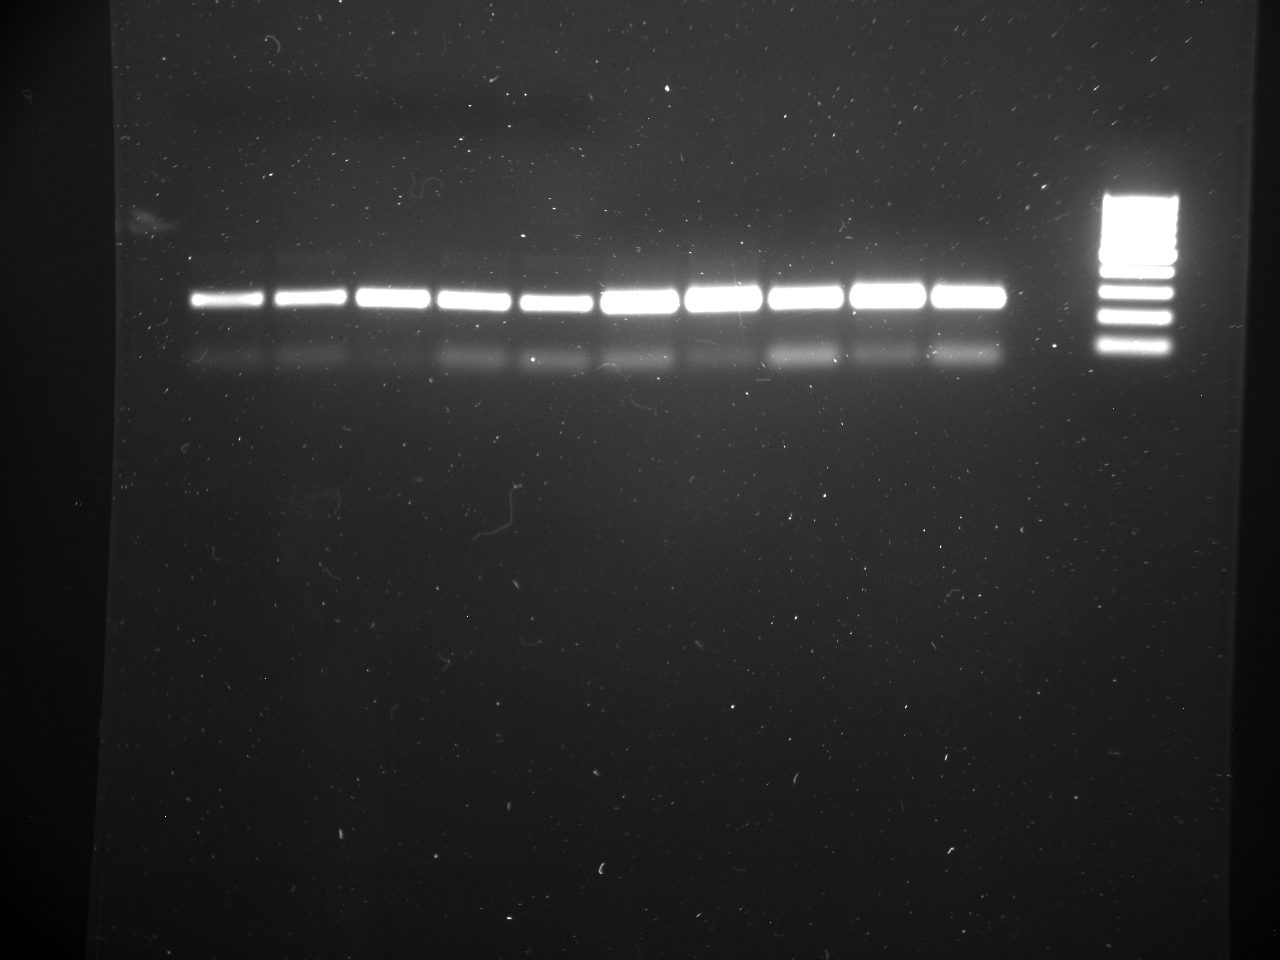
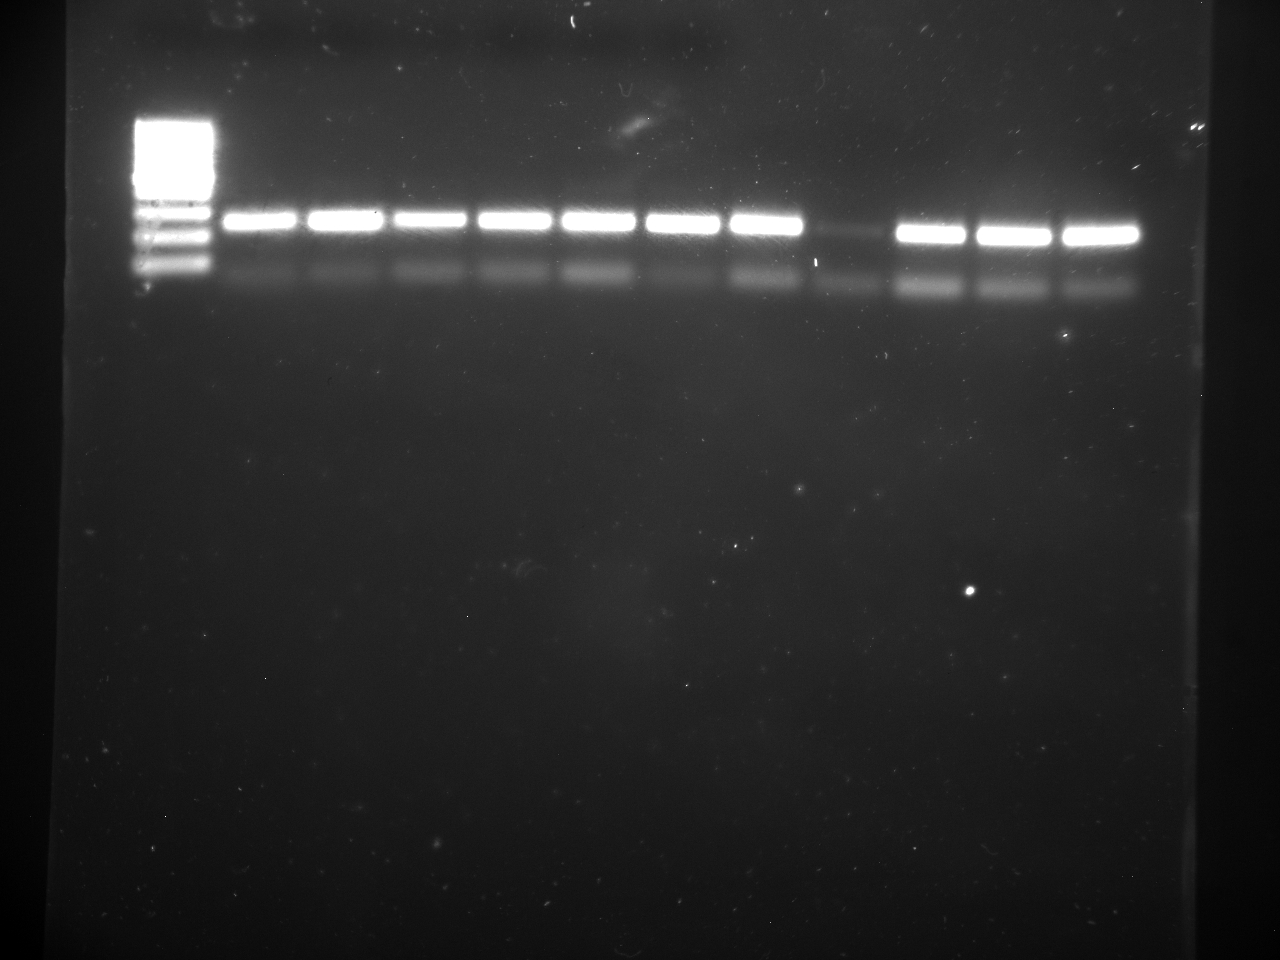
April 24, 2015
UWT- Becker Lab
McCartha_Smithhisler
Preparing new aliquots of Pg Primer and Run test PCR
Created by: Michelle McCartha
Goal:
- In order to test contamination of Pg Forward and Reverse Primers, need to make new aliquots from the stock primer solutions.
- Received some GoTaq Green Master Mix2X (GRN) which the student lab provided us to test if the Apex 2.0X Taq Red Master Mix (RED) was contaminated as well as some unopened molecular grade water. Preparing reagents for PCR to test both master mixes in order to test if there may be contamination in the Apex.
Method:
Creating new aliquots for Pg Forward and Reverse Primers
- For each primer, making (1) 10 μM 100μL aliquot
- C1V 1 = C2V 2
- μL of primer stock solution
- Start by adding H2O to the aliquot vials, then add the smaller volume of stock solution into the H2O pipetted up and down to mix well.
- Placed aside for use when making the Master mixes.
Preparing master mix of GRN and RED
- For both GRN and RED master mix we will use the same volumes calculated below
- Apex - 12.5 μL
- Fwd - 0.5 μL
- Rev - 0.5 μL
- H2O - 9.5 μL
- Will preform 6 runs for each master mix so will multiply by x6.5 in order to account for pipette error.
- RED/GRN - 12.5 μL X 6.5 μL= 81.25μL
- Fwd - 0.5 μL X 6.5 μL= 3.25μL
- Rev - 0.5 μL X 6.5 μL= 3.25μL
- H2O - 9.5 μL X 6.5 μL= 61.75μL
- Prepared 2 8-well strip tubes for PCR
- One strip for GRN mix
- Filled 6 wells
- 23μL Master Mix Reagent using GRN master mix
- 2μL new molecular grade water
- One strip for RED mix
- Filled 6 wells
- 23μL Master Mix Reagent using GRN master mix
- 2μL new molecular grade water
- One strip for GRN mix
- Went up to Erica Clines lab to vortex and centrifuge in order to run Thermocycler
- There was an issue with scheduling the Thermocycler so was not able to run PCR today. Placed reagents in the Becker Lab freezer and scheduled to run Thermocycler Monday (4/27) and (4/28) Tuesday next week .At that time Brenda and I will prepare new reagents to run PCR on as well as will run todays reagents and see if there is an issue with contamination as well as to see if there is an issue in freezing reagents for future use.
April 23, 2015
UWT- Becker Lab
McCartha_Smithhisler
Running PCR gel with Pg Primers
Created by: Michelle McCartha
Re-testing Pg Primers using PCR. Last time this run was don, our negative control (the water wells with no DNA) had amplified as well as the wells that had DNA in it. Could be a contamination issue. We are trying to make sure that there is no contamination here. We used fresh molecular water. We also had to use a different ladder that was supplied by the student labs at UWT. We used 1xTAE buffer solution (the same solution that was used to make the gels for PCR) but this solution came from a pre-made and purchased solution of 25X TAE from BioRad and had a received year of 2007.
Method
Determined remaining volume of extracted DNA we had left from previous run- 11μL
Creating master mix
- Apex - 2.0X Taq RED Master Mix
- Per cell calculations (total volume 25μL in each well)
- Apex - 12.5 μL
- Fwd - 0.5 μL
- Rev - 0.5 μL
- H2O - 9.5 μL
- DNA - 2 μL
- Will perform 3 possible runs. One with just water (6 wells) One spare for just water incase of contamination issue again (6 wells) and then the actual run with DNA (3 wells with DNA and 3 wells with water)
- Total volume of master mix (x18.4)
- Apex: 12.5 X 18.4= 230μL
- Fwd: 0.5 X 18.4= 9.2μL
- Rev: 0.5 X 18.4= 9.2μL
- Water: 9.5 X 18.4= 174μL
- Created master mix using above measurements (adding water first, then primers and Apex last as done before).
- For PCR plate, running three possible gels
- Row A is for Water only run
- Row B is for backup Water only run
- Row C is for Water (3 wells (1,2,3) and DNA (3 wells 4,5,6) run---Here we started adding master mix at well 6 then continued to 5,4,3,2. On Row C Well #1 we had no more master mix so went with out (will use one of the spares in Row 2 when running PCR gels).
- Placed lids on tubes and vortexed for 10 seconds, then centrifuged down mixes.
- Took plate with all mixes to the Thermocycler located in the Science Building room 215 (instructions for making new method in drawer next to Thermocycler).
- Created new method for Thermocycler under new user "Bonnie"
- Named method: Pg_4-23-15
- Initial start 95C: 10 min
- 40 cycles :
- 95C: 20Sec
- 55C: 20Sec
- 72C: 30Sec
- End cycle 72C: 2 min
- Hold at 4C
- Started run at 1:36pm
- Ended run at 3:20pm
- Gathered three gel boxes and a power supply for PCR. Set up in Becker lab. Following Student lab SOP for PCR
- Loaded gels with prepared mixes and DNA ladder
- Placed 10μL Low range DNA ladder (Thermo Scientific MassRuler Low Range DNA Ladder, ready to use 60.8ng/μL, 500μL #SM0383 Lot 00251093 Store at room temp or at -20C for longer periods) from student supplies into well 1 of each gel after placing gel in gel boxes and pouring 1X TAE buffer in box until just covering gel.
- Water only PCR run- Placed 10μL of mix into wells 2,3,4,5,6 and 7
- Water/DNA PCR run- Placed 10μL of water mix into 2,3,4 and DNA mix into 5,6,7. Used one of the spare waters for well 2 here to make complete replication. Should have no issues as they were all made from the same Master Mix and molecular water.
- Ran PCR for 30 min at 200V.
- Started at 3:55pm
- Ended at 4:25pm
- Took Gels to Erica Cline's lab in the UWT Science building and took photographs of the three gels over a UV light with black box and camera attachment.
- All gels appear to have PCR product in them. Unfortunately, similar as the last PCR run on 4/8/15, we seem to have contamination issues. This is evident in out negative control group (the water samples witno DNA). Even the gels with just water in them show that there is DNA in the product which should not be since we made sure to not add the P. generosa DNA to the PCR tubes and added the DNA last and only to the 8 strip tube for the WATER/DNA gel.
- Contamination must be occurring somewhere in the mix of Apex, water, and the fwd and rev primers. The water was poured straight from a bottle of uncontaminated water, the Apex should not be contaminated as it was opened at the last run and should be pure This leaves us with the aliquots of Primers that we are using which may have been contaminated when prepared 4/8/15.
- For the next steps, I will re-prepare an aliquot of fwd and rev primers and run just water to test if primers were an issue.
Images below were taken from today's results. Image 1 (top) was from Water and DNA PCR run showing wells 1-7 set up as ladder, water,water, water, DNA, DNA, and DNA respectively all lanes show PCR product where only the last three should. Image 2 (middle) was from our Water only run showing wells 1-7 set up as ladder, water, water, water, water, water, and water respectively. All lanes show PCR product where no product should be showing beyond the DNA ladder. Image 3 (bottom) was from out Water (spare) run showing wells 1-6 set up as ladder, water, water, water, water, and water respectively. All lanes show PCR product where no product should be showing beyond the DNA ladder.
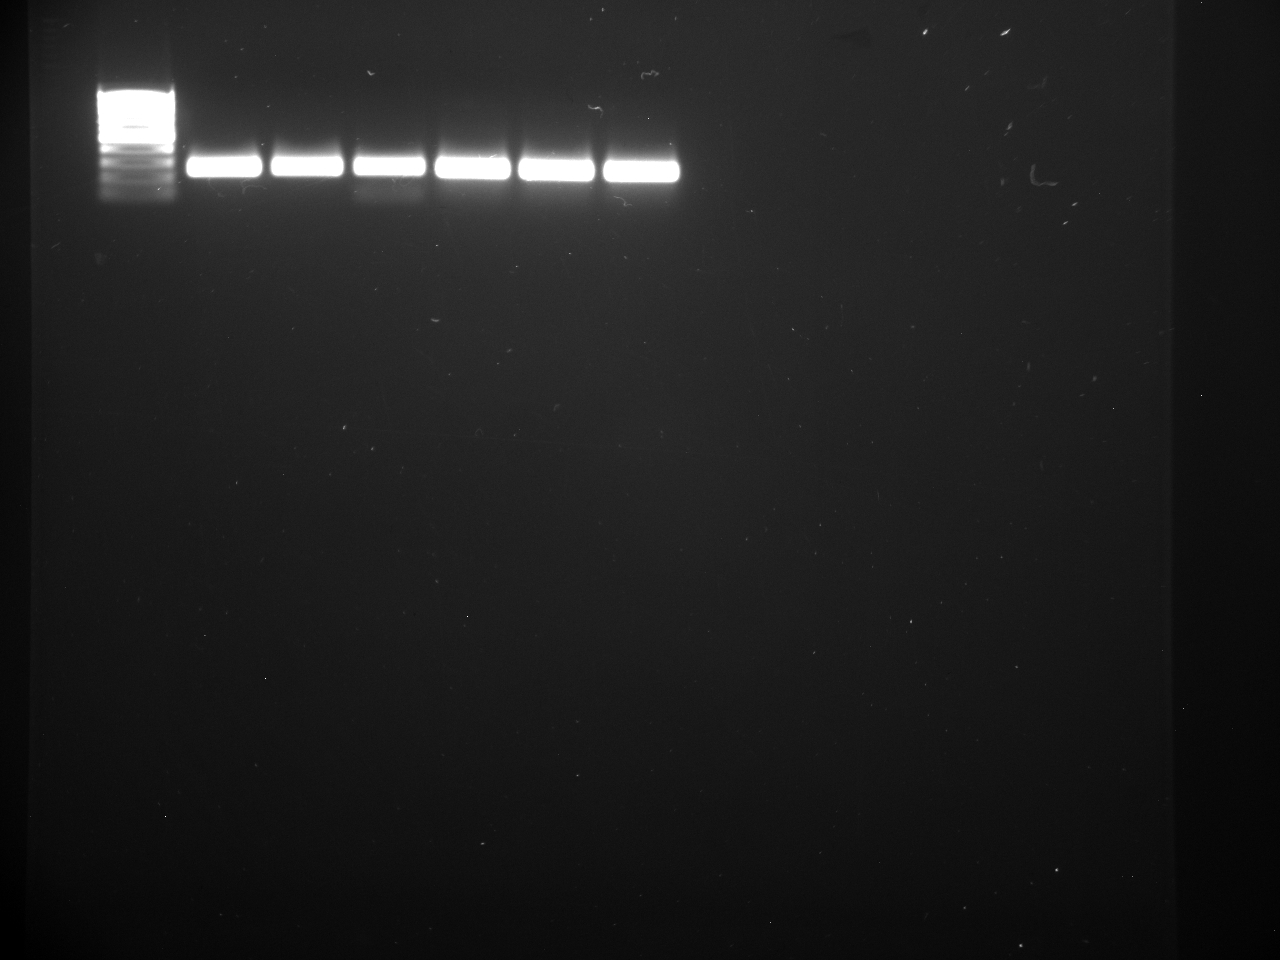
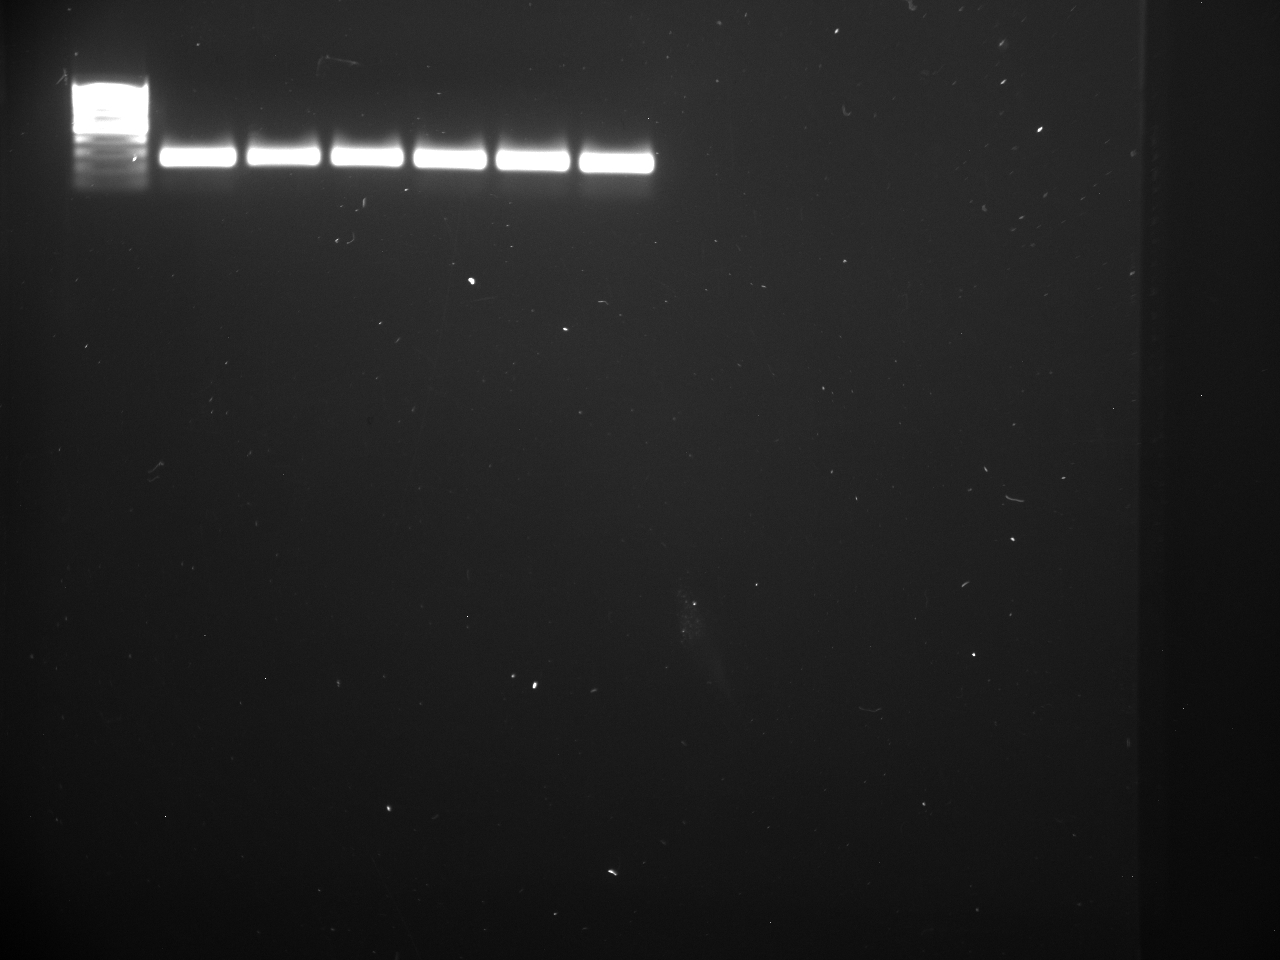
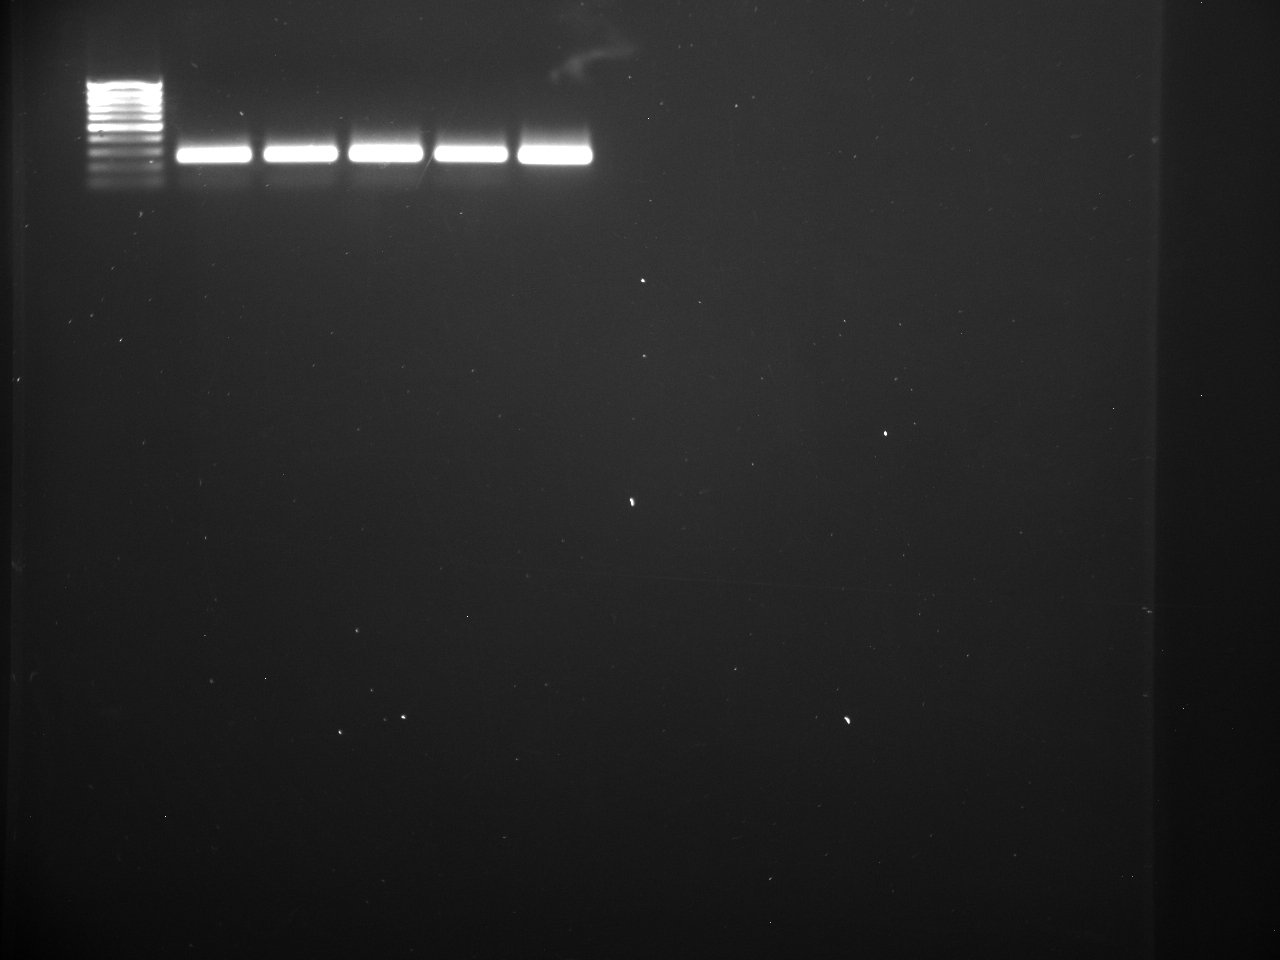
April 22, 2015
UWT- Becker Lab
McCartha_Smithhisler
Preparing and Pouring 1.2% agarose gel
Created by: Michelle McCartha
Goal
- Need to make and pour 1.2% agarose gel using 1X TAE buffer. Need 3 gels to run PCR 4/23/15. Using Student lab SOP for making agarose gels and methods used from 4/8/15 when gels were poured in the Robert's Lab at SAFS since using mixed supplies (supplies that can be gathered from UWT supplies as well as those given by the student lab.
Methods
- 0.6g agarose and 50mL 1X TAE makes 1.2% agarose gel.
- Need 300mL for 3 gels
- Need 3.6g agarose with 300mL 1X TAE to make 3 1.2% agarose gels.
- Weighed out 3.6 g agarose (Actual mass 3.681g)
- Poured 200mL 1x TAE into Erlenmeyer flask.
- Poured measured agarose into flask, rinsing weigh boat with remaining 100mL 1X TAE.
- Took to room 215 in UWT Science building (where microwave is located)
- Microwaved mixture for 7 30sec intervals swirling between intervals.
- Once all agarose has disolved in TAE took back to Bonnie's lab and added 30μL SyberSAFE dye (1:10,000 =10μL for every 100mL) and swirled to dye is throughout solution.
- Cleaned pouring lane and three gel trays using kimwipe and di water added combs to trays.
- Dispensed gel solution to three trays so that it is about 2/3 full.
- Let sit for 45 minutes
- Came back and gels solid. Wrapped in Clingwrap and placed in fridge for later use.
April 16, 2015
McCartha_Smithhisler
UWT- Becker Lab
Diluting 50X TAE to 1X for PCR
Created by: Michelle McCartha
Goal
Need to dilute 50X pre-made and purchased TAE product (Made by BioRad) to 1X so that can use for PCR gels and running PCR.
Methods
- Want 2500mL 1X TAE buffer
- For 500mL
(50X) (x) = (1X) (500mL)
x= ((1X)(500mL))/ 50X
x= 10mL of the 50X TAE Buffer
- For 2000mL
(50X) (x) = (1X) (2000mL)
x= ((1X)(2000mL))/ 50X
x= 40mL of the 50X TAE Buffer
- Added 40mL 50X TAE TO 2000mL volumetric and filled with DI to 2000mL measurement line.
- Added 10mL 50X TAE TO 500mL volumetric and filled with DI to 500mL measurement line.
- Mixed two solutions together in large container until well mixed.
- Dispensed solutions into 3 labeled 1L Nalgene bottles and stored in acid cabinet until use.
April 8, 2015
McCartha_Hintz
Testing primers on geobuck DNA using PCR gel
Method
Preparation - Re-suspending and aliquoting primers
- To make a 100uM stock concentration,
- Multiply the nmole amount printed on the stock package by 10 (This will vary by assay!),
- Add that amount of Low TE in microliters (uL).
- Finger vortex, let sit for 5 minutes, then finger vortex again to make sure the assays are completely dissolved and re-suspended.
- Pg_18s_385_F
- geoduck fwd
- 23.3 nmol
- added 233 μL of low TE
- Pg_18s_632_R
- geoduck rev
- 29.4 nmol
- added 294 μL of low TE
- To make aliquots 10 μM aliquots (making 1 100μL aliquot today)
- (C1V 1=C2V 2; 100μM x ?uL = 10μM x 100uL)
- 10 μL of stock solution
- (C1V 1=C2V 2; 100μM x ?uL = 10μM x 100uL)
- 90 μL of molecular H2O
- Start by adding H2O to the aliquot vials, then add the smaller volume oF stock solution into the H2O
- Creating Master Mix
- Apex - 2.0X Taq RED Master Mix
- Per cell calculations (total volume 25)
- Apex - 12.5 μL
- Fwd - 0.5 μL
- Rev - 0.5 μL
- H2O - 9.5 μL
- DNA - 2 μL
- 3 DNA runs - 3 H2O runs - 6 total
- Total volume for Master Mix (x6.2)
- Apex - 77.5 μL
- Fwd - 3.1 μL
- Rev - 3.1 μL
- H2O - 58.9 μL
- Created master mix - started with H2O, then primers, then Apex
- To each PCR vial
- added 23 μL of master mix
- added 2 μL of geoduck (Pg) DNA to 3 of the vials
- added 2 μL of H2O to the other three vials
- Note: H2O.3 had a little less that 23 μL of master mix
- Placed samples on DNA Engine (Thermocycler) on cycles according to Sam's instruction.
- Making gel (50 mL)
- precision is not important
- 1.2% gel (higher concentration than normal, smaller fragment of DNA) - slows them down
- 50 mL 1X TAE (tris acidic acid EDTA buffer)
- 0.6 g of agarose
- Combine TAE and agarose in a volumetric flask, tarr the weight of the flask (with contents) on the balance
- microwave for 3 minutes (stopping to swirl occasionally)
- end goal - wait until agarose is dissolved (time in microwave may vary)
- place back on balance, add more TAE buffer until the balance reads 0 (slightly above) to replace what was loss in evaporation
- swirl to mix together
- end mass 2.20 grams
- wait 15 minutes for it to cool down
- you can place in it a water bath set to 55 C - where it will cool enough to handle but not solidify
- add ethidium bromide (the stain) 5 μL and swirl to combine
- add the comb (purple one, with the 1.5 side up) and pour in the solution, poke any bubbles with a pipette tip and allow to set up (~30 min)
- Pipetted samples into openings including a DNA ladder sample so the samples are set up as (Left to Right) DNA Ladder, Pg, Pg, Pg, H2O, H2O, H2O.
- Hooked up the gel boxes and set to 107 volts. Ran for approx 20 min until it appeared to be finished running.
- Pg DNA was amplified in all samples which could mean that there was contamination somewhere during the process. Moving forward, we will test the method again making a master mix and running PCR with just water in the samples then again with water and Pg
April 2, 2015_McCartha_Smithhisler
Using DNA sequence titled "1590257Pabr" from fasta (attached below) that was used in Becker et al. 2012 which was emailed from Christine Henzler, worked produced another primer so that I could show Brenda (new undergraduate in Becker Lab) how I generated the previous primers. Used Primer3 to generate primers.
GeoVerifAll.nxs.fasta
DNASequence_04-02-15.txt
Primer3 Output_4-2-15_R-Primer_F-Primer.docx
March 12, 2015_McCartha
Digested geoduck tissue from siphon of preserved sample in order to evaluate DNA output.
Worked on probe and primer production with Sam using NCBI, Primer3, and ARB-Silva Database
Primer3Output_3-12-15_Probe_R-Primer_F-Primer.docx
DNA_Sequence_Panopeaabrupta.txt
