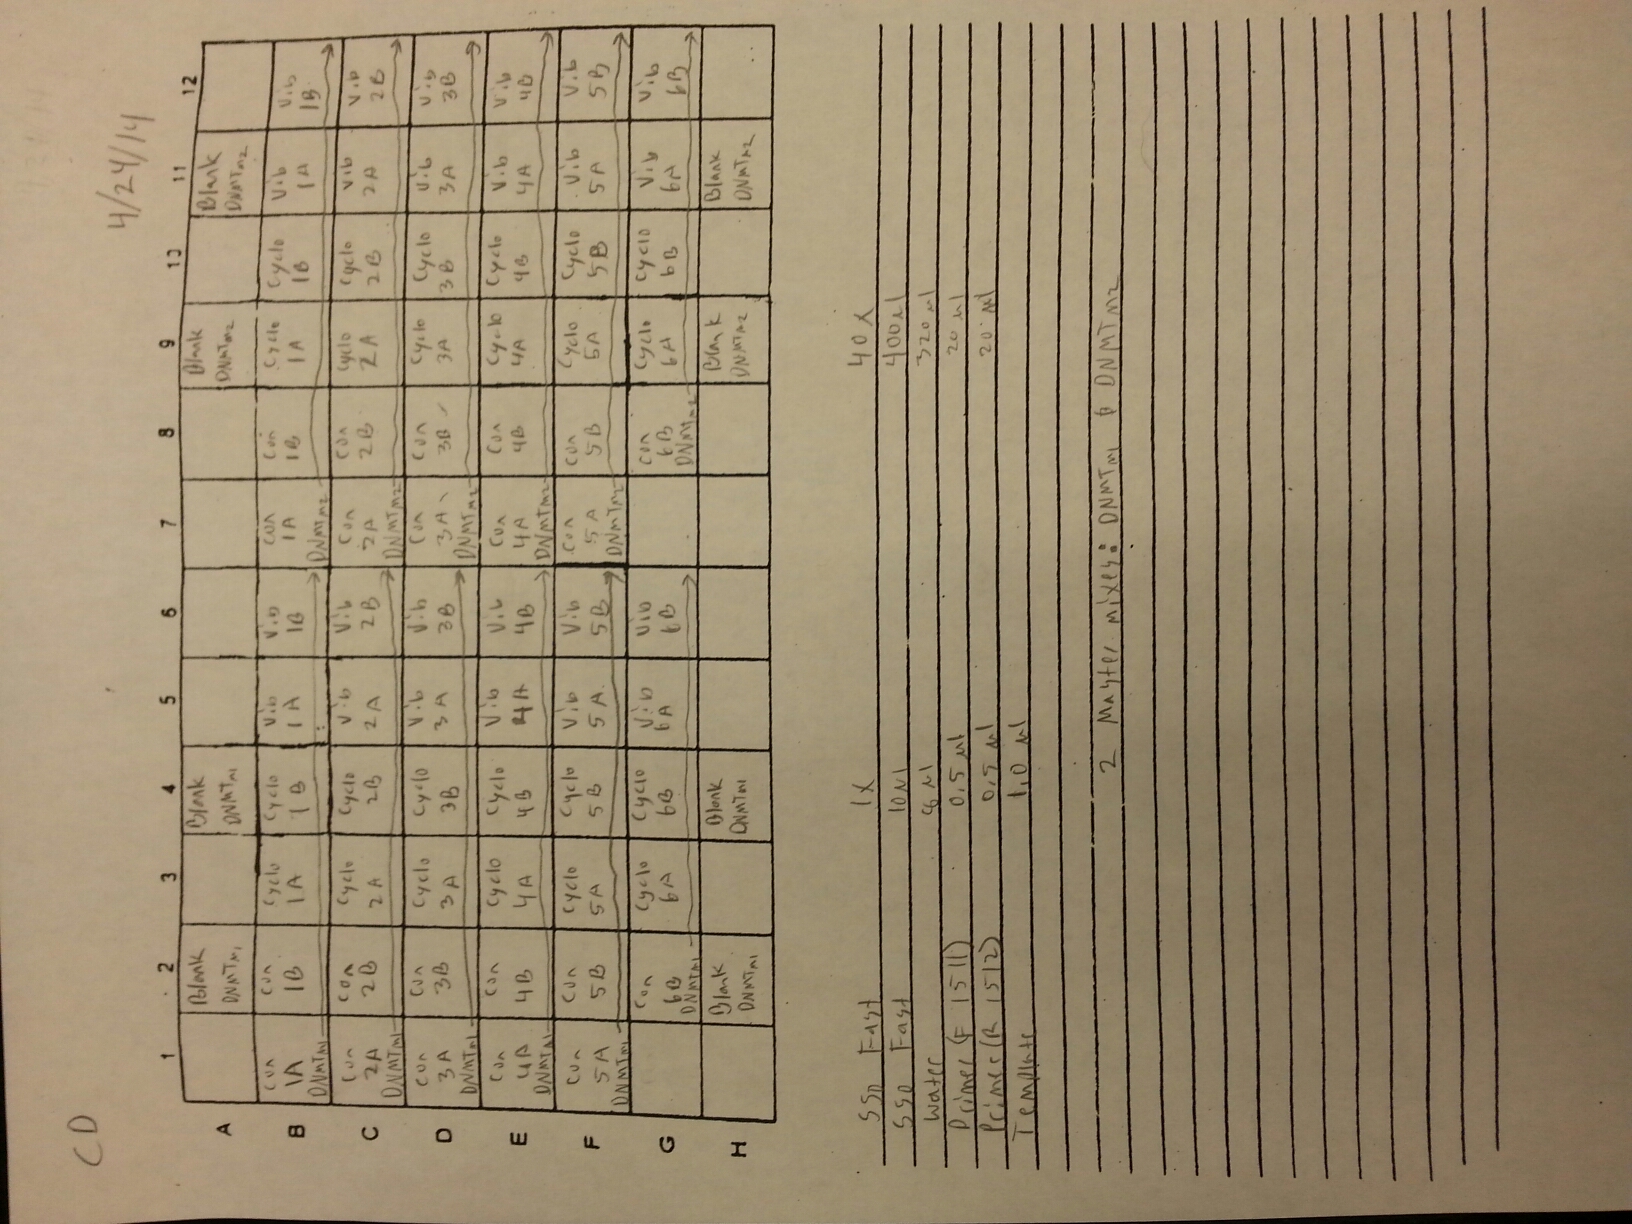
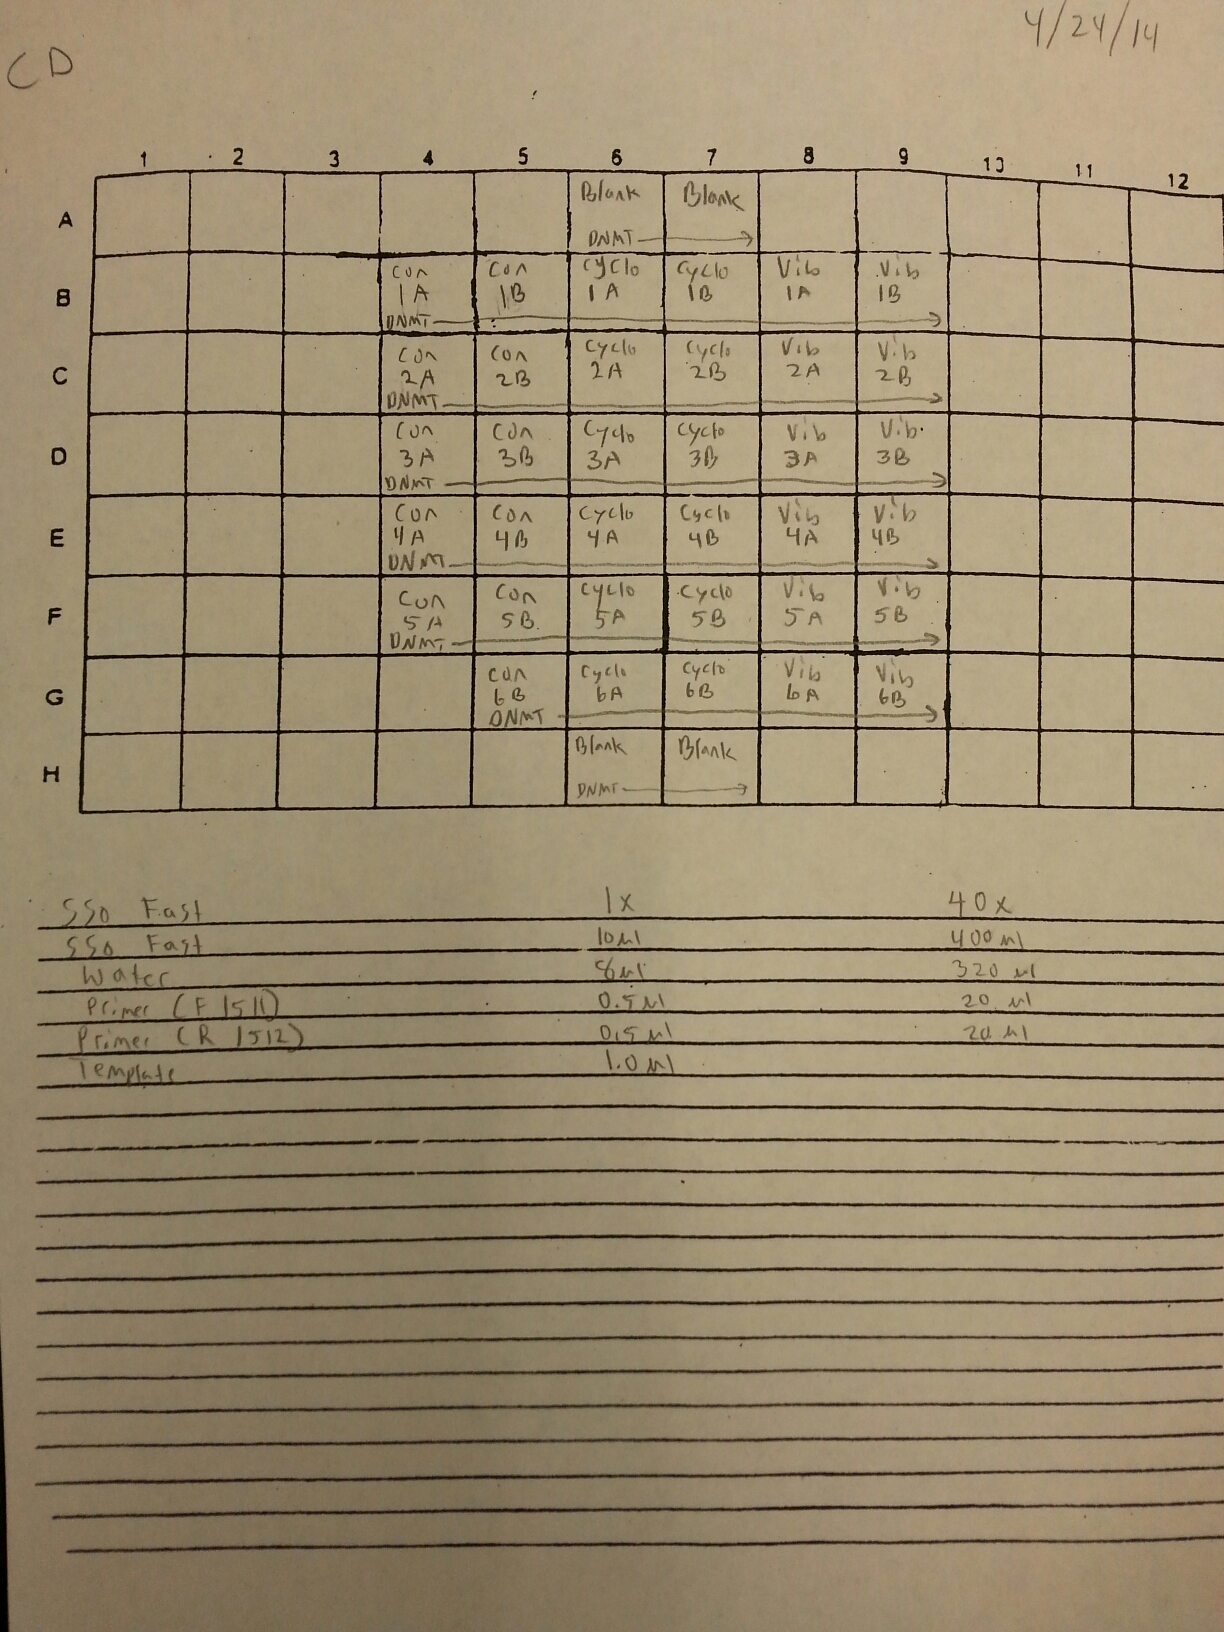
It was found that there was no significant difference between any of the genes for the pooled samples so it was decided to use DNMT as the only epigenetic gene for my capstone project. The cDNA samples from 4/9/14 were ran in duplicate for DNMT. The master mix protocol and plate loading order can be seen here. The results of the qPCR can be seen below and it appears that all cDNA samples replicated and all the blanks were clean.


A second qPCR was then ran using the DNA samples from 4/9/14 for DNMT but without any replicates. The master mix protocol and plate loading order can be seen here. The results of the qPCR can be seen below and it appears that all cDNA samples replicated and all the blanks were clean.


4/23/14
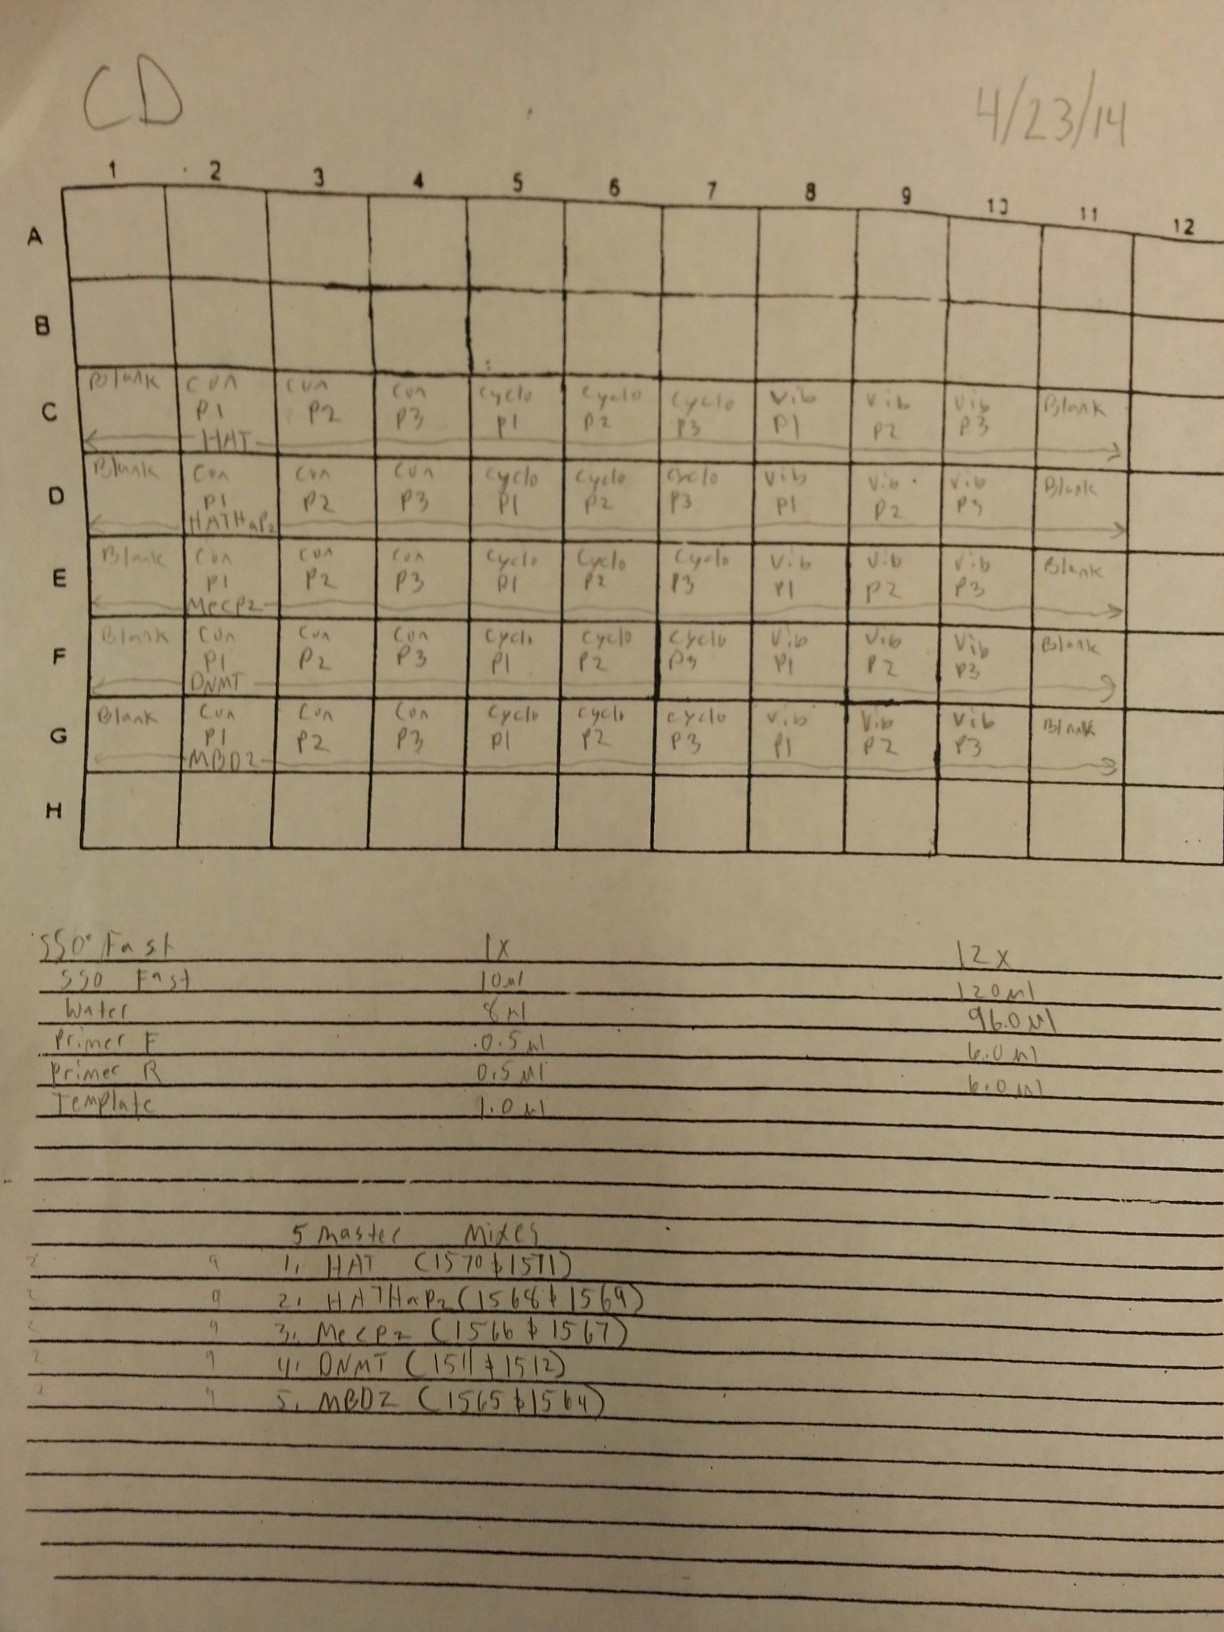
Nine pools of cDNA were made from the samples from 4/9/14 to test the epigenetics genes of interest and determine whether there was any significant difference between the three treatment groups in expression. The pools were created by adding 2 uL of each cDNA sample shown below to a tube to create the nine pools then taking 1 uL of cDNA from each pool to use as template. The plate loading order and master mix protocol can be seen here. The results of the qPCR can be seen below and it appears that all of the blanks were clean while all the wells containing cDNA amplified.
Control Pool 1: 1A, 1B, 2A, 2B
Control Pool 2: 3A, 3B, 4A, 4B
Control Pool 3: 5A, 5B, 6B
Cyclo Pool 1: 1A, 1B, 2A, 2B
Cyclo Pool 2: 3A, 3B, 4A, 4B
Cyclo Pool 3: 5A, 5B, 6B
Vibrio Pool 1: 1A, 1B, 2A, 2B
Vibrio Pool 2: 3A, 3B, 4A, 4B
Vibrio Pool 3: 5A, 5B, 6B


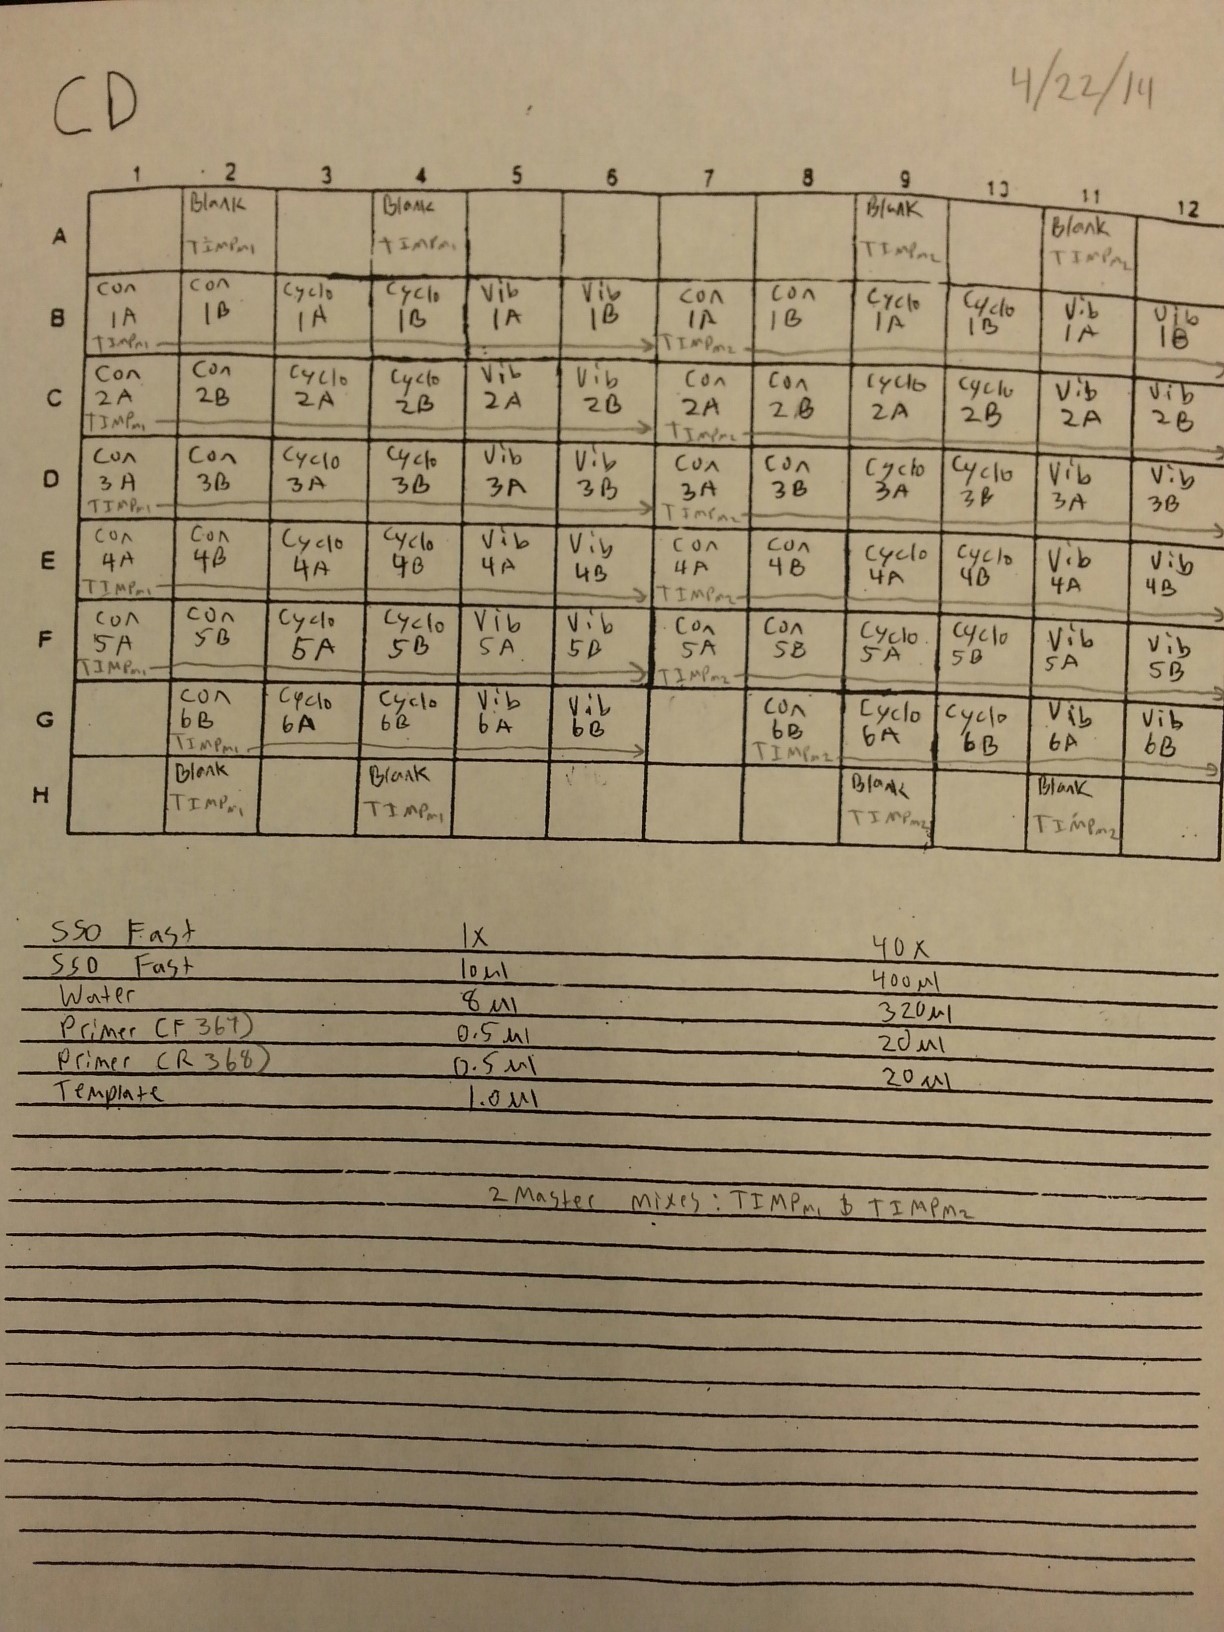
4/22/14
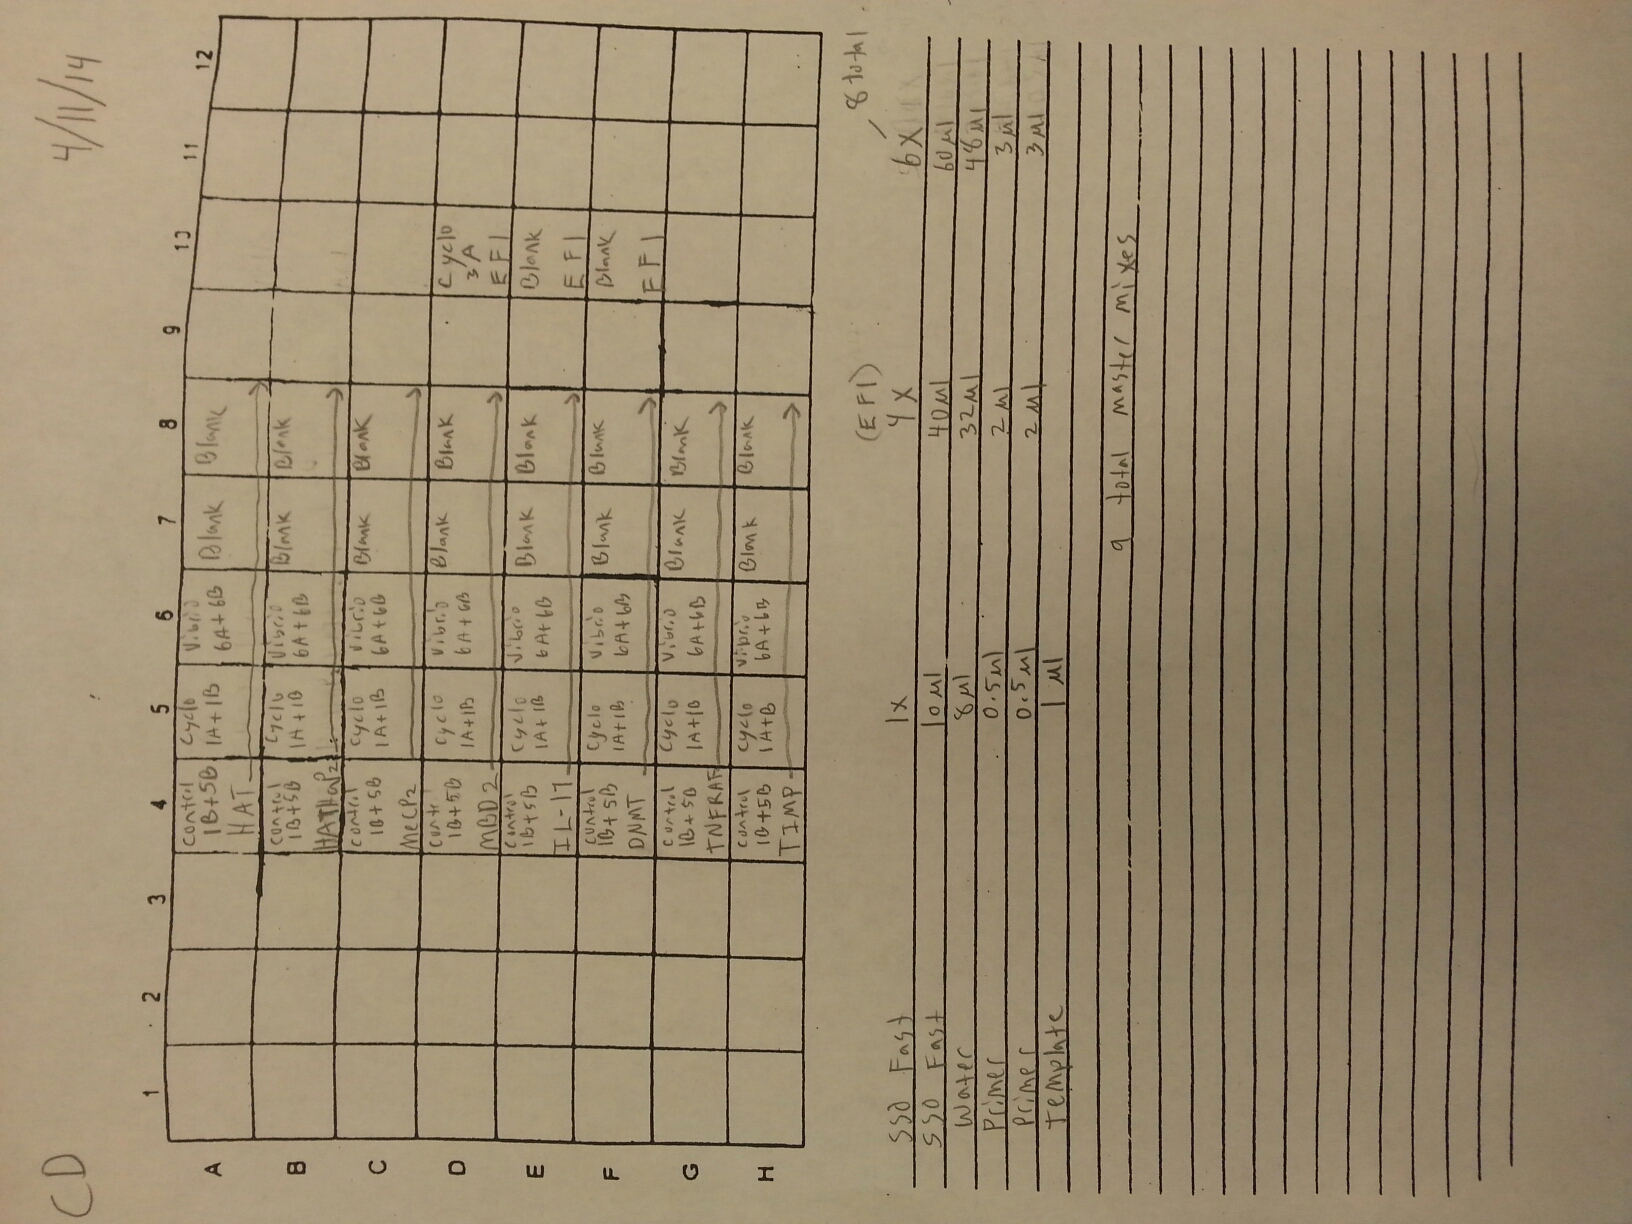
The cDNA samples from 4/9/14 were ran in duplicate for the TIMP gene. The master mix protocol and plate loading order can be seen here. The results of the qPCR can be seen below and it appears that all cDNA samples replicated and all the blanks were clean.


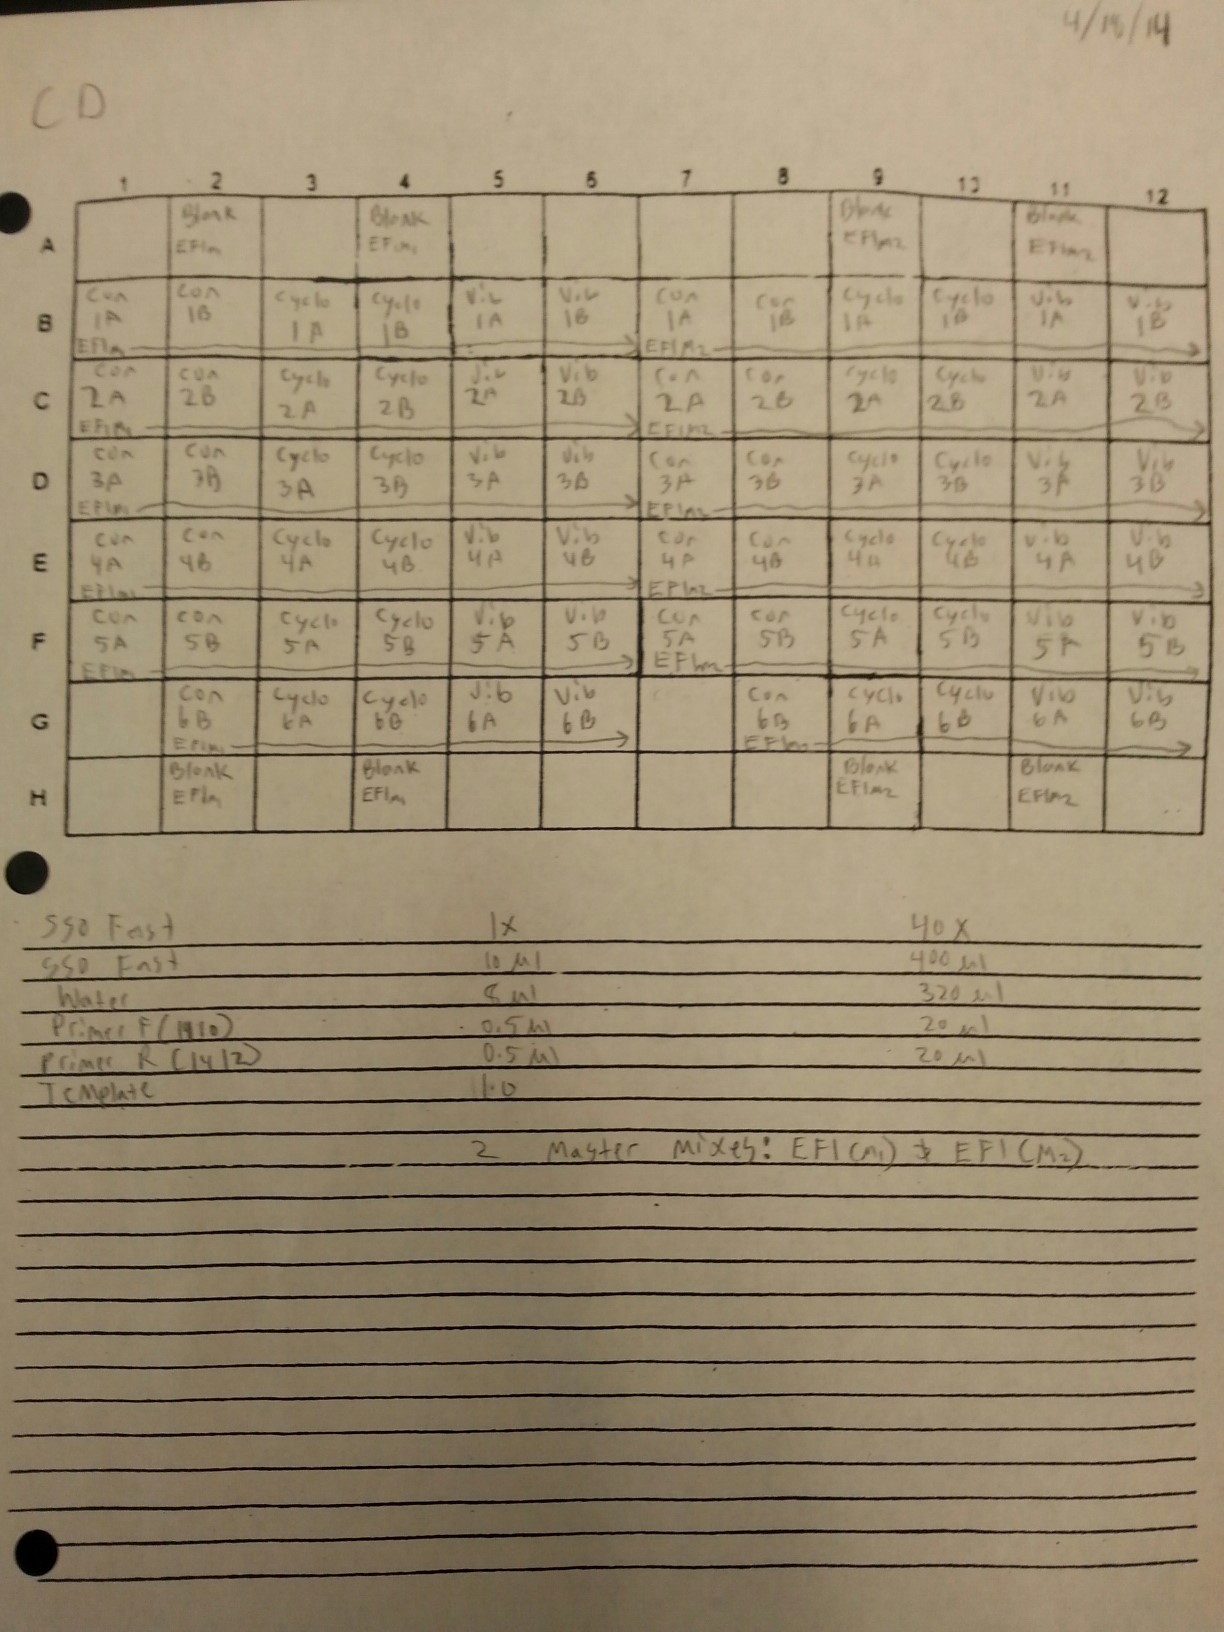
4/18/14
The cDNA samples from 4/9/14 were ran in duplicate for the EF1 gene. The master mix protocol and plate loading order can be seen here. The results of the qPCR can be seen below and it appears that all cDNA samples replicated and all the blanks were clean.


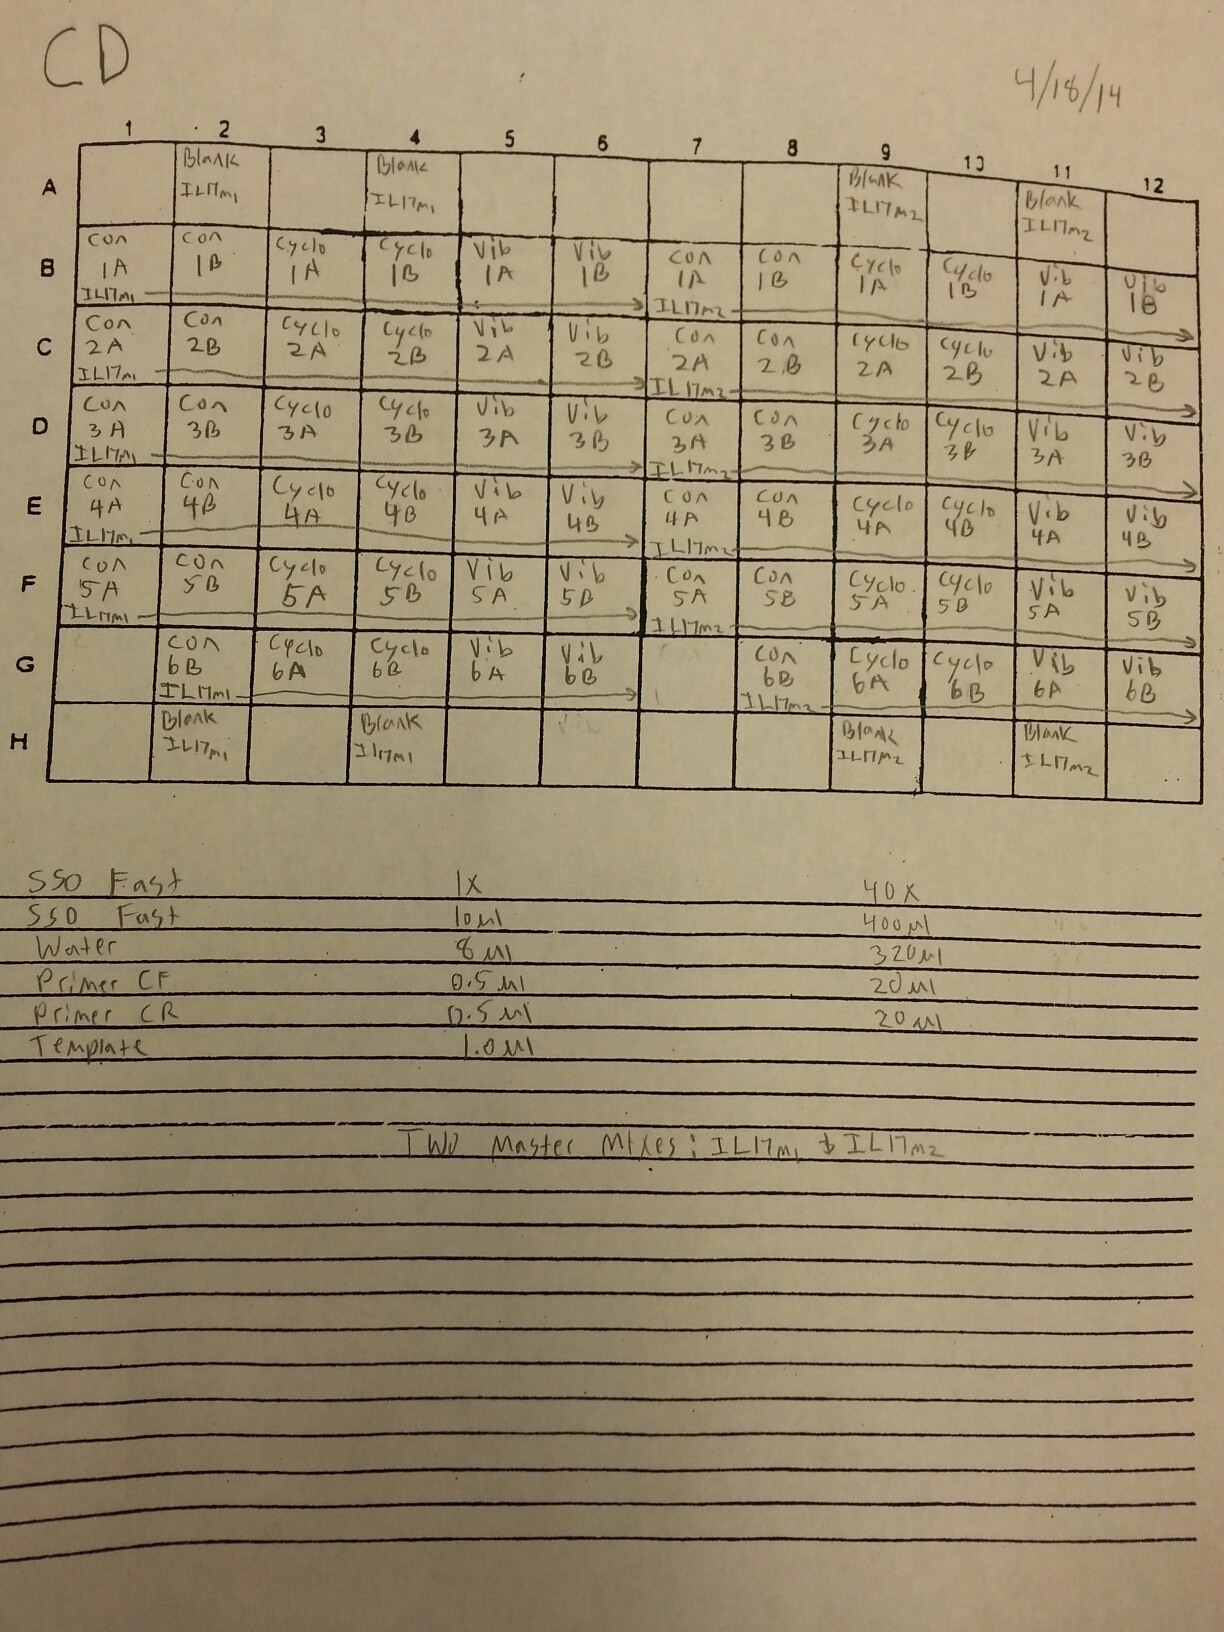
The cDNA samples from 4/9/14 were then ran in duplicate for IL-17. The master mix protocol and plate loading order can be seen here. The results of the qPCR can be seen below and it appears that all cDNA samples replicated and all the blanks were clean.


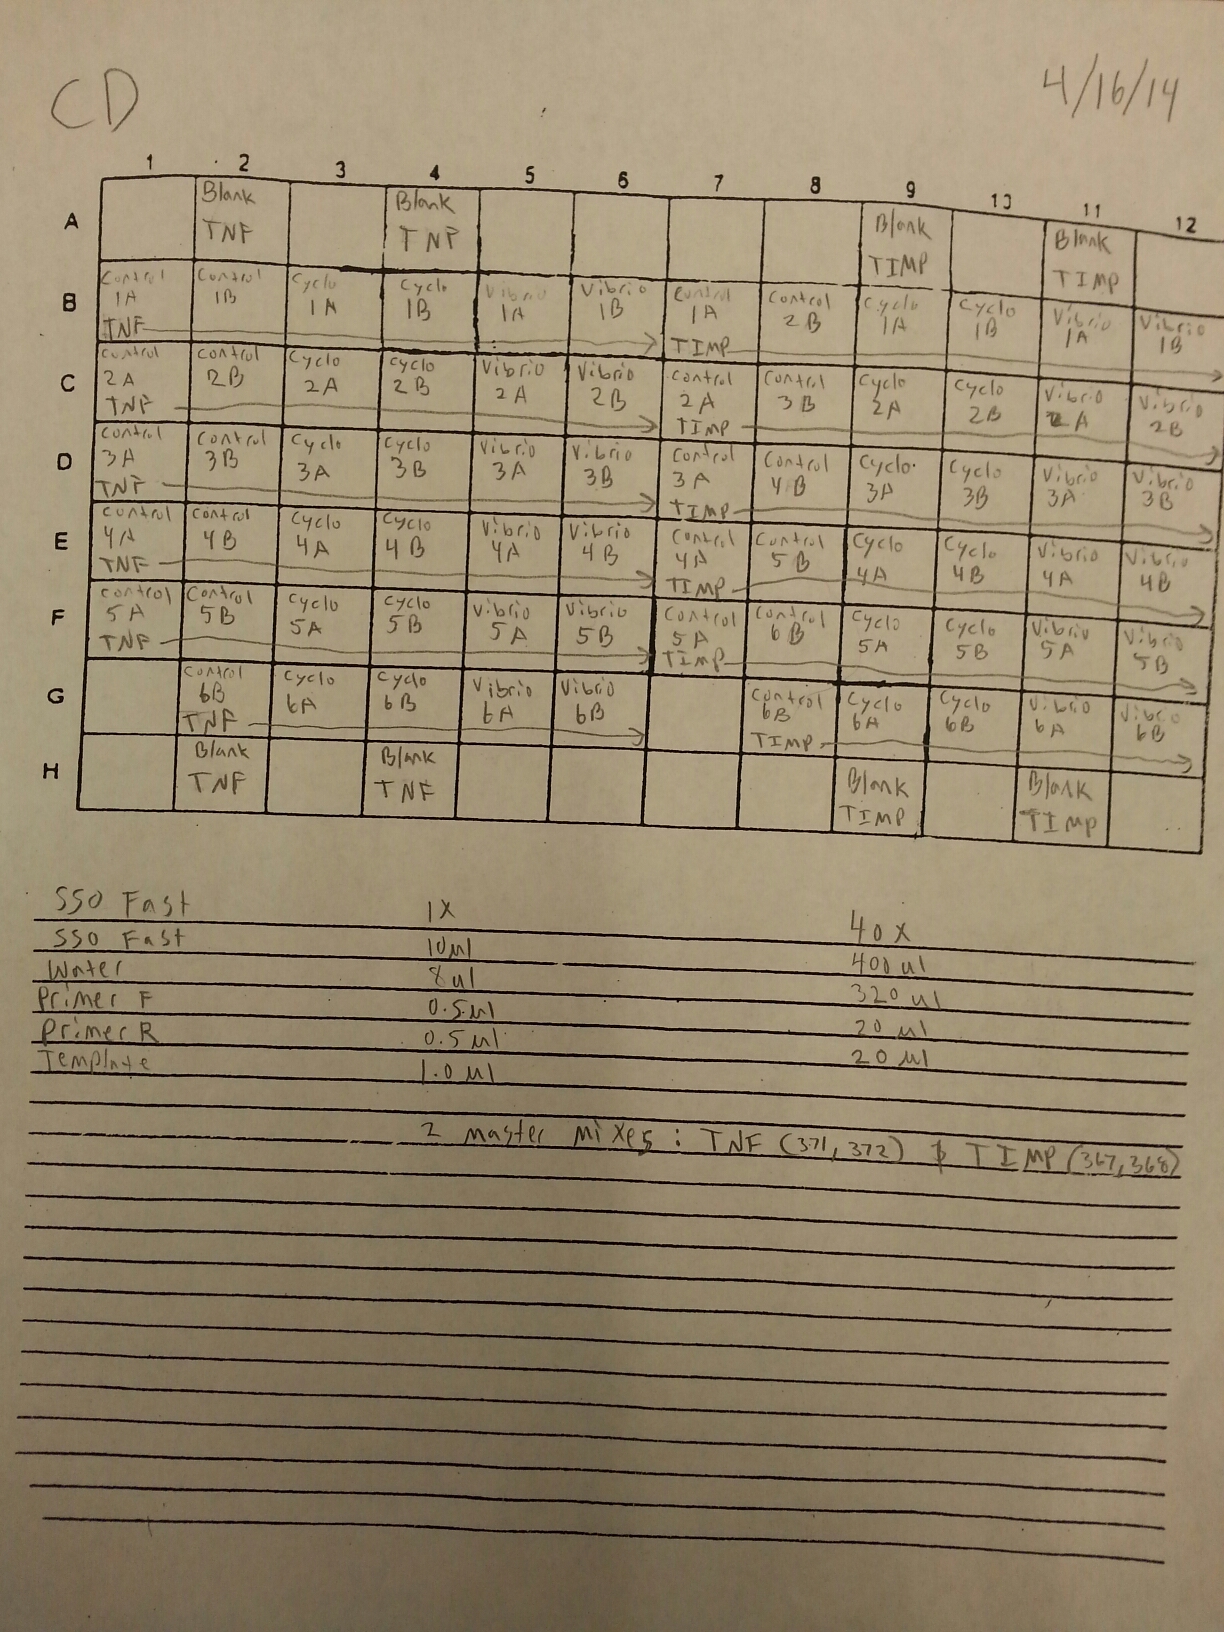
4/16/14
The cDNA samples from 4/9/14 were ran twice on a qPCR using the primers for the defense genes which were TNFRAF and TIMP. The master mix protocol and plate loading order can be seen here. The results of the qPCR can be seen below and it appears that all cDNA samples replicated and all the blanks were clean.


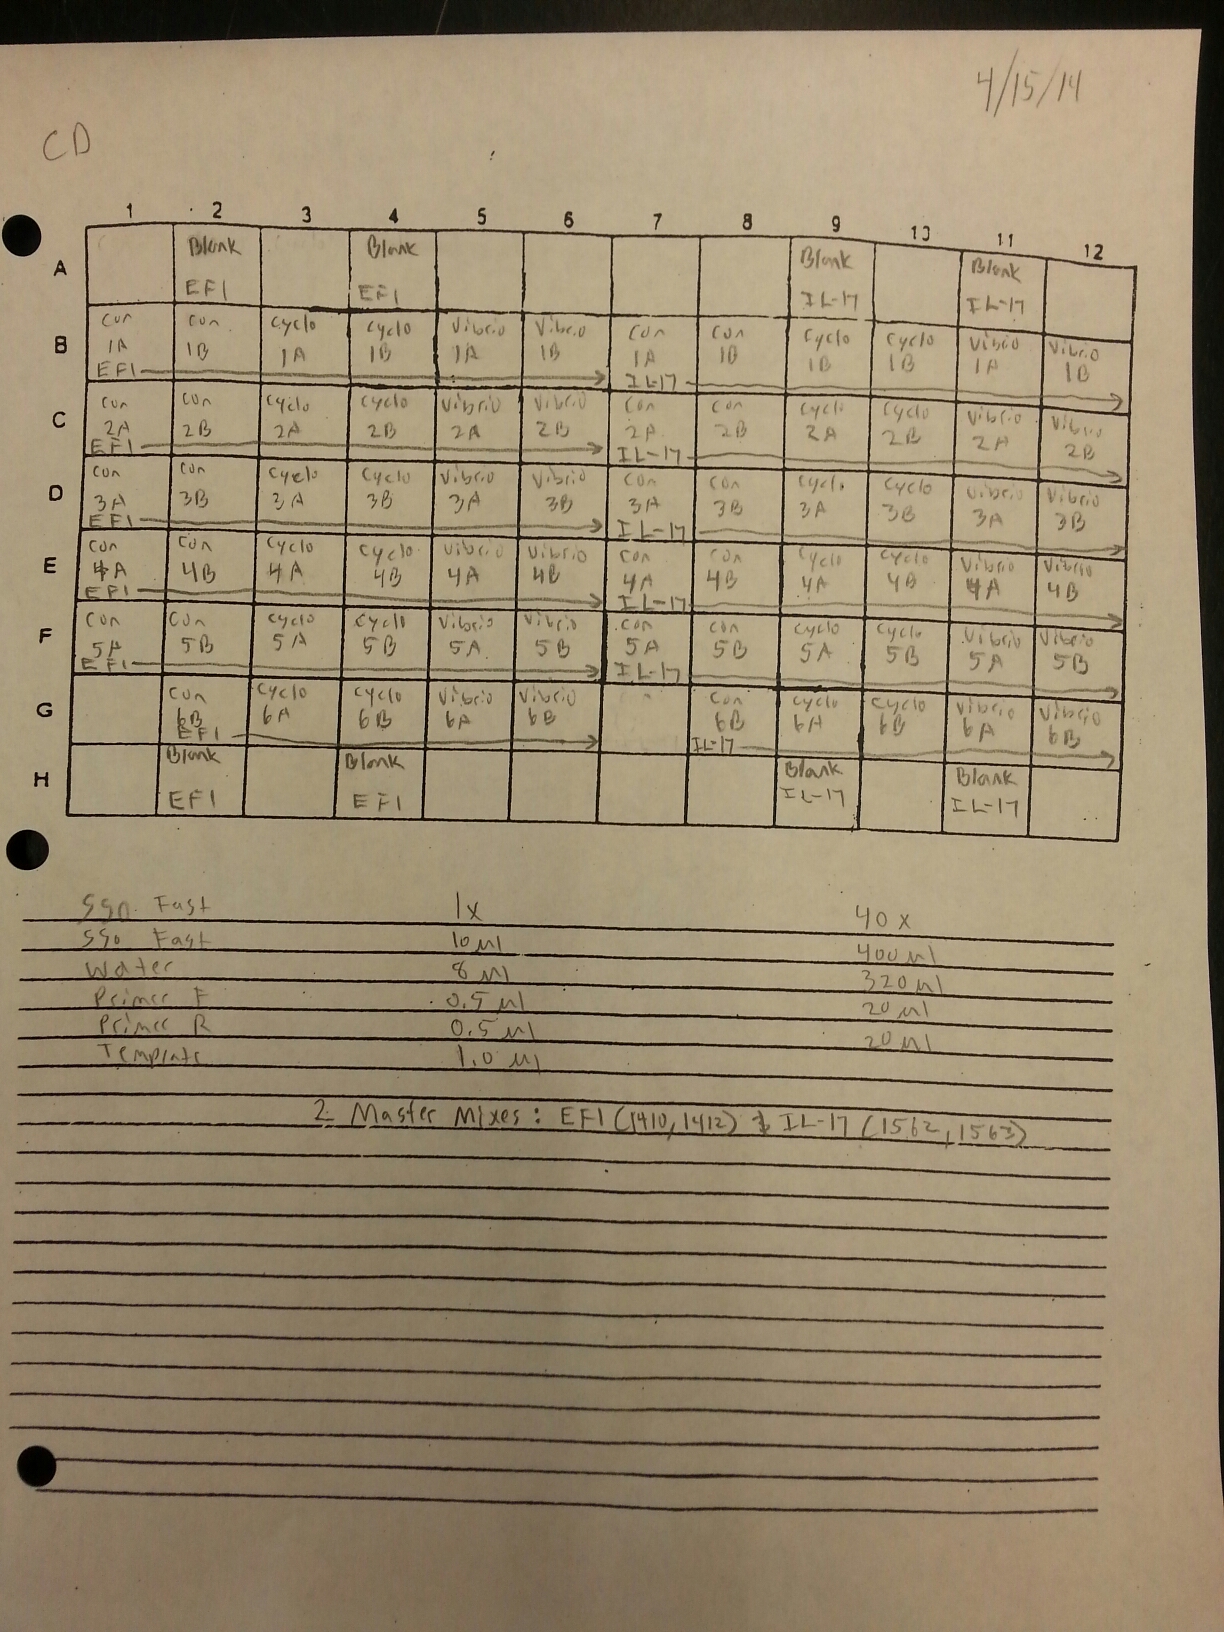
4/15/14
The cDNA samples from 4/9/14 were ran twice on a qPCR using the normalizing primers for the normalizing gene which was EF1 and primers for the the defense gene IL-17. The master mix protocol and plate loading order can be seen here. The results of the qPCR can be seen below and it appears that all cDNA samples replicated and all the blanks were clean.


4/11/14
The DNased RNA sample Cyclo 3A was reverse transcribed again today since the RT from 4/9 for this sample did not work. In addition to Cyclo 3A, a mixture of three other samples were also reverse transcribed so that gill cDNA could be used to test the primers from 4/2. The additional three samples were Control (1B + 5B), Vibrio (1A + 1B), and Cyclo (6A + 6B). The cDNA was made following the reverse transcription protocol from Promega M-MLV found here. The volumes of RNA and water used in the reaction can be seen in the table below. The amount of RNA used was the same as 4/9 which was 0.881 ug.
| Sample ID |
RNA Concentration (ng/ul) |
RNA (uL) |
water (uL) |
| Cyclo 3A |
77.43 |
11.37 |
6.38 |
| Con 1B + Con 5B |
149.00 & 138.97 |
2.95 + 3.17 |
10.88 |
| Cyclo 6A + Cyclo 6B |
113.24 & 159.57 |
1.94 + 3.11 |
12.70 |
| Vib 1A + Vib 1B |
141.62 & 226.54 |
3.89 + 2.76 |
11.10 |


4/10/14
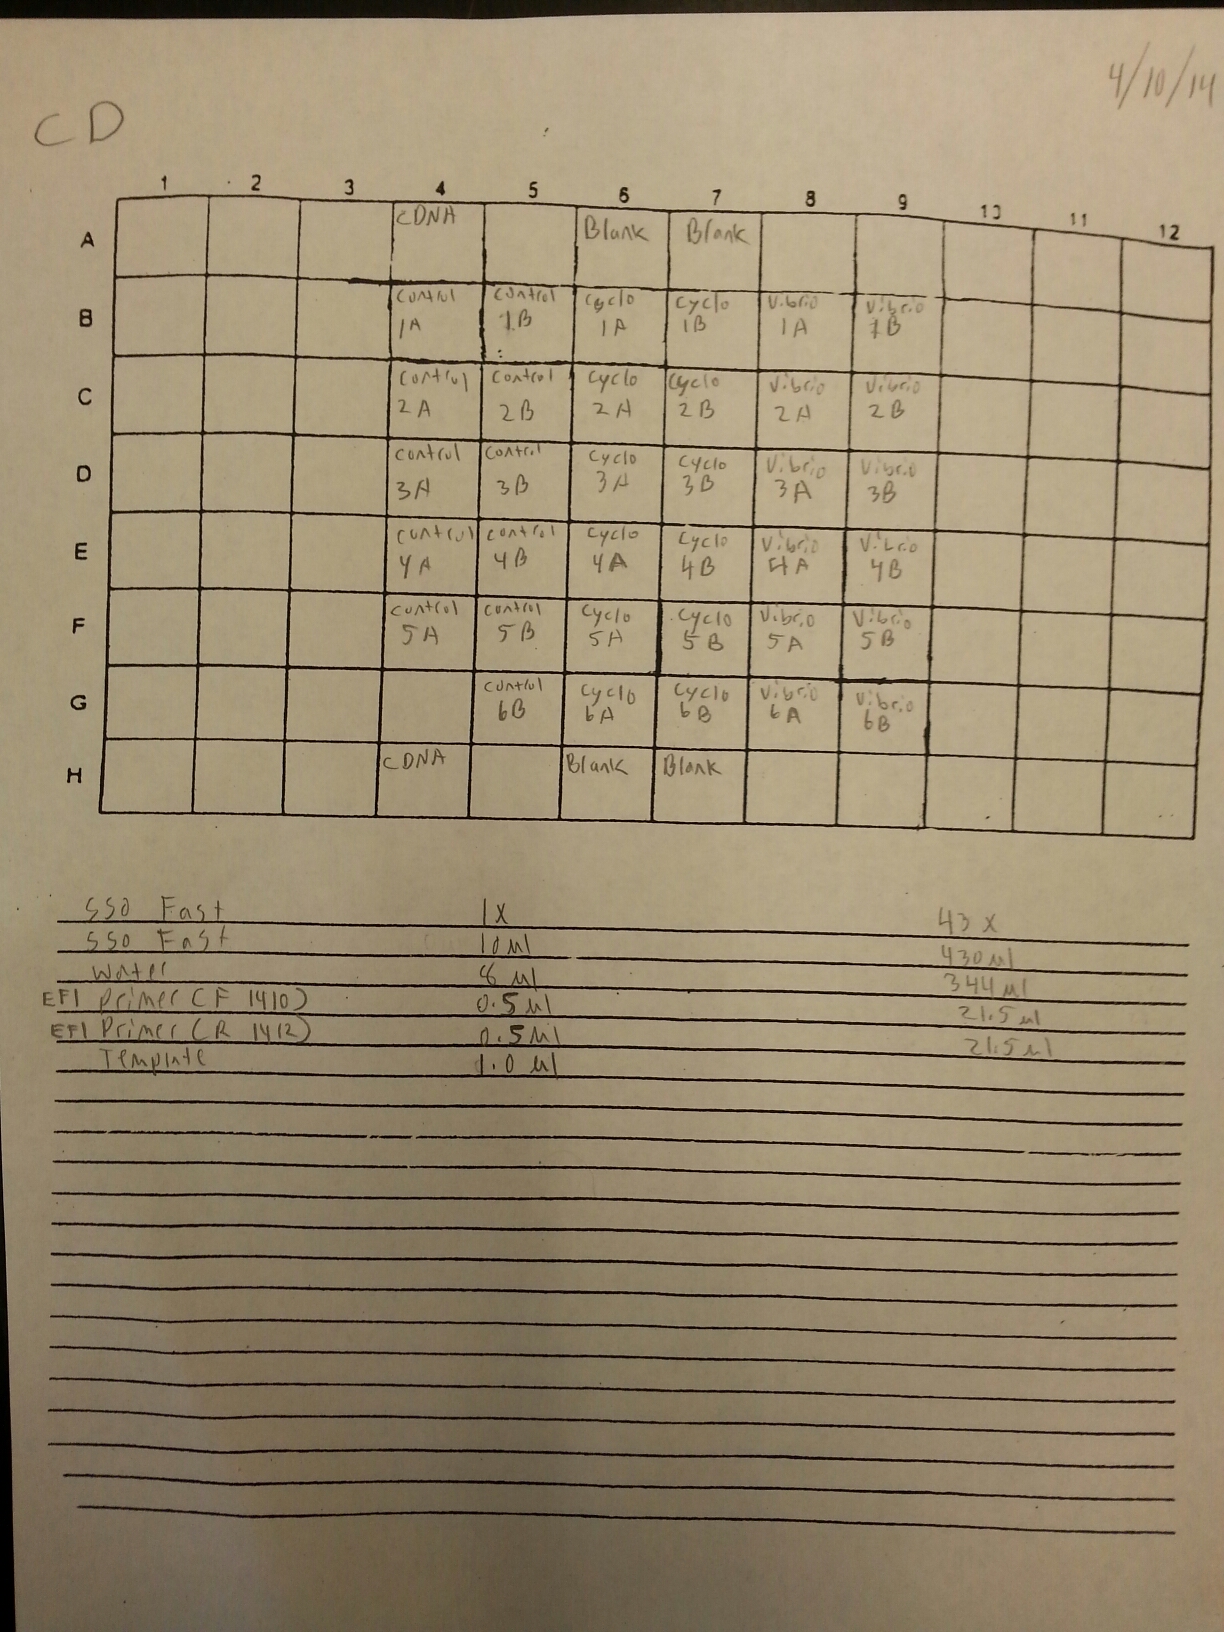
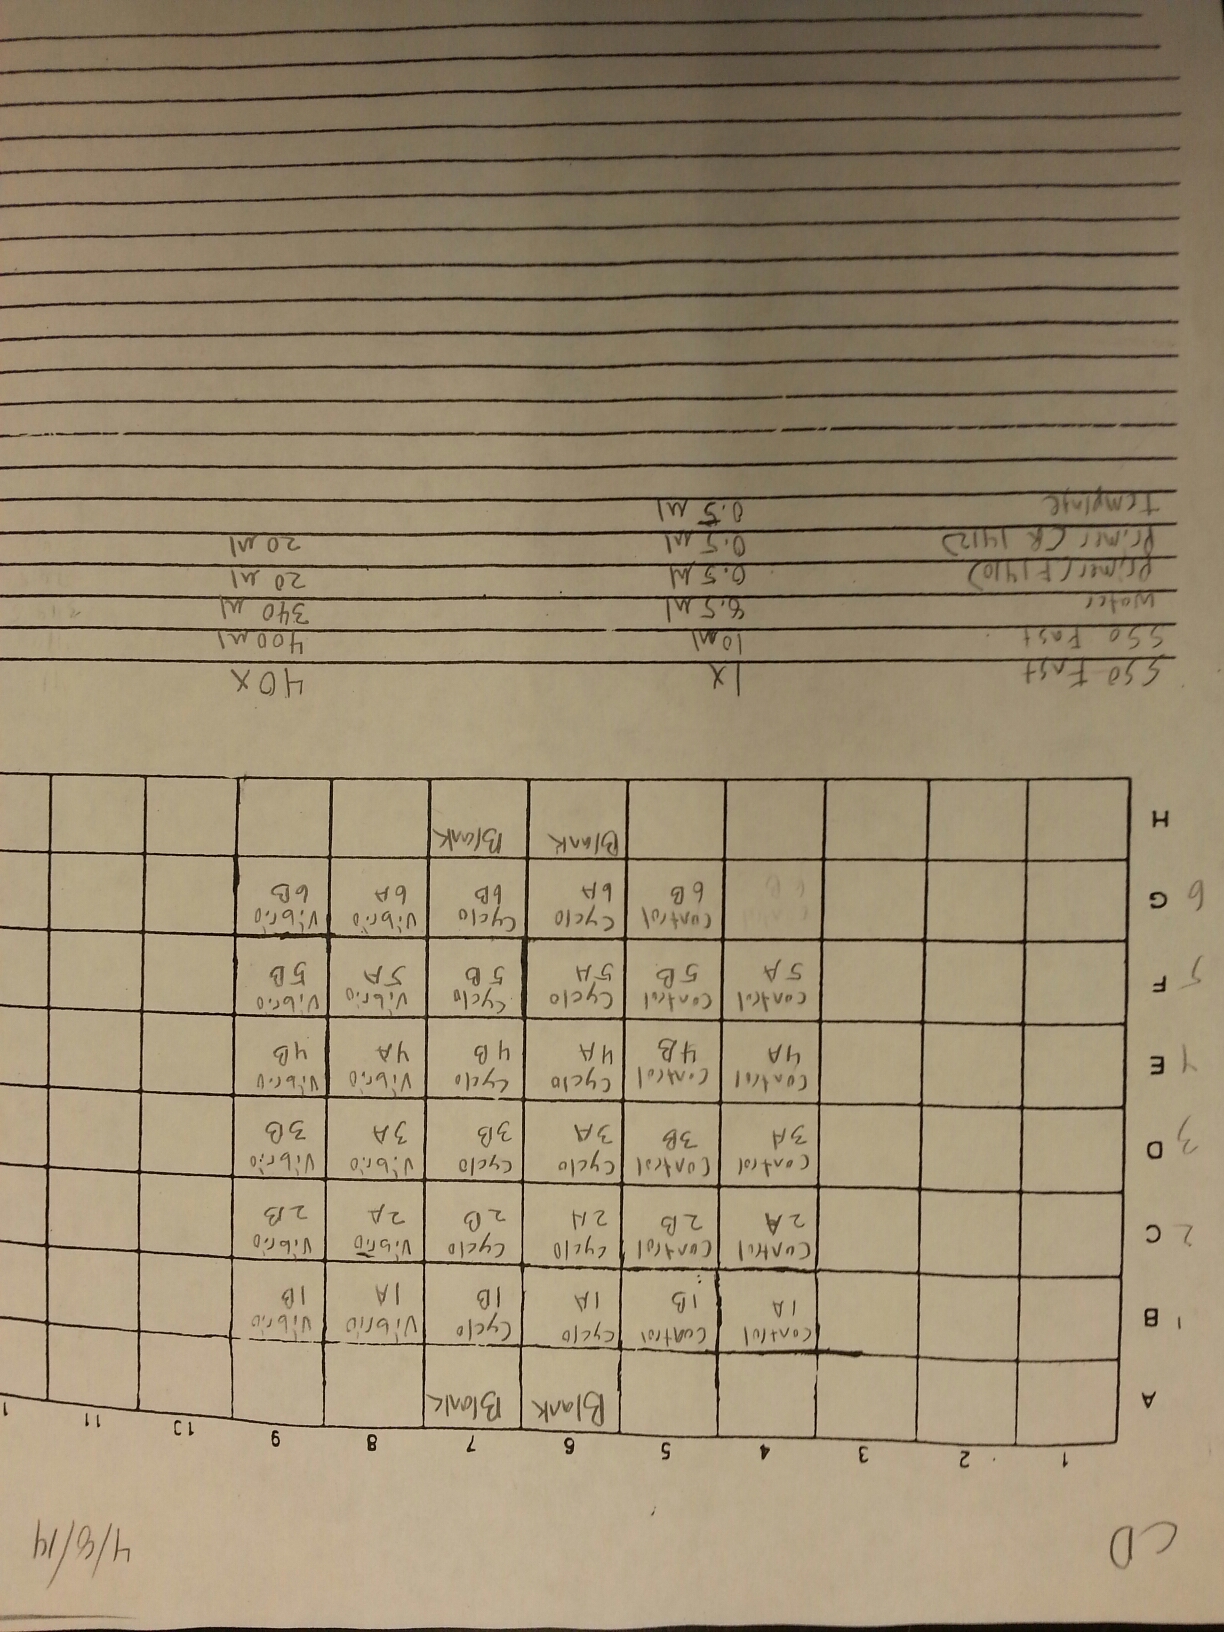
A qPCR was done on the cDNA samples from 4/9 to make sure that they amplified and were reverse transcribed correctly. The plate loading order and master mix protocol can be seen here. The results of the qPCR can be seen below and it appears that all of the blanks were clean. It also appears that one cDNA sample (Cyclo 3A) did not amplify so it will have to be reverse transcribed again.


4/9/14
The DNased RNA samples from 4/8 were made into cDNA following the Reverse transcripiton Promega M-MLV protocol found here. The amount of RNA used was 0.881 ug since the lowest RNA concentration was 49.61 ng/uL x 17.75 uL = 0.881 ug. The volumes of RNA (uL) and water (uL) used in the reaction can be seen below.
| Sample ID |
RNA Concentration (ng/uL) |
RNA (uL) |
water (uL) |
| Control 1A |
96.91 |
9.09 |
8.66 |
| Control 1B |
149 |
5.91 |
11.84 |
| Cyclo 1A |
119.9 |
7.34 |
10.41 |
| Cyclo 1B |
65.52 |
13.44 |
4.31 |
| Vibrio 1A |
141.62 |
6.22 |
11.53 |
| Vibrio 1B |
226.54 |
3.89 |
13.86 |
| Control 2A |
92.01 |
9.57 |
8.18 |
| Control 2B |
60.87 |
14.47 |
3.28 |
| Cyclo 2A |
53.75 |
16.38 |
1.37 |
| Cyclo 2B |
89.34 |
9.86 |
7.89 |
| Vibrio 2A |
49.61 |
17.75 |
0.00 |
| Vibrio 2B |
84.02 |
10.48 |
7.27 |
| Control 3A |
76.58 |
11.50 |
6.25 |
| Control 3B |
70.58 |
12.48 |
5.27 |
| Cyclo 3A |
77.43 |
11.37 |
6.38 |
| Cyclo 3B |
69.62 |
12.65 |
5.10 |
| Vibrio 3A |
81.93 |
10.75 |
7.00 |
| Vibrio 3B |
66.64 |
13.21 |
4.54 |
| Control 4A |
98.36 |
8.95 |
8.80 |
| Control 4B |
70.74 |
12.45 |
5.30 |
| Cyclo 4A |
83.78 |
10.51 |
7.24 |
| Cyclo 4B |
84.47 |
10.42 |
7.33 |
| Vibrio 4A |
63.32 |
13.91 |
3.84 |
| Vibrio 4B |
130.23 |
6.76 |
10.99 |
| Control 5A |
89.85 |
9.80 |
7.95 |
| Control 5B |
138.97 |
6.34 |
11.41 |
| Cyclo 5A |
156.85 |
5.61 |
12.14 |
| Cyclo 5B |
93.93 |
9.37 |
8.38 |
| Vibrio 5A |
131.41 |
6.70 |
11.05 |
| Vibrio 5B |
106.29 |
8.28 |
9.47 |
| Control 6A |
|||
| Control 6B |
99.9 |
8.81 |
8.94 |
| Cyclo 6A |
113.24 |
7.78 |
9.97 |
| Cyclo 6B |
159.57 |
5.52 |
12.23 |
| Vibrio 6A |
84.93 |
10.37 |
7.38 |
| Vibrio 6B |
128.23 |
6.87 |
10.88 |
4/8/14
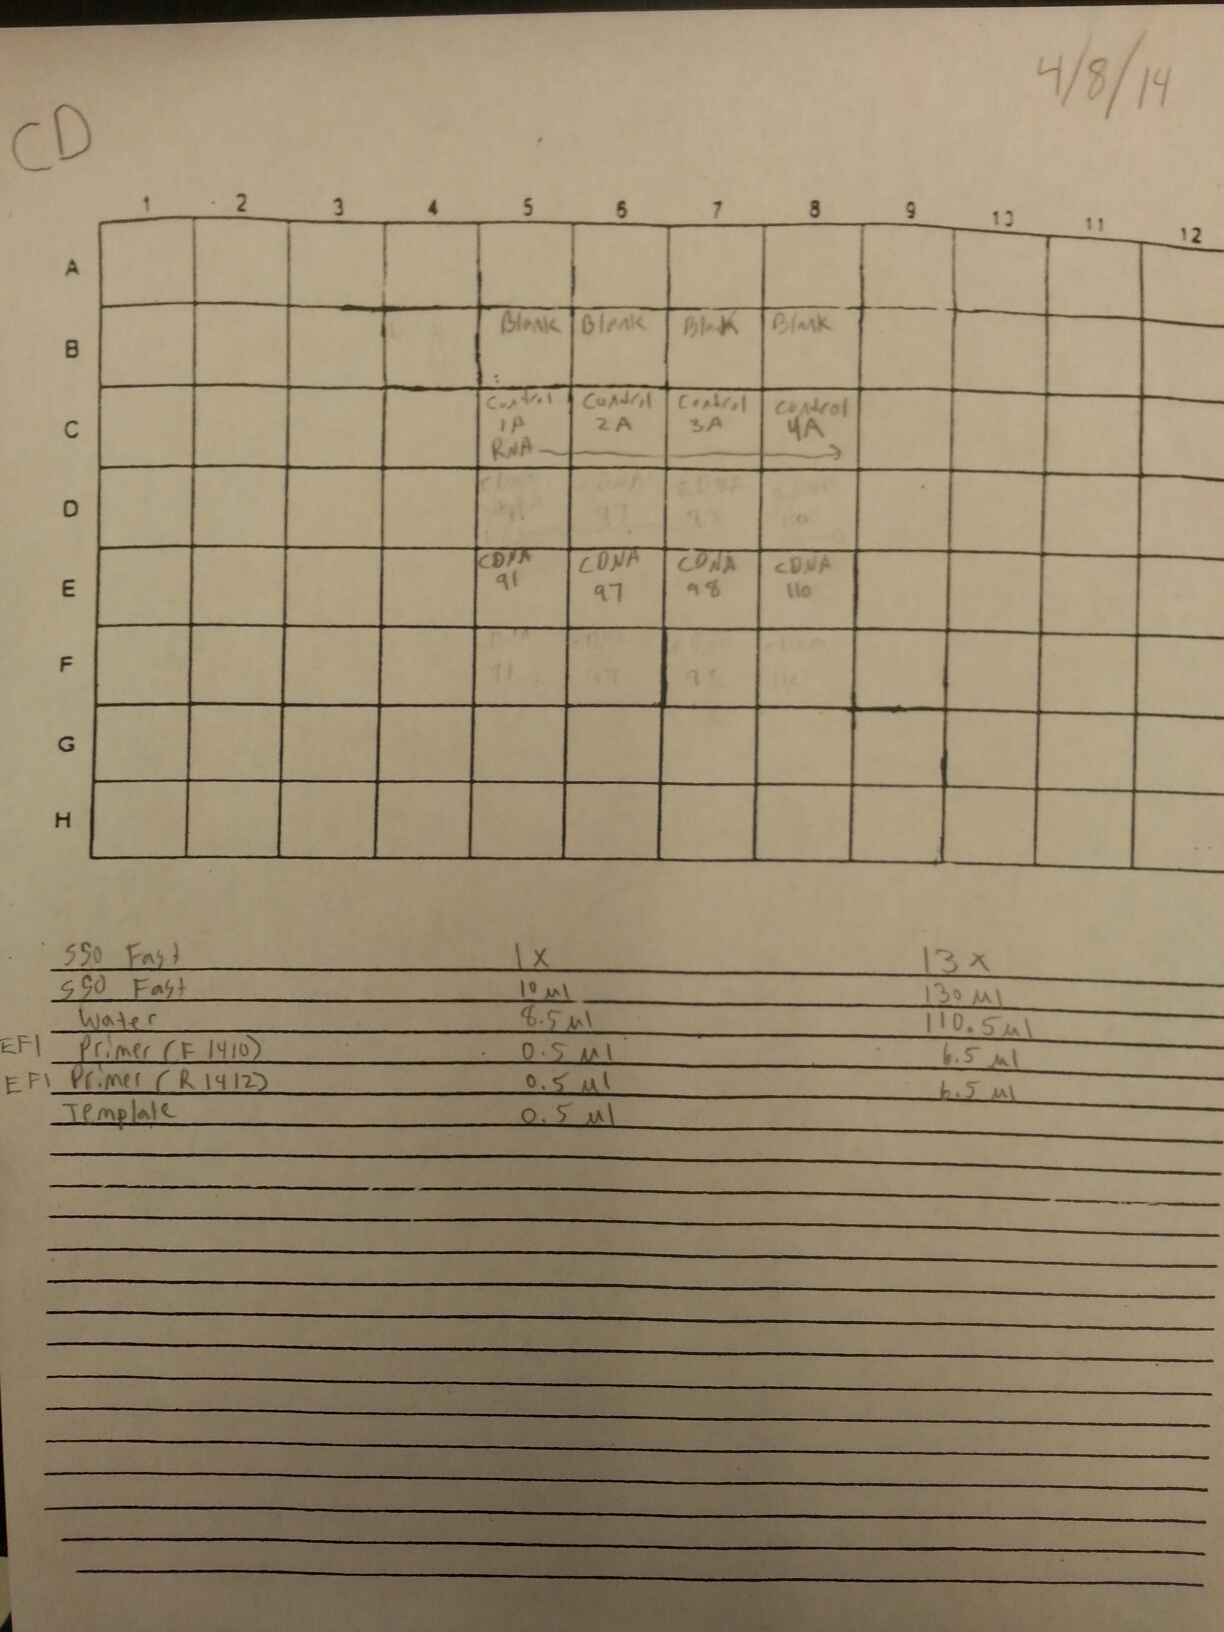
Now that clean negative controls had been successfully attained, the EF1 primers were ran on a qPCR with the DNased RNA from 3/21-3/25. The plate loading order and master mix protocol can be seen here. Positive controls were omitted from this test due to the ongoing problem of contamination. The placement of the plated was also centered within the qPCR machine so that heating of the plate would be more even. The results of the qPCR can be seen below and it appeared that all of the blanks were clean. The RNA samples also appeared to be clean but one did amplified at the ~38th cycle and lacked a melting peak which implies primer dimer.


A second qPCR was done with positive controls and a subsample of RNA from 3/21-3/25 to make sure that the lack of amplification from the previous qPCR done today was due to the fact that they were not contaminated. The plate loading order and master mix protocol can be seen here. The results of the qPCR can be seen below and it appears that none of the blanks or RNA amplified while all of the cDNA did.


4/7/14
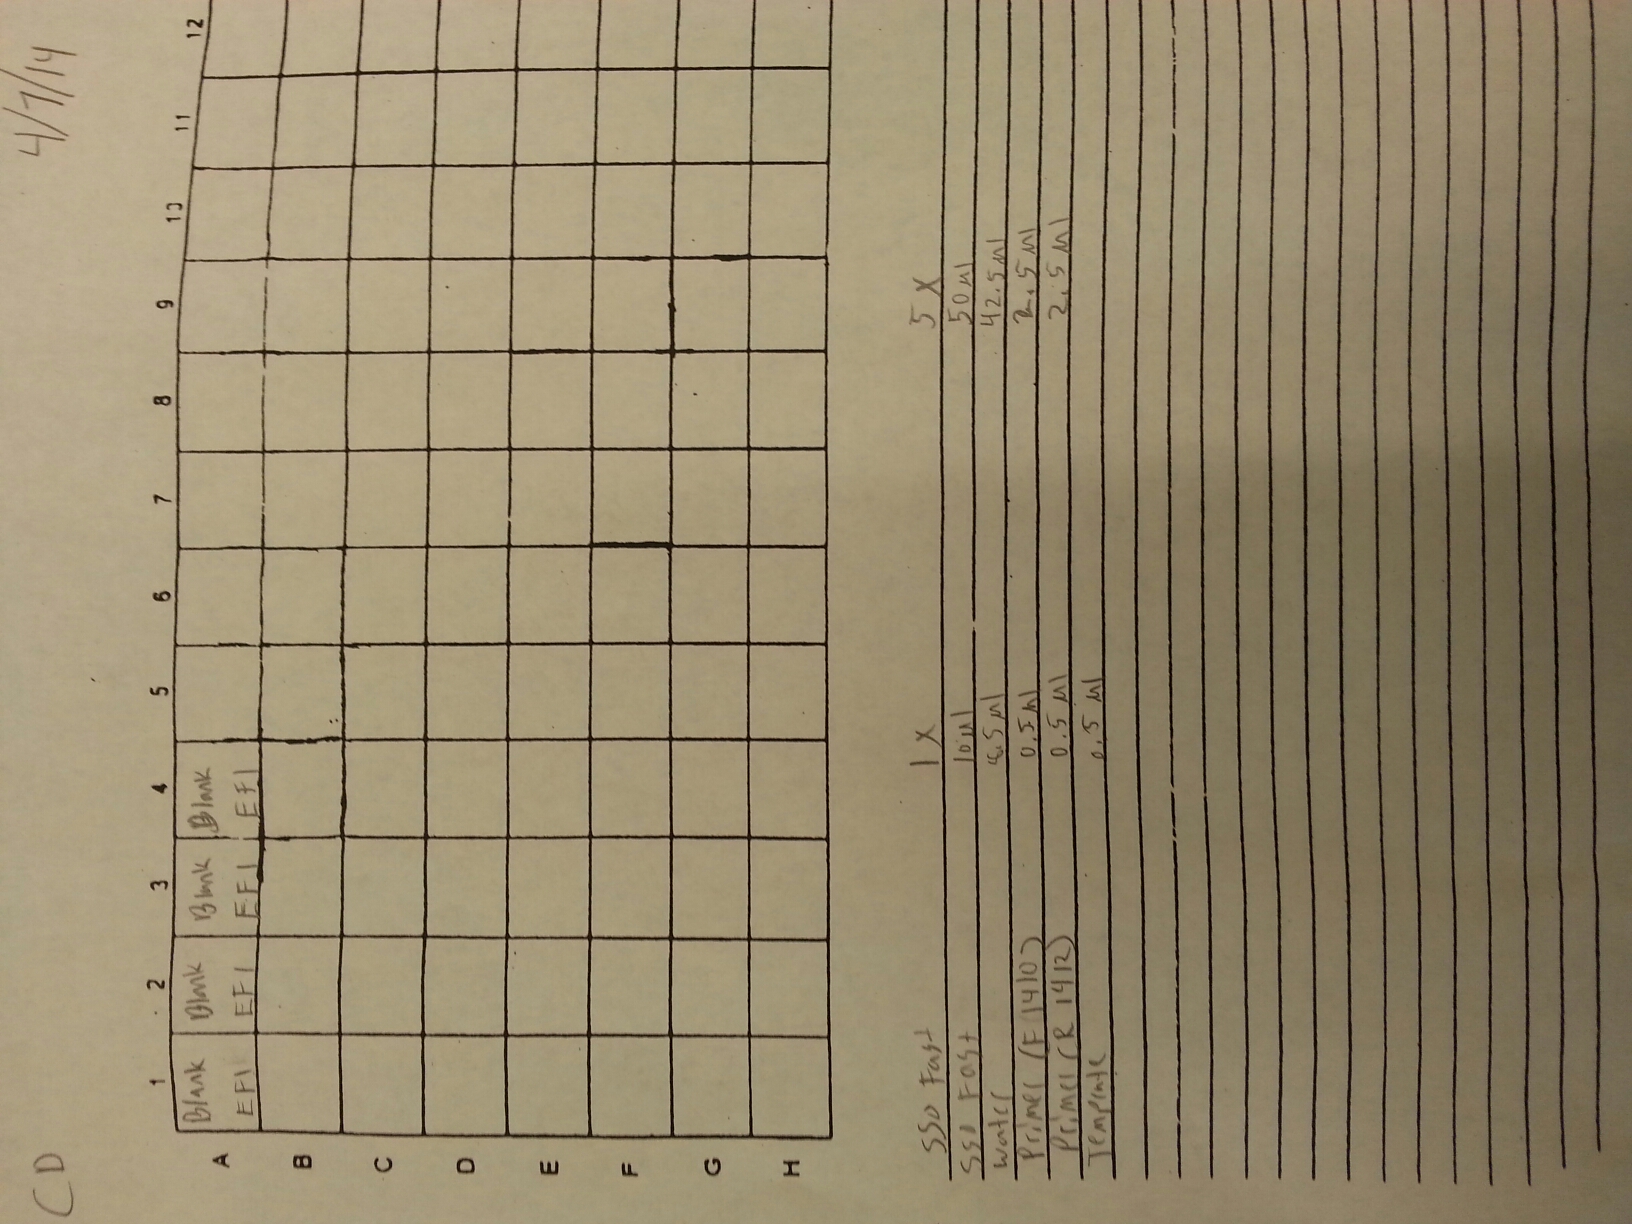
Due to the ongoing problem with contamination, a new normalizing gene (EF1) is going to be tested. Working stocks of EF1 F (1413) and EF1 R (1412) were made by mixing 90 ul of water with 10 ul of primer. The new primers were then tested by running a plate of four blank controls containing only water. The loading order and master mix can be seen here. The results can be seen below and it appears all the blanks were clean. One blank replicated at the ~38th cycle but it appears to be primer dimer as the melt peak is much earlier than the observed gDNA peaks.


4/4/14
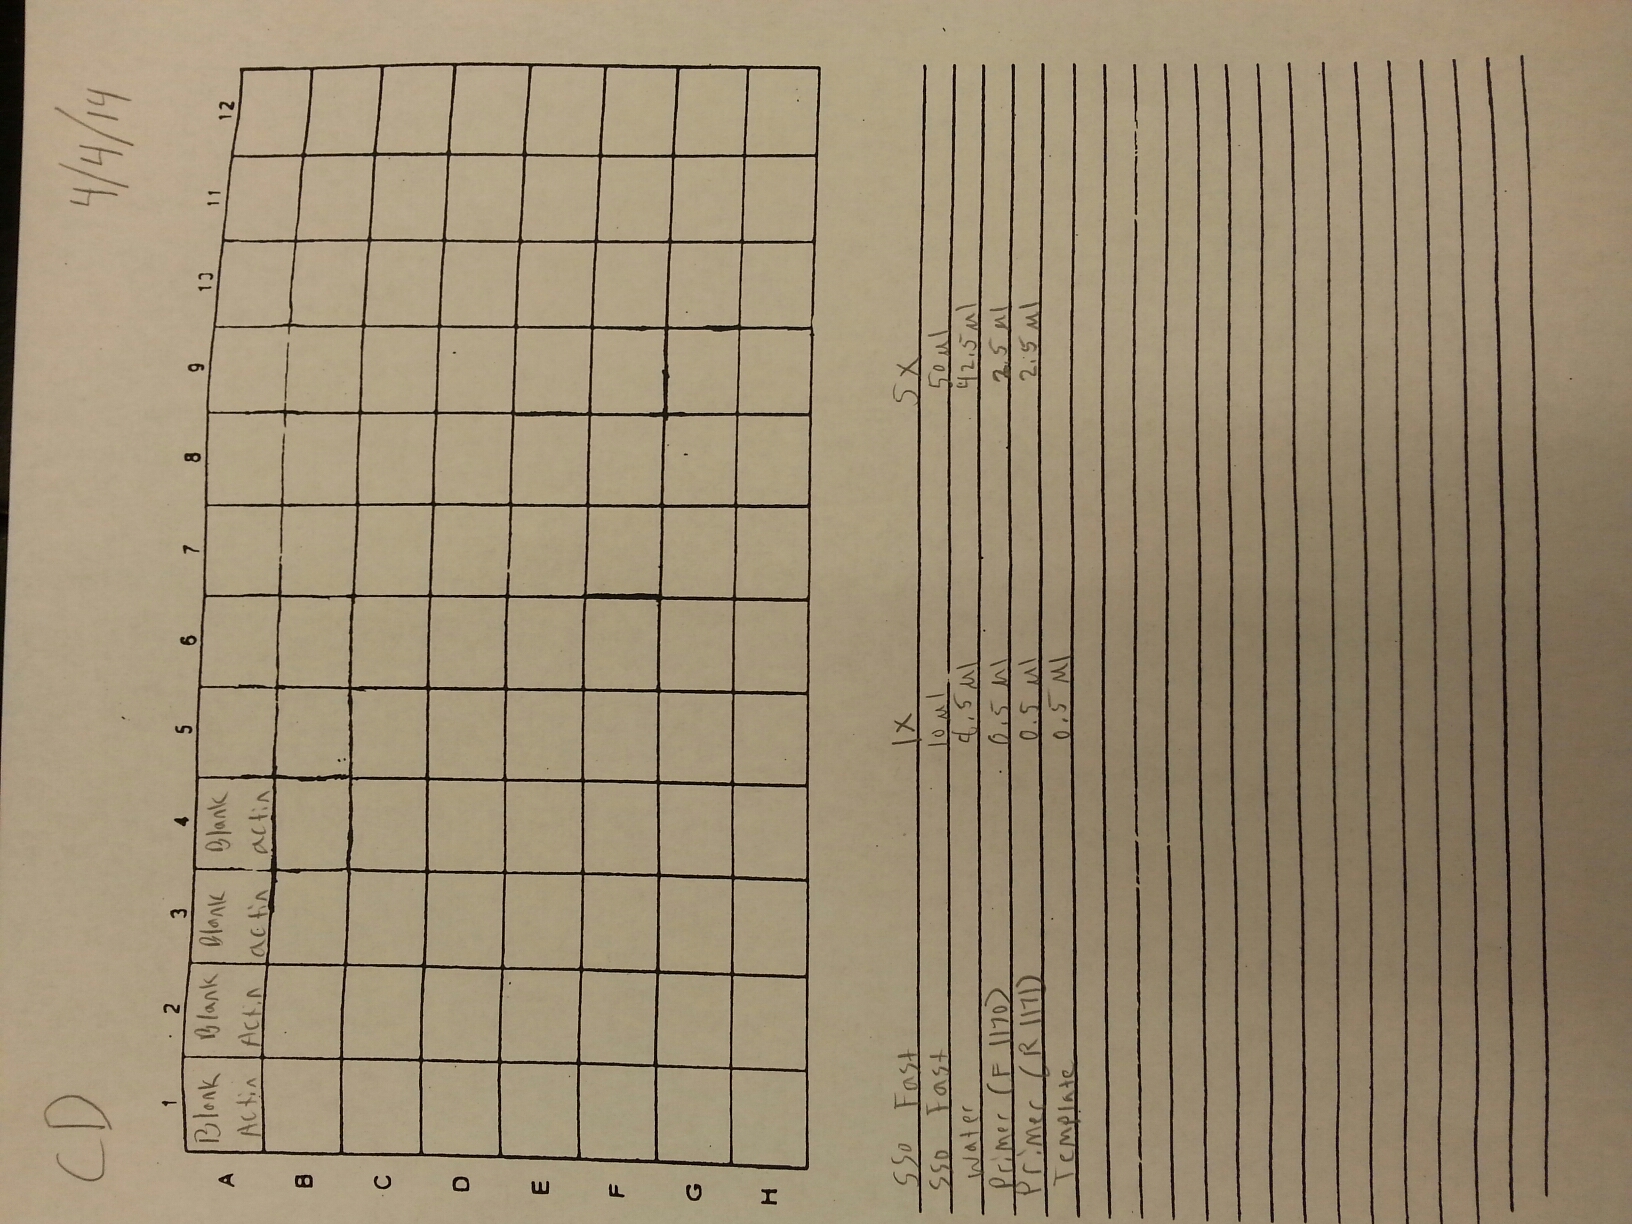
Due to the fact that the blanks from 4/3 were contaminated, a qPCR of four blanks containing only water was done. Prior to doing the qPCR, the work bench and qPCR tools were wiped down with bleach, ethanol, and nuclease free water. The plate loading order and master mix protocol can be seen here.


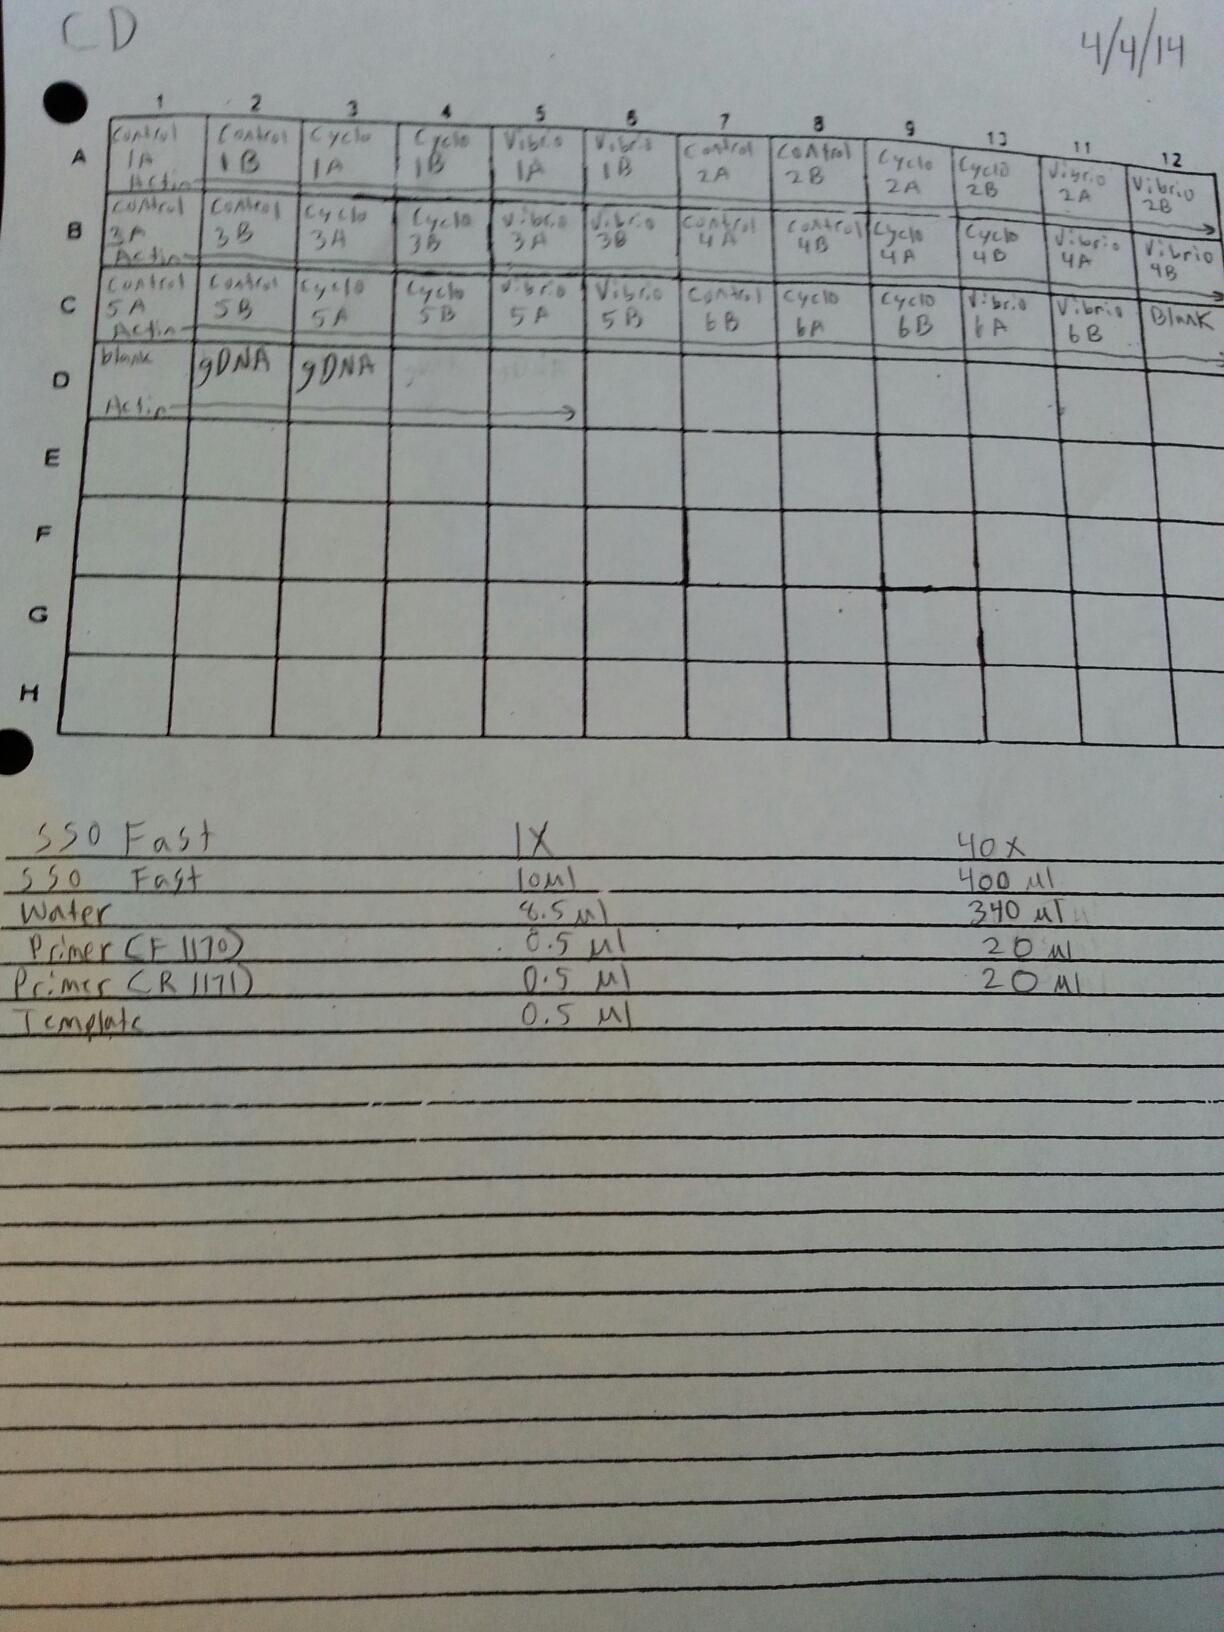
Once it was determined that clean blanks could be produced, the qPCR from 4/3 was redone. The plate loading order and master mix protocol can be seen here. The results of the qPCR can be seen below and it also appears that one of the two blanks amplified something at cycle 38.


4/3/14
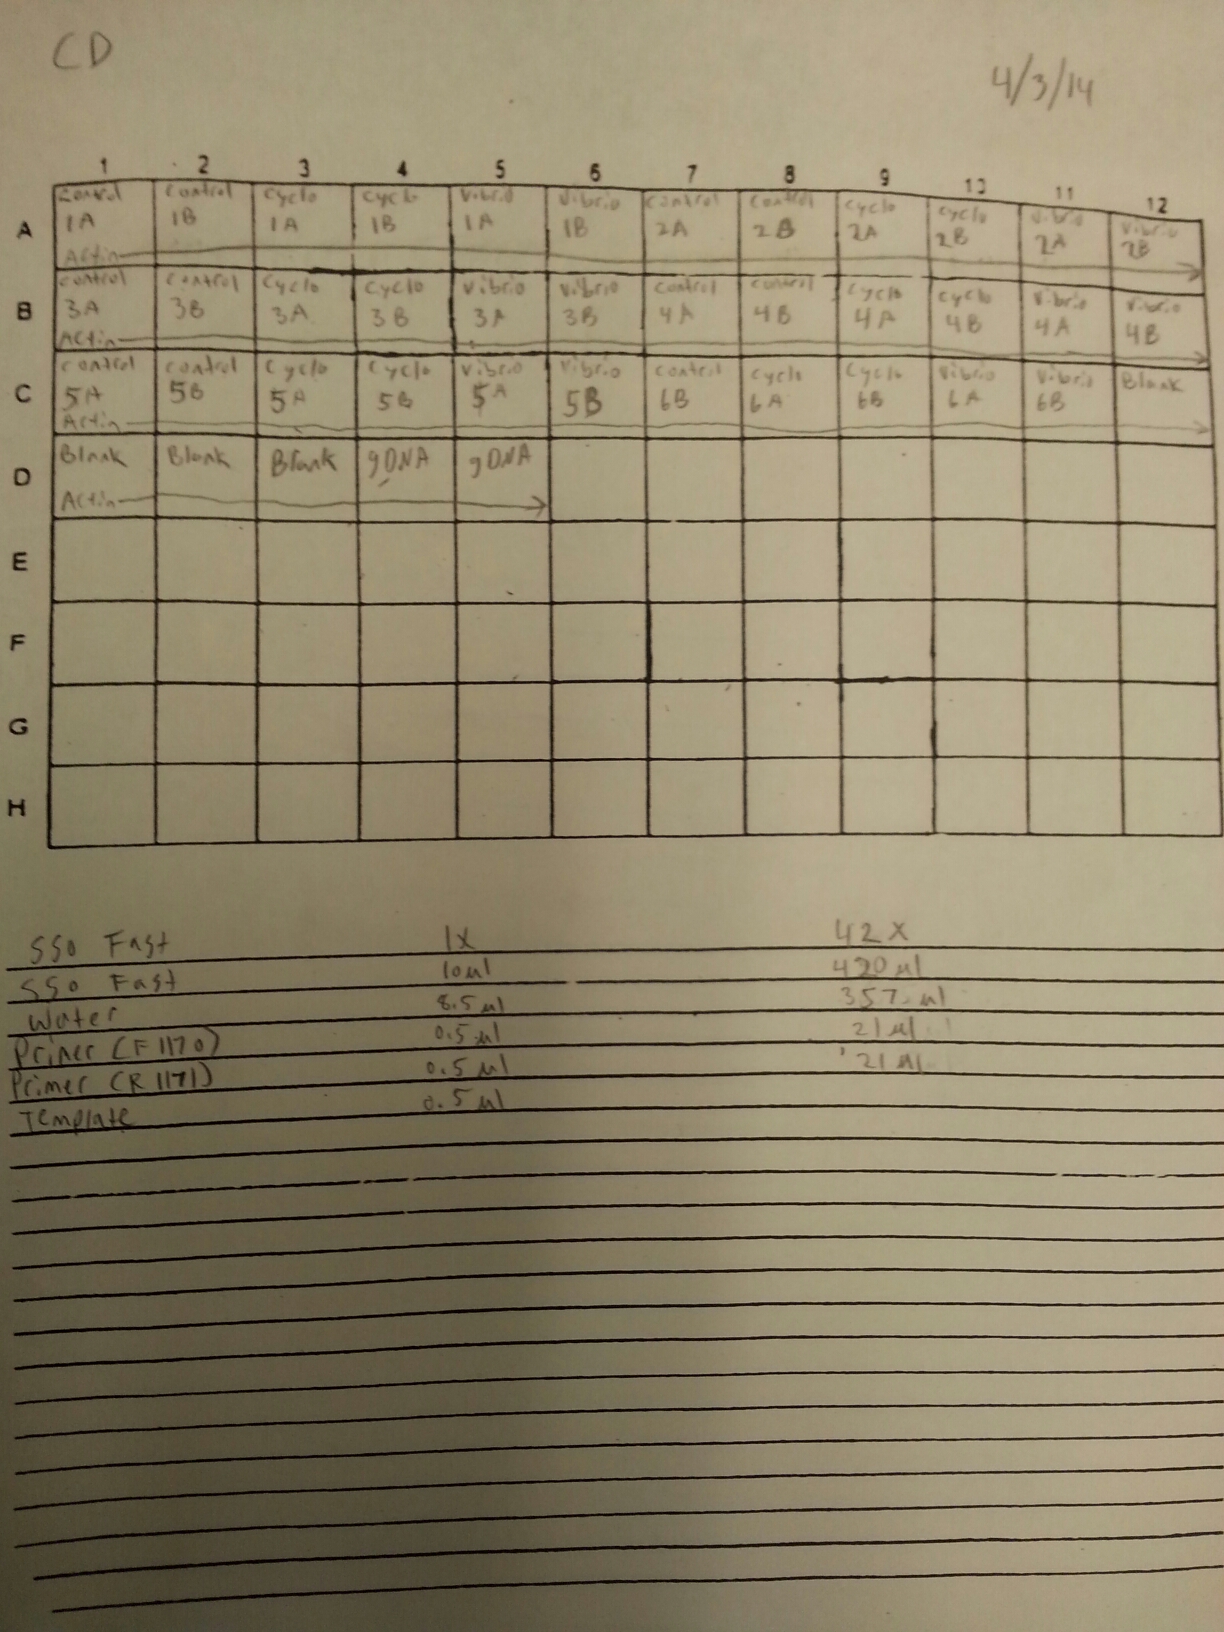
The DNased RNA samples from 3/21-3/25 were ran on a qPCR to check for gDNA contamination. The plate loading order and master mix protocol can be seen here. The results of the qPCR can be seen below and it appeared that two of the four blanks were contaminated.


4/2/14
Working stocks of primers from genes of interest were made today by mixing 10 uL of primer with 90 uL of water. Primers and SR ID's can be seen below.
1571: HAT F
1570: HAT R
1569: HATHaP2 F
1568: HATHaP2 R
1567: MeCP2 F
1566: MeCP2 R
1565: MBD2 F
1564: MBD2 R
1563: IL-17 F
1562: IL-17 R
1511: DNMT F
1510: DNMT R
372: TNFRAF F
371: TNFRAF R
368: TIMP F
367: TIMP R
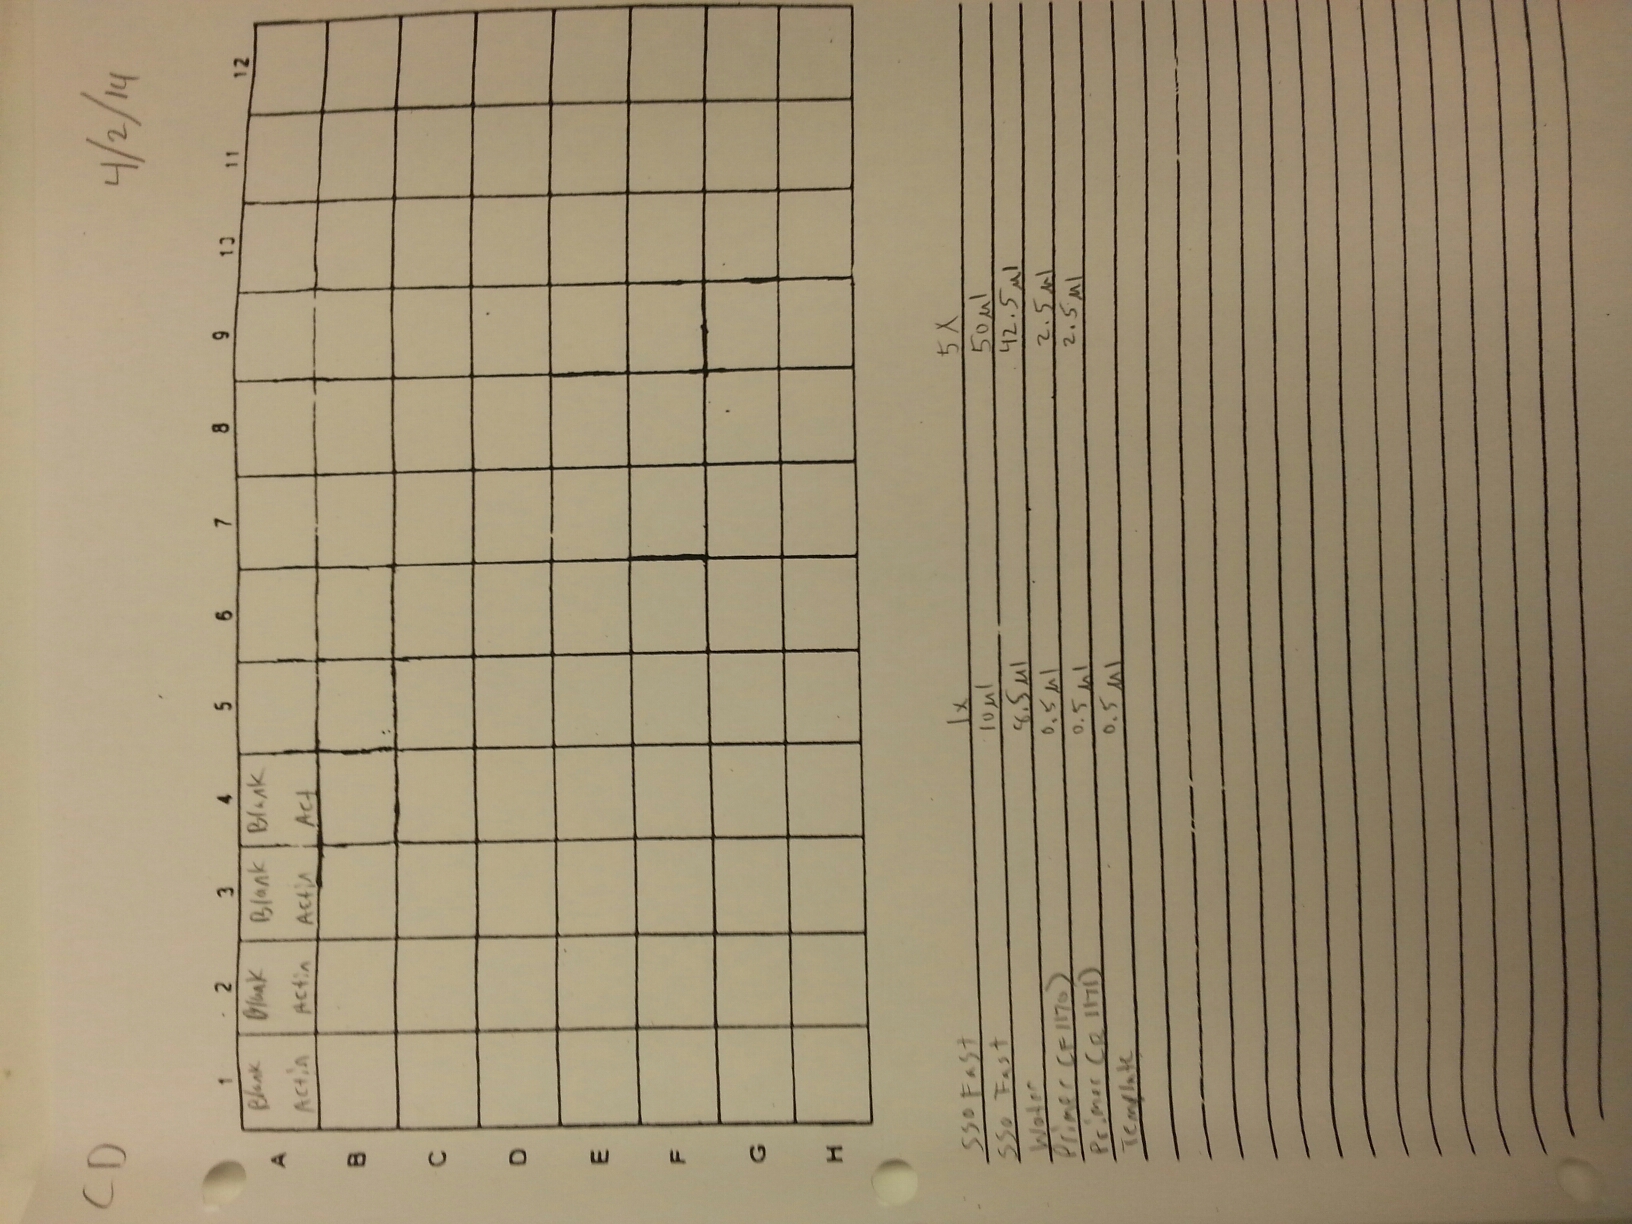
A qPCR of four blanks was also done using new water, primers, and sso fast to make sure that clean negative controls could be produces since the qPCR's from 3/21 to 3/25 have been partially contaminated. The plate loading order and master mix protocol can be seen here while the results of the qPCR can be seen below.


3/25/14
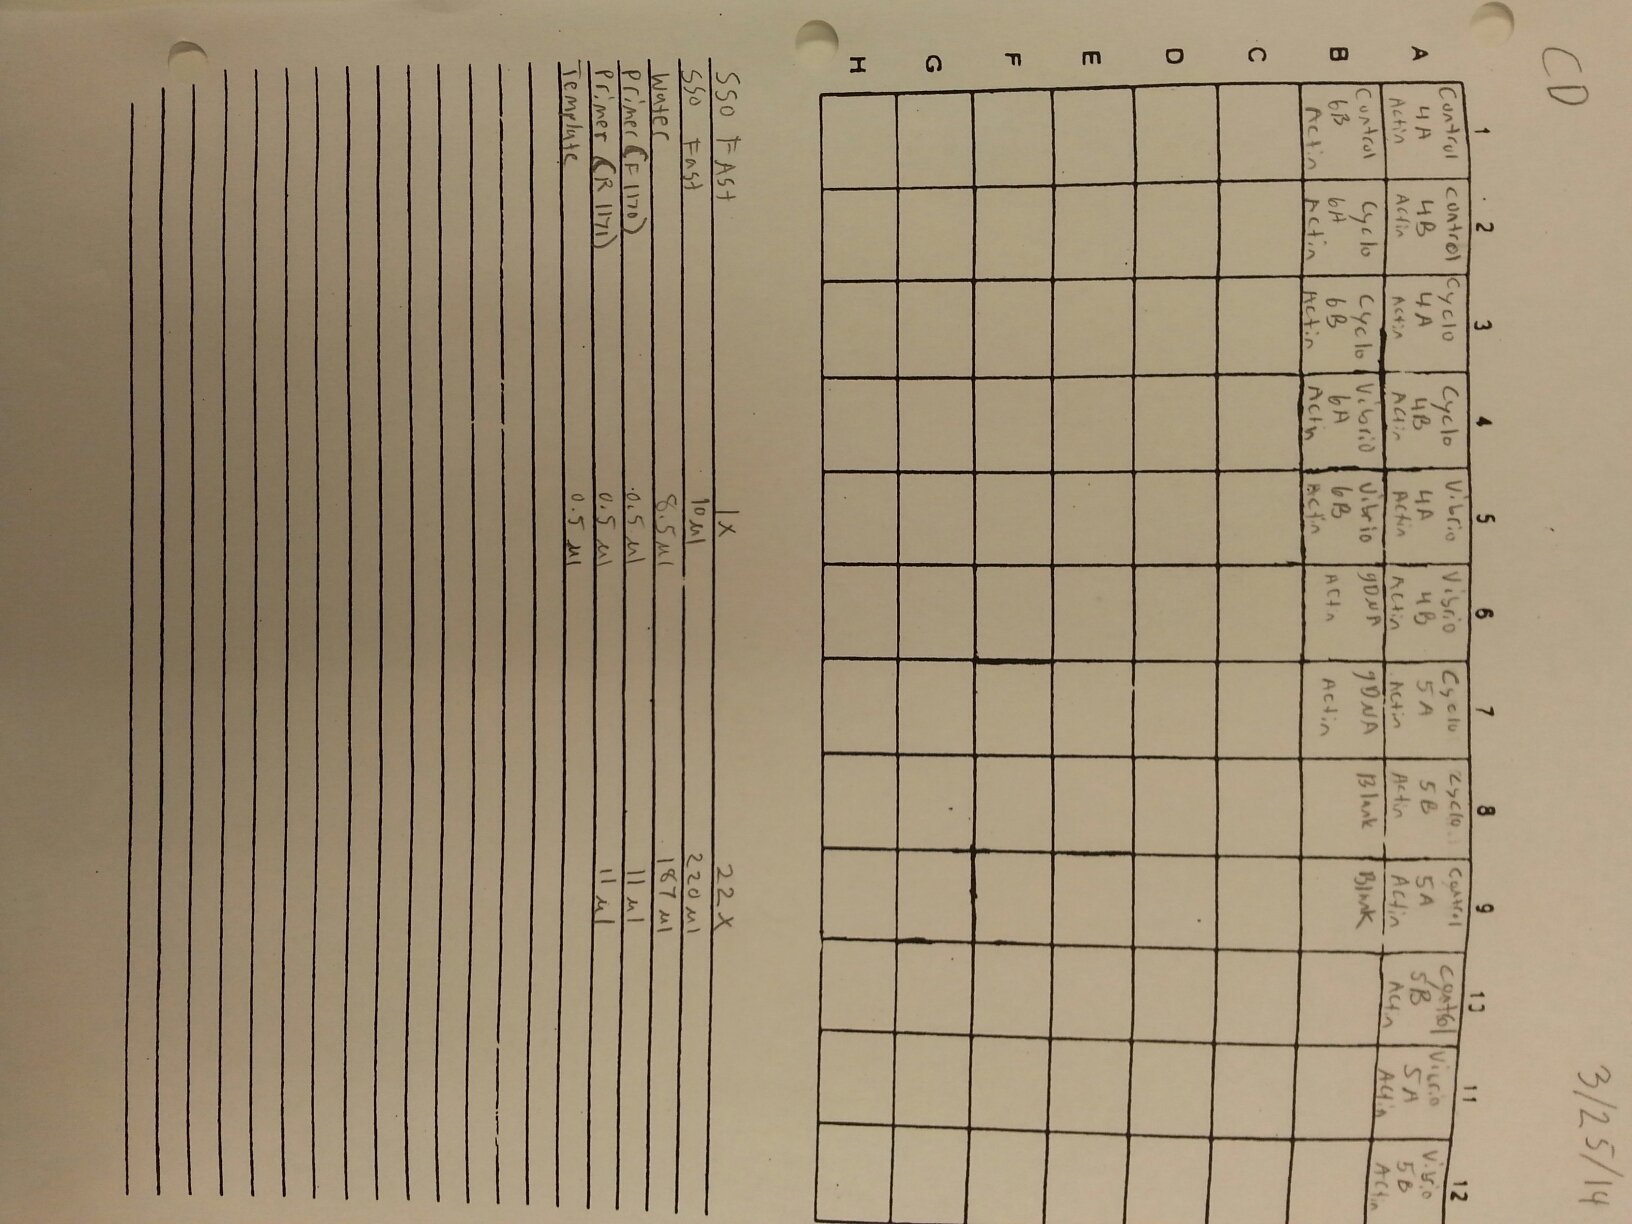
The samples from Control (4A, 4B, 5A, 5B, 6A, and 6B), Cyclo (4A, 4B, 5A, 5B, 6A, and 6B), and Vibrio (4A, 4B, 5A, 5B, 6A, and 6B) groups were DNAsed today following the "rigorous" protocol and using 5 ug of RNA per 50 uL. After they were DNAsed, they were nanodropped and then ran on a qPCR to check for contamination. The plate loading order and master mix protocol can be found here.


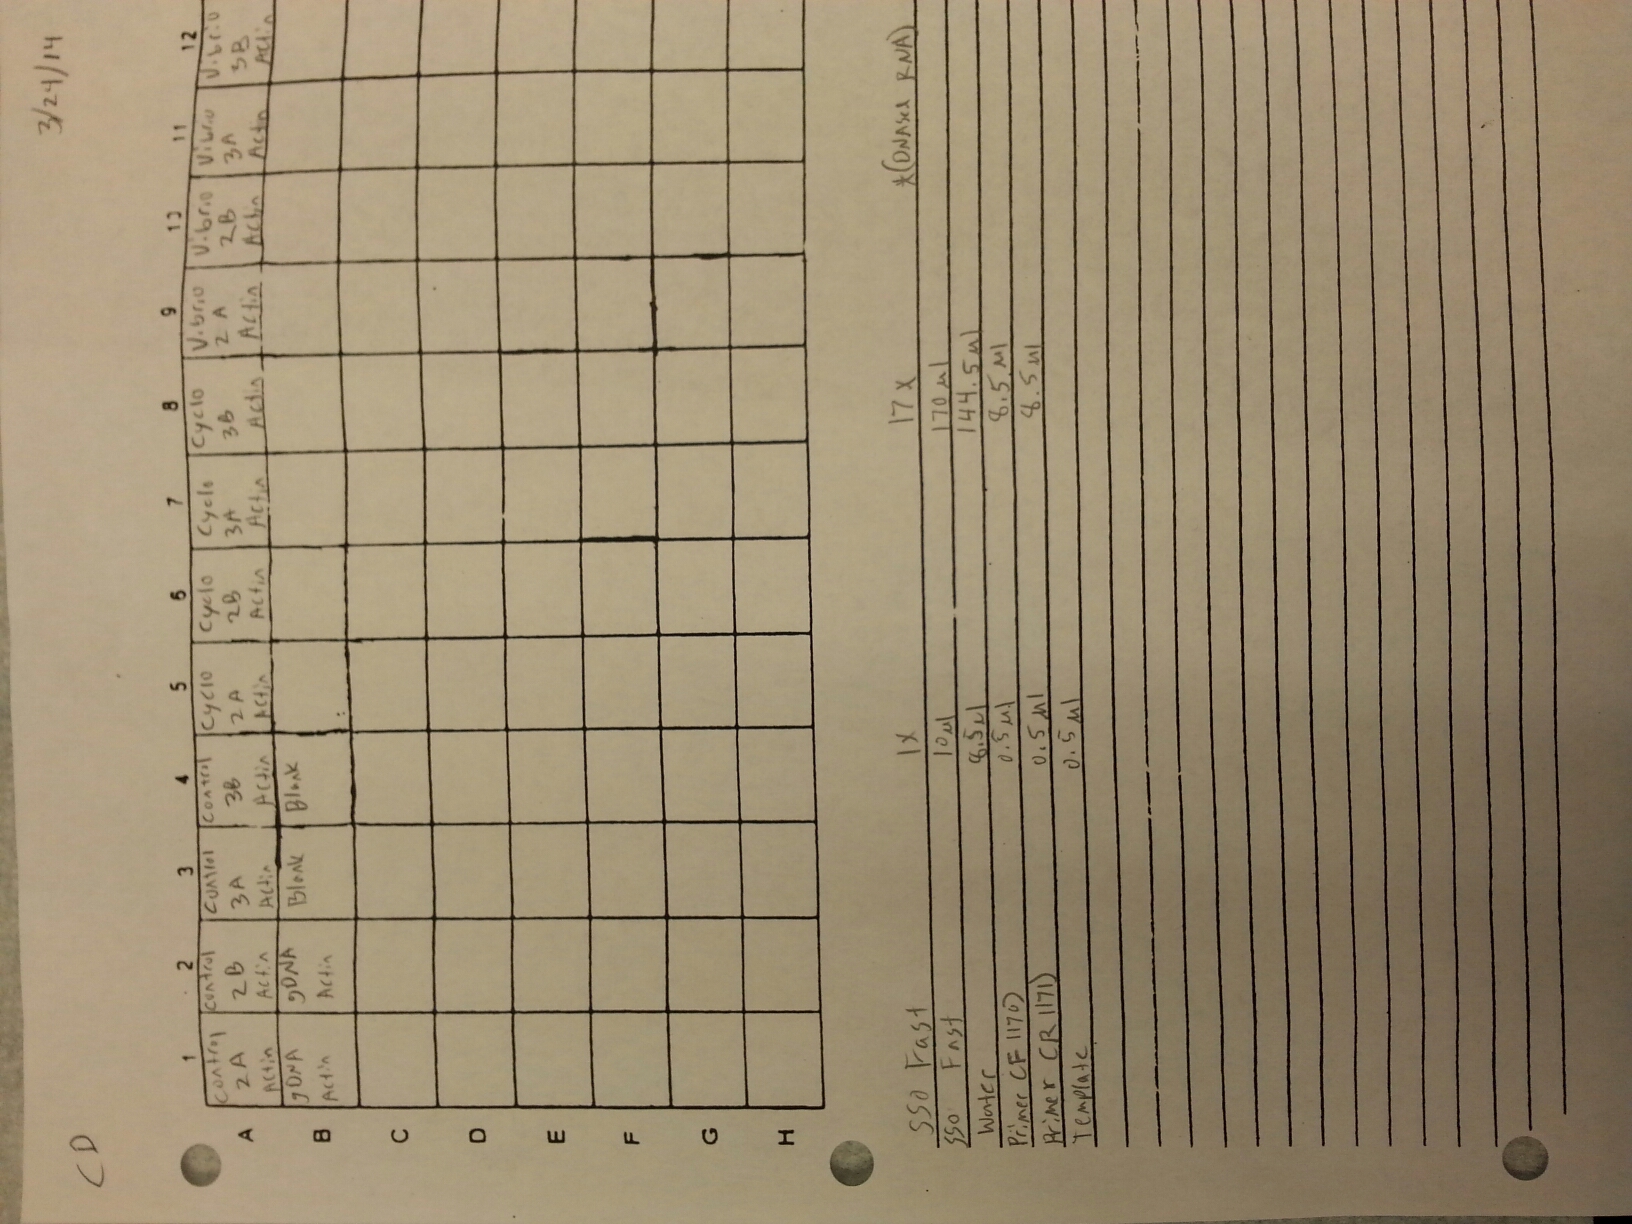
3/24/14
The samples from Control (2A, 2B, 3A, and 3B), Cyclo (2A, 2B, 3A, and 3B), and Vibrio (2A, 2B, 3A, and 3B) groups were DNAsed today following the "rigorous" protocol and using 5 ug of RNA per 50 uL. After they were DNAsed, they were nanodropped and then ran on a qPCR to check for contamination. The plate loading order and master mix protocol can be found here.


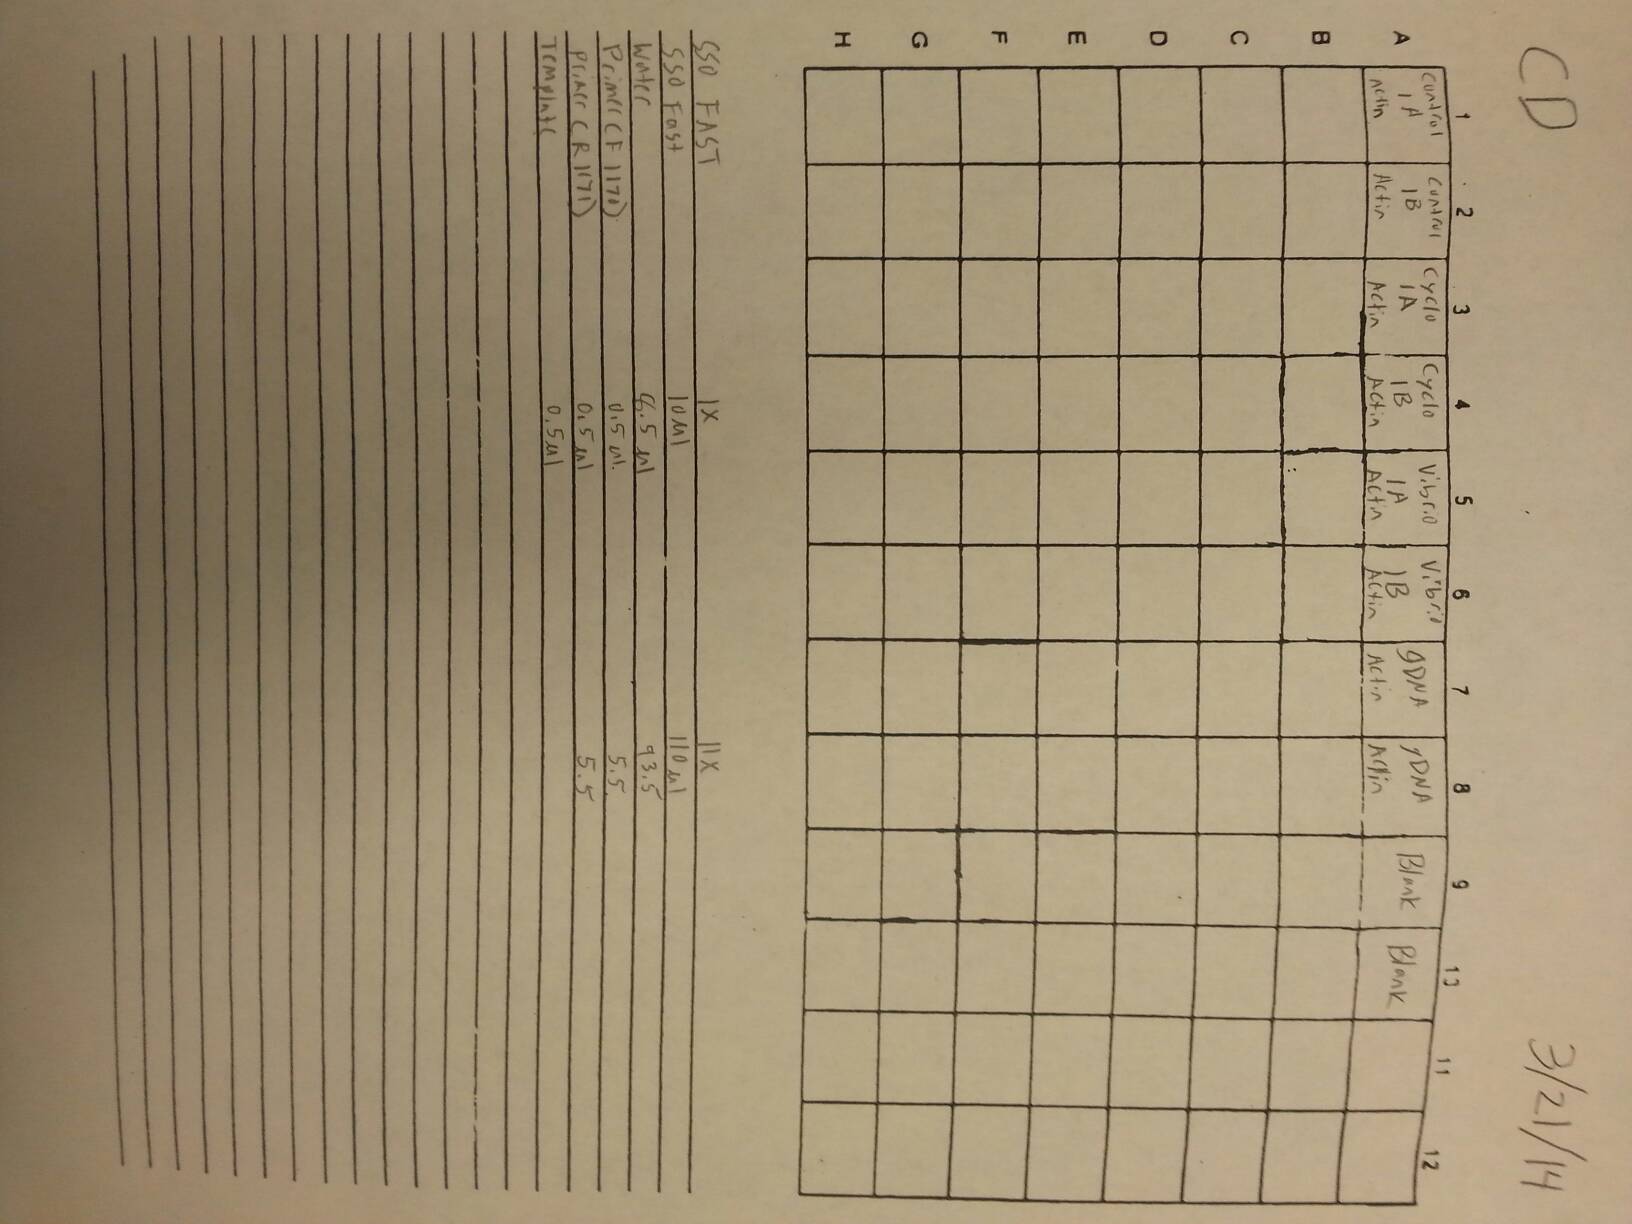
3/21/14
Due to the fact that the RNA from the subsamples ran on qPCR on 3/20/14 were contaminated with DNA, all samples from the capstone experiment needed to be DNAsed. The samples that were DNAsed today were
Control (1A, 1B), Cyclo (1A, 1B), and Vibrio (1A, 1B) following the "rigorous" protocol and using 5 ug of RNA per 50 uL. Once samples had been DNAsed, they were nanodropped and ran on a qPCR to see if they were still contaminated. The plate loading order and master mix protocol can be found here.


3/20/14
A subsample of Control (1A, 2A), Cyclo (1A, 2A), and Vibrio (1A, 2A) RNA samples that were nano dropped on 3/3/14 were used to make cDNA following the Reverse Transcription (Promega M-MLV Protocol) found here. Once cDNA was made, the cDNA samples were ran on a qPCR along with the original RNA to determine that cDNA could be made and if the RNA needed to be DNAsed. The plate loading order and master mix protocol can be seen here. The results of the qPCR can be seen below and since replication occurred with the RNA samples it will have to be DNAsed.


3/14/14
RNA samples that were isolated on 3/5 and 3/6 were nanodropped. The results of the nanodrop can be seen below.


3/6/14
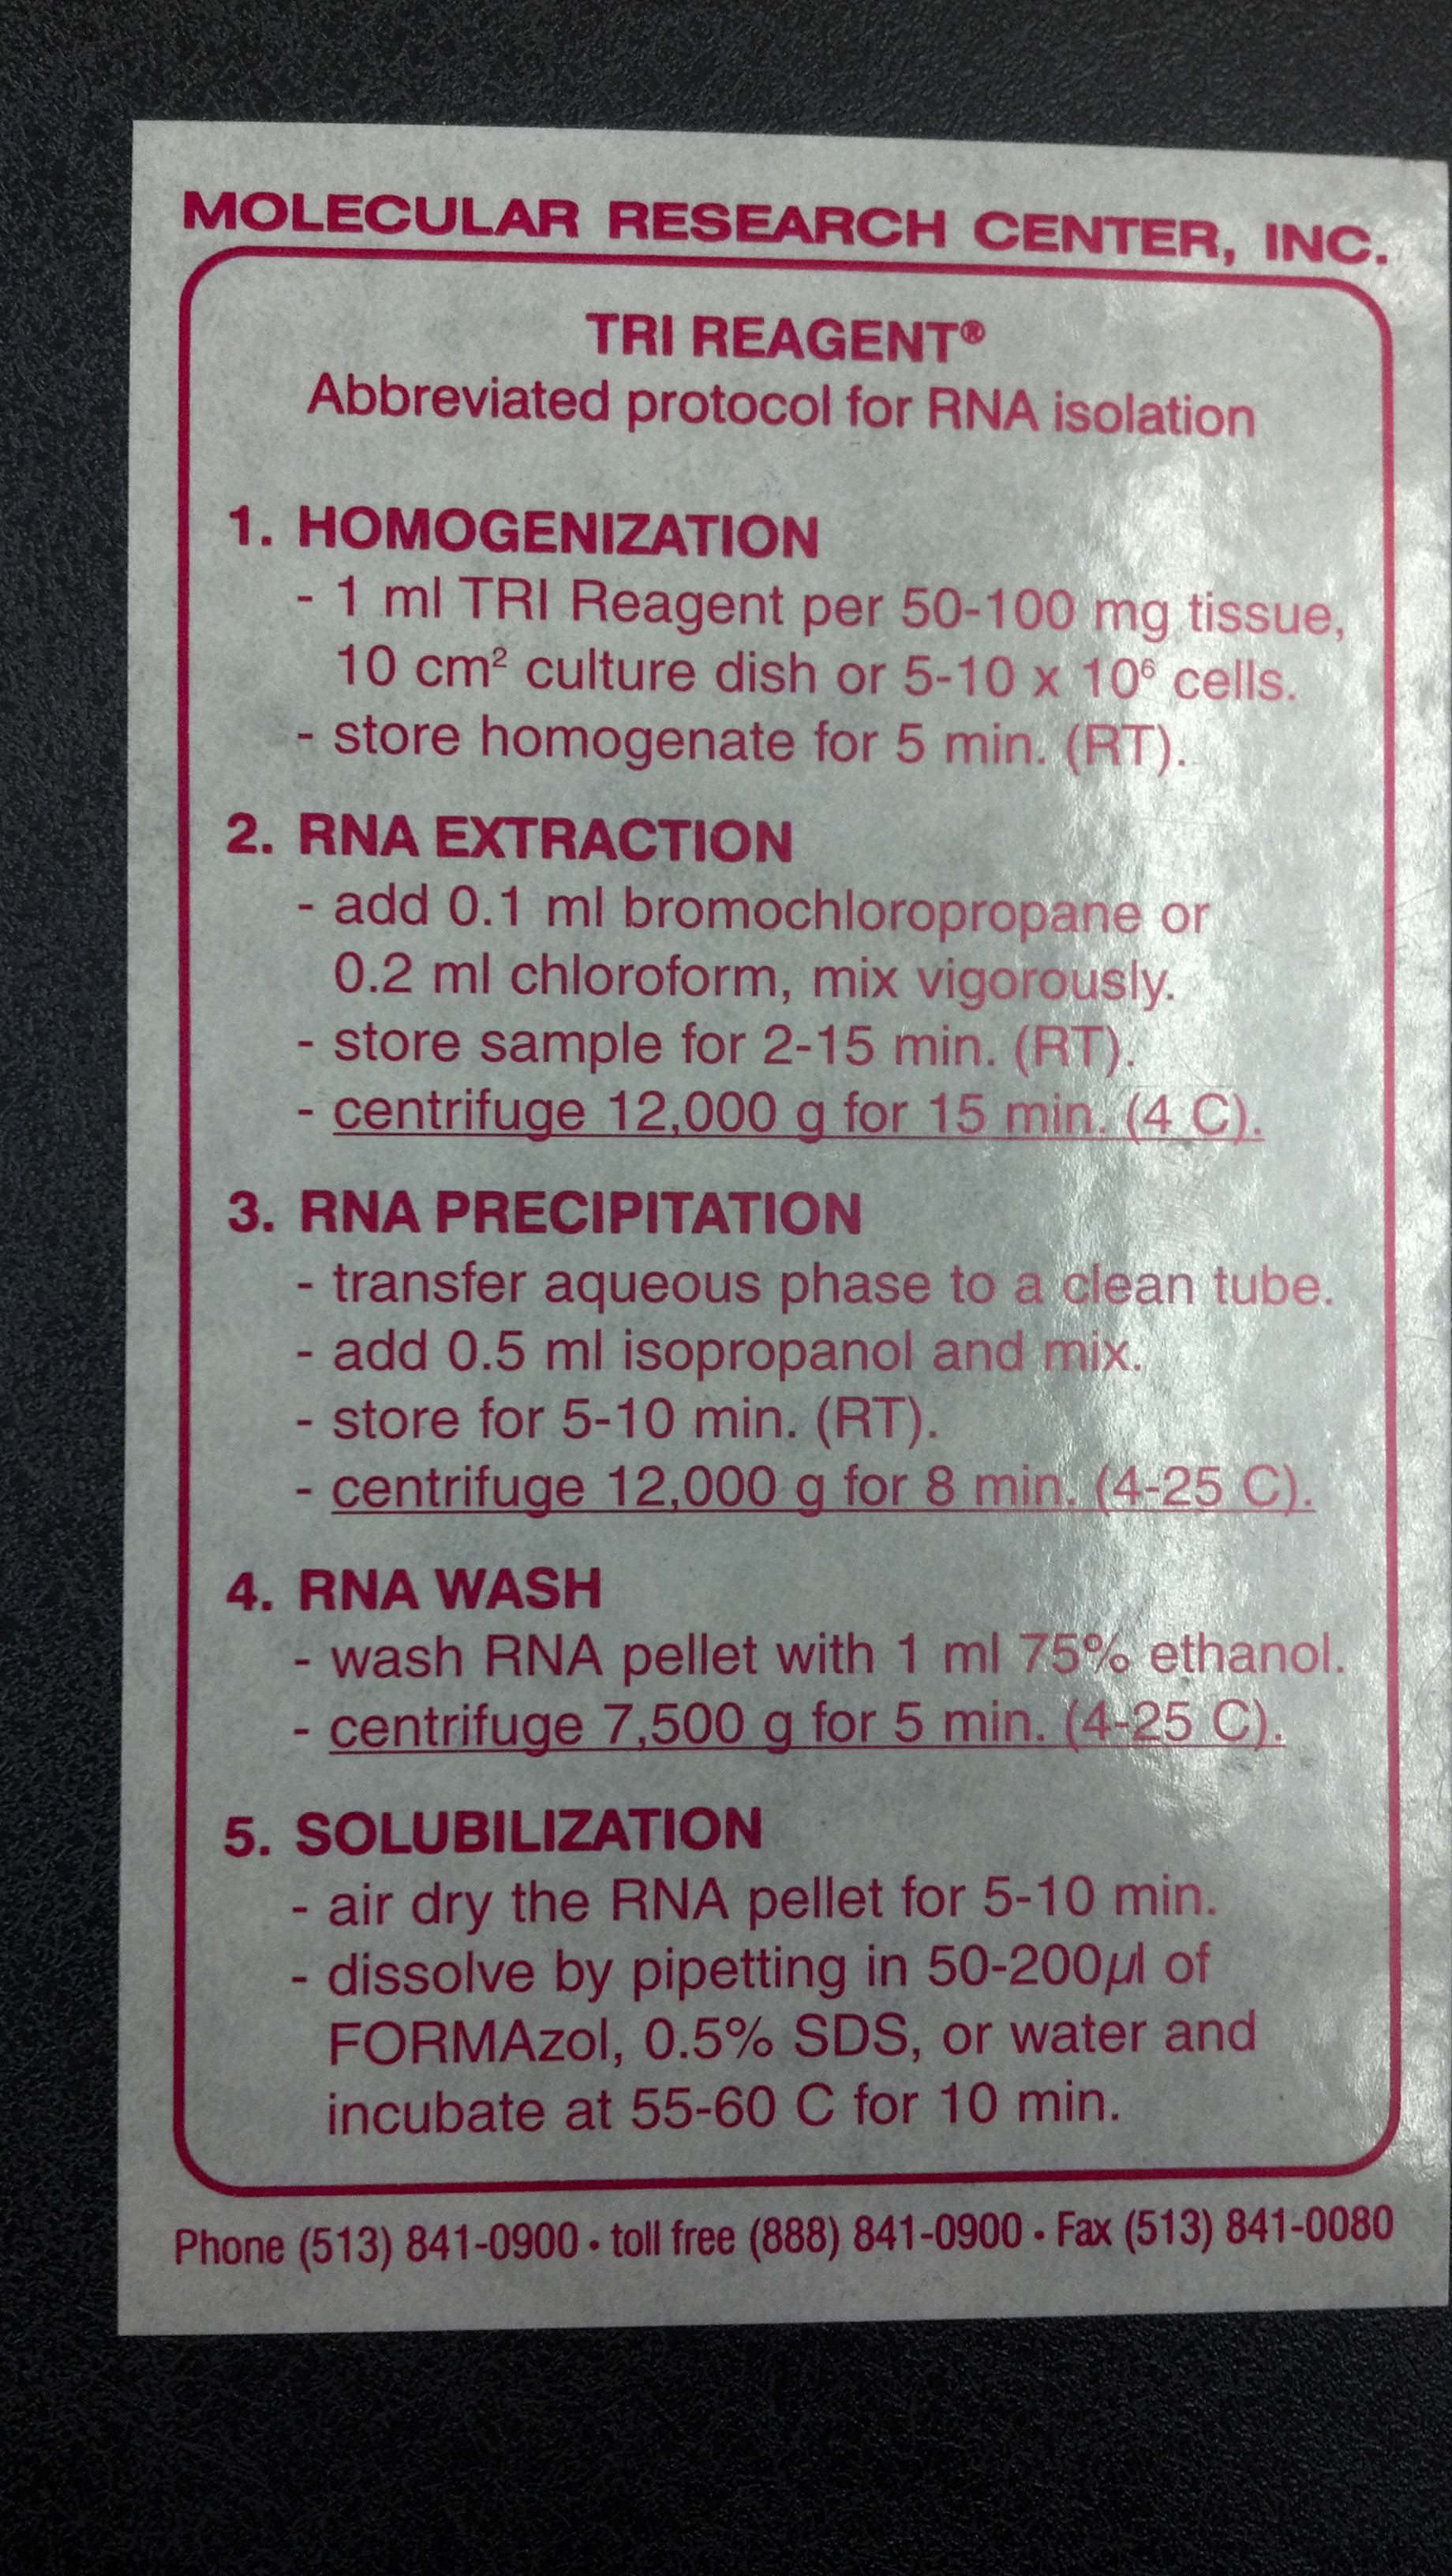
RNA was isolated from samples taken on 2/14 from Control 6B, Cyclo 6A and 6B, and Vibrio 6A and 6B. The RNA was isolated using the protocol from 8/31/13.
3/5/14
RNA was isolated from samples taken on 2/14 from Control 5A and 5B, Cyclo 5A and 5B, and Vibrio 5A and 5B. The RNA was isolated using the protocol from 8/31/13.
3/3/14
RNA samples that were isolated on 2/28, 2/24, and 2/20 were nanodropped. The results can be seen below.


2/28/14
RNA was isolated from samples taken on 2/14 from Control (3A, 4A, 3B, 4B), Cyclo (3A, 4A, 3B, 4B) and Vibrio (3A, 4A, 3B, 4B). The RNA was isolated using the protocol from 8/31/13.
2/24/14
RNA was isolated from samples taken on 2/14 from Control 2A and 2B, Cyclo 2A and 2B, and Vibrio 2A and 2B. The RNA was isolated using the protocol from 8/31/13.
2/20/14
RNA was isolated from samples taken on 2/14 from Control 1A and 1B, Cyclo 1A and 1B, and Vibrio 1A and 1B. The RNA was isolated using the protocol from 8/31/13.
2/16/14
The papers that were used to select genes of interest and there corresponding primer sequence can be found below. The genes that were selected from the papers were IL-17 from Roberts 2008, MBD2 and MeCP2 from Riviere 2013, HAT from Dheilly 2012, and HATHaP2 from David 2005.
David, E., A. Tanguy, K. Pichavant, and D. Moraga. 2005. Response of the Pacific oyster Crassostrea gigas to hypoxia exposure under experimental conditions. FEBS Journal 272:5635-5652.
Dheilly, N. M., C. Lelong, A. Huvet, K. Kellner, M.-P. Dubos, G. Riviere, P. Boudry, and P. Favrel. 2012. Gametogenesis in the Pacific oyster Crassostrea gigas: a microarrays-based analysis identifies sex and stage specific genes. PLoS ONE 7:e36353.
Riviere, G., G.-C. Wu, A. Fellous, D. Goux, P. Sourdaine, and P. Favrel. 2013. DNA methylation is crucial for the early development in the oyster C. gigas. Marine Biotechnology 15:739-753.
Roberts, S., Y. Gueguen, J. De Lorgeril, and F. Goetz. 2008. Rapid accumulation of an interleukin 17 homolog transcript in (Crassostrea gigas) hemocytes following bacterial exposure. Developmental and Comparative Immunology 32:1099-1104.
2/14/14
The 35 oysters that were used in the experiment from 2/13/14 were sampled today. The sampling was done by processing treatment group A followed by treatment group B. The oysters in each treatment group were labeled as 1-6 for identification purposes. Samples of gill and mantle tissue were taken for each specimen, placed on dry ice, and put into the -80 C freezer
2/13/14
The 35 oysters were randomly assigned to treatment and control groups. The groupings that were used were control (A & B), B-cyclodextrin (A & B), and V. tubiashii (A & B). There were 6 oysters in each A and B group except for control A which only had five since one of the oysters had died. The experiment started at 9:30 A.M. when the B-cylcodextrin and V. tubiashii oysters were exposed. 1.2 g of B-cylcodextrin was dissolved in 200 ml of water and then added to each tank for a concentration of 0.3 g/L. The bacteria pellets that were in the plastic jars were dissolved in 40 ml of water, re-suspended using a vortex, and then 12 ml of the mixture was added to each tank.
2/10/14
36 Pacific oysters were acquired from Taylor Shellfish in Olympia. They were placed in a garbage can containing the seawater to be used for the experiment and allowed to acclimate for 3 days. Over the course of the 3 day acclimation period, 1 oyster died.
2/5/14
The bacteria that was incubated in the larger flasks yesterday successfully grew so they were transferred to two 500 ml plastic jars and then centrifuged at 4300 RPMs for 30 minutes. The supernatant was discarded and the remaining bacteria pellets were stored at -20 C.
Dry Flask weight:
A: 68.520 g
B: 68.659 g
Flask w/ Bacteria:
A: 69.538 g
B: 69.667 g
2/4/14
The V. tubiashii in the 50 ml conicals from yesterday grew successfully so they three containing bacteria were transferred to larger flasks and incubated following the procedure from 1/29/14.
2/3/14
New 50 ml conicals were inoculated following the procedure from 1/28/14.
1/31/14
The 50 ml cultures from yesterday failed to grow so new cultures will have to be made next week.
1/30/14
The V. tubiashii that was transferred to the larger flasks failed to grow so new 50 ml conicals were inoculated following the procedure from 1/28/14.
1/29/14
The three conicals containing V. tubiashii were cloudy indicating bacteria growth while the control was clean. The three conicals containing bacteria were then evenly divided between two flasks containing 500 ml of LB each. The two 500 ml flasks were then incubated and shaken for twenty-four hours.
1/28/14
Three individual bacteria colonies were transferred from one of the cultured plates into three separate 50 ml conicals containing 10 ml of LB. A fourth conical was used as a control by touching a loop to an unexposed part of the agar plate. The four conicals were then incubated in a shaking machine overnight
1/27/14
Two small agar plates were cultured with Vibrio tubiashii and incubated at 37 C for twenty-four hours.
1/23/14
Five small agar bacteria plates were made by adding 20 ml of 5x lb and 80 ml of water, 1 g of 1% NaCl, 1.5 g of agar per 100 ml.
1/15/14
A qPCR using the primers from last week in addition to DNMT was ran on a qPCR. The plate loading order and the master mix protocol can be seen here. The results from the qPCR can be seen below and both of the DNMT blanks appeared to be contaminated.


1/8/14
Working stocks were made using 90 ul of water and 10 ul of primer for VTG (1428, 1429) and ER (1424, 1425). Tomorrow, qPCR's will be done using the cDNA samples from 11/27/13.
11/27/13
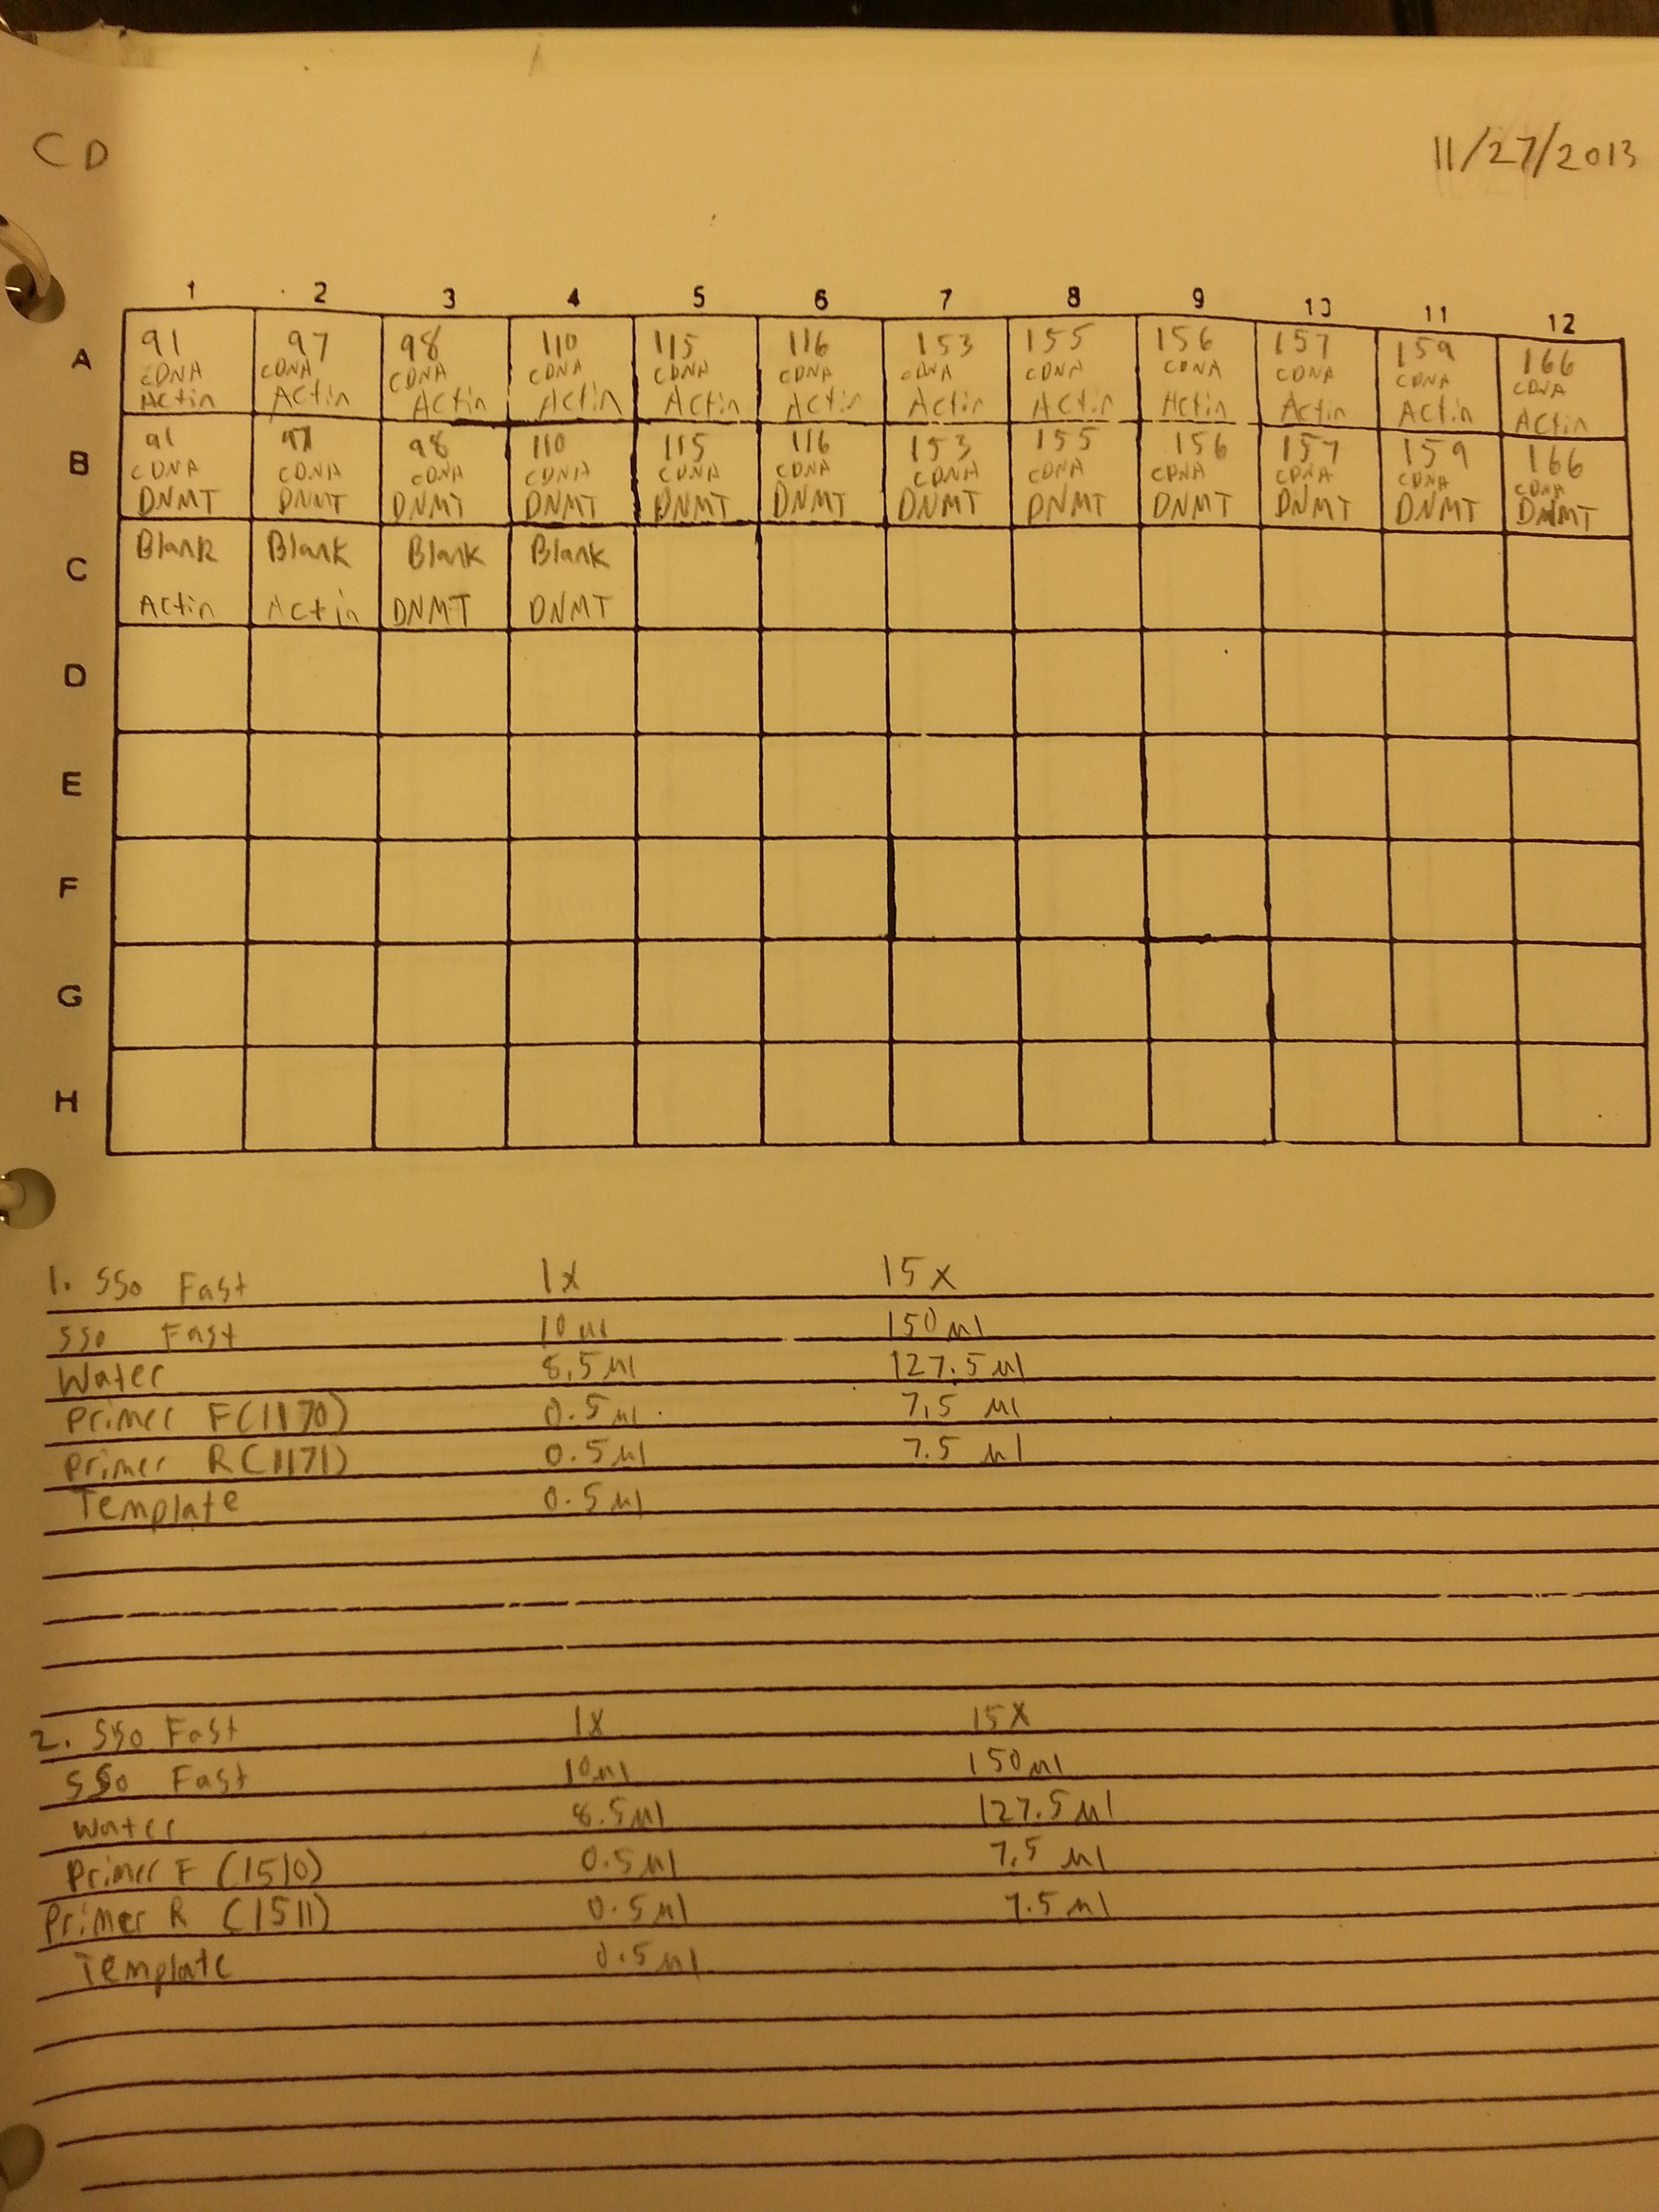
A qPCR of the 12 cDNA samples from 11/6/13 was done again using both Actin and DNMT for a total of 24 samples plus four blanks. This was done in order to produce two sets of replicates for normalizing gene and DNMT. The plate loading order and master mix protocol can be seen here. The results from the qPCR can be seen below and at least one of the blanks appeared to be contaminated.


11/6/13
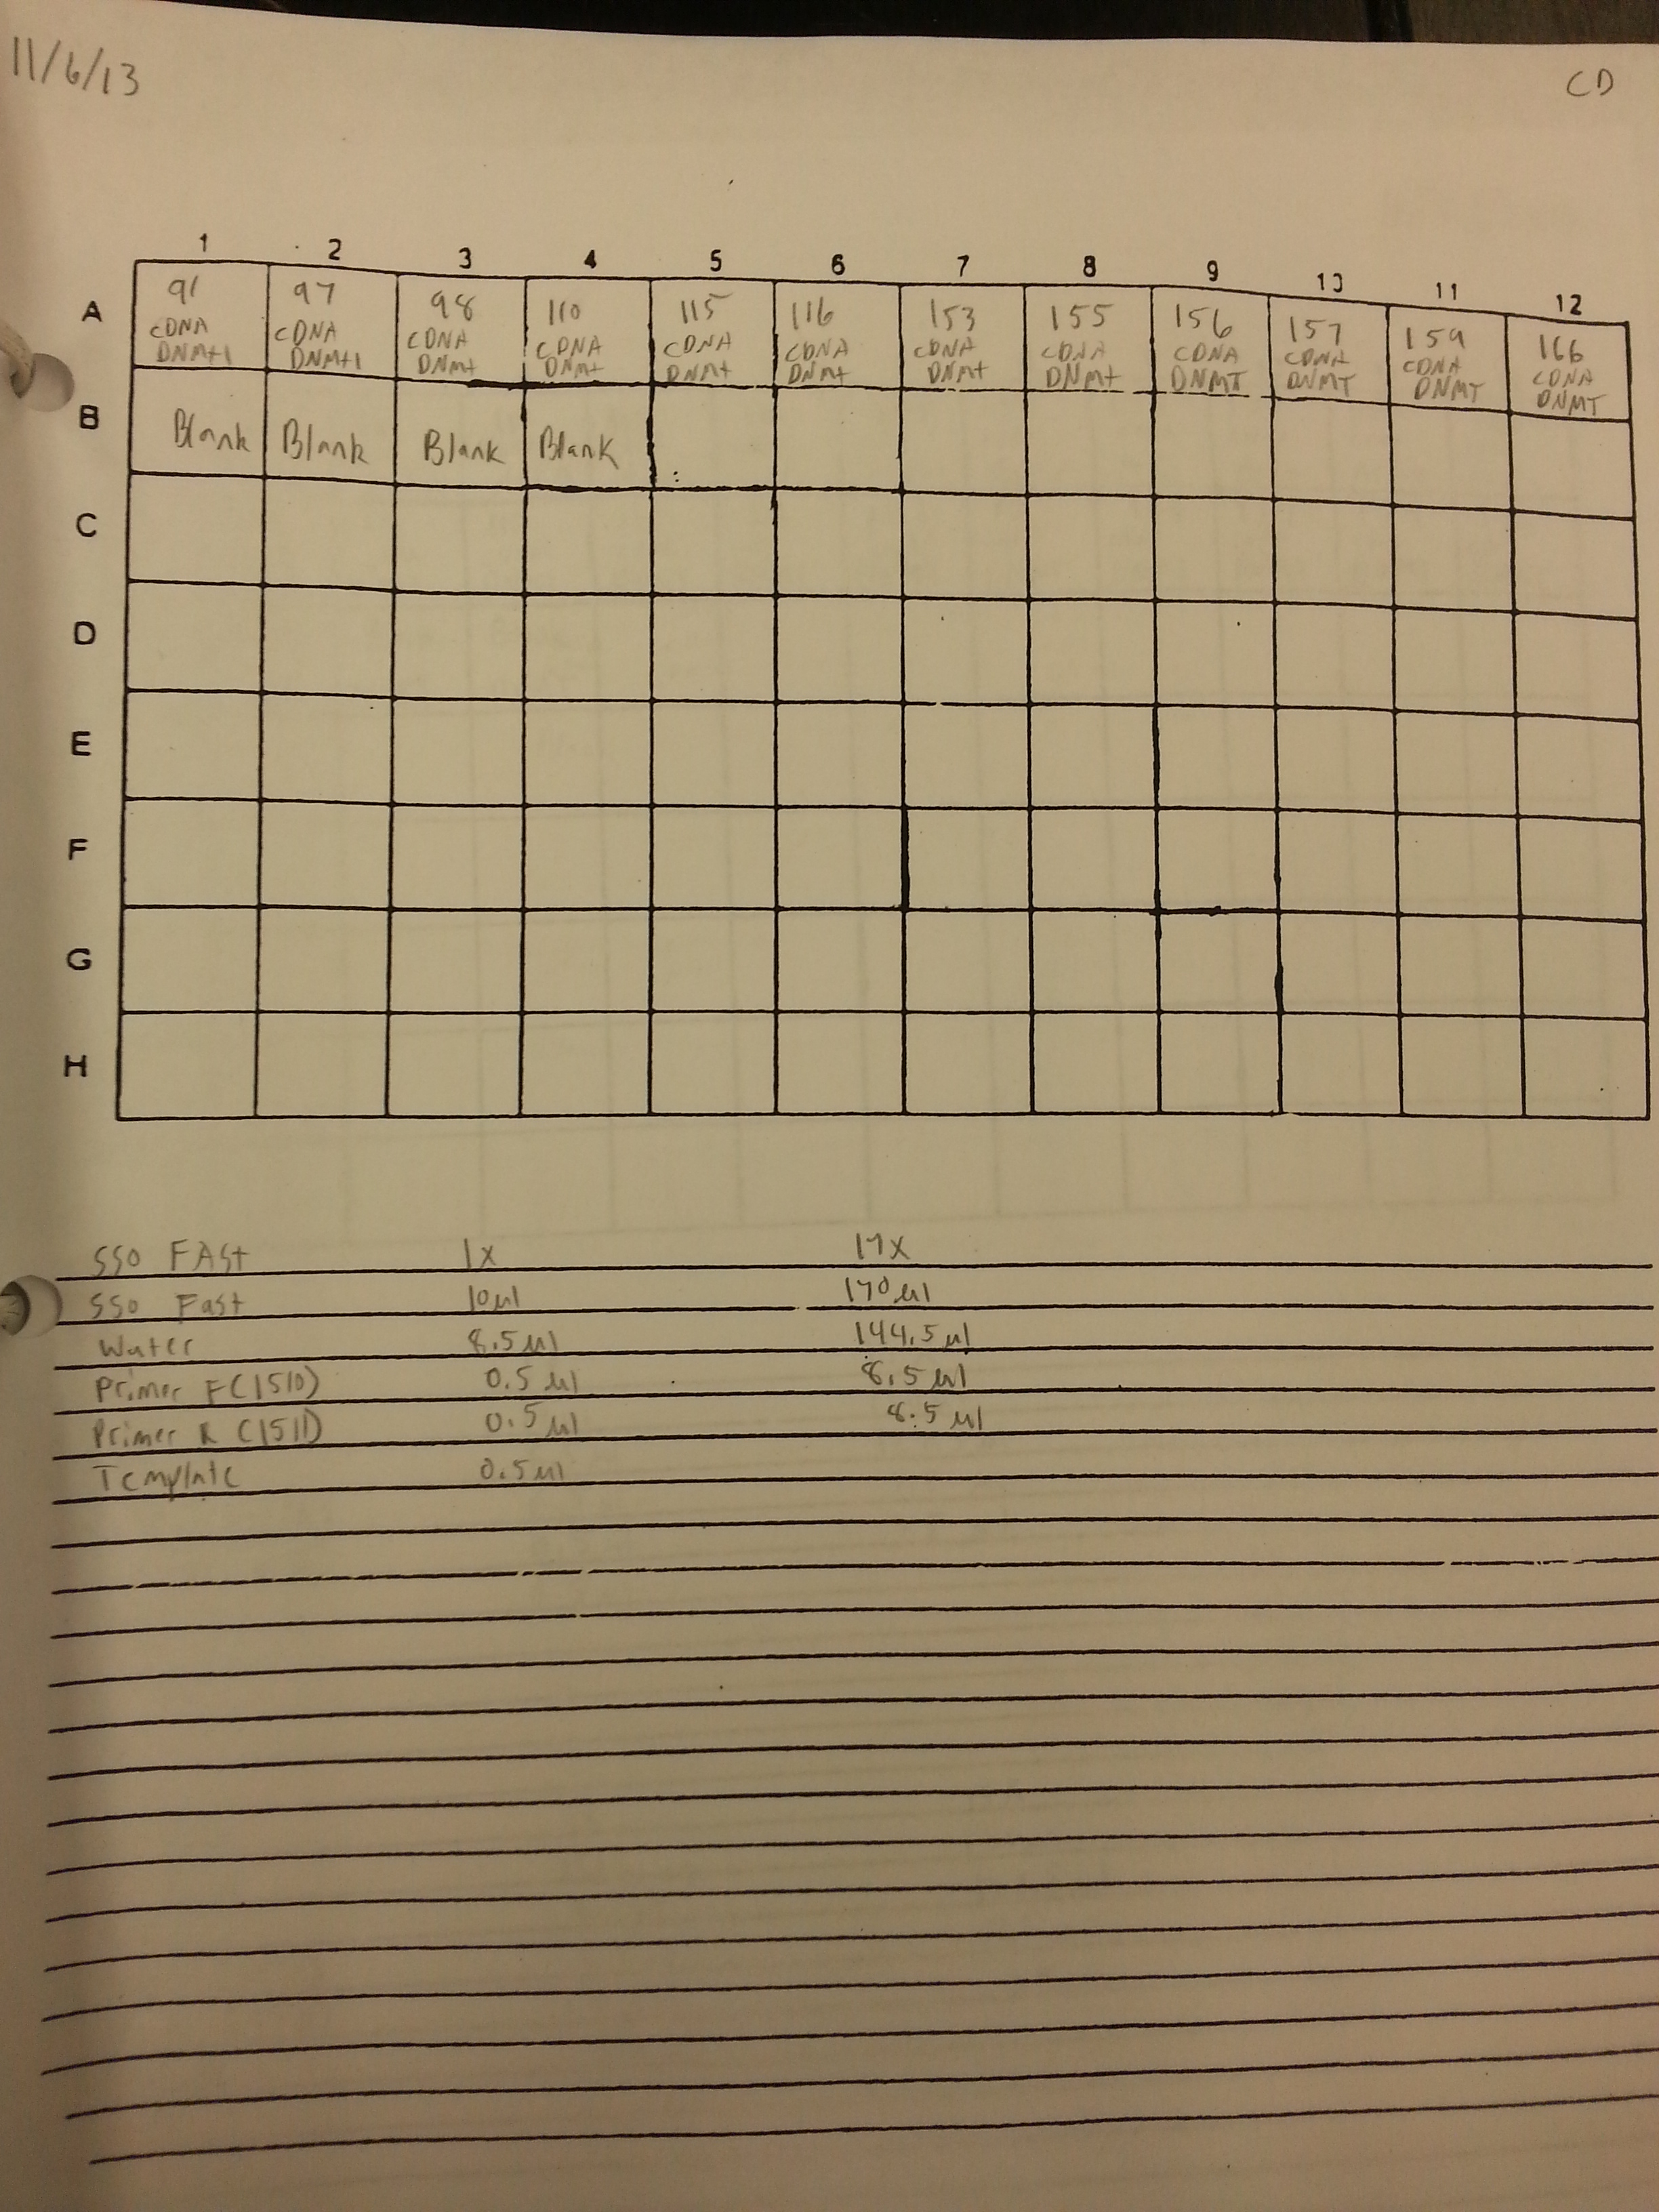
A qPCR of the 12 cDNA samples from 9/23/13 was done using DNMT. The plate loading order and master mix protocol can be seen here. The results from the qPCR can be seen below and the blanks were all clean.


10/9/13
Due to the ongoing problem of contaminated blanks, a qPCR was performed on four blanks in an attempt to get clean blanks. The plate loading order and master mix protocol can be seen here. The results can be seen below and it appears that all the wells were clean.


9/23/2013
A qPCR of all twelve cDNA samples from 9/13/2013 was done to to make sure that the samples amplified. The plate loading order and master mix protocol for the qPCR can be seen here. The results of the qPCR can be seen below.


The cDNA replicated but it appears that the first and third blanks were contaminated while the second and fourth blanks were clean.
9/13/2013
The RNA samples from 9/9/2013 were nano dropped and then were used to make cDNA following the Reverse Transcription (Promega M-MLV Protocol) found here. The results of the nano drop can be seen below.

The actual amount of RNA that was used per reaction was 1.0 ug and the actual volumes of RNA used in each reaction can be seen below.
| Sample |
Volume (uL) |
| 91 |
8.24 |
| 97 |
5.76 |
| 98 |
7.16 |
| 110 |
8.70 |
| 115 |
8.86 |
| 116 |
5.78 |
| 153 |
4.20 |
| 155 |
6.61 |
| 156 |
8.93 |
| 157 |
8.46 |
| 159 |
5.50 |
| 166 |
6.15 |
The RNA samples that were DNAsed on 9/4/2013 were ran on a qPCR to check for DNA contamination. The plate loading order and master mix protocol can be seen here. The results of the qPCR can be seen below. The qPCR results look good since only the cDNA was amplified while the blanks and RNA samples all appeared to be clean.


9/4/2013
The RNA samples that were isolated on 8/29/2013 and 8/14/2013 were DNAsed following the protocol from 7/31/2013. The samples that were DNAsed were 91, 97, 98, 110, 115, 116, 153, 155, 159, 156, 157, and 166.
8/29/2013
Another RNA isolation was done using six more samples from Mac's 500 ng/L EE2 day 35 C. gigas oysters. Three control samples (110, 115, and 116) and three experimental samples (156, 157, and 166) were used. The tissue samples that were used were all female gonad samples. The protocol that was used for RNA isolation can seen here and the actual amount of tissue used in the extraction can be seen below.
110= 54.9 mg
115= 56.8 mg
116= 53.5 mg
156= 62.3 mg
157= 57.7 mg
166= 60.0 mg
Once RNA isolation had been completed, the samples were nano dropped which can be seen below.

8/14/2013
RNA was isolated using six samples from Mac's 500 ng/L EE2 day 35 C. gigas oysters. Three control samples (91, 97, and 98) and three experimental samples (153, 155, and 159) were used. The tissue samples that were used were all female gonad samples. The protocol that was used for RNA isolation can seen here and the actual amount of tissue used in the extraction can be seen below.
91= 66.9 mg
97= 58.5 mg
98= 83.5 mg
153= 59.9 mg
155= 63.2 mg
159= 74.5 mg
Once RNA isolation had been completed, the samples were nano dropped which can be seen below.

8/12/2013
Due to the ongoing problem of contaminated blanks, a qPCR was performed on four blanks in an attempt to get clean blanks. plate loading order and master mix protocol can be seen here. The results can be seen below and it appears that the first and third wells were contaminated while the second and fourth wells were clean.


The DNAsed RNA from 8/8/2013 was then used to make cDNA using the Reverse Transcription (Promega M-MLV Protocol) found here. The amount of RNA that was used was 0.791 ug and the actual volumes that were used can be seen below.
Male Control
15.38 ul of RNA
2.37 ul H2O
0.5 ul of primer
Female Control
17.75 ul of RNA
0 ul of H2O
0.5 ul of primer
8/8/2013
The male and female control RNA samples that were isolated on 8/7/2013 were DNAsed following the protocol from 7/31/2013. Once the samples had been DNAsed, they were tested for DNA using qPCR. The plate loading order and master mix protocol can be seen here. The results for the qPCR can be seen below. It appears that DNAsing worked since the RNA didn't contain any DNA but 3 out of 4 blanks look like they are contaminated.


8/7/2013
An RNA isolation was performed on control male and female C. gigas gonad tissue from Mac's 40C heat shocked box from 10/23/12. The protocol that was used for the RNA isolation can be seen here. In step 2, chloroform was used and in step 5 water was used to dissolve the RNA pellet. Once the RNA isolation was complete, both the male and female RNA samples were nano dropped. The female RNA sample (F) had to be diluted to 1/10 its extracted concentration (FNew). The results of the nano drop can be seen below with M (black) and FNew (red) being the plotted and saved samples.


7/31/2013
Claire's FISH 441 RNA samples were nano dropped and DNAsed again following the protocol from 7/24/2013. The DNAsed RNA samples were then tested for genomic DNA via qPCR. The plate loading setup and master mix protocol can be seen here. The results of the qPCR can be seen below.


7/29/2013
The qPCR results from 7/24/2013 were analyzed and can be seen below. The blanks still showed contamination despite using new reagents and filling/capping the blank wells prior to DNA/RNA being taken out. The next step will be to run a qPCR on four blank samples to see if they replicate anything.


The master mix protocol and plate load order for the qPCR of four blanks can be seen here. The results from the qPCR of the blanks can be seen below. The the first two blanks were clean but the third and fourth blanks appear to be replicating something. A qPCR of the four blanks will be repeated again in an attempt to get clean blanks.


7/24/2013
The qPCR results from 7/22/2013 were analyzed and the results can be seen below. Both blanks appear to be replicating something again so this qPCR is going to be redone using new reagents since it appears something may be contaminated.


In an attempt to troubleshoot the contaminated blanks and genomic DNA in the DNAsed RNA, the DNAsing of Claire's FISH 441 samples and the qPCR from 7/22/2013 was repeated using new reagents. The plate loading order and master mix protocol can be found here. The DNAse protocol was the same used on 7/22/2013 but the amount of RNA used in each reaction was divided in half the amount of water was increased by the difference so that the total volume was still 50 uL. This yielded 5 ug of RNA per 50 uL reaction.
7/22/2013
The qPCR results from 7/18/2013 were analyzed and can be seen below. Both blanks appear to be replicating something again and it appears that the first blank may be contaminated.


Claire's RNA samples from FISH 441 extracted on 11/13/12 were DNAsed so that clean cDNA samples could be made for the suc it box. The samples that were DNAsed were 41, 43, 48, 11, 12, and 13 using 10 ug of RNA per 50 uL reaction. The DNAse protocol that was used can be found here .
DNAse Protocol
Sample 41
1 uL Turbo DNAse
16.3 uL of RNA
27.7 uL of H2O
5 uL of DNAse Buffer
5 uL of Inactivation Reagent
Sample 43
1 uL Turbo DNAse
11.6 uL of RNA
32.4 uL of H2O
5 uL of DNAse Buffer
5 uL of Inactivation Reagent
Sample 48
1 uL Turbo DNAse
15 uL of RNA
29 uL of H2O
5 uL of DNAse Buffer
5 uL of Inactivation Reagent
Sample 11
1 uL Turbo DNAse
24.6 uL of RNA
19.4 uL of H2O
5 uL of DNAse Buffer
5 uL of Inactivation Reagent
Sample 12
1 uL Turbo DNAse
9.64 uL of RNA
34.4 uL of H2O
5 uL of DNAse Buffer
5 uL of Inactivation Reagent
Sample 13
1 uL Turbo DNAse
11.3 uL of RNA
32.7 uL of H2O
5 uL of DNAse Buffer
5 uL of Inactivation Reagent
A qPCR of the DNAsed RNA sample was then done to check for DNA contamination. Due to previous problems with EF1K, the primers that were used were actin 1170 and 1171. The loading plate setup and master mix protocol for the qPCR can be seen here. Two samples of cDNA and two blanks were also used in this qPCR as a positive and negative control.
7/18/2013
The qPCR results from 7/15/2013 were analyzed and can be seen below. The first image is the quantification graph and the second is the melt graph. This time both of the blanks appeared to be replicating something.


A qPCR using Emma's samples from 7/12/12 was then done using the EF1K primer. Six individuals (1,4, 7, 10, 13, 16) from the 2800 uatm group and six individuals (217, 220, 223, 226, 229, 232) from the 400 uatm group were used in this qPCR.The plate loading order and master mix protocol can be seen here.
7/15/2013
The qPCR results from 7/10/2013 were analyzed and can be seen below. The first image is the quantification graph and the second is the melt graph. It was found that some of the cDNA samples from the suc it box appear to be contaminated with gDNA as they had a visible peak in the gDNA spectrum. One of the blanks also appeared to be replicating something.


A second qPCR was then done using the EF1K primers 1413 and 1412 as well as gill cDNA and cDNA35 from the suc it box. The plate loading order and master mix protocol can be seen here.
7/10/2013
The PCR of C. gigas gDNA from the suc it box done yesterday was ran on a gel. The samples appear to be the correct size which using Geneious was determined to be approximately 323 bp for MAPK, 548 bp for CATA, and 558 bp for CAP.

A qPCR was then done using C. gigas gDNA, cDNA, and heat shocked 35C cDNA from the suc it box. The primers that were used were DNMT 1510 and 1511. The plate loading can be seen here.
Master Mix Protocol:
1 Master Mix for 9 rxns
2x SSo Fast Master mix: 12.5uL x 9 rxn = 112.5 uL
Primer F: 0.5uL x 9 rxn= 4.5 uL
Primer R : 0.5uL x 9 rxn = 4.5 uL
H20: 10.5uL x 9 rxn = 94.5 uL
--> added 24uL of mastermix and 1uL of template to each reaction
7/8/2013
The redo PCR of Parent-17 gDNA from 7/3/2013 was ran on a gel using two DNA sample columns and two blanks. The gel was prepared following the protocol from 7/2/2013. This time the first sample column had a band of DNA while the second did not. The blanks in the third and fourth column were clean as seen below.

Another PCR was done on C. gigas gDNA (from suc it box) using primers MAPK (1531 & 1530), CATA (1527 & 1526), and CAP (1525 & 1524). The annealing temperature was changed from 55C to 50C.
Master Mix Protocol:
3 Master Mixes with 5 samples each
2x Apex Master mix: 12.5uL x 5 rxn = 62.5uL
Primer F: 0.5uL x 5 rxn= 2.5uL
Primer R : 0.5uL x 5 rxn = 2.5uL
H20: 10.5uL x 5 rxn = 52.5uL
--> added 24uL of mastermix and 1uL of template to each reaction
PCR protocol consisted of:
1) 95 °C for 10 min
2) 95 °C for 30 sec
3) 50 °C for 30 sec
4) 72 °C for 1 min
5) Repeat 2-4, 39 times
6) 72 °C for 10 min
7) 4°C until removed
7/3/2013
A gel was ran using the gDNA from 7/2/2013 which contained two sample and two blank columns. The gel was prepared following the protocol from 7/2/2013. The first sample column on the gel did not have a DNA band while the second column did as seen below. The blanks in the third and fourth column were clean.

The PCR of Parent-17 gDNA from 7/2/2013 was repeated using the same protocol except a master mix was made following the procedure from 6/25/2013 but only 1 μL of DNA/H2O was used instead of 2 μL. The procedure was repeated in an attempt to get a DNA band in both sample columns.
Master Mix Protocol:
1 Master mix with 5 samples
2x Apex Master mix: 12.5uL x 5 rxn = 62.5uL
Primer F (SRID 1510): 0.5uL x 5 rxn= 2.5uL
Primer R (SRID 1512): 0.5uL x 5rxn = 2.5uL
H20: 10.5uL x 5rxn = 52.5uL
--> added 24uL of master mix and 1uL of template to each reaction
PCR protocol consisted of:
1) 95 °C for 10 min
2) 95 °C for 30 sec
3) 55 °C for 30 sec
4) 72 °C for 1 min
5) Repeat 2-4, 39 times
6) 72 °C for 10 min
7) 4°C until removed
Bioinformatics was employed to optimize the primers used on 6/25/2013. The primers were initially designed for cDNA but are now needed for gDNA so the program Geneious was used to compare the distance between the F and R primer sequences in the cDNA with gDNA. If the distance between the two was within ~300 bp then the primers should still work with the gDNA.
1) CGI_10020574
CDS= 317 bp
mRNA= 323 bp
2) CGI_10020574
CDS= 256 bp
mRNA= 1,035 bp
3) CGI_10020574
CDS= 261 bp
mRNA= 548 bp
4) CGI_10020574
CDS= 408 bp
mRNA= 558 bp
5)CGI_10020574
CDS= 527 bp
mRNA= N/A
7/2/2013
The PCR of gigas gill 8 cDNA was ran on a gel resulting in zero bands as seen below.

1) Gel was prepared by adding 0.50 g of agar to 50 mL of TAE Buffer.
2) Heating until solids dissolved and adding 5 μL of ethidium bromide.
3) 5 μL Hyperladder II and 15 μL of DNA/Blank was then loaded into the gel.
4) The gel was run at 100 V for 30 min.
A PCR was then performed using Parent-17 gill tissue gDNA. First a working stock of primer DNMT (1510 & 1511) was made by mixing 90 μL of Nano pure H2O with 10 μL of primer. Components were added to each tube using the proportions shown below for four samples.
2x Apex Master mix: 12.5uL
Primer F (SRID 1510): 0.5uL
Primer R (SRID 1512): 0.5uL
H20: 9.5uL
Template: 2uL
PCR protocol consisted of:
1) 95 °C for 10 min
2) 95 °C for 30 sec
3) 55 °C for 30 sec
4) 72 °C for 1 min
5) Repeat 2-4, 39 times
6) 72 °C for 10 min
7) 4°C until removed
6/28/2013
PCR samples from 6/25/2013 were ran on a gel which resulted in zero bands . Emma's sheared DNA samples were also ran on this gel and can be seen below.

.jpeg)
1) Gel was prepared by adding 2 g of agar to 200 mL of TAE Buffer.
2) Heating until solids dissolved and adding 20 μL of ethidium bromide.
3) 5 μL Hyperladder II and 25 μL of DNA/Blank was then loaded into the gel.
4) The gel was run at 95 V for 30 min.
PCR was then performed on cDNA sample gigas gill 8. The F and R primers that were used were EF1K.
Protocol for sample and Blank:
2x Apex Master mix: 12.5uL
Primer F: 0.5uL
Primer R : 0.5uL
H20: 9.5uL
Template: 2uL
The PCR program consisted of:
1) 94 °C for 2 min
2) 94 °C for 15 sec
3) 55 °C for 15 sec
4) 68 °C for 30 sec
5) Repeat 2-4, 26 times
6) 68 °C for 5 min
7) End
6/25/2013
DNA was extracted from Pacific Oysters tissue samples LC-082009-16 and BB-081809-01 using DNAzol.
Procedure:
1) 50 mg of tissue from sample LC and 30 mg of tissue from BB were placed in separate microfuge tubes with 1 mL of DNAzol and homogenized using a pestle.
2) Samples were incubated at 25 C for 5 min then centrifuged at 25 C for ten min at 10,000 g.
3) Supernatant was transferred to a new tube and DNA was precipitated by adding 0.5 mL of 100% ethanol, inverting, and incubating at 25C for 3 min.
4) Centrifuge at 2,000 g for 5 min at 25 C then remove supernatant.
5) Wash DNA pellet 2x using 75% ethanol, inverting tube 6 time, centrifuging sample for 5 min at 2,000 g at 25 C.
6) Remove supernatant and centrifuge sample for 2 min at 1,000 g at 25 C.
7) Add 200 mL of Nano pure H2O then store sample at 25 C for 25 min.
8) DNA was quantified using a Nanodrop spectrophotometer which showed:
LC-082009-16: 35.1 ng/μL and 260/280 =1.92
BB-081809-01: 156.8 ng/μL and 260/280 =1.86
Prepared master mix and ran a PCR using DNA from samples LC-082009-16 and BB-081809-01. Working stock of F and R primers were prepared by mixing 20 μL of primer with 180 μL of Nano pure H2O. Primers that were used were MAPK (1531 & 1530), CATHB (1528 & 1529), CATA (1527 & 1526), CAP (1525 & 1524), and SOD (1523 & 1522).
Master Mix Protocol:
Made 5 Master mixes with 3 samples each
2x Apex Master mix: 12.5uL x 3 rxn = 37.5uL
Primer F: 0.5uL x 3 rxn= 1.5uL
Primer R: 0.5uL x 3 rxn = 1.5uL
H20: 9.5uL x 5rxn = 28.5uL
--> added 23uL of master mix and 2uL of template to each reaction
PCR protocol consisted of:
1) 95 °C for 10 min
2) 95 °C for 15 sec
3) 55 °C for 15 sec
4) 72 °C for 15 sec
5) Repeat 2-4, 39 times
6) 72 °C for 10 min
7) 4°C until removed